
Features
- 7 Unique slides
- Fully editable and easy to edit in Microsoft Powerpoint, Keynote and Google Slides
- 16:9 widescreen layout
- Clean and professional designs
- Export to JPG, PDF or send by email


Do you have any questions?
Recommend


6 slides
Company Profile Growth Infographic
The collection of templates presented offers a valuable resource for businesses aiming to articulate their growth and current market standing comprehensively. These templates are designed to deliver essential information through a well-structured and visually appealing format, ideal for engaging stakeholders effectively. Each design is tailored to showcase various aspects of company progress, including detailed financial growth, strategic direction, and key achievements. Features such as timelines, growth charts, and key performance indicators are seamlessly integrated, providing a clear snapshot of the company's journey and ambitions. The templates are adaptable to various corporate needs, making them suitable for annual reports, investor presentations, and internal reviews across different industries. The chosen color schemes and layouts ensure that information is presented clearly and attractively, enhancing readability and projecting a professional corporate image. By facilitating customization to reflect the unique characteristics of any business, these templates serve as indispensable tools for companies eager to communicate their success stories and future prospects in a compelling manner.


3 slides
Company Vision Roadmap Presentation
Bring your future story to life with a clear, inspiring layout that guides viewers through your long-term direction and strategic milestones. This presentation helps teams communicate purpose, goals, and planned progress in a simple, structured format that’s easy to follow. Compatible with PowerPoint, Keynote, and Google Slides.


19 slides
Fableia Marketing Research Report Presentation
Deliver data-driven insights with a professional and visually engaging marketing research report presentation. This template is tailored for marketing professionals, agencies, and businesses looking to showcase research findings with precision and clarity. Highlight key sections such as market trends, consumer behavior analysis, and campaign performance using dynamic visuals and well-structured layouts. Share your insights on emerging technologies, social media strategies, and customer targeting with easy-to-edit graphs, charts, and infographics. Use dedicated slides for SEO analytics, value propositions, and recommendations to present actionable strategies that resonate with your audience. This template is fully customizable and works seamlessly with PowerPoint, Google Slides, and Keynote, ensuring you can adapt it to your unique needs. Present your research with confidence and leave a lasting impact on stakeholders and decision-makers.


4 slides
Identifying Performance Gaps
Clearly showcase the steps needed to bridge critical performance gaps with this modern template. Ideal for strategic planning, business reviews, and goal-setting sessions. Highlight each stage of growth with dynamic visuals. Fully customizable for PowerPoint, Keynote, and Google Slides.


5 slides
Risk Coverage and Claims Process Presentation
Visualize your risk levels and claims procedures with this Risk Coverage and Claims Process slide. The thermometer-style graphic clearly represents stages of coverage or escalation. Ideal for insurance, compliance, or legal teams. Fully editable and compatible with PowerPoint, Keynote, and Google Slides to match your branding and workflow needs.


4 slides
Digital Marketing and SEO Best Practices Presentation
Communicate your digital strategy with this clean and structured visual layout. This template features a horizontal flowchart design with four circular icons branching from a central infographic, allowing you to showcase core areas such as audience targeting, content creation, performance analytics, and ranking improvement. Ideal for marketers, consultants, and SEO professionals. Fully editable in PowerPoint, Keynote, and Google Slides.


22 slides
Shield Digital Agency Strategy Plan Presentation
Embark on a journey to elevate your digital agency with this comprehensive and sleek presentation template! Perfect for showcasing your agency’s strengths, strategies, and successes, this template covers everything from market analysis to client testimonials. It’s designed to make your agency’s strategy plan stand out. Compatible with PowerPoint, Keynote, and Google Slides for seamless use.

21 slides
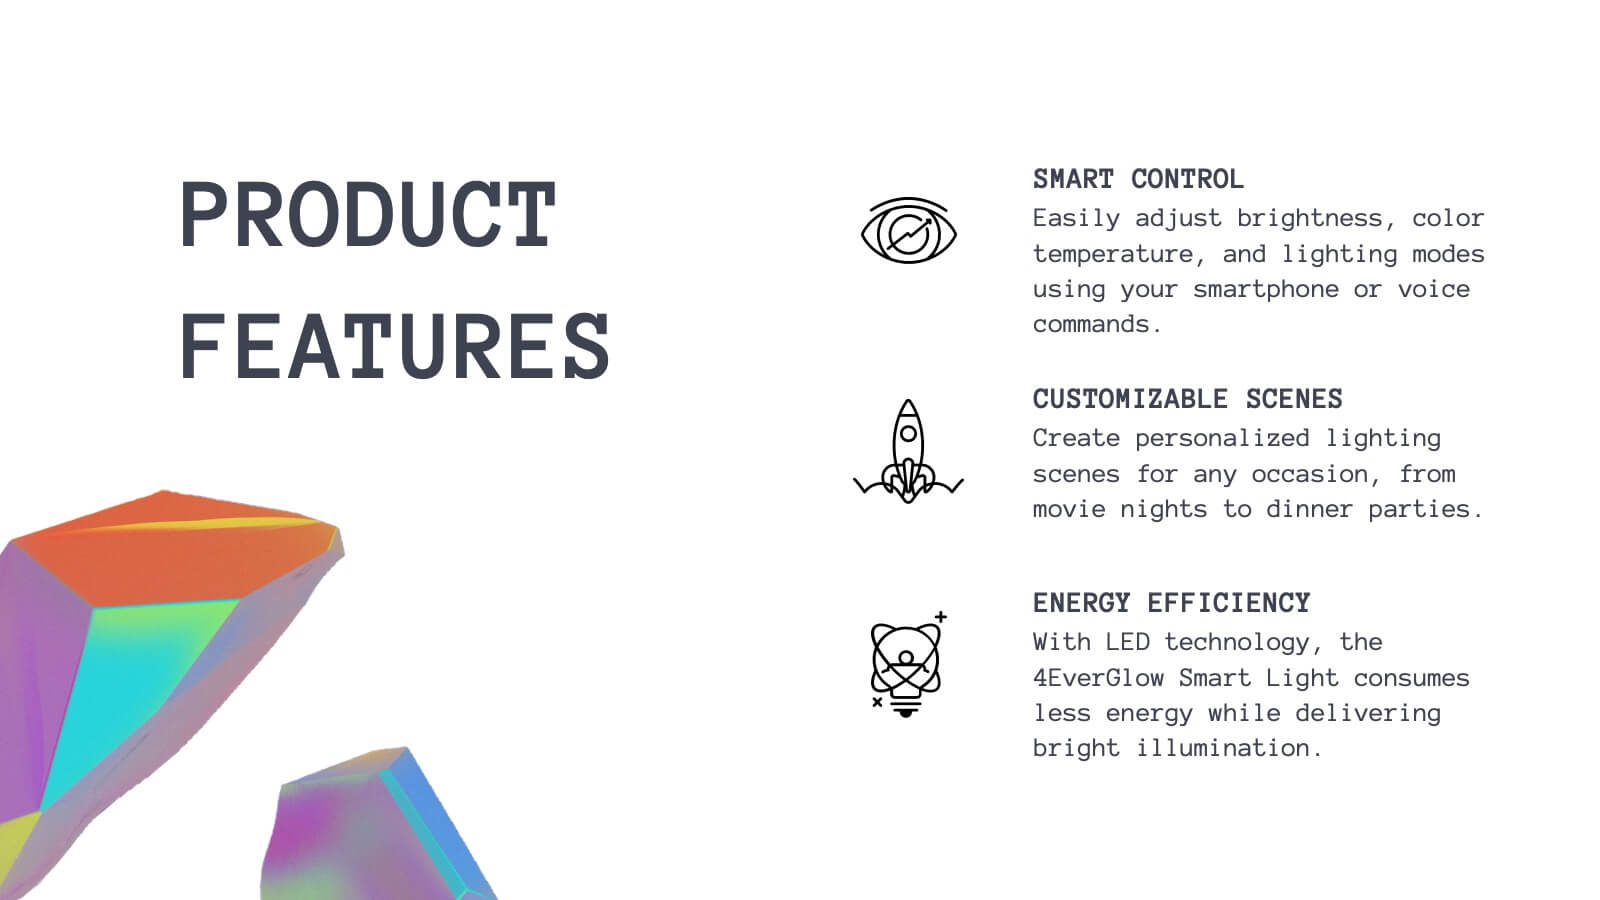
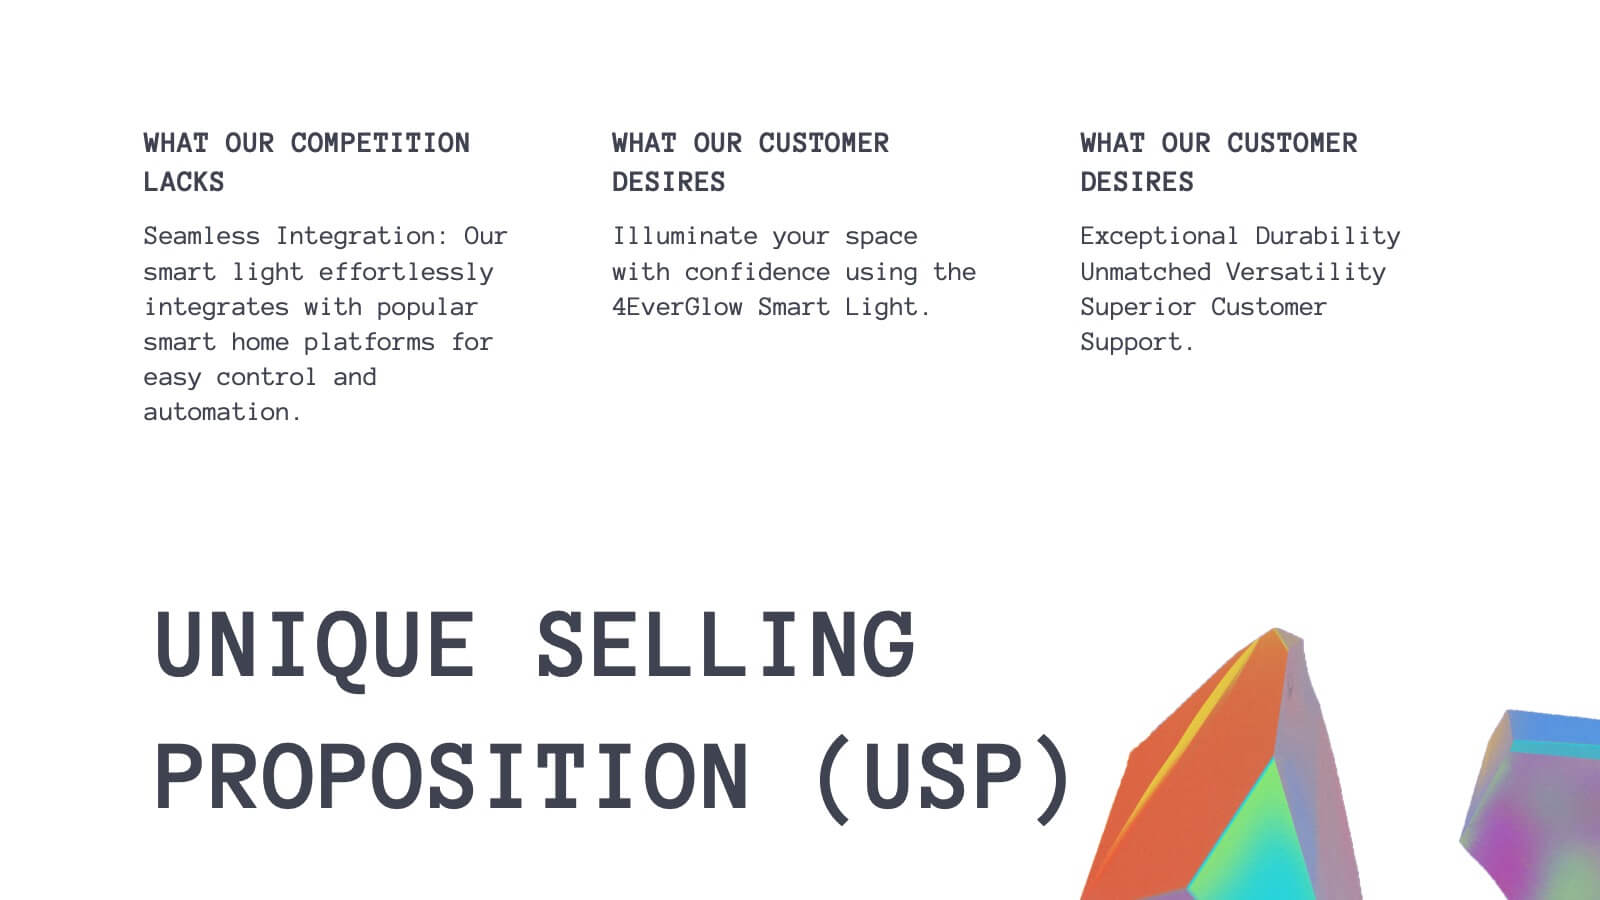
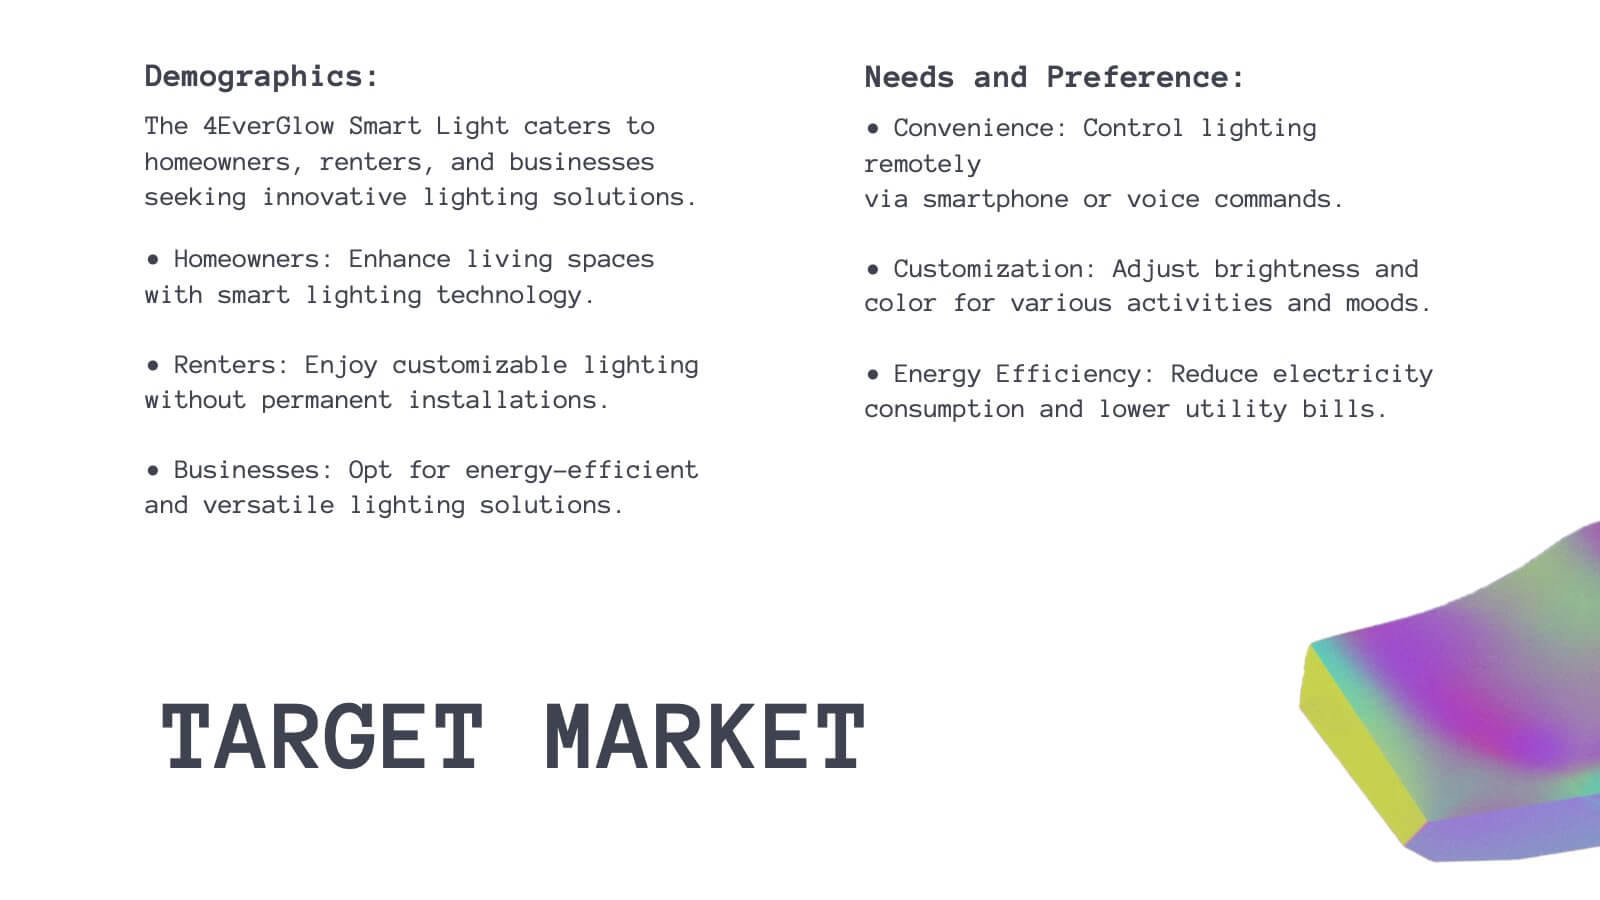
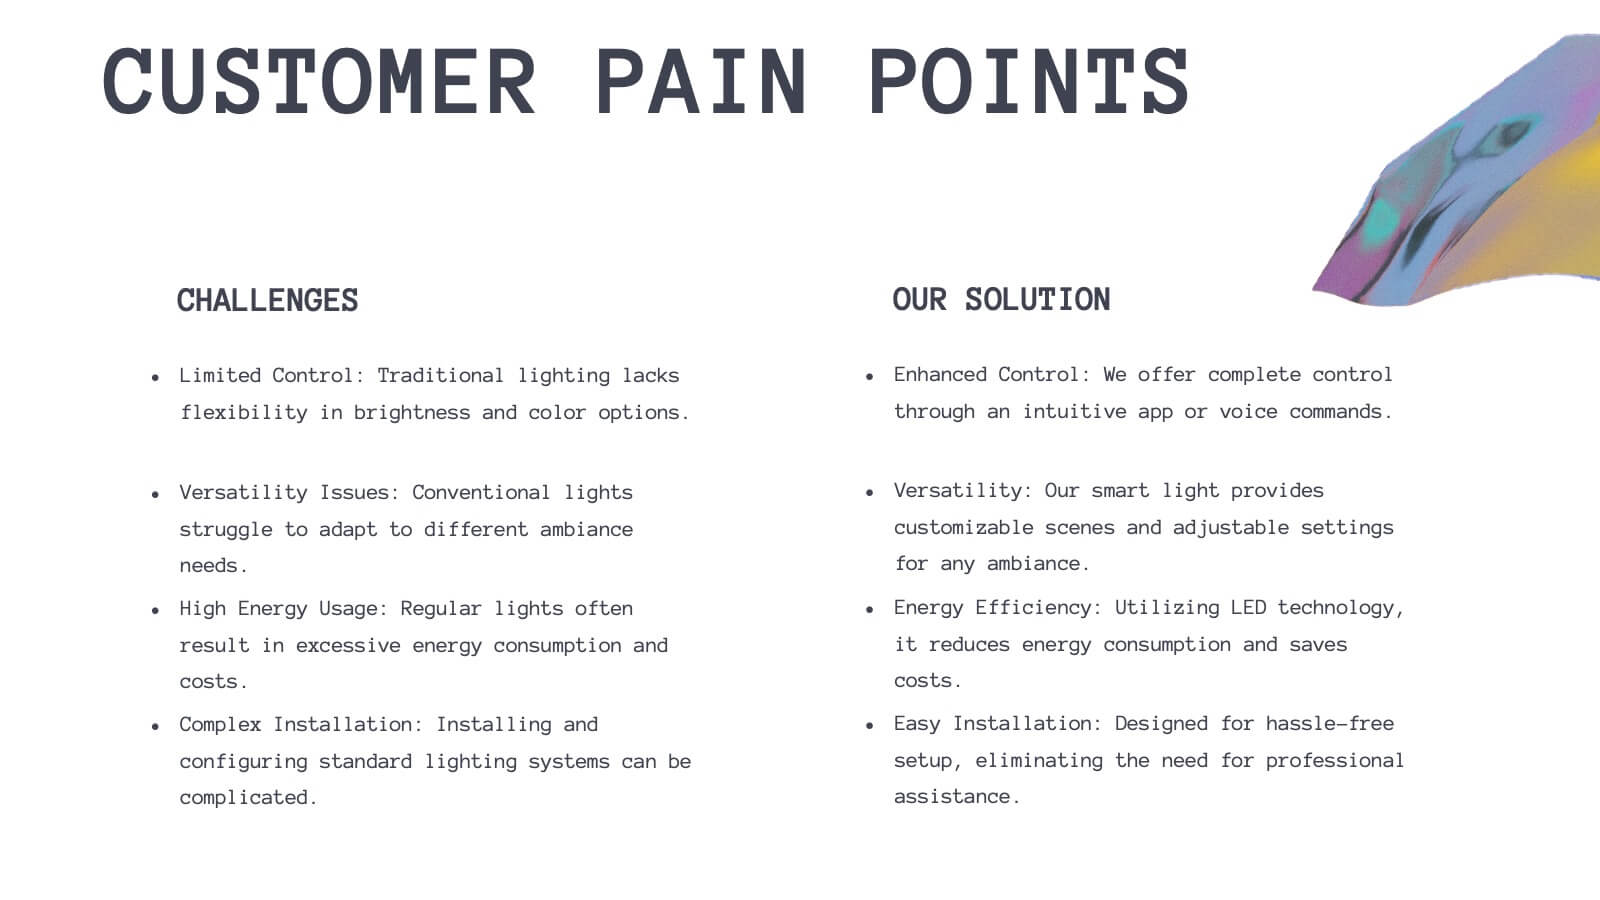
Luster Product Roadmap Presentation
Bring your product journey to life with this vibrant, modern presentation template! Perfect for guiding your audience through product features, customer pain points, and competitive analysis, it’s designed for maximum clarity and engagement. Whether you’re showcasing technical specs or marketing strategies, this template fits all your needs. Compatible with PowerPoint, Keynote, and Google Slides.


20 slides
Moonfern Product Launch Presentation
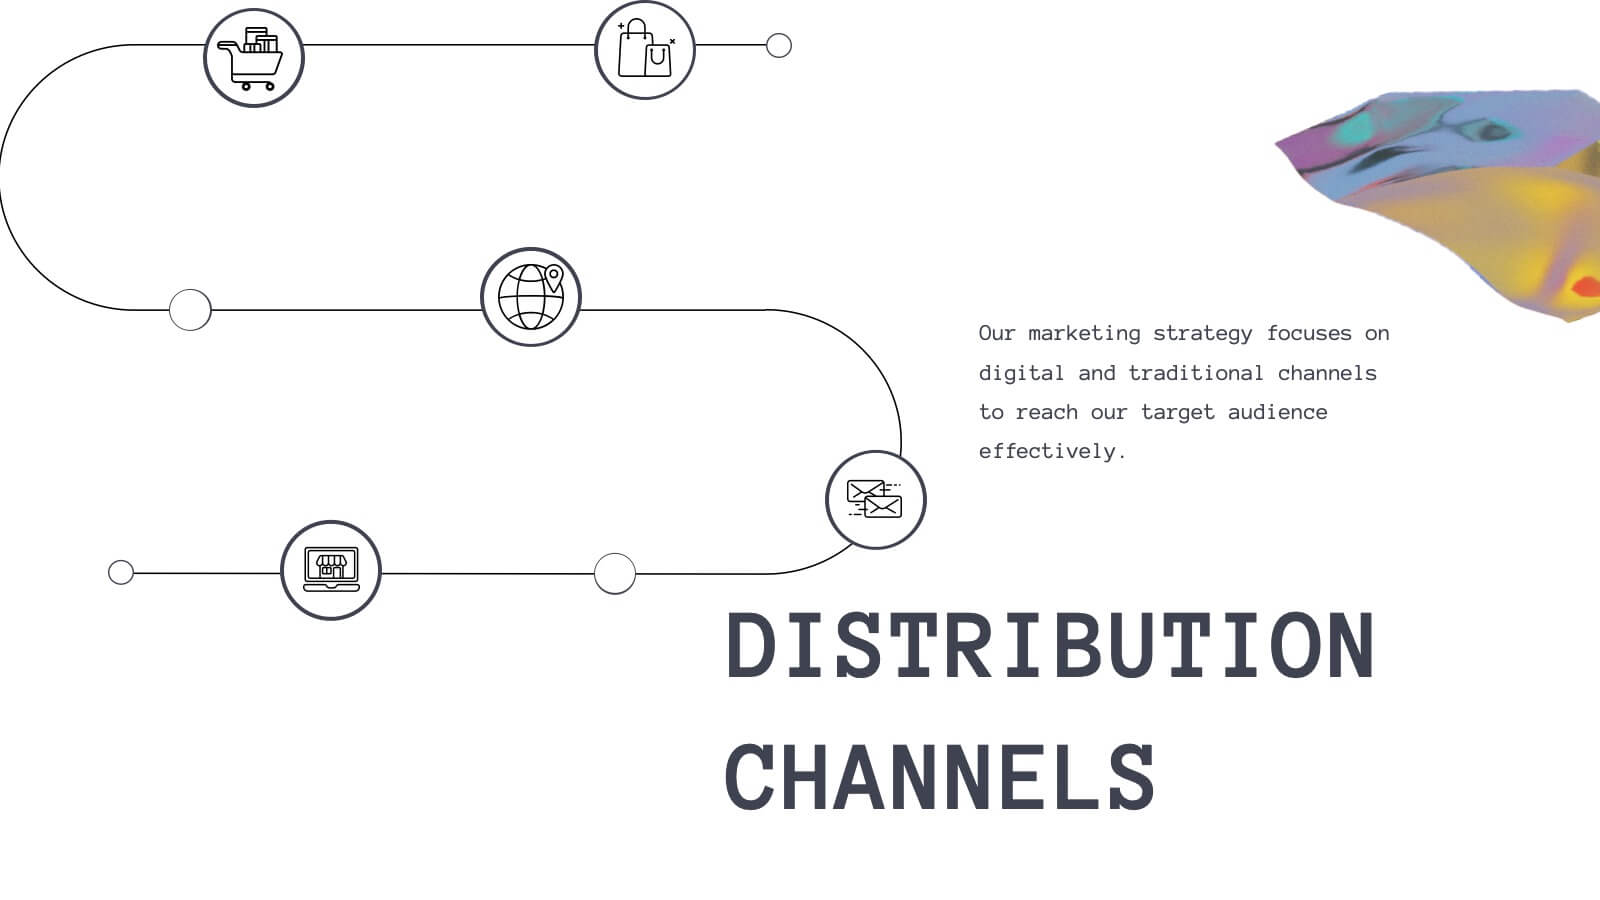
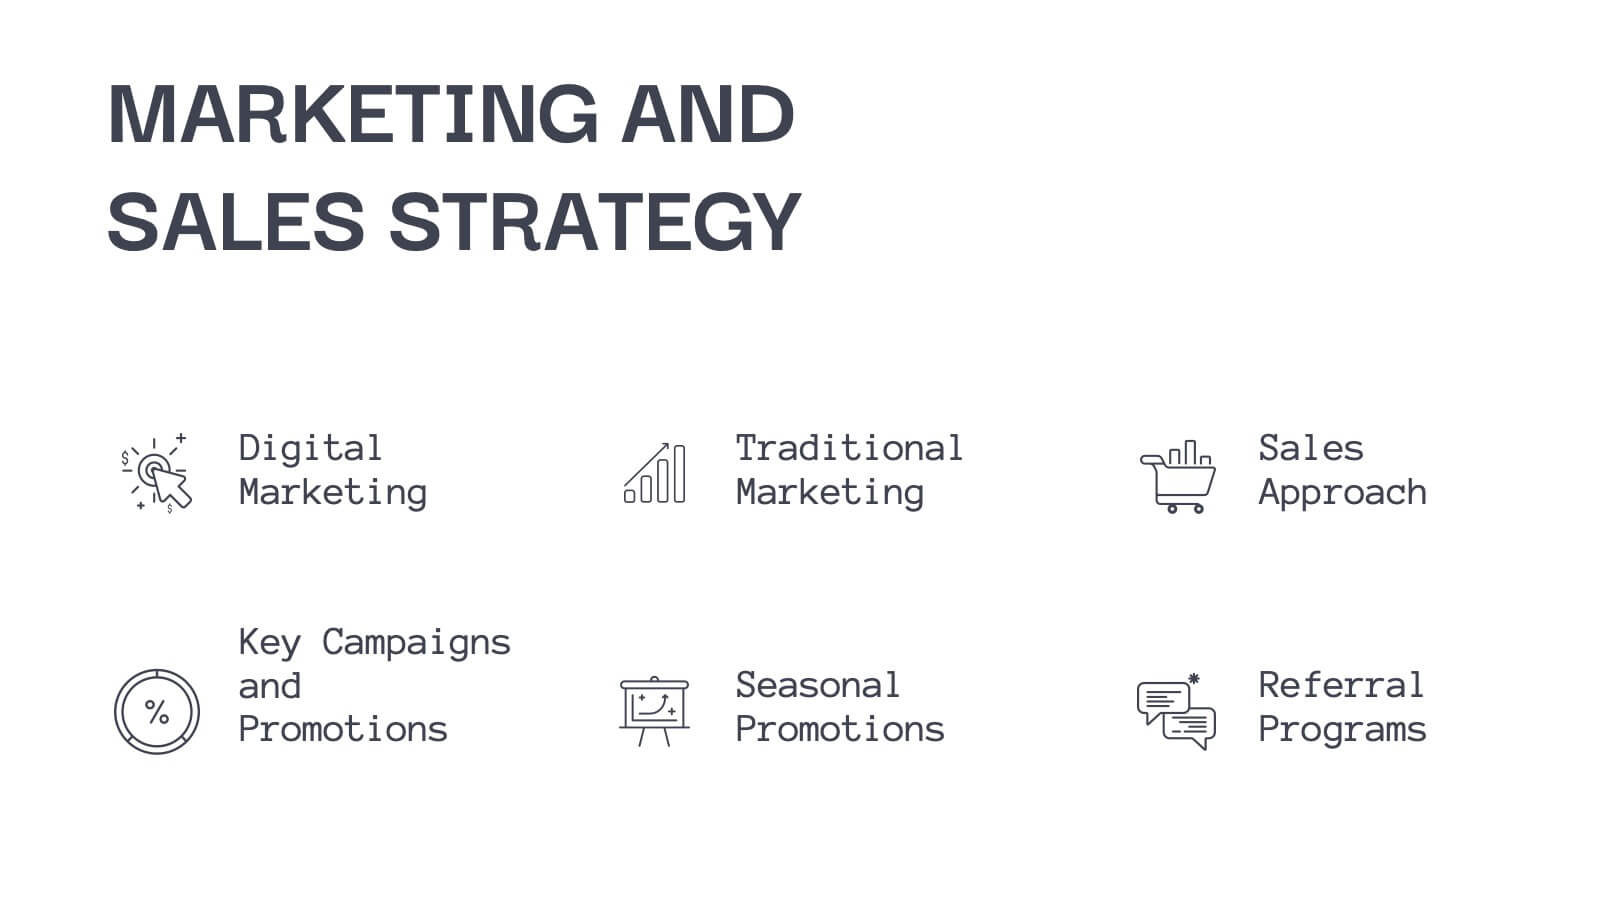
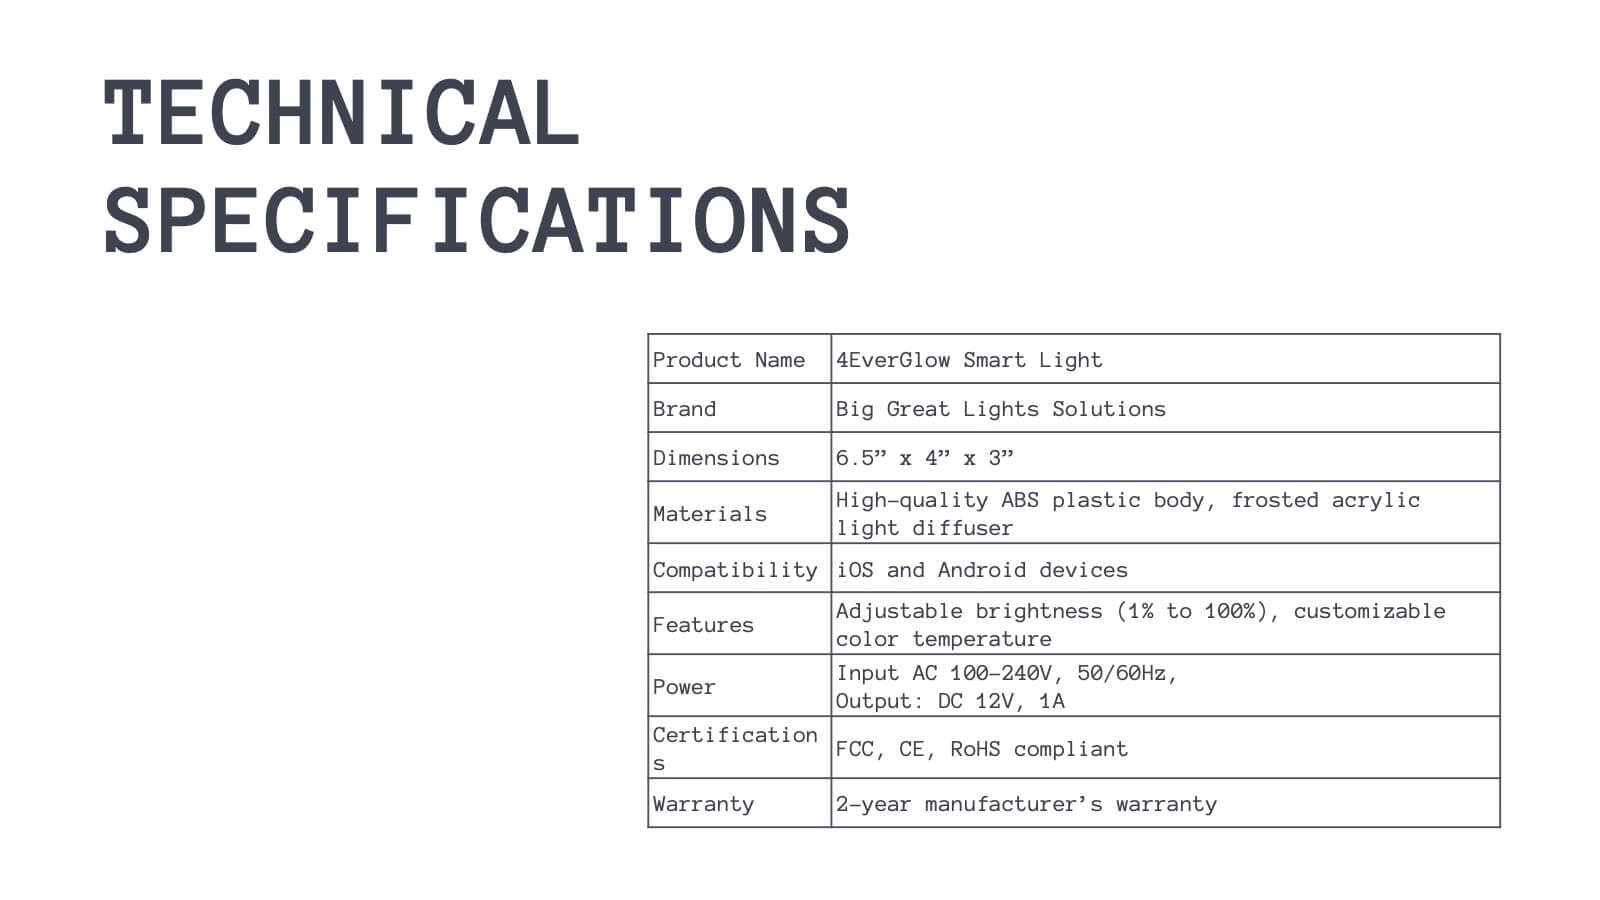
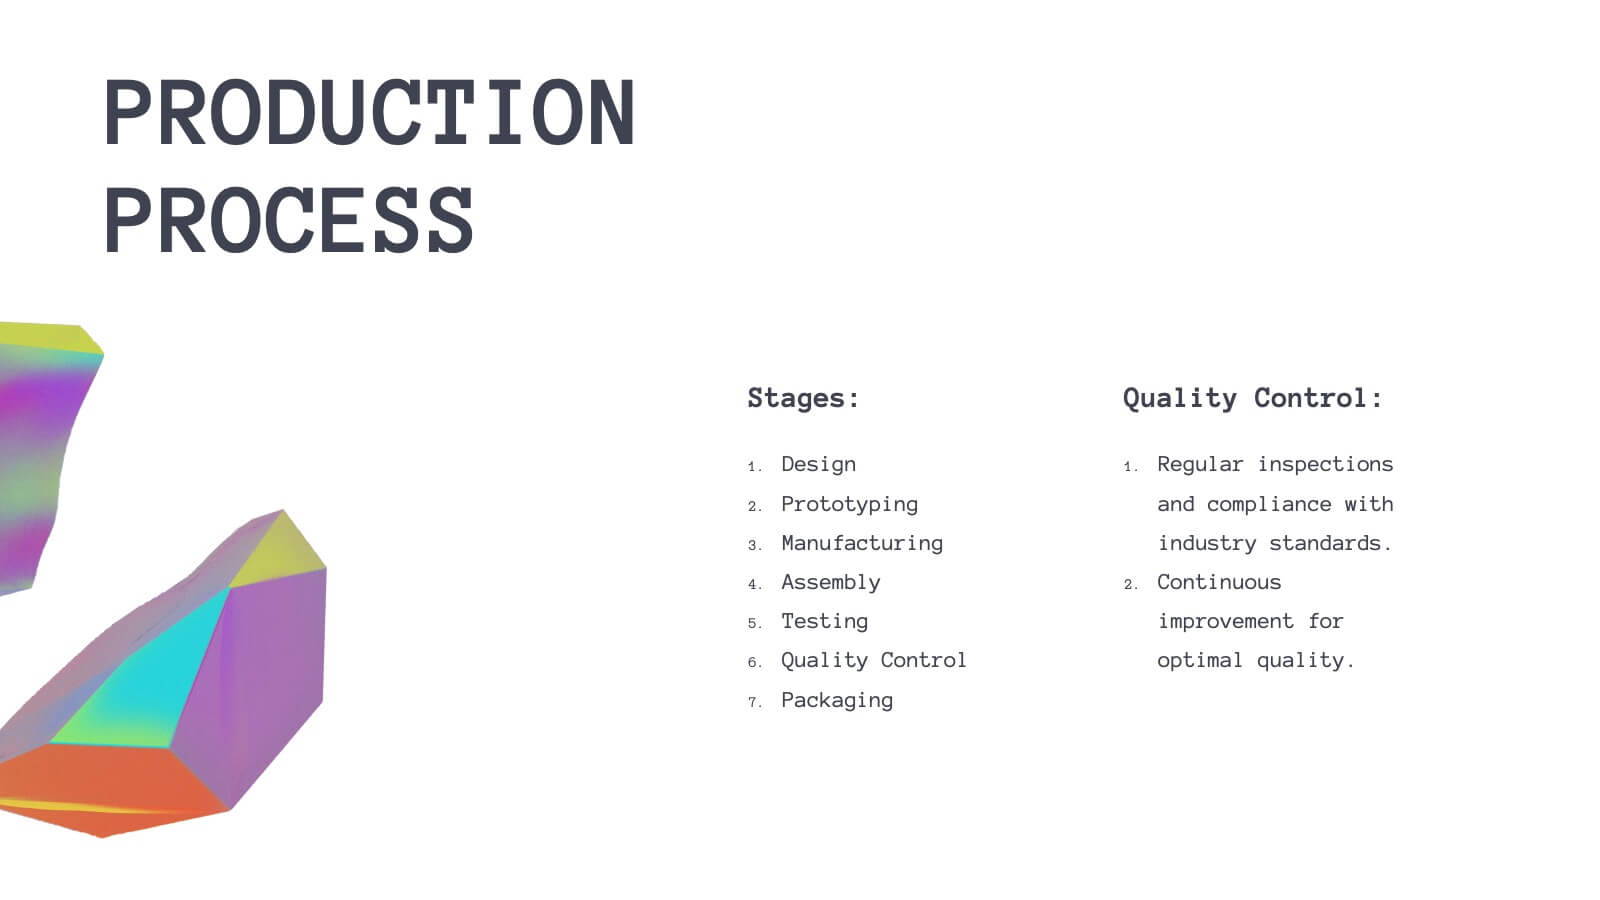
Introduce your product to the market with confidence using this expertly designed presentation template. Featuring a sleek and modern layout, it covers essential sections such as product overview, target market, and unique selling proposition. Dive into product features, pricing strategy, and competitive analysis to effectively communicate value and strategy. The template also includes slides for marketing plans, distribution channels, and use cases, ensuring a comprehensive approach to your launch. Perfect for PowerPoint, Google Slides, and Keynote, it allows for easy customization, ensuring your presentation aligns seamlessly with your branding and goals.


8 slides
Simplified Step-by-Step Process Plan Presentation
Break complex workflows into clear, manageable steps with the Simplified Step-by-Step Process Plan Presentation. Designed with a clean vertical timeline and alternating flag-style indicators, this template guides viewers through four distinct phases—ideal for process explanations, onboarding flows, or project milestones. Each step features a matching icon and space for concise descriptions to keep your message clear and structured. Fully editable in PowerPoint, Keynote, and Google Slides.


5 slides
Climate Change Impacts Infographics
Climate Change refers to long-term shifts in temperature, precipitation patterns, wind patterns, and other aspects of the Earth's climate system. These infographic templates are perfect to educate and raise awareness about the impacts of climate change on our planet. These templates are suitable for environmental organizations, educators, or anyone seeking to convey the urgency and significance of addressing climate change. The compelling visuals, data-driven content, and clear messaging, in these templates aims to educate and inspire individuals to contribute to global efforts to address climate change and protect our planet's future.


3 slides
Decision-Making Bowtie Framework
Clarify choices and consequences with the Decision-Making Bowtie Framework Presentation. This slide design uses the bowtie model to organize factors before and after a decision, helping audiences visualize causes, potential outcomes, and risk management strategies. Ideal for leadership, business strategy, or operations meetings. Customize each side with key points, contributing factors, and mitigation actions. Includes editable labels, flexible layout options, and is fully compatible with PowerPoint, Keynote, and Google Slides.


6 slides
Student Success and Learning Programs Presentation
Showcase your academic initiatives with the Student Success and Learning Programs Presentation. Ideal for school boards, educators, or program leaders, this slide lets you highlight six key focus areas around student achievement. Fully editable in PowerPoint, Keynote, Google Slides, and Canva—making it easy to tailor to your curriculum goals.


4 slides
Business Information Security Compliance Presentation
Ensure your systems meet security standards with the Business Information Security Compliance presentation slide. Designed with a central cloud and laptop graphic surrounded by icons representing data, user access, encryption, and compliance checks, this layout is perfect for illustrating IT governance, risk management, and data protection protocols. Fully customizable in PowerPoint, Keynote, and Google Slides.


8 slides
Target Demographic Insights
Get a clear view of your audience with the Target Demographic Insights Presentation. This template uses a visual bullseye layout to highlight key demographic data through concentric circles and percentages. Ideal for marketers, brand strategists, or analysts, it helps you communicate audience segmentation and market reach effectively. Fully editable in PowerPoint, Keynote, and Google Slides.


6 slides
Funnel Stages Infographic
In marketing and sales, the term "funnel stages" refers to the different stages or steps that a potential customer goes through in their journey from initial awareness of a product or service to making a purchase decision. These infographics visualize and help you understand the customer's progression through these stages. They aim to help businesses and professionals understand the customer journey and optimize their strategies for each stage of the funnel. Whether used in sales presentations, marketing workshops, or educational materials, this template helps businesses build successful sale funnels and maximize their revenue potential.


6 slides
Green Energy and Ecology Presentation
Ignite your audience’s curiosity with a clean, modern layout that brings eco-friendly ideas to life. This presentation helps you explain renewable energy concepts, sustainability benefits, and environmental impact in a clear, structured way that feels fresh and inspiring. Fully compatible with PowerPoint, Keynote, and Google Slides.