


Features
- 5 Unique slides
- Fully editable and easy to edit in Microsoft Powerpoint, Keynote and Google Slides
- 16:9 widescreen layout
- Clean and professional designs
- Export to JPG, PDF or send by email


Do you have any questions?
Recommend


7 slides
Funnel Web Infographic
Maximize your insights with our funnel web infographic. This template is a highly informative tool designed to help you illustrate and understand various processes, from sales pipelines to user engagement funnels. This funnel infographic is all about presenting data in an engaging, easy-to-digest manner. Ideal for marketing professionals, business strategists, and anyone looking to visualize multi-step processes. Compatible with Powerpoint, Keynote, and Google Slides. You can add a vibrant yet professional color scheme to ensure attention of information. Present your data in a visually captivating way!

20 slides
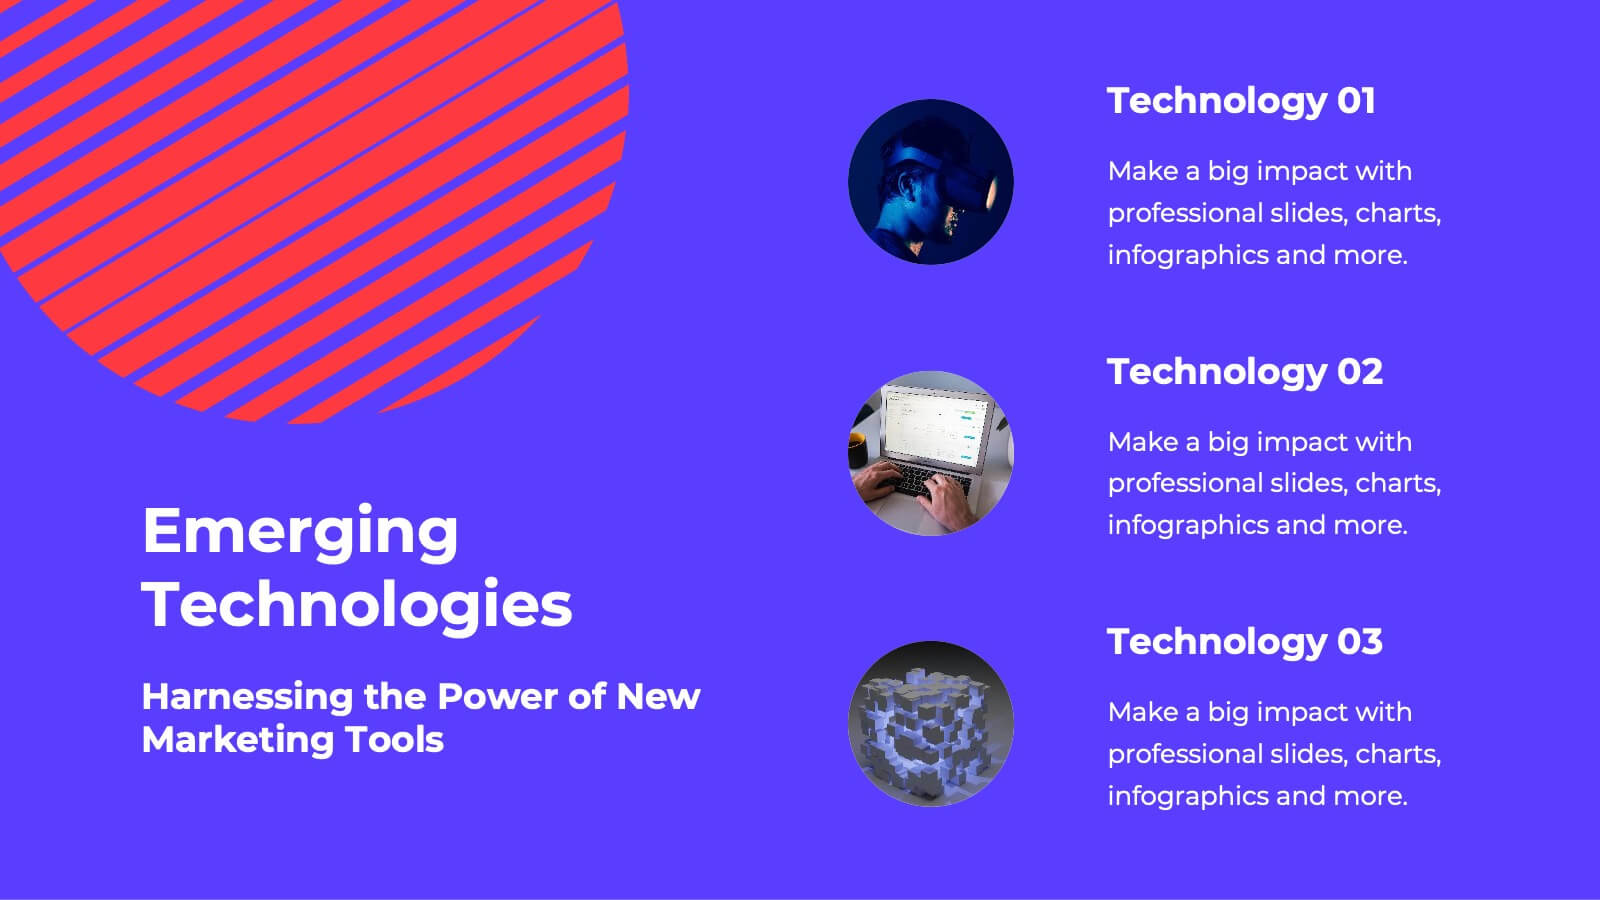
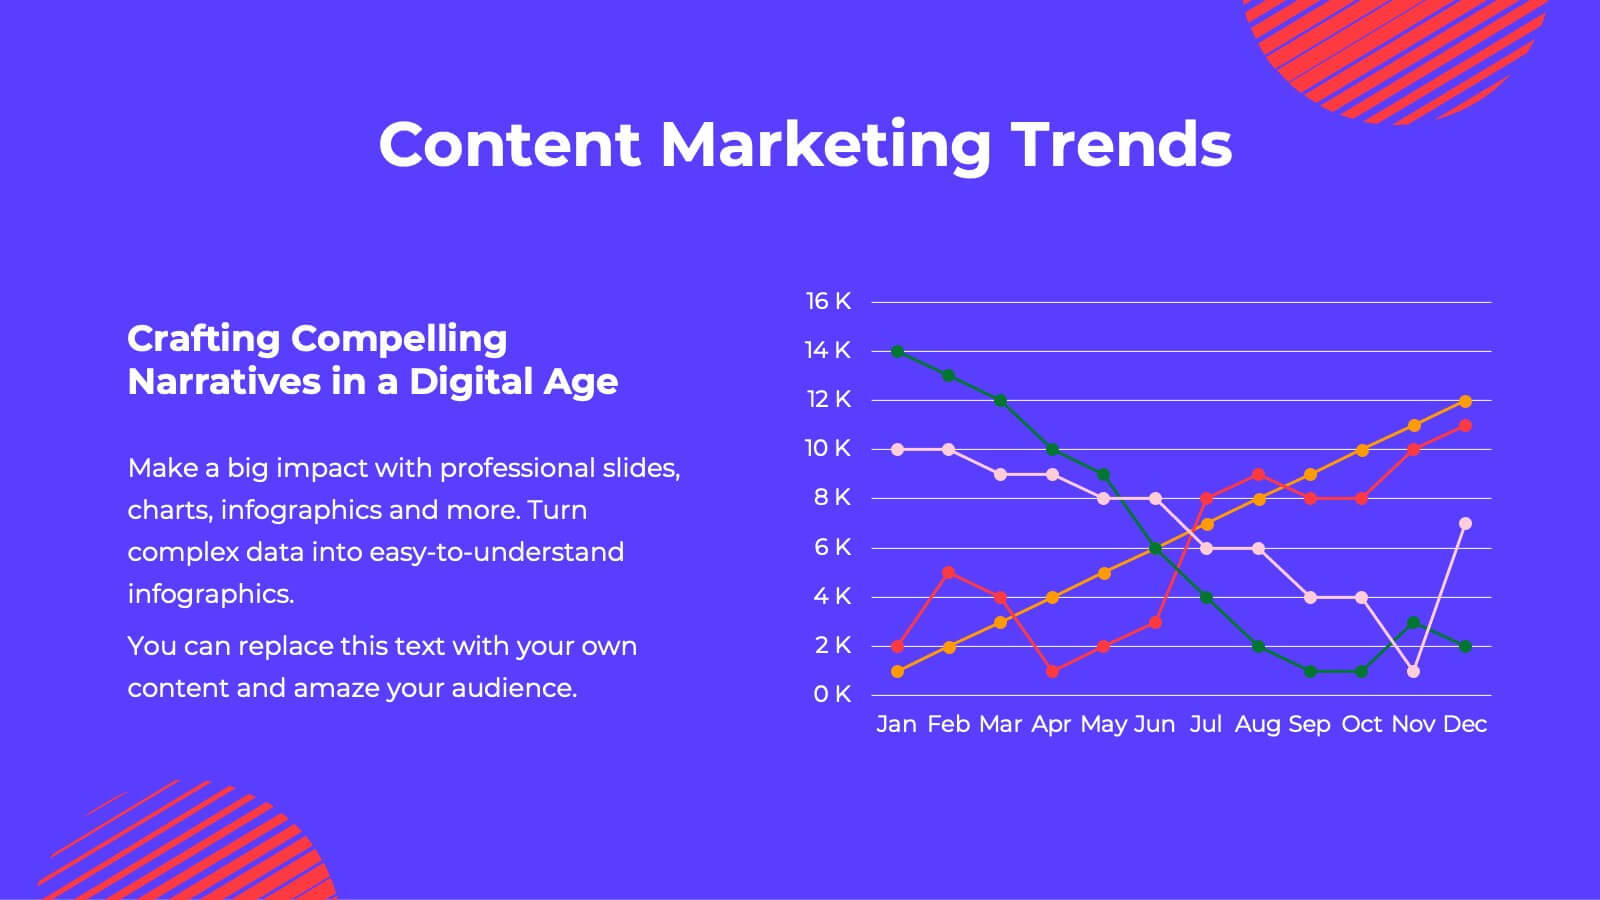
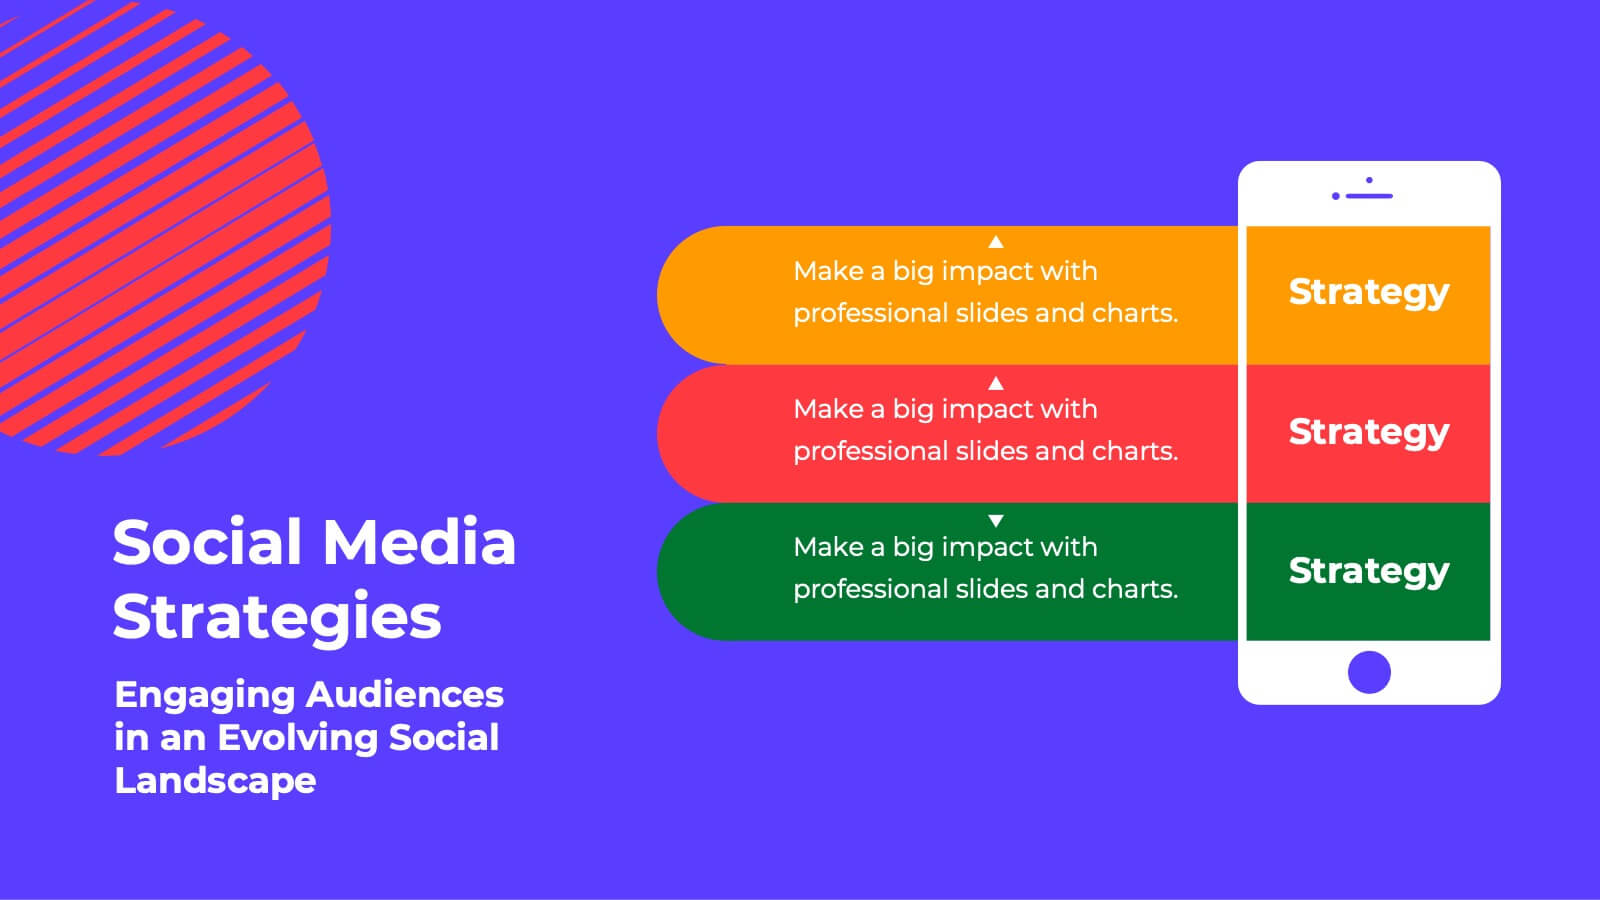
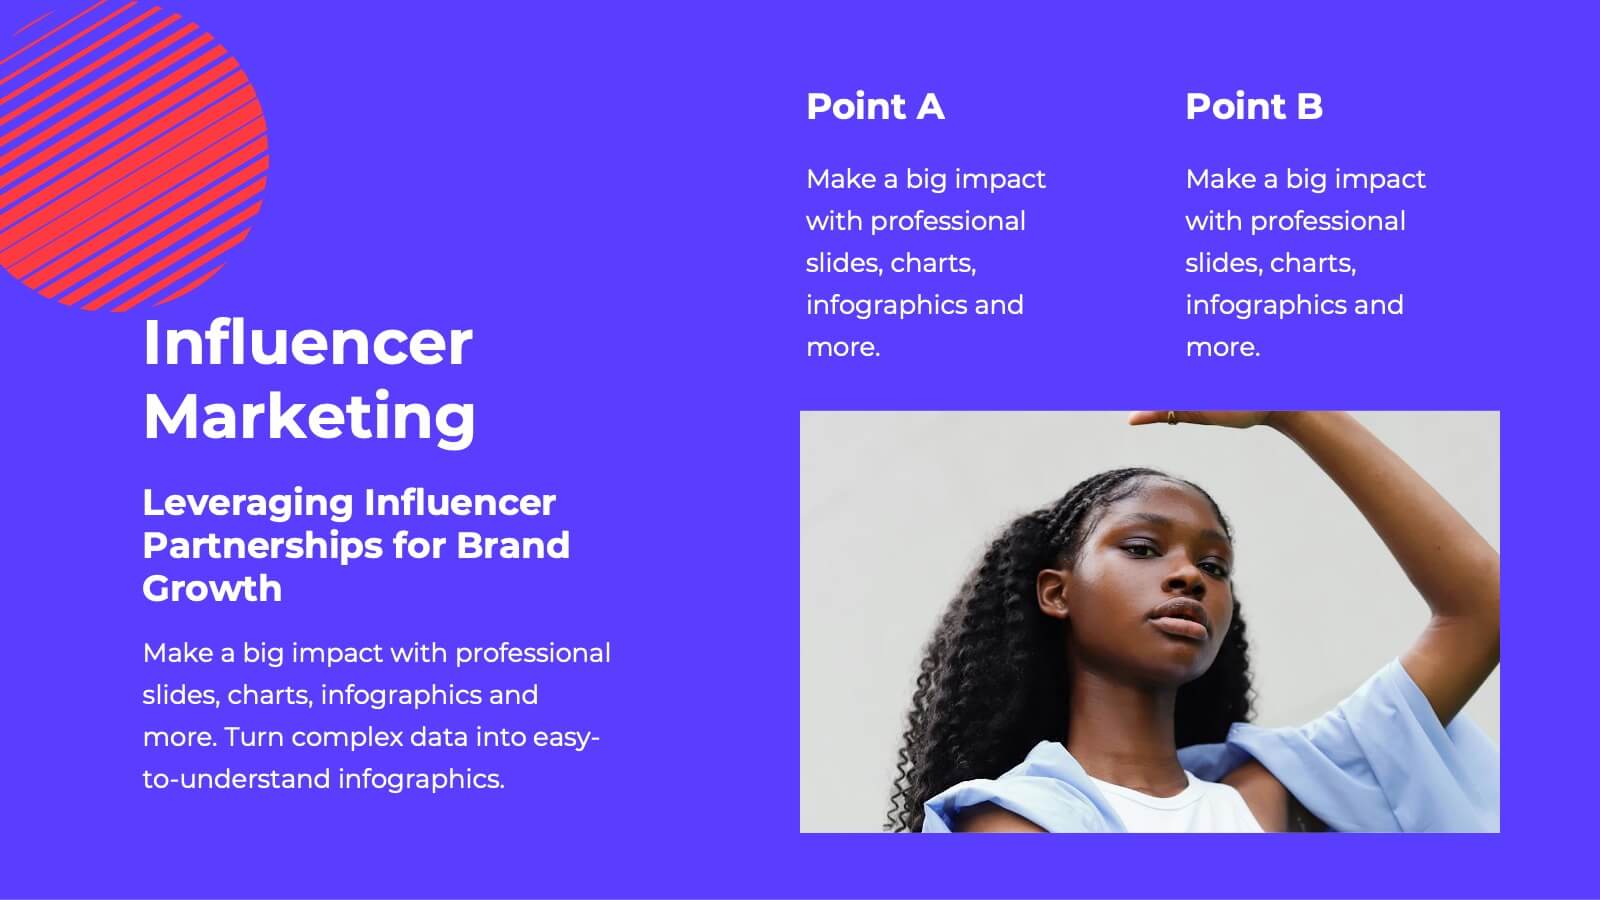
Fusion Marketing Campaign Presentation
Unleash the power of your marketing campaigns with this vibrant marketing campaign template! Dive into social media strategies, influencer marketing, data-driven insights, and more. Perfect for presenting to stakeholders and team members. Fully customizable and compatible with PowerPoint, Keynote, and Google Slides.


4 slides
Top Priorities and Checklist Format Presentation
Stay focused and aligned with the Top Priorities and Checklist Format Presentation. This clear, checklist-based design is ideal for highlighting action items, goals, or key project deliverables. Visually guide your team with structured sections and a checklist illustration that reinforces accountability. Fully editable in PowerPoint, Keynote, and Google Slides.


4 slides
Economic Impact on Stock Market
Visualize financial cause and effect with this step-by-step economic impact infographic. Ideal for explaining market trends, policy changes, or fiscal outcomes, this slide uses a four-part arrow path starting with a money bag icon. Each stage—A to D—can be customized with data and analysis. Fully editable in PowerPoint, Keynote, and Google Slides.


20 slides
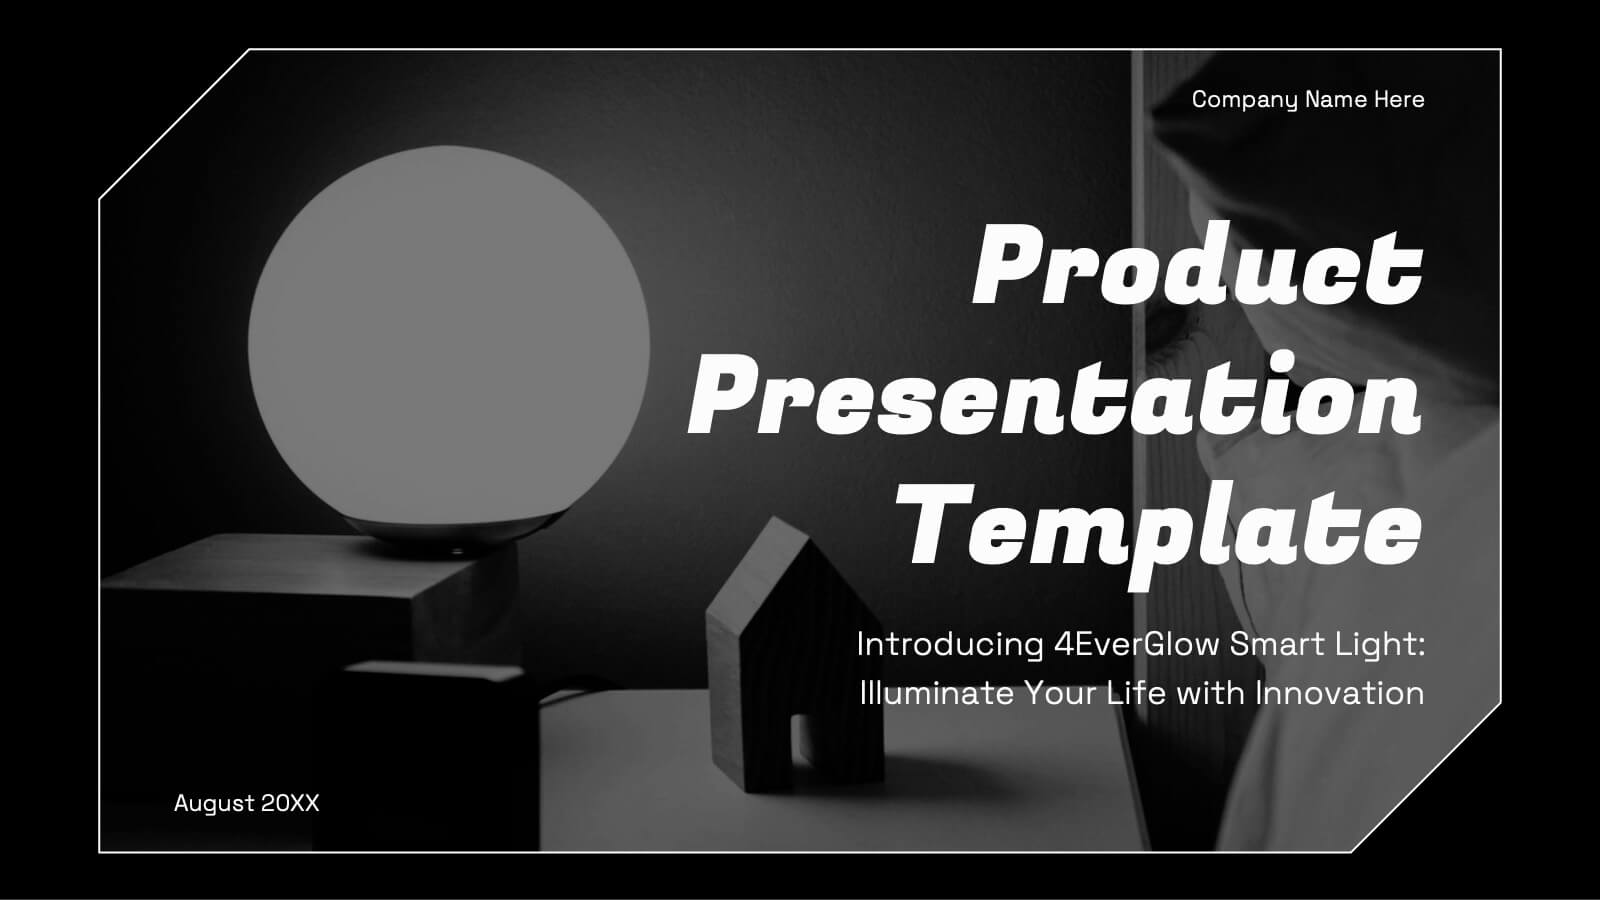
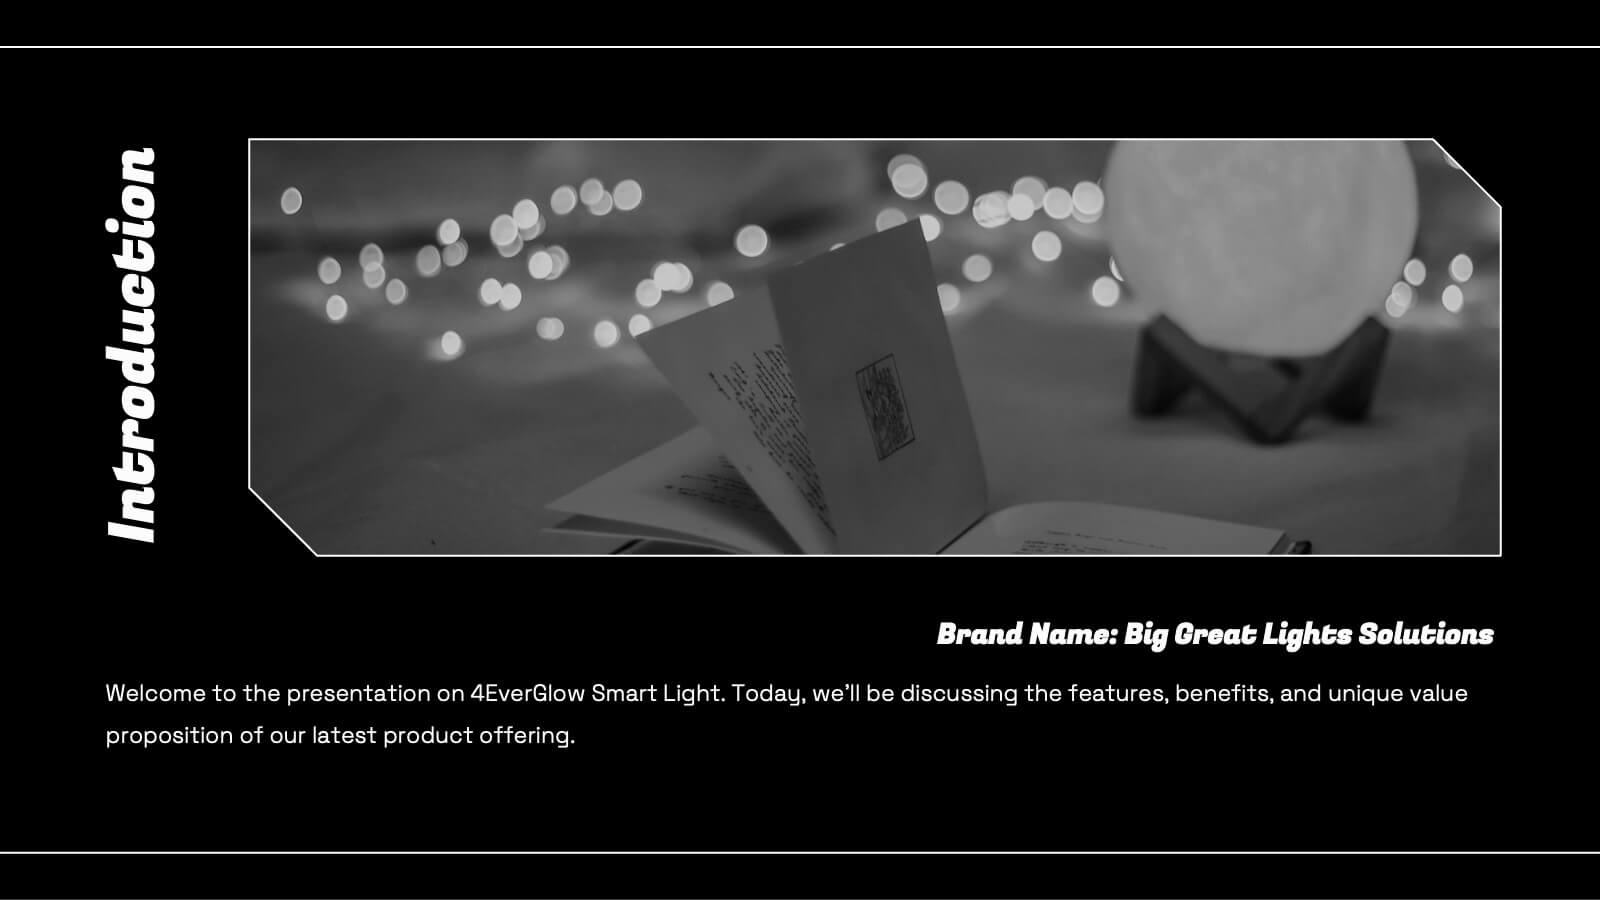
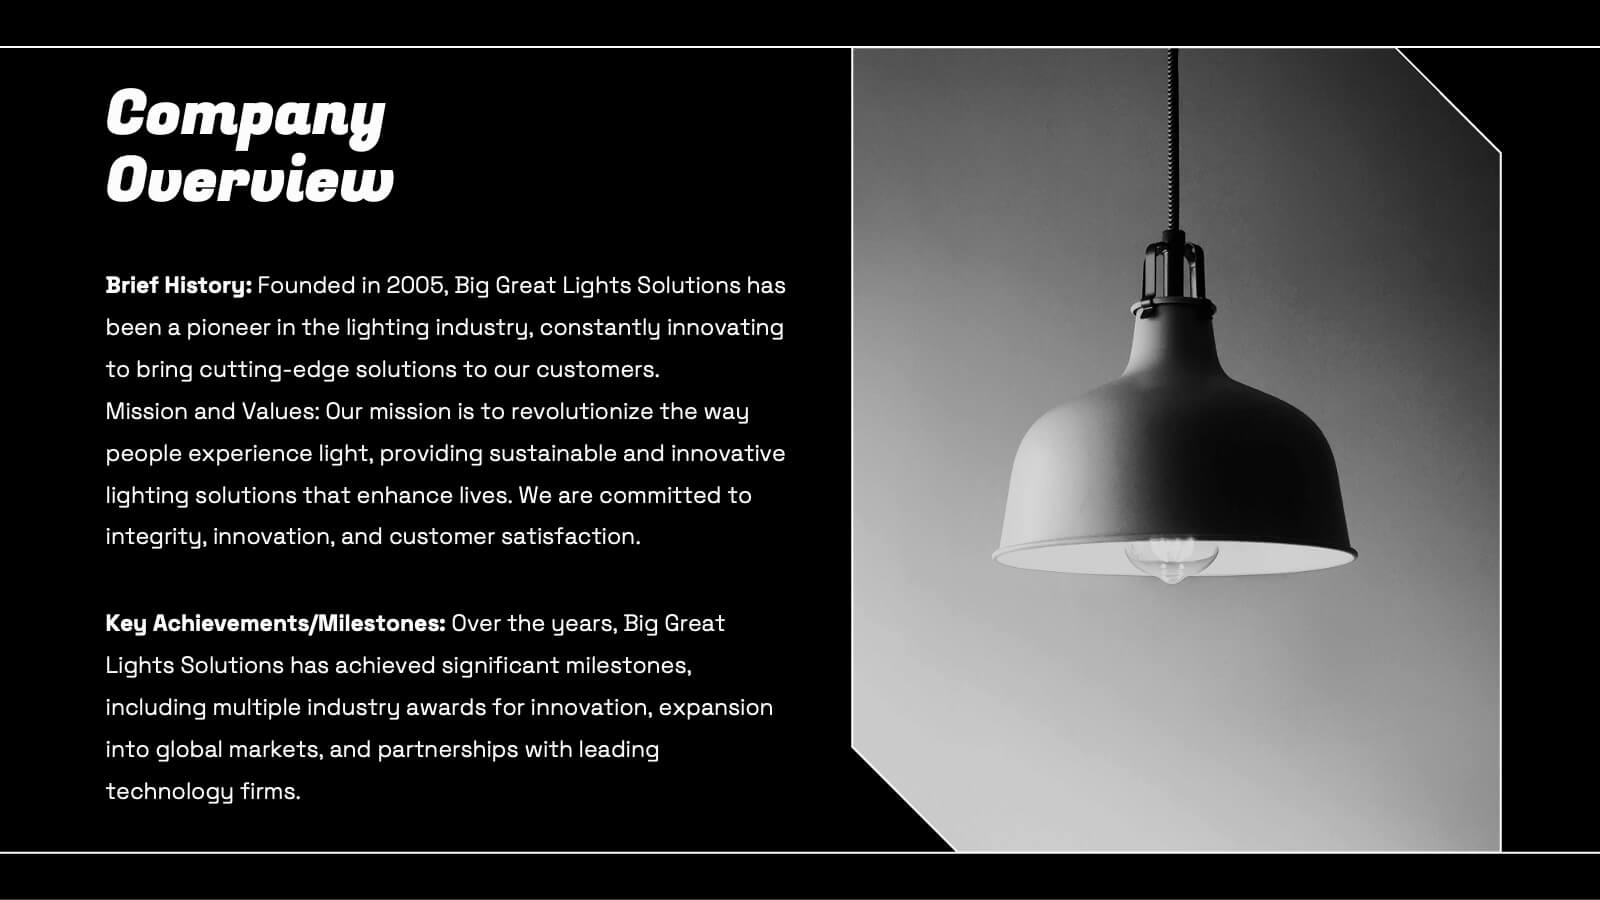
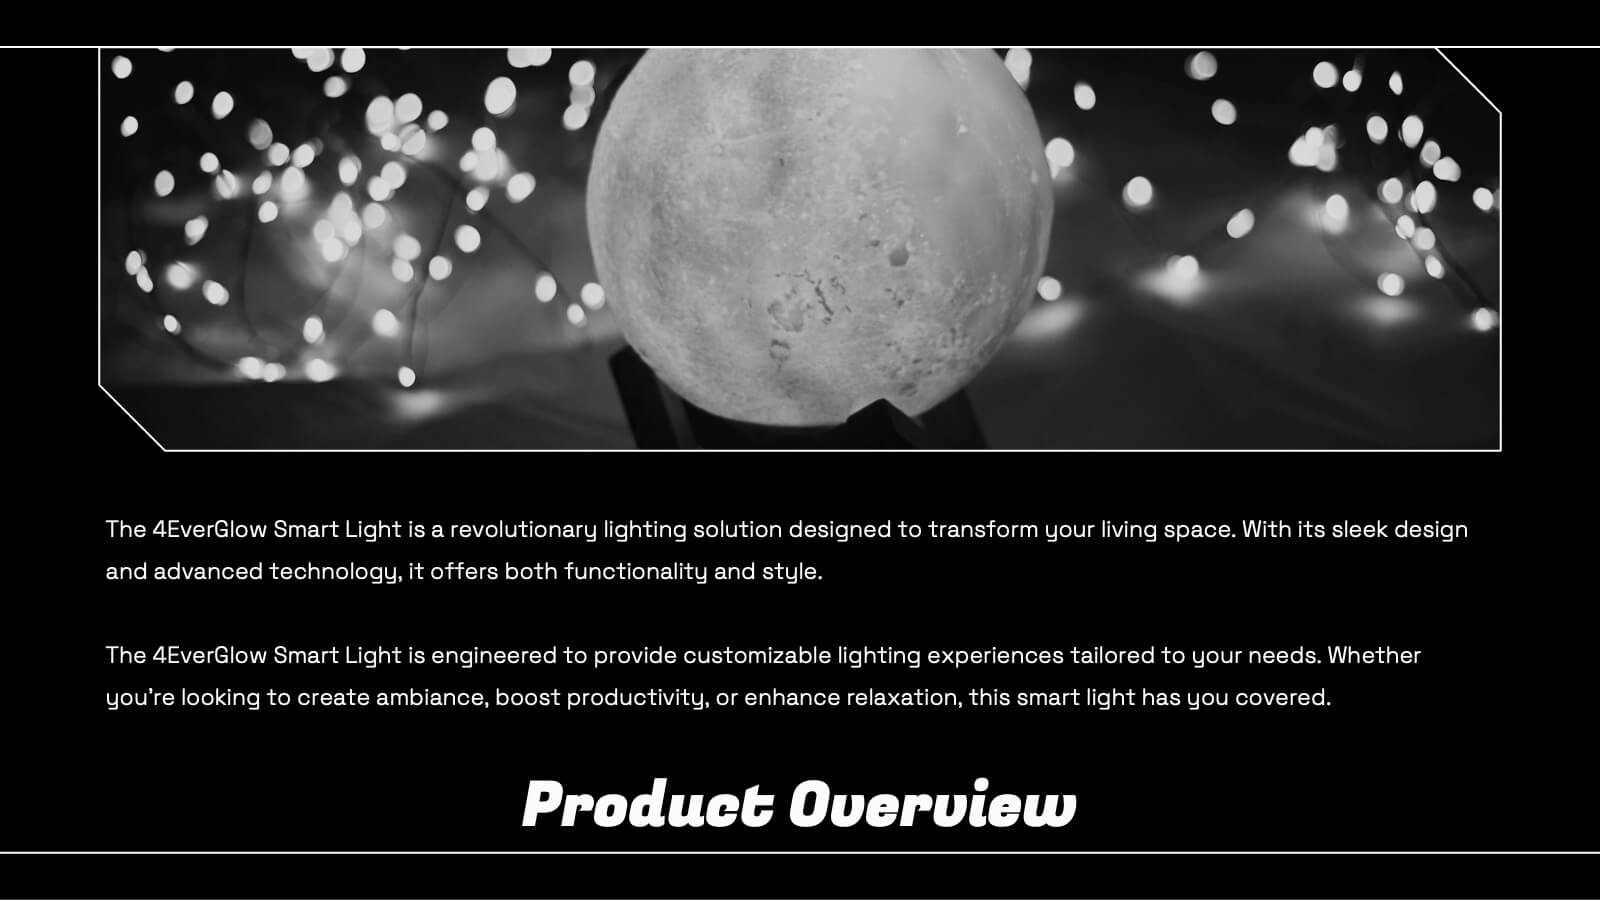
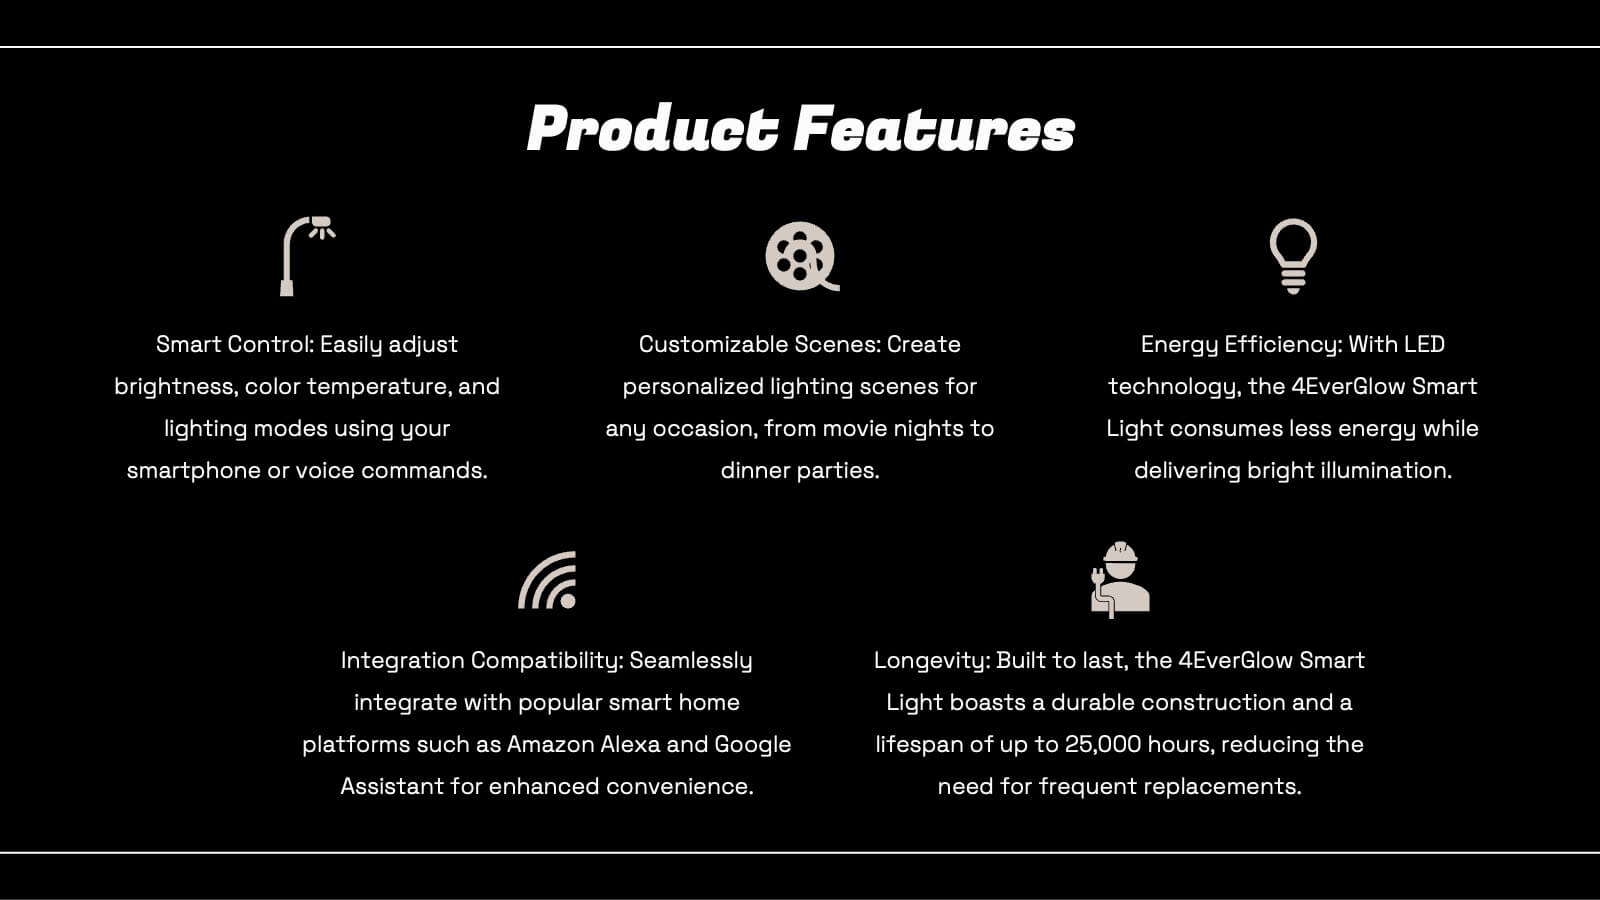
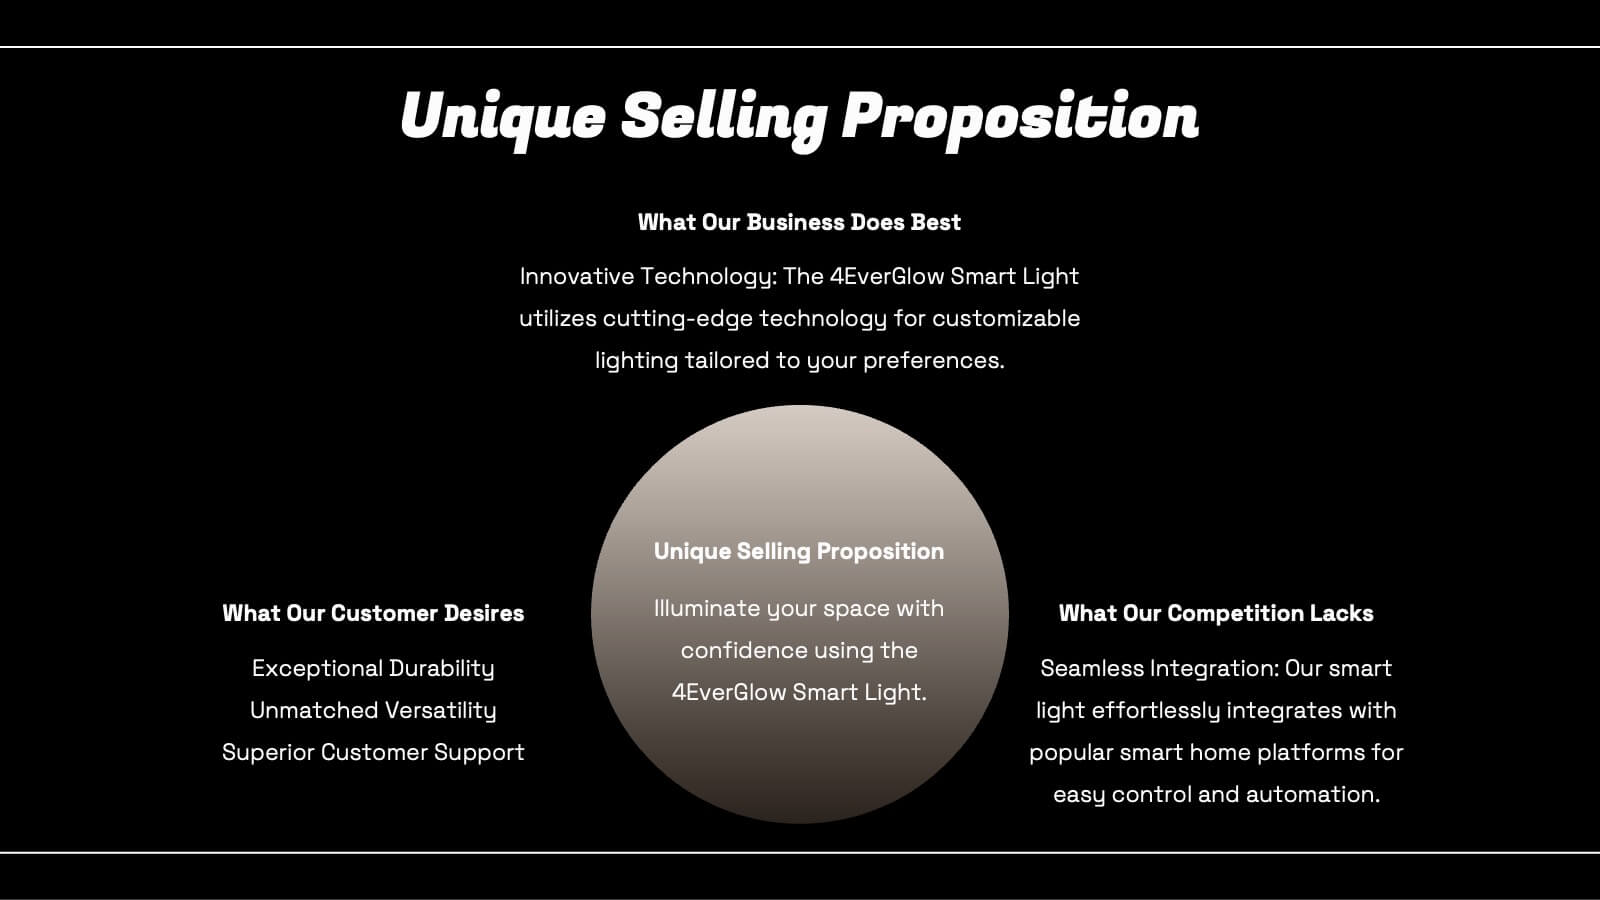
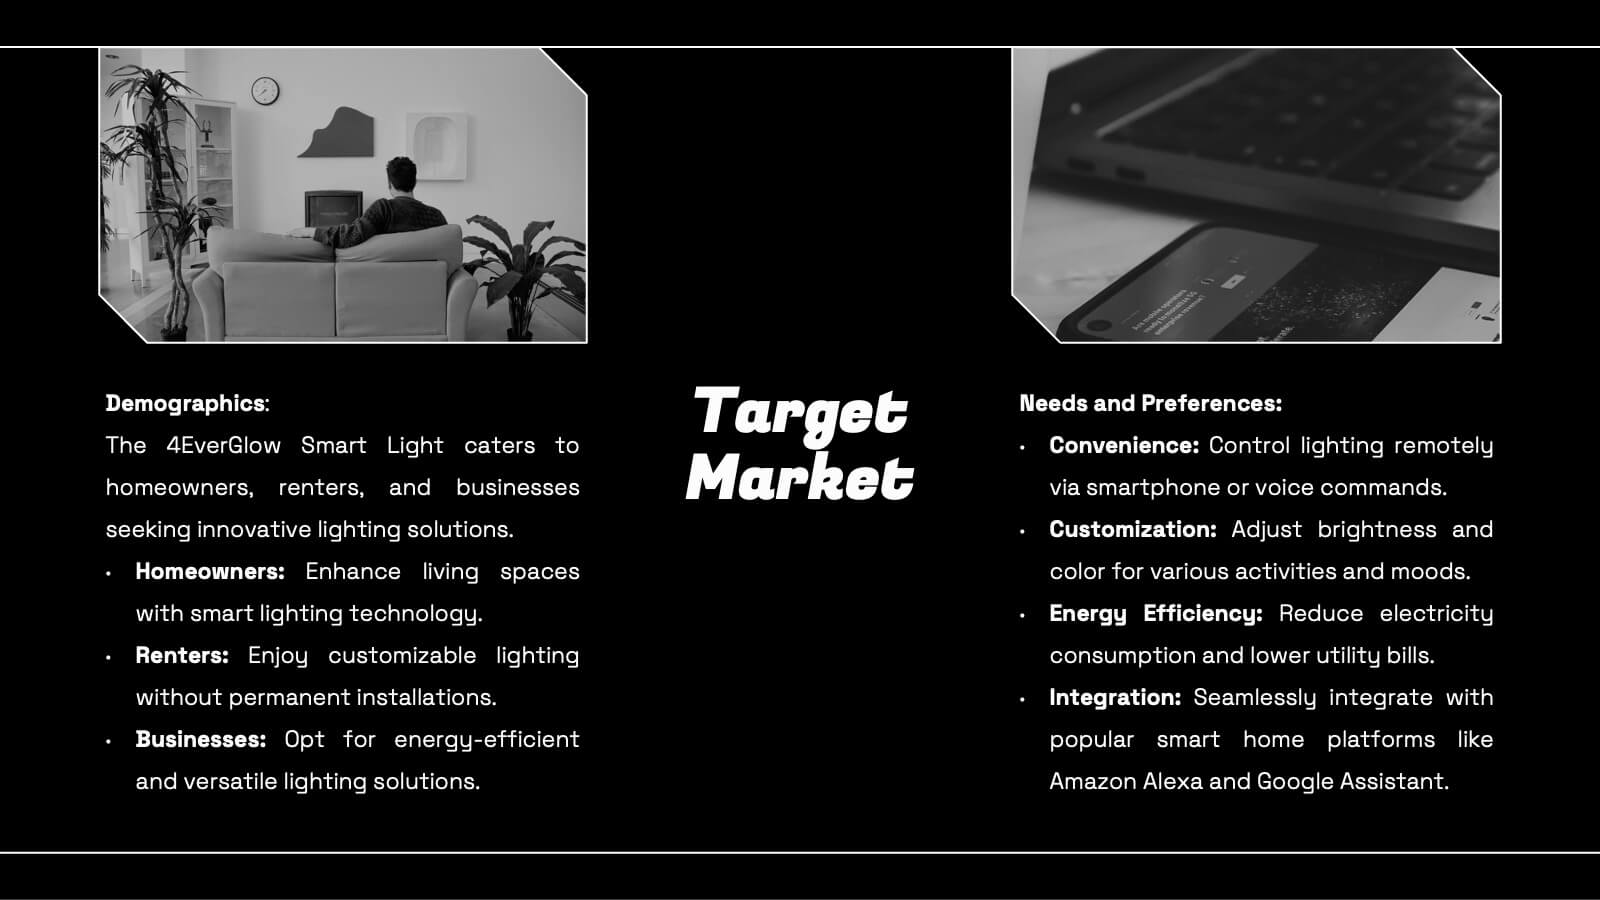
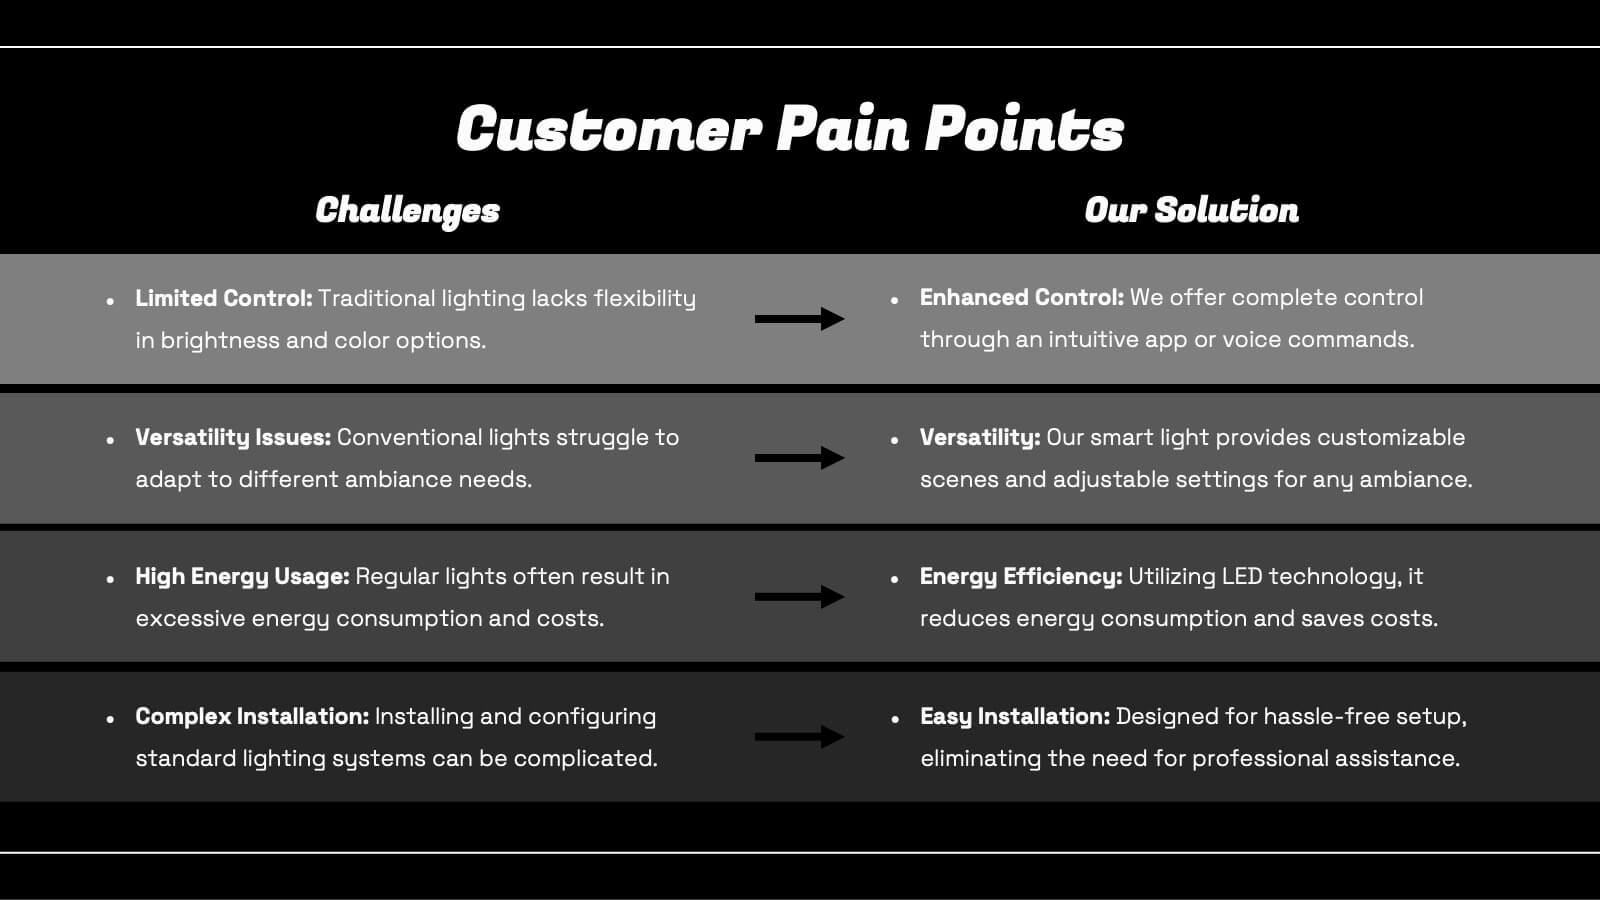
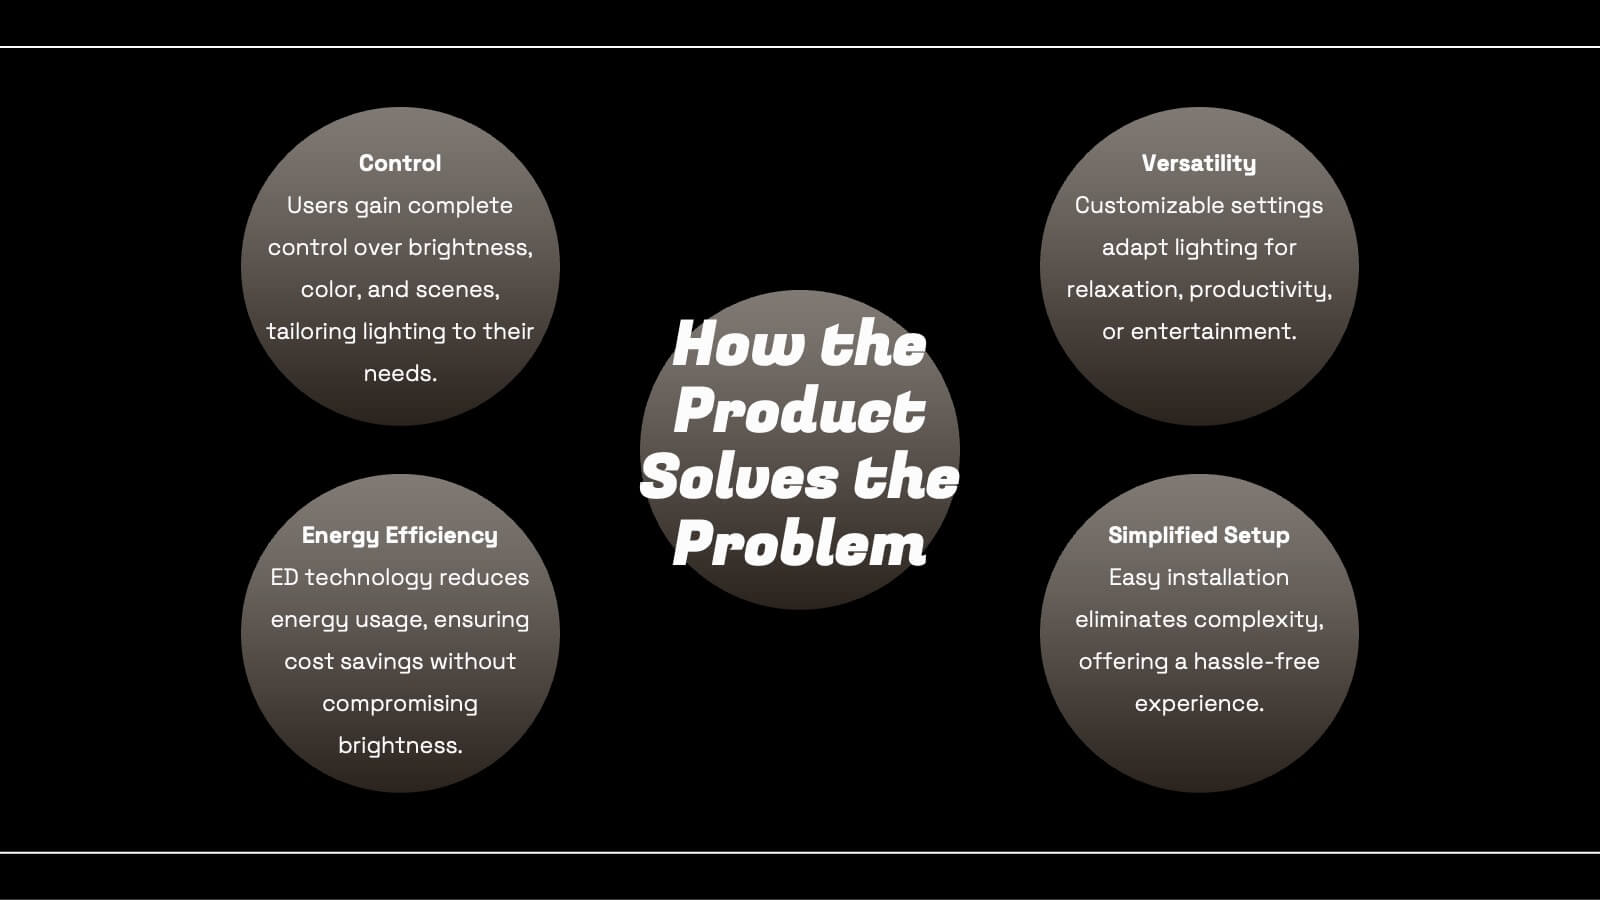
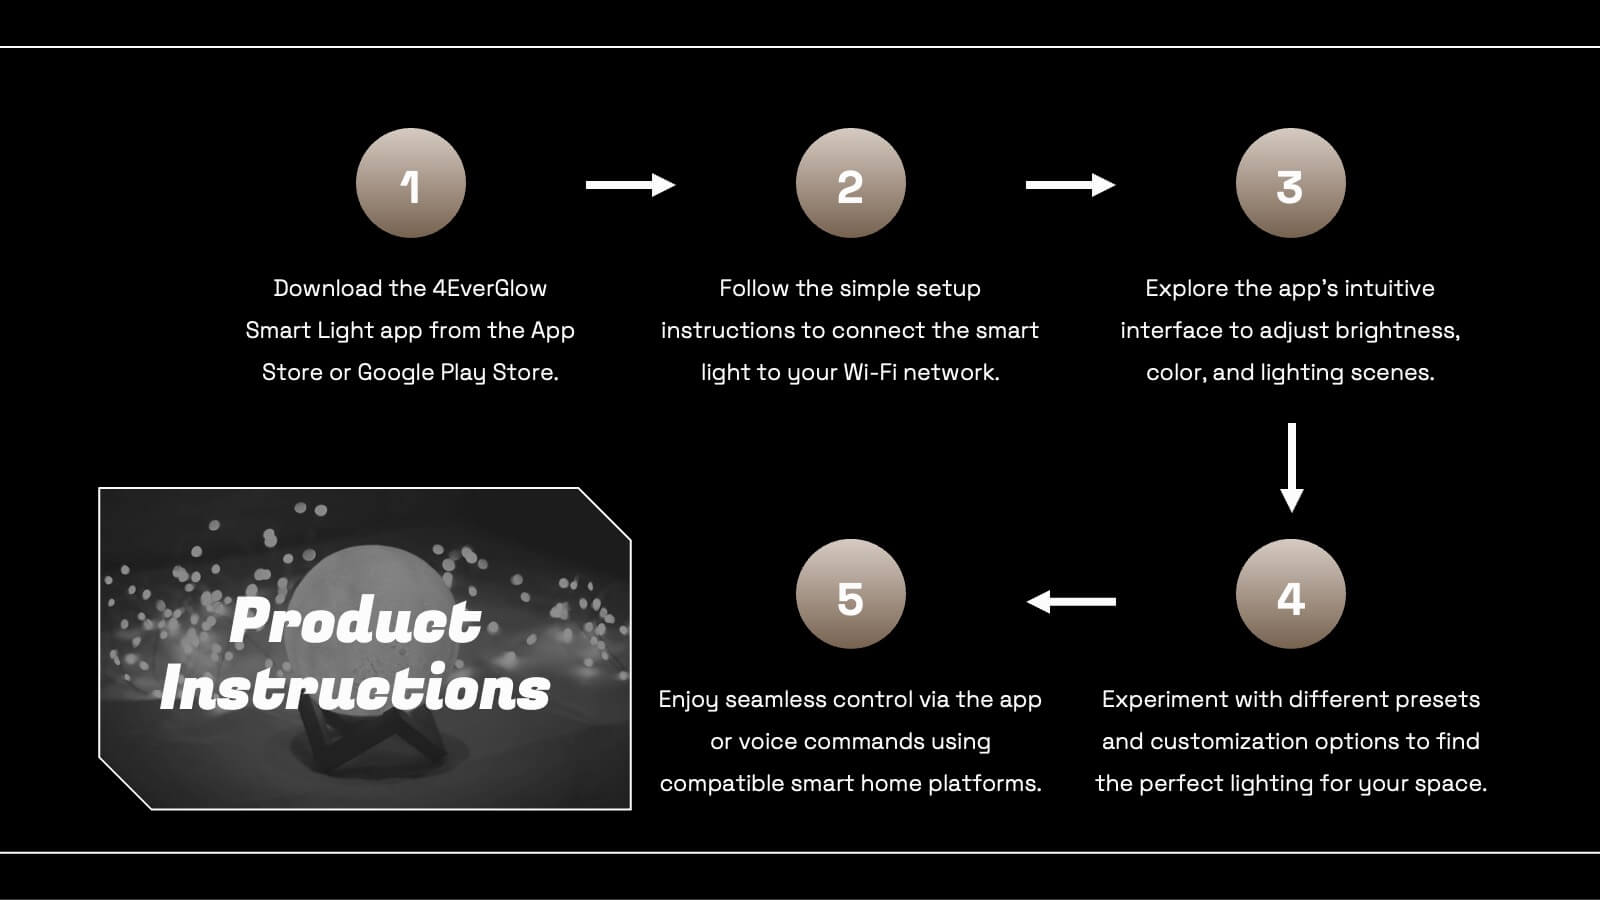
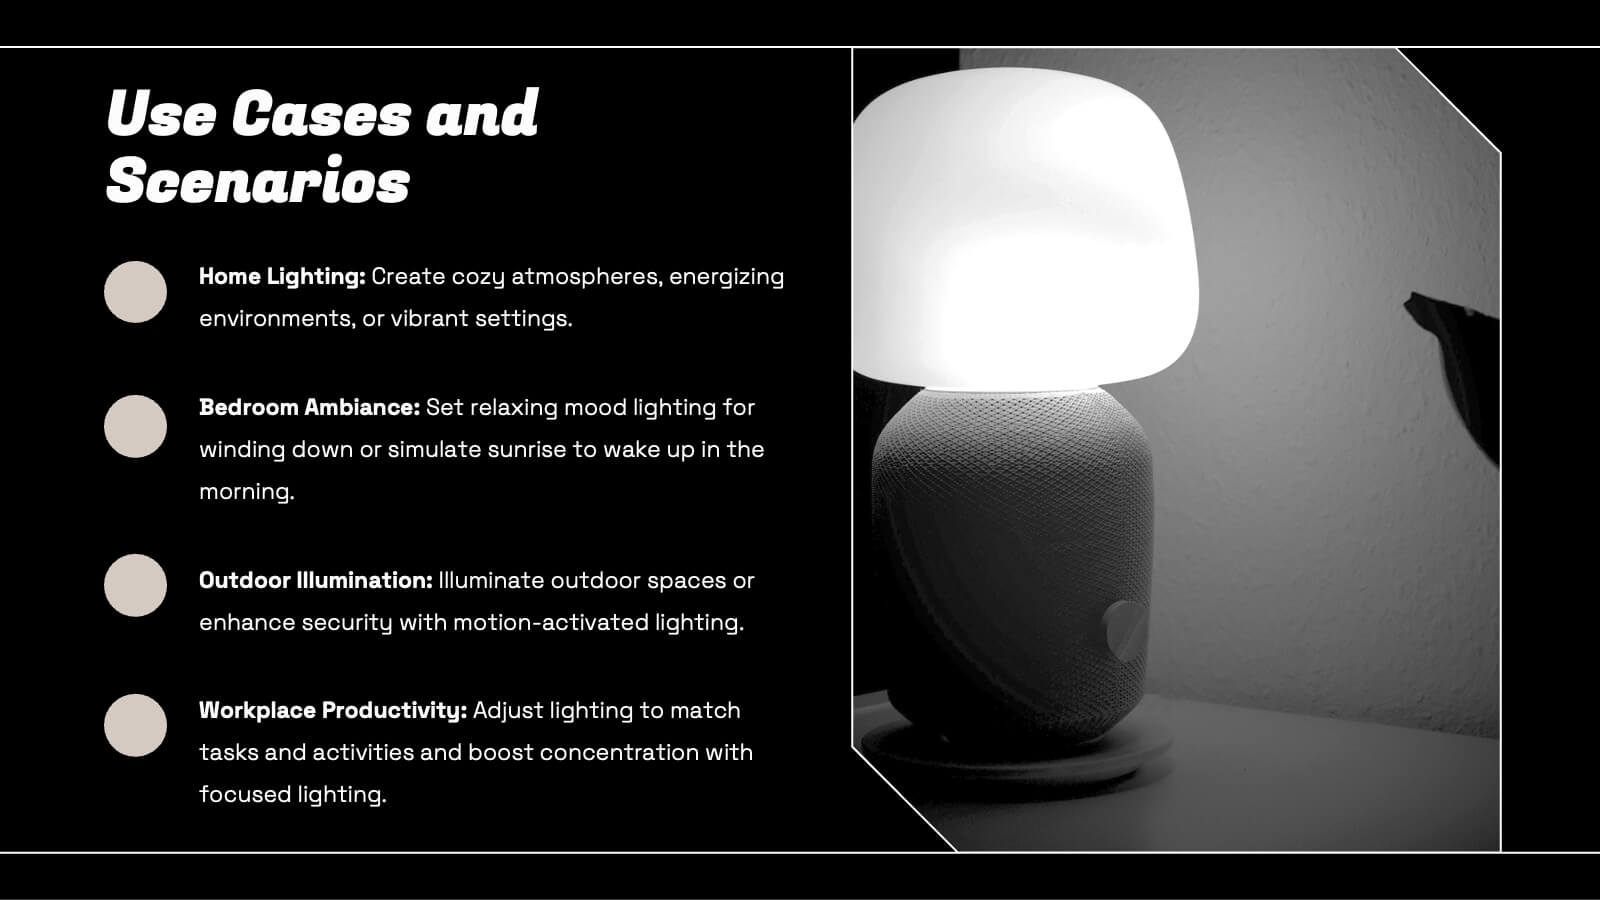
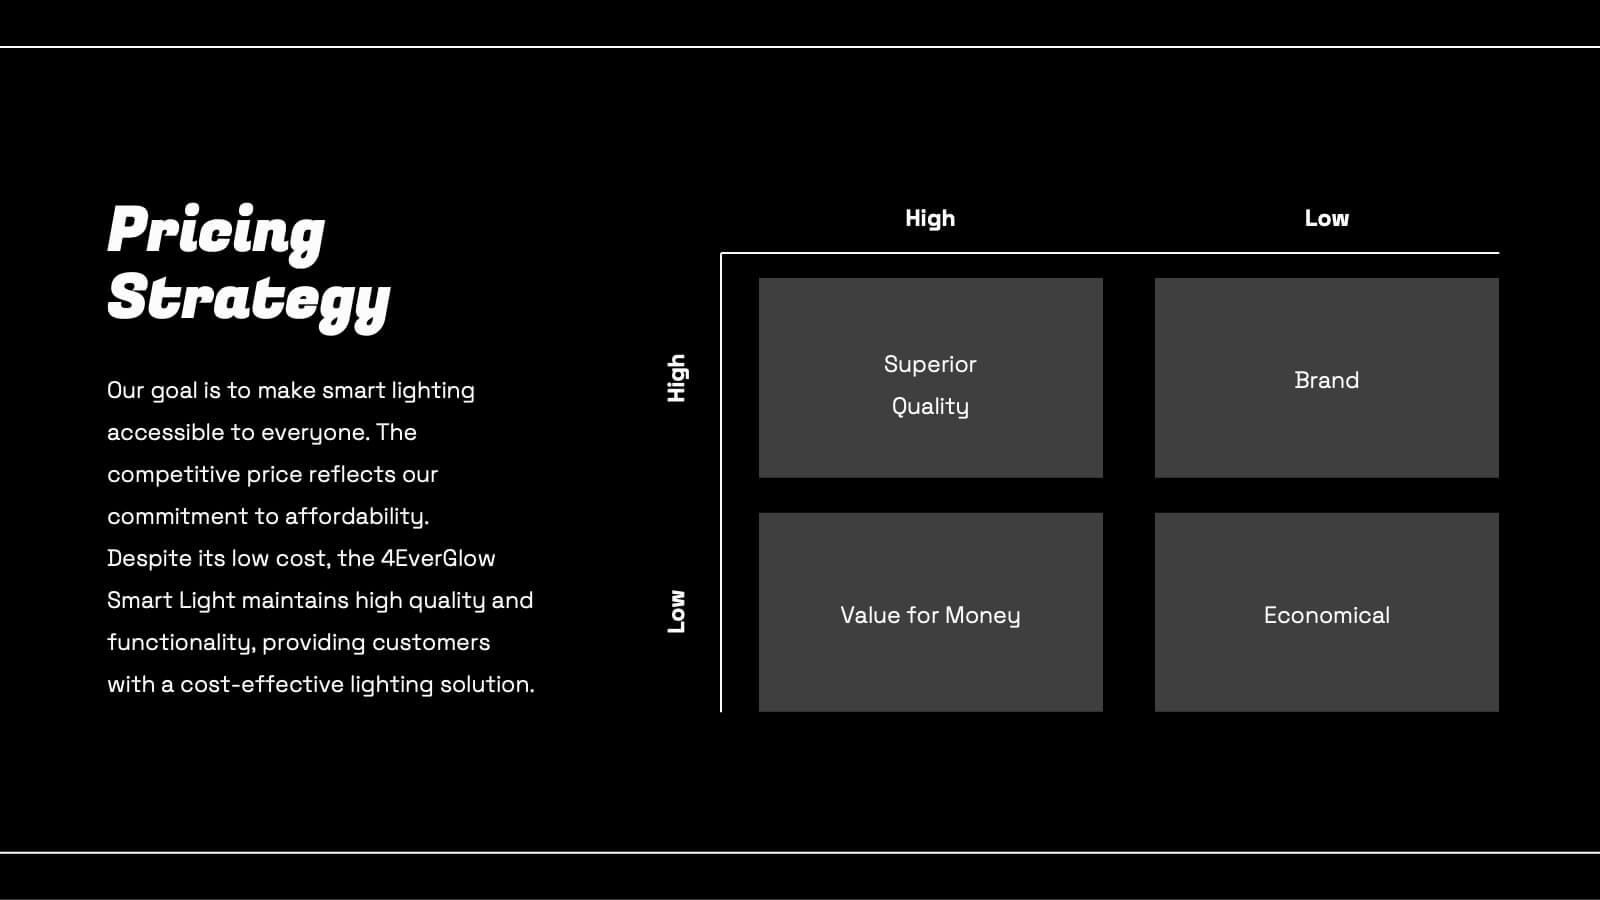
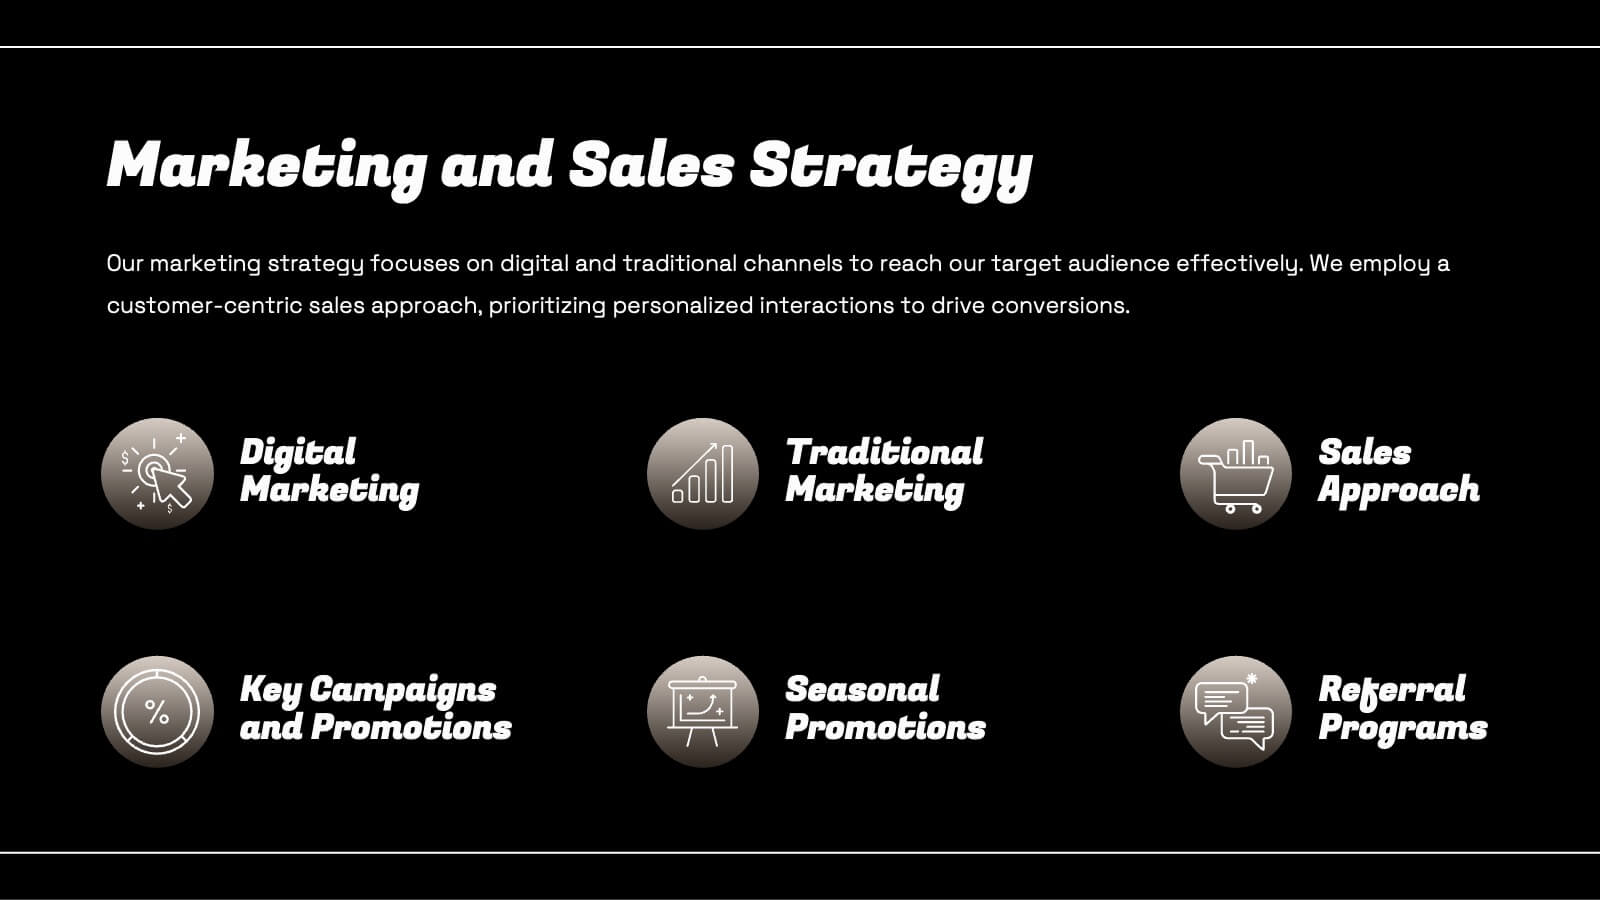
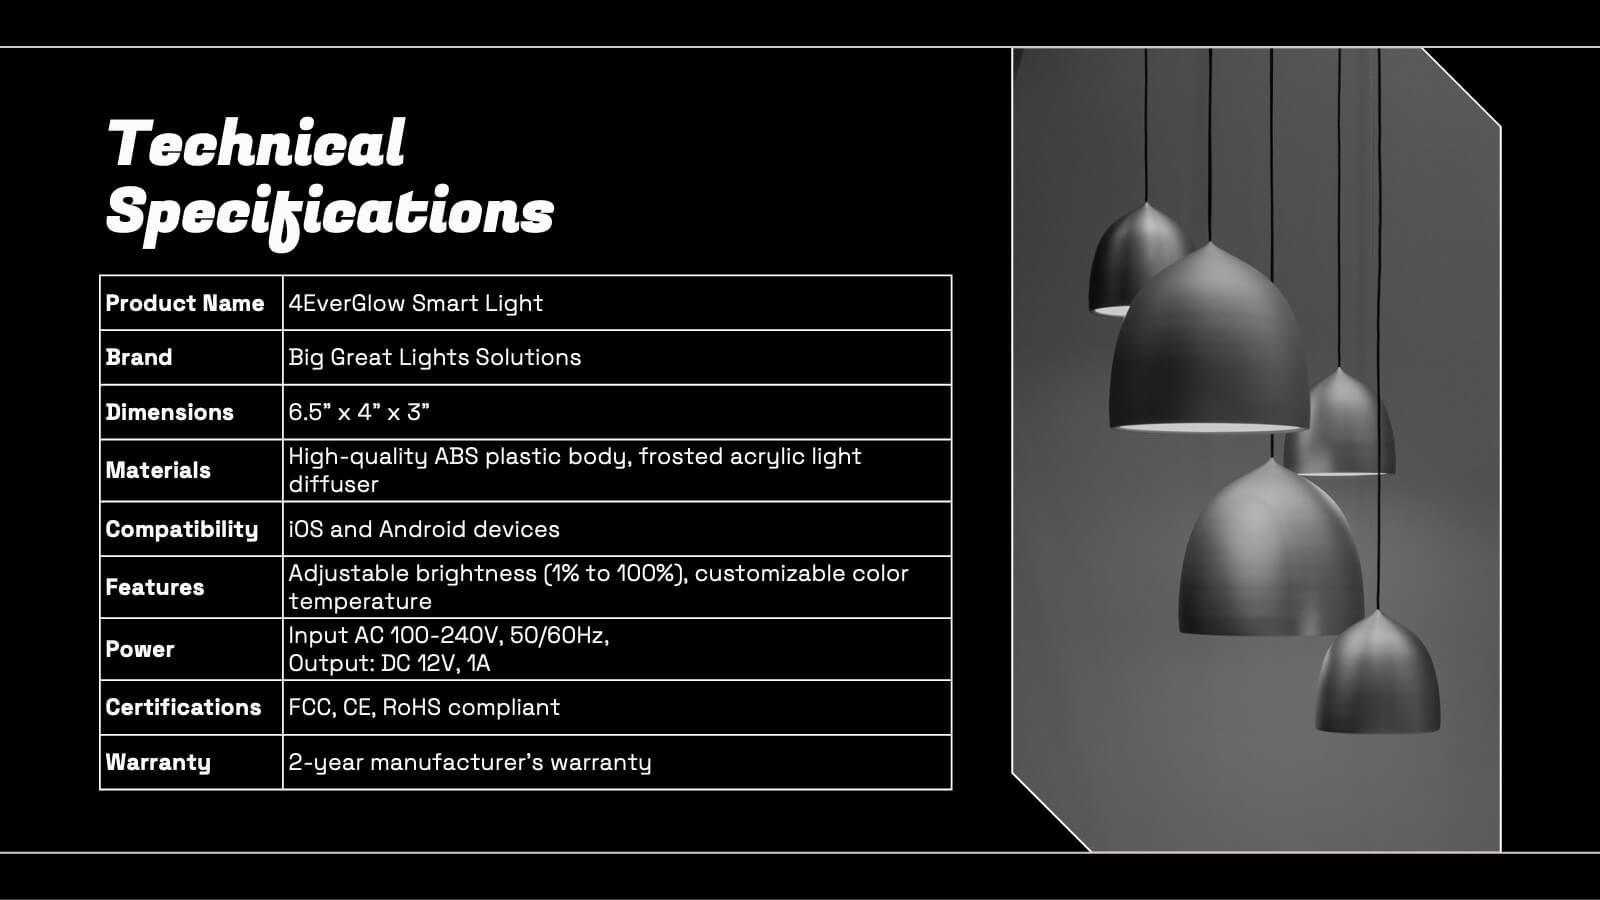
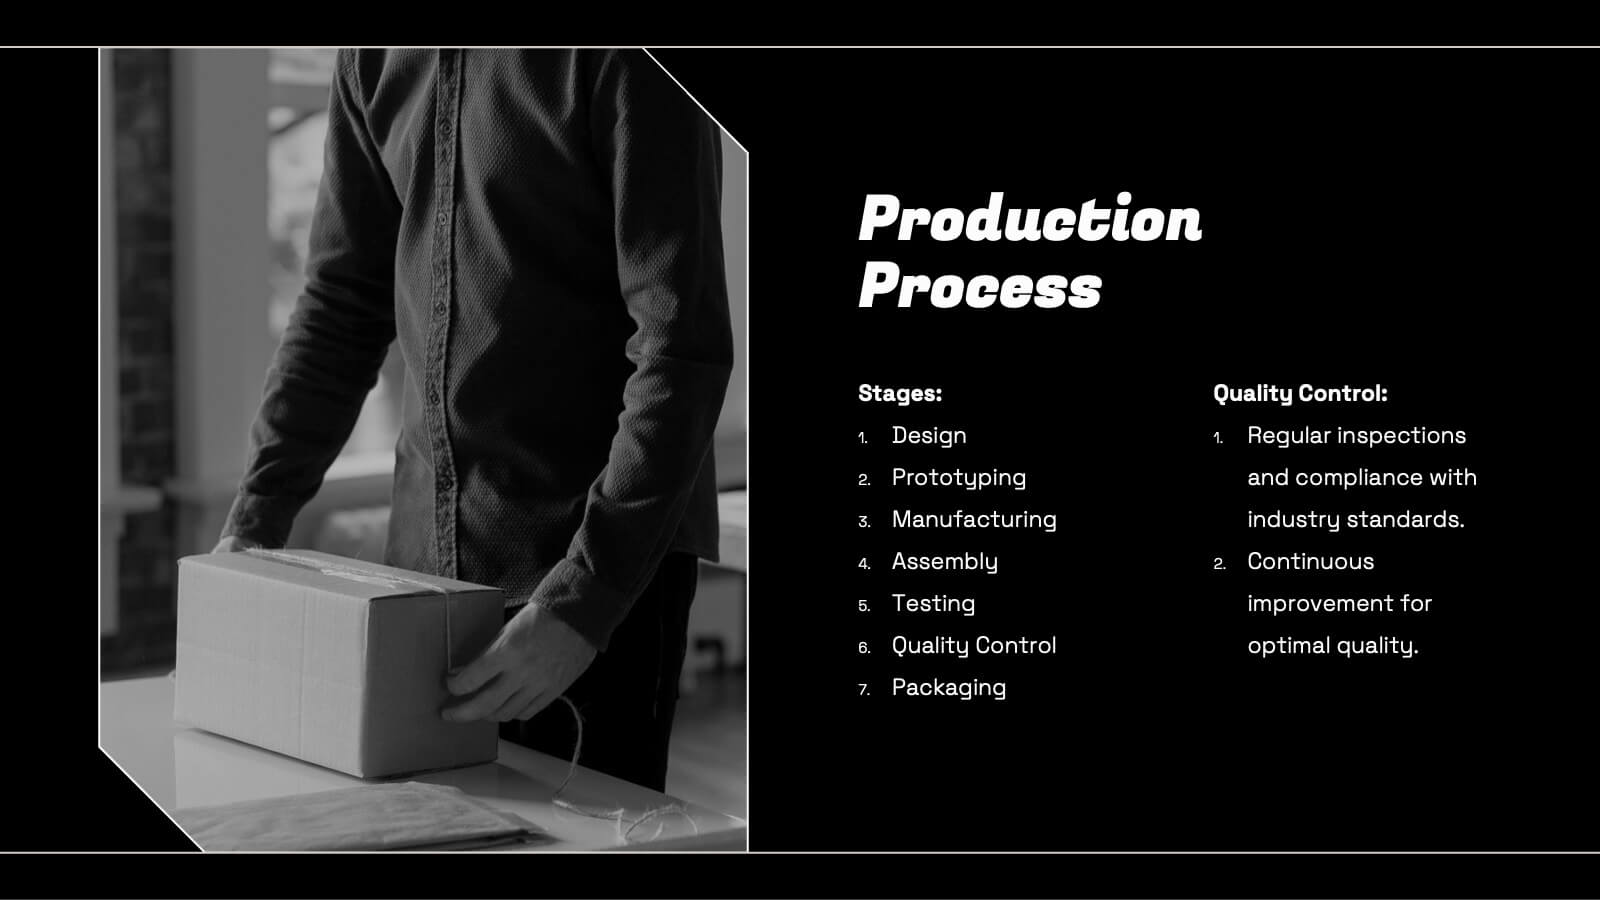
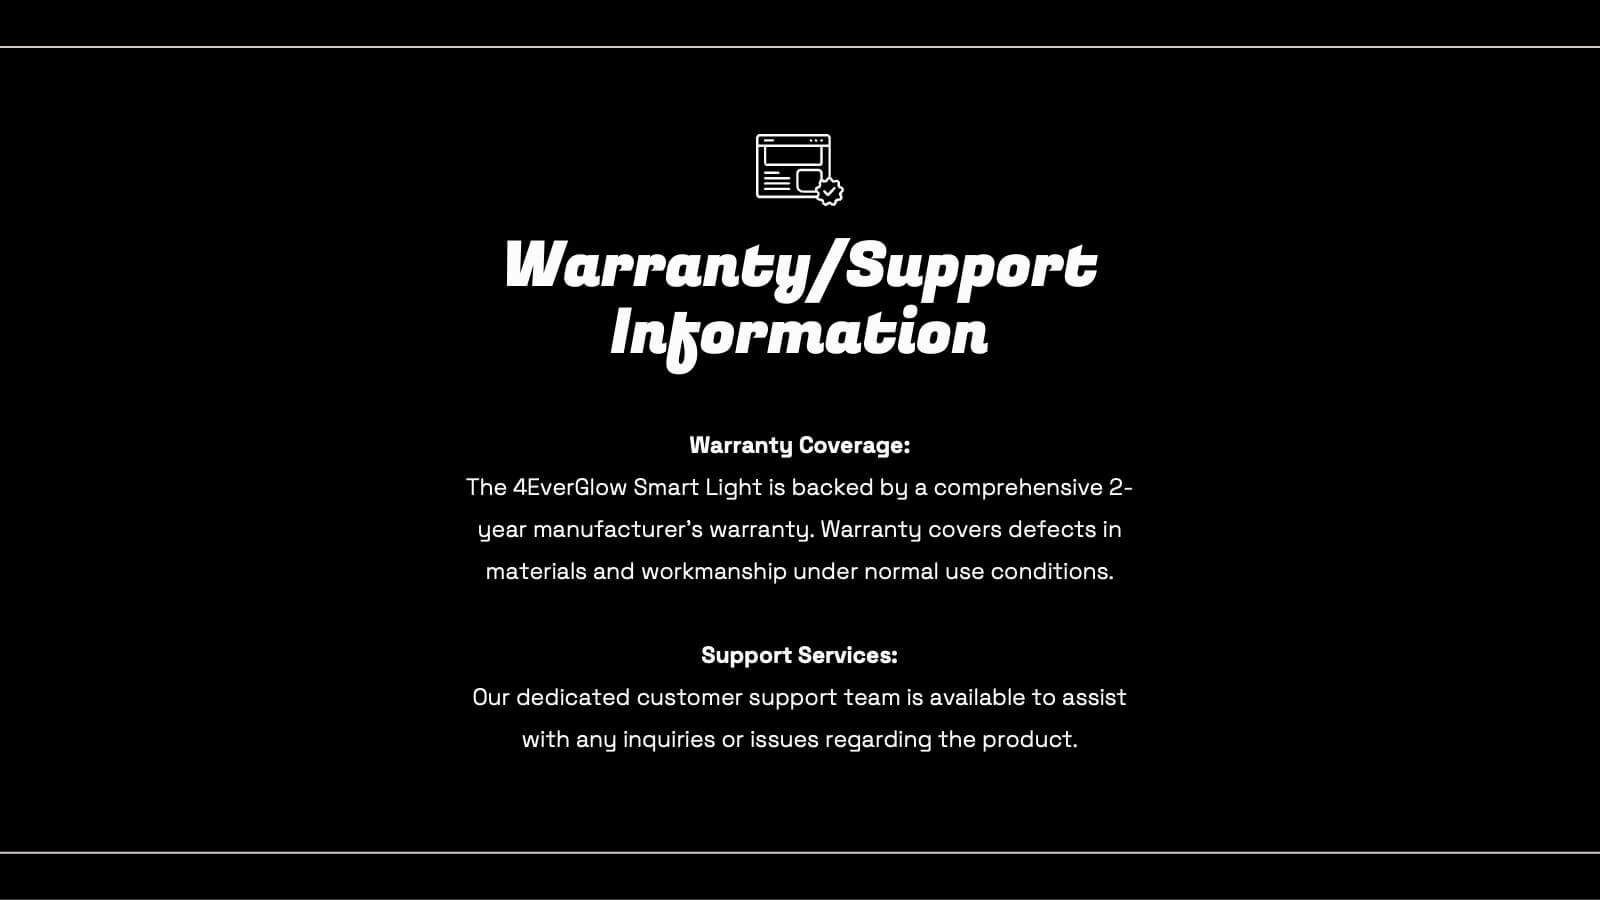
Smart Light Product Presentation
Enhance your product presentations with this Smart Lighting template. Designed for clarity and aesthetic appeal, it includes slides detailing product features, market analysis, technical specifications, and pricing strategies. Ideal for tech products, it's compatible with PowerPoint, Keynote, and Google Slides, ensuring broad accessibility and ease of use.


6 slides
Organizational Goals and SMART Objectives Presentation
Align your business vision with clarity using this Organizational Goals and SMART Objectives slide. Designed to visually represent each SMART component—Specific, Measurable, Achievable, Relevant, and Time-bound—it helps communicate strategic goals in a simple and effective format. Fully editable in Canva, PowerPoint, and Google Slides for maximum flexibility.


7 slides
Stakeholder Impact Analysis Infographic Presentation
Stakeholder analysis is a tool used to identify and assess the interests, needs, and concerns of different stakeholders related to a particular project or initiative. This template can provide a comprehensive overview of the stakeholders involved in a project including their interests and level of influence. Use this template to include information on the relationships between stakeholders, as well as the potential risks and opportunities associated with their involvement. It is designed in PowerPoint, Keynote, and Google Slides so you can use the one that works best for your team and edit.


6 slides
Corporate Performance Annual Report
Present key business metrics with precision using this Corporate Performance Annual Report slide. Designed with progress bars and intuitive icons, this layout clearly communicates departmental or project-based performance. Ideal for year-end reviews, board meetings, and investor updates. Fully editable in PowerPoint, Keynote, and Google Slides.


7 slides
Matrix Structure Diagram
A matrix diagram is a management planning tool that enables you to analyze and display the relationship between data sets. This is a visual way to display information that you can quickly and easily analyze. With this template, you can create awesome Matrix Diagrams that will help you group and analyze information in a clear and organized way. This template is the perfect tool If you want to impress your teacher or boss with Infographic presentations. Arrange your information in a way that makes sense to you. Get started by downloading and editing in Powerpoint, Keynote, or Google Slides.


6 slides
Internal Communication Framework Presentation
Foster stronger collaboration with this visual internal communication framework template. Ideal for showcasing how information flows within departments, this layout helps clarify messaging channels, responsibilities, and feedback loops. Whether you're streamlining communication strategies or presenting team structures, it’s fully editable and works seamlessly with PowerPoint, Keynote, and Google Slides.


5 slides
Climate Change Awareness Presentation
Deliver impactful environmental messages with this thermometer-style infographic layout. Ideal for visualizing temperature rise, emissions levels, or awareness metrics, each slide segment represents a stage of climate impact. Perfect for educators, NGOs, sustainability experts, or policy presentations. Fully customizable in PowerPoint, Keynote, and Google Slides.


5 slides
Innovative Business Solutions Presentation
Elevate your strategy discussions with the Innovative Business Solutions template, providing a visually engaging framework designed to present complex business solutions clearly and effectively. It features a unique puzzle design that integrates up to five key business insights, ensuring each piece contributes to a holistic understanding of strategies or solutions. It is compatible with PowerPoint, Keynote and Google Slides, providing flexibility and ease of use across different platforms.


6 slides
Defined Company Objectives Breakdown
Break down your company’s key priorities using this Defined Company Objectives slide. Featuring upward-pointing arrows from a central base, it visually maps out strategic goals in a clear, directional format. Fully customizable in PowerPoint, Keynote, and Google Slides.


6 slides
Risk Management Jobs Infographics
Our Risk Management Jobs infographic is meticulously crafted for Powerpoint, Keynote, and Google Slides, providing a valuable resource for HR professionals, risk consultants, and corporate trainers. This infographic is designed to delineate various job roles within the risk management field, detailing responsibilities, qualifications, and career paths. The infographic outlines the hierarchy and scope of positions, ranging from entry-level risk analysts to chief risk officers, and includes essential information on the skill sets and expertise required for each role. By presenting this data in a visually engaging format, the infographic simplifies the complexity of risk management career structures. Incorporating this infographic into career development workshops, job fairs, or internal training sessions will enhance understanding of the professional opportunities within risk management. It can also serve as a guide for those looking to advance in the field, providing clarity on the progression and specializations available. Use this infographic to effectively communicate the diverse range of roles and career trajectories in risk management.


8 slides
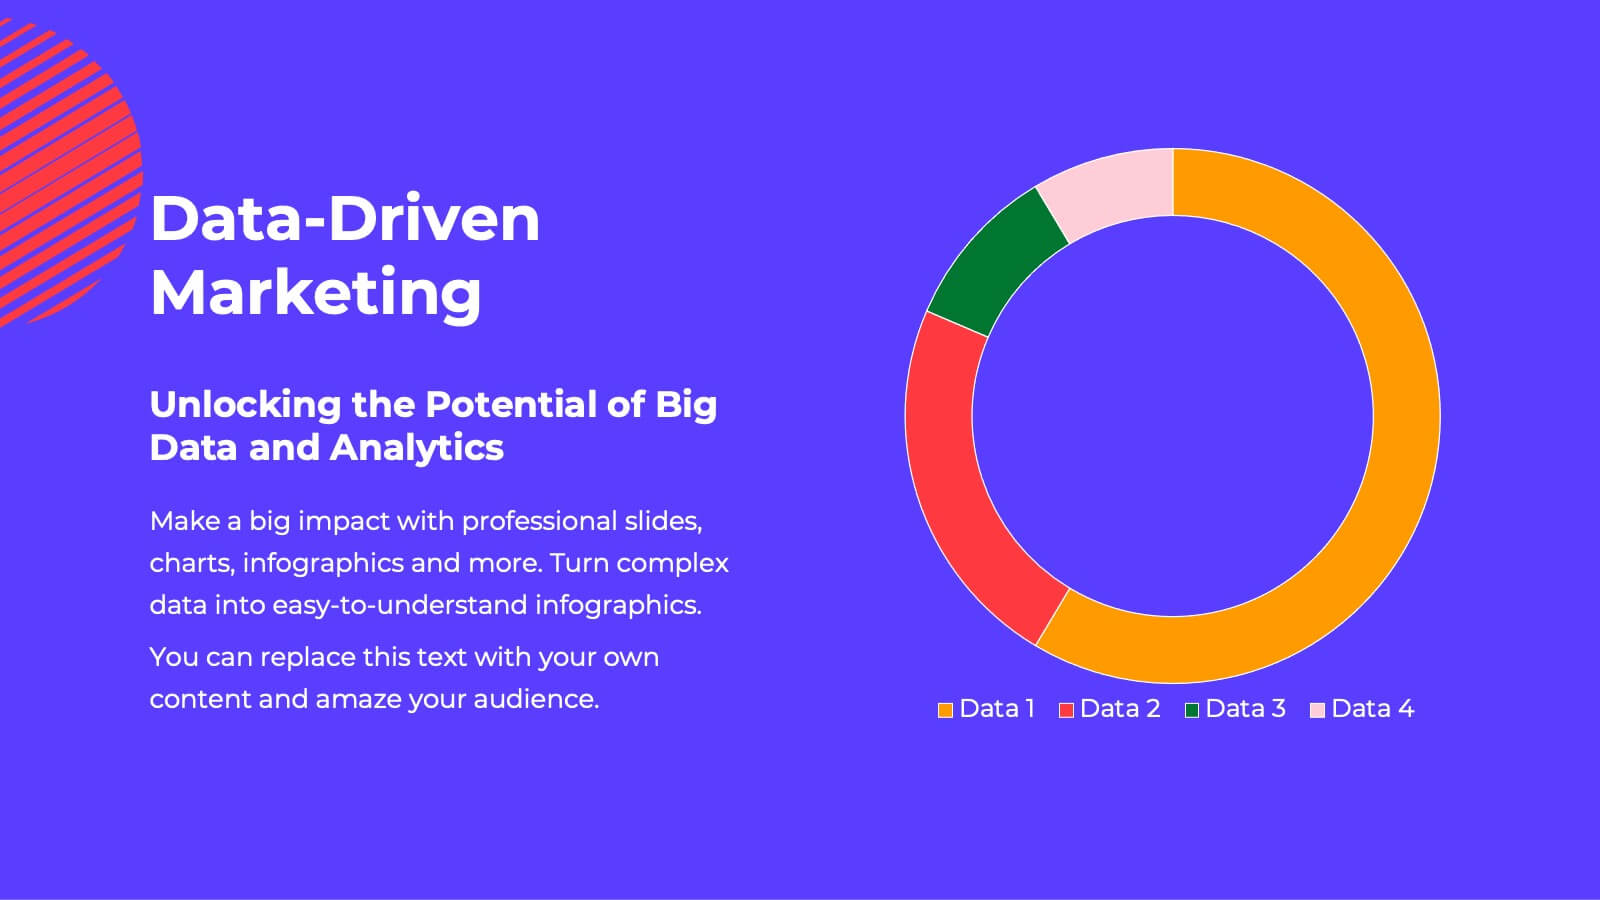
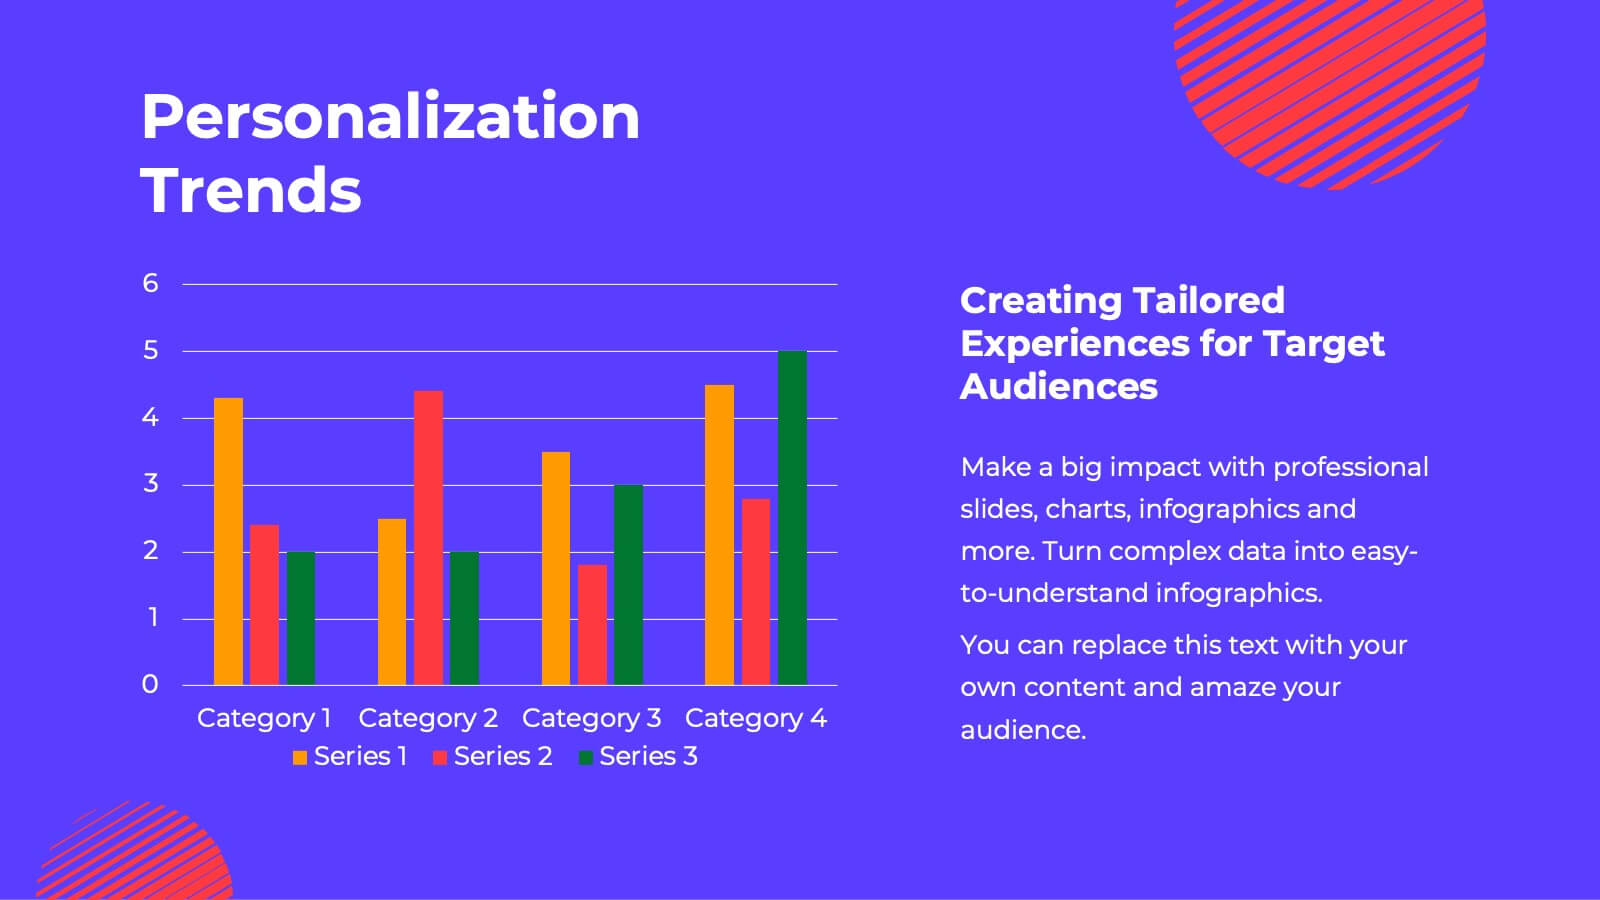
Data-Driven KPI Slide Presentation
Bring your data to life with a sharp, modern layout that turns complex metrics into clear, compelling visuals. This presentation helps you showcase performance insights, compare trends, and highlight key takeaways with ease. Fully customizable and compatible with PowerPoint, Keynote, and Google Slides.


22 slides
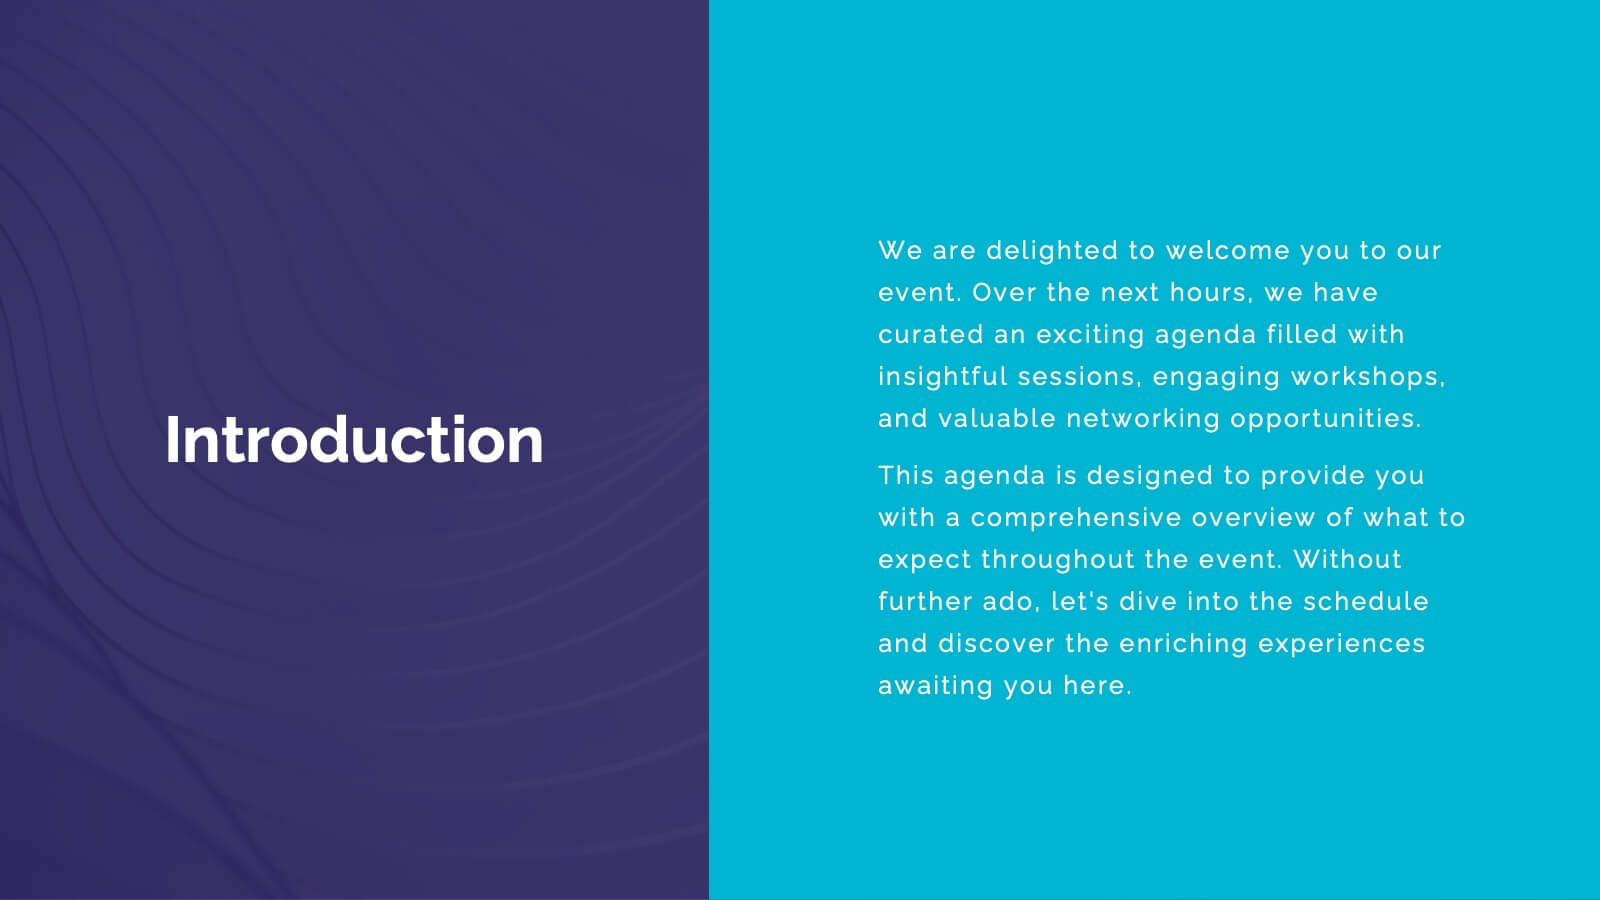
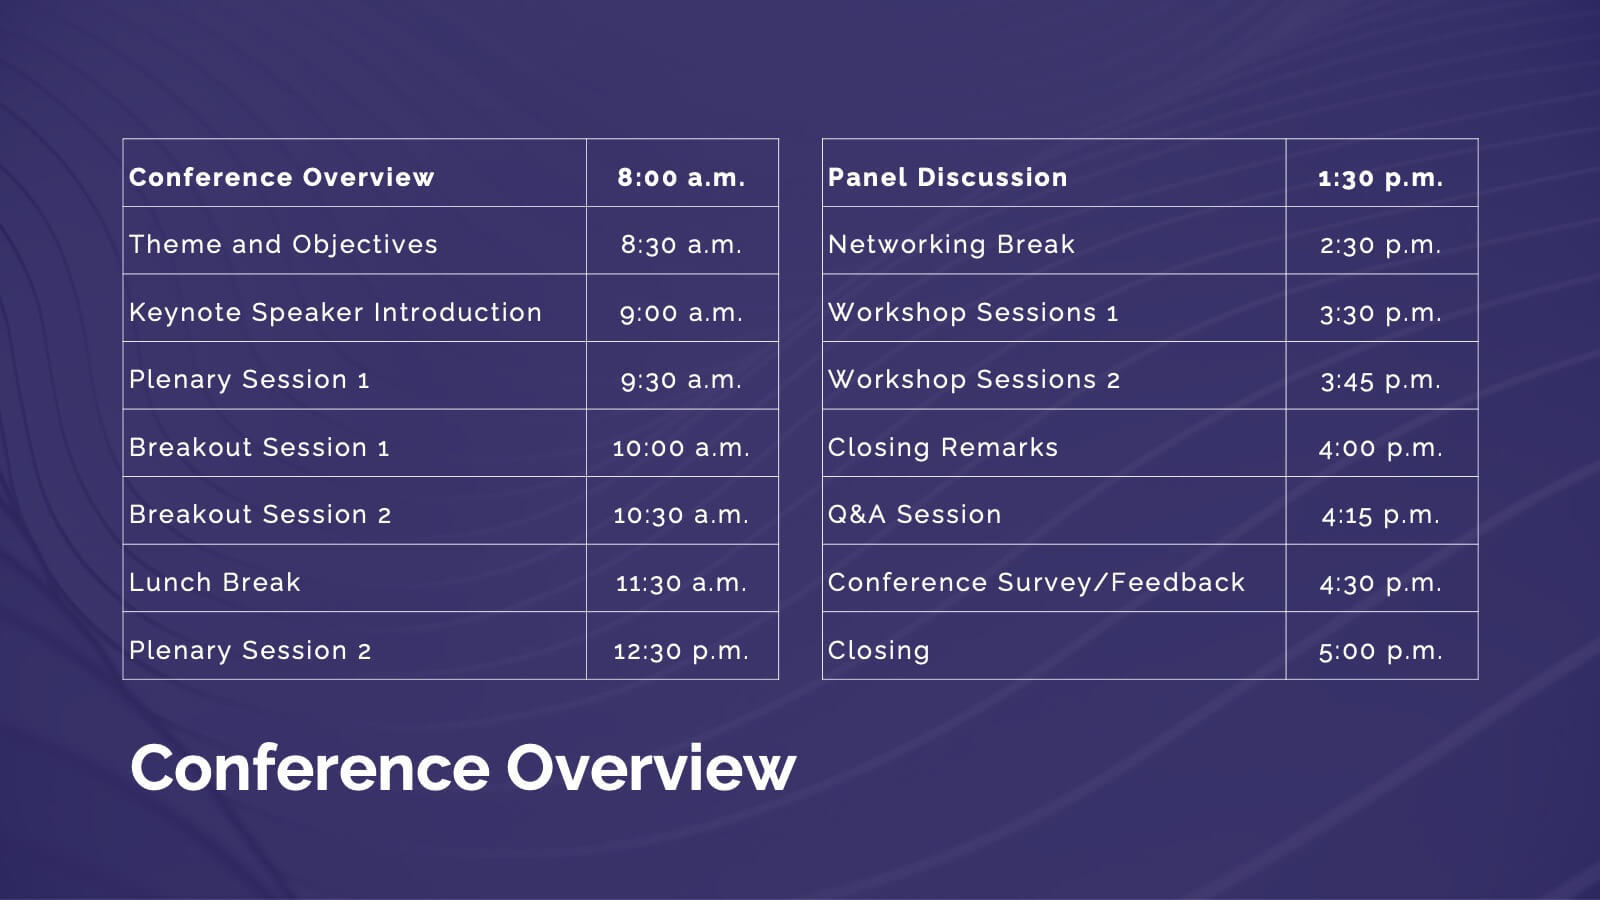
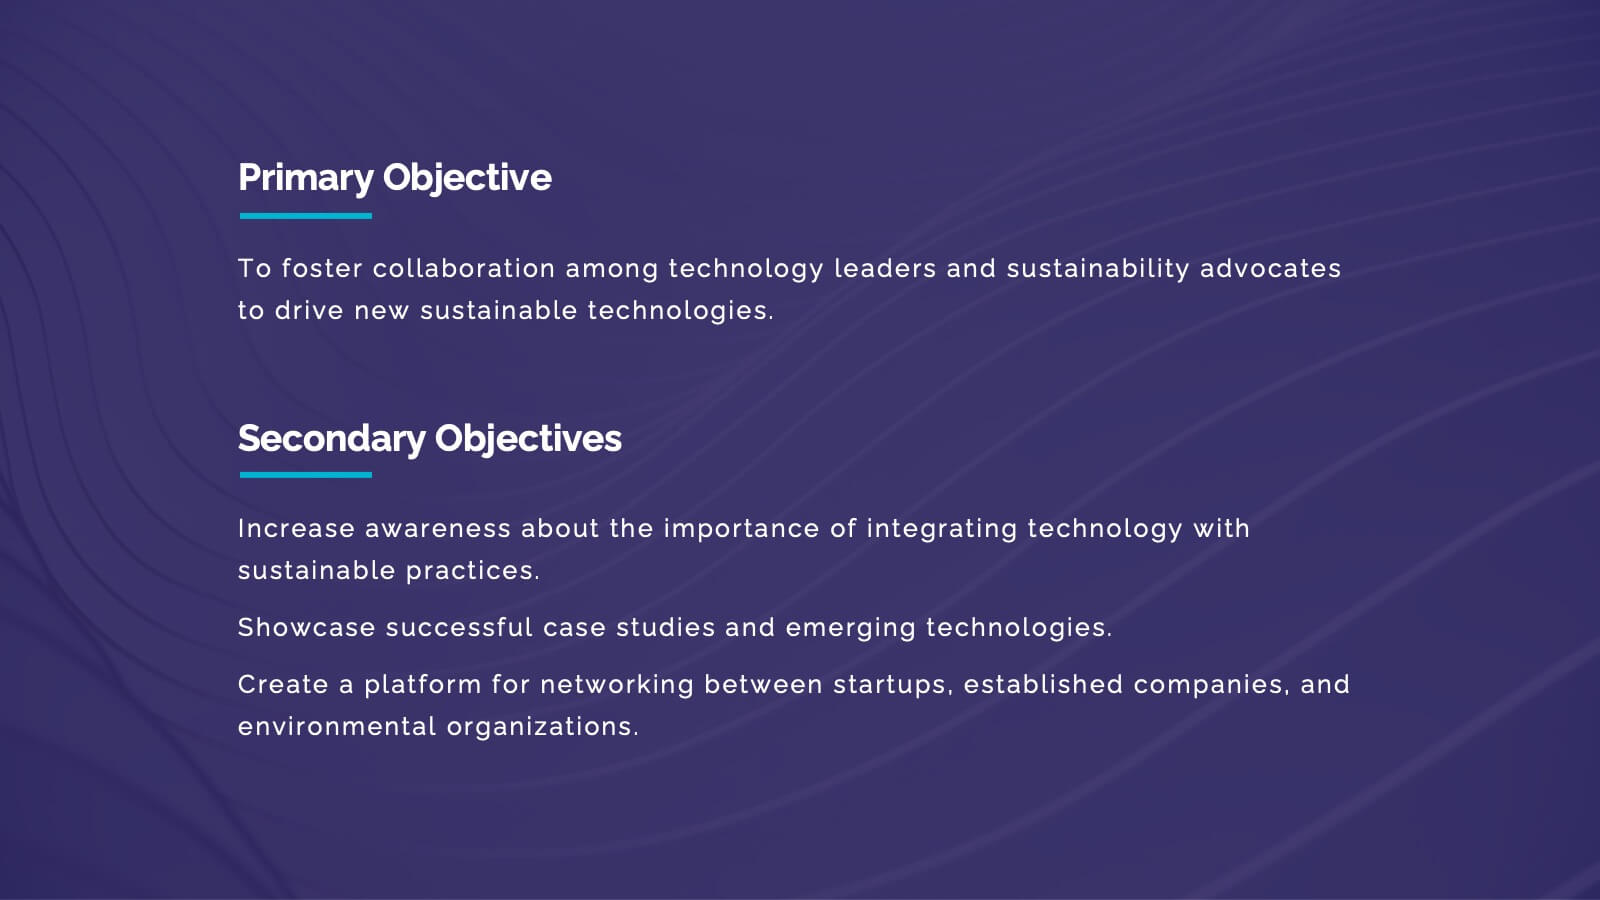
Nimbus Business Development Proposal Presentation
Boost your business presentations with this vibrant, professional template designed for business development proposals. Perfect for detailing conference overviews, themes, objectives, and keynotes, it features a clean and engaging layout. Highlight critical sessions and networking opportunities to captivate your audience. Compatible with PowerPoint, Keynote, and Google Slides, it ensures seamless presentations on any platform.


7 slides
Psychology Infographic Presentation Template
Featuring our psychology infographic template made to provide you with a beautiful presentation that includes all the necessary elements for learning about psychology. Present your research and analysis in a clear, informative and engaging way with this template. Use the theme to highlight the most important concepts in psychology and explain each one with interesting facts, statistics and charts. Use this template to show information about the main topics or areas of psychology. This template is compatible with powerpoint and fully customizable to meet all your requirements!