


Features
- 3 Unique slides
- Fully editable and easy to edit in Microsoft Powerpoint, Keynote and Google Slides
- 16:9 widescreen layout
- Clean and professional designs
- Export to JPG, PDF or send by email


Do you have any questions?
Recommend


4 slides
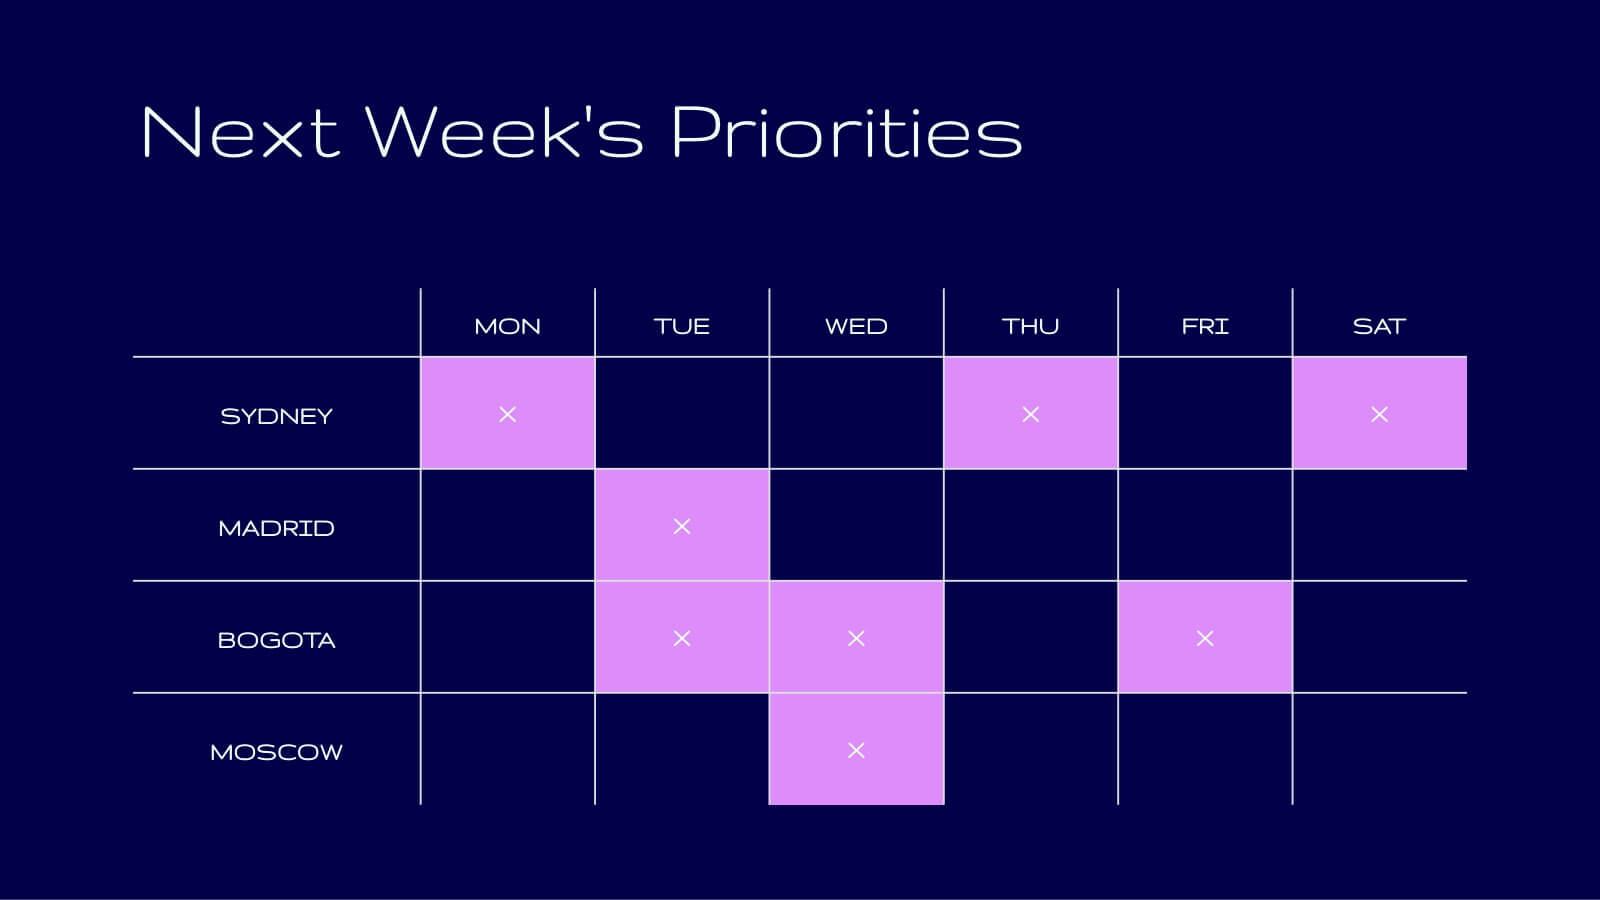
Skills Development Training Schedule Presentation
Organize learning paths with clarity using the Skills Development Training Schedule Presentation. This structured grid layout helps you map out training modules by skill category and timeline. Ideal for internal workshops, L&D planning, or certification programs. Fully editable in PowerPoint, Keynote, Google Slides, or Canva for seamless customization.


5 slides
Business Meeting Agenda and Planning Presentation
Make every meeting count with this clean and professional agenda timeline. Featuring five circular stages connected in a fluid path, this layout is ideal for breaking down meeting objectives, planning steps, or stakeholder discussions. Fully customizable and compatible with PowerPoint, Keynote, and Google Slides.


7 slides
Exponential Growth Infographic
Exponential growth refers to a process where a quantity grows at a consistent percentage rate per unit of time. This infographic template takes your audience on a visual expedition through the marvels of exponential expansion, turning complex data into a clear and engaging narrative. Compatible with Powerpoint, Keynote, and Google Slides. This features dynamic visuals like ascending graphs and vibrant charts, this infographic embodies the essence of exponential growth, making this come alive. Showcase the growth trajectory using ascending line graphs or bar charts, visually representing the skyrocketing growth in a way that's easy to comprehend.


6 slides
Professional Meeting Agenda Presentation
Plan your meetings with clarity and structure using the Professional Meeting Agenda Presentation. This clean, 5-step layout visually organizes agenda items alongside bold numbers and relevant icons to guide discussion. Perfect for team syncs, business reviews, or project briefings. Fully customizable in PowerPoint, Keynote, and Google Slides.


5 slides
Renewable Natural Energy Resources Infographics
Renewable natural energy resources, also known as renewable energy sources, are energy sources that are replenished naturally and sustainably. These vertical infographics serve as educational tools to promote awareness and understanding of renewable energy sources. They can be used in presentations, workshops, educational materials, or sustainability initiatives to inspire individuals, organizations, and communities to embrace and invest in renewable energy for a greener and more sustainable future. They are fully customizable and compatible with Powerpoint, Keynote, and Google Slides.


5 slides
Supply Chain Management Plan Presentation
Streamline your presentation with a sleek and organized design built to illustrate process flow and logistics. Perfect for explaining production stages, delivery systems, or business operations, this visual layout brings clarity and structure to your message. Compatible with PowerPoint, Keynote, and Google Slides for effortless customization and use.


5 slides
Circular Wheel for Process Flow Presentation
Visualize your workflow with clarity using this 5-step circular process diagram. Perfect for illustrating continuous improvement, feedback loops, or operational stages. Each segment is color-coded and numbered for easy navigation and understanding. Fully editable in PowerPoint, Keynote, and Google Slides—customize icons, colors, and text to suit your message.


20 slides
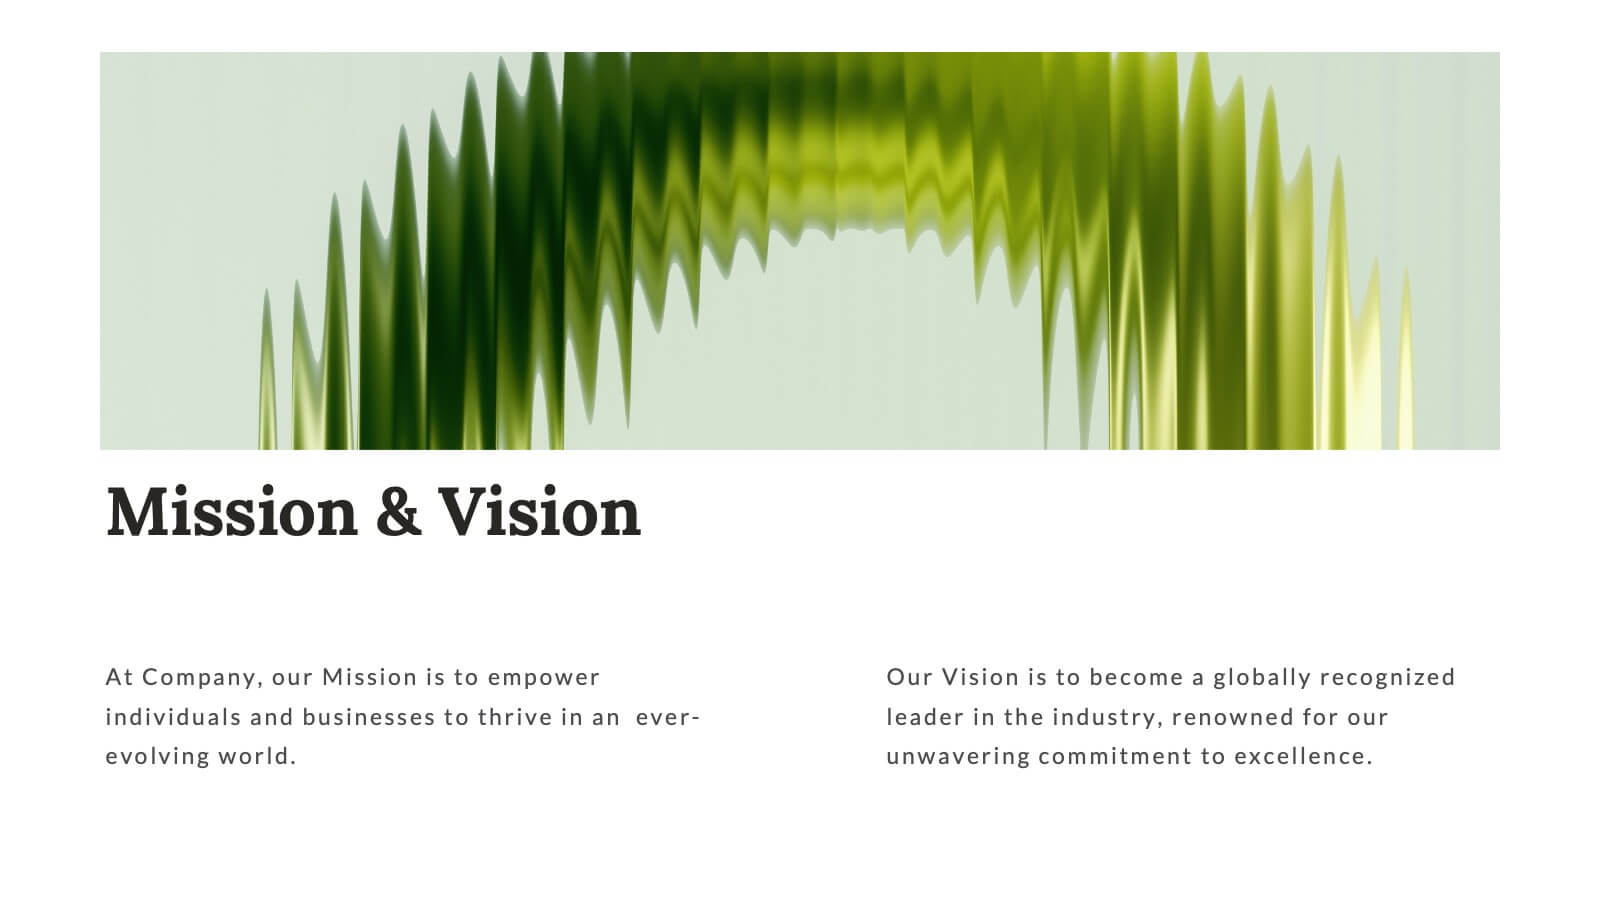
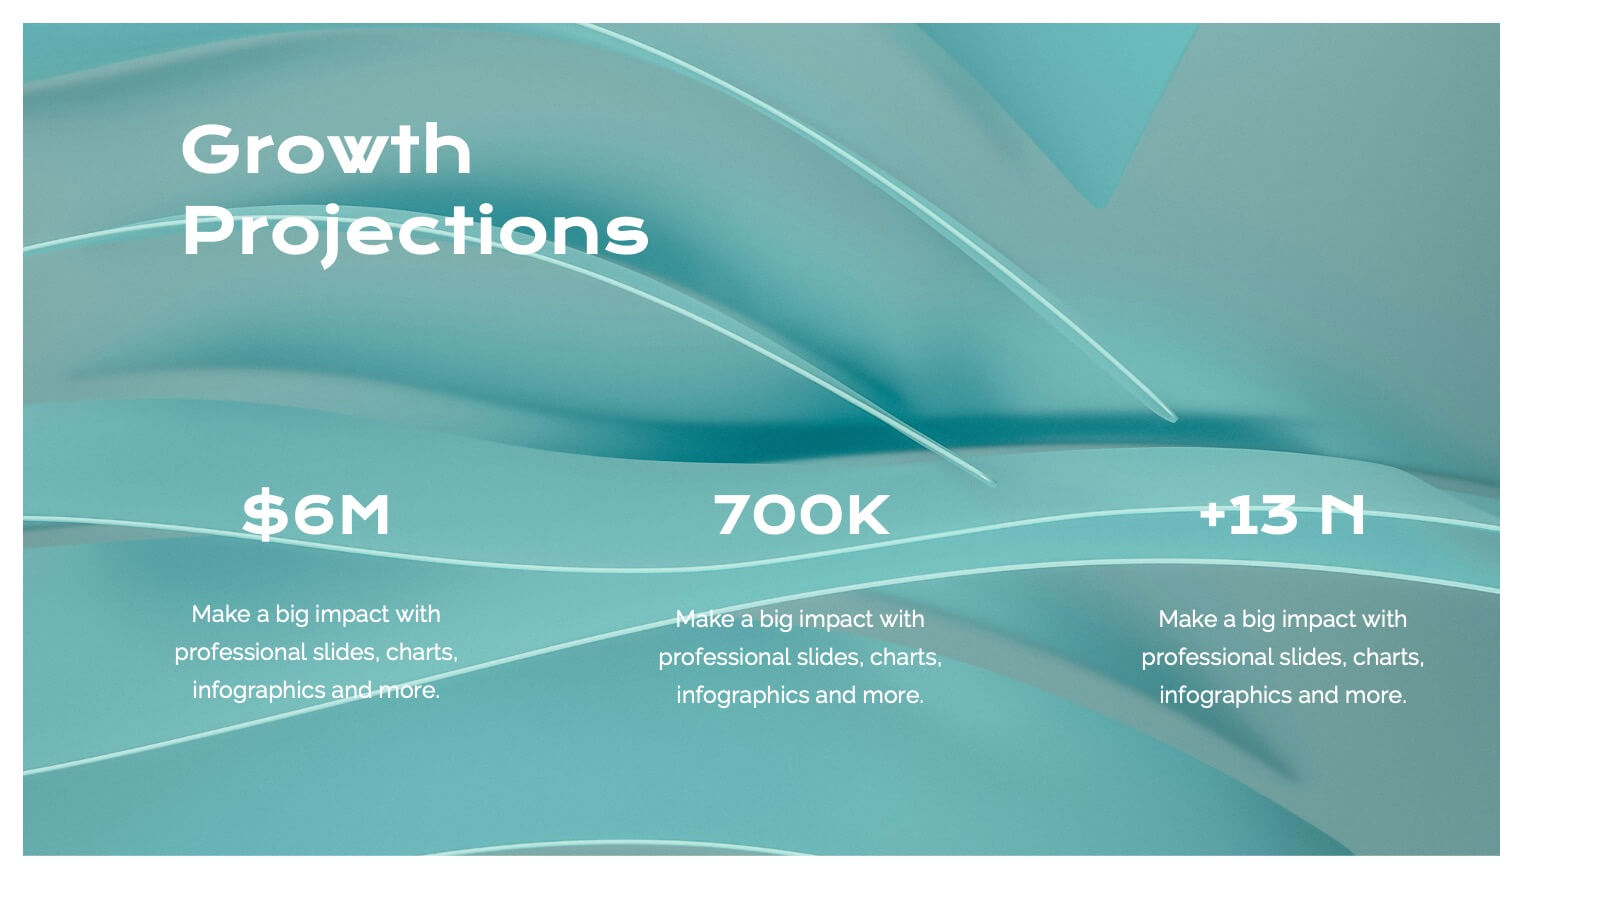
Whirlwind Startup Funding Proposal Presentation
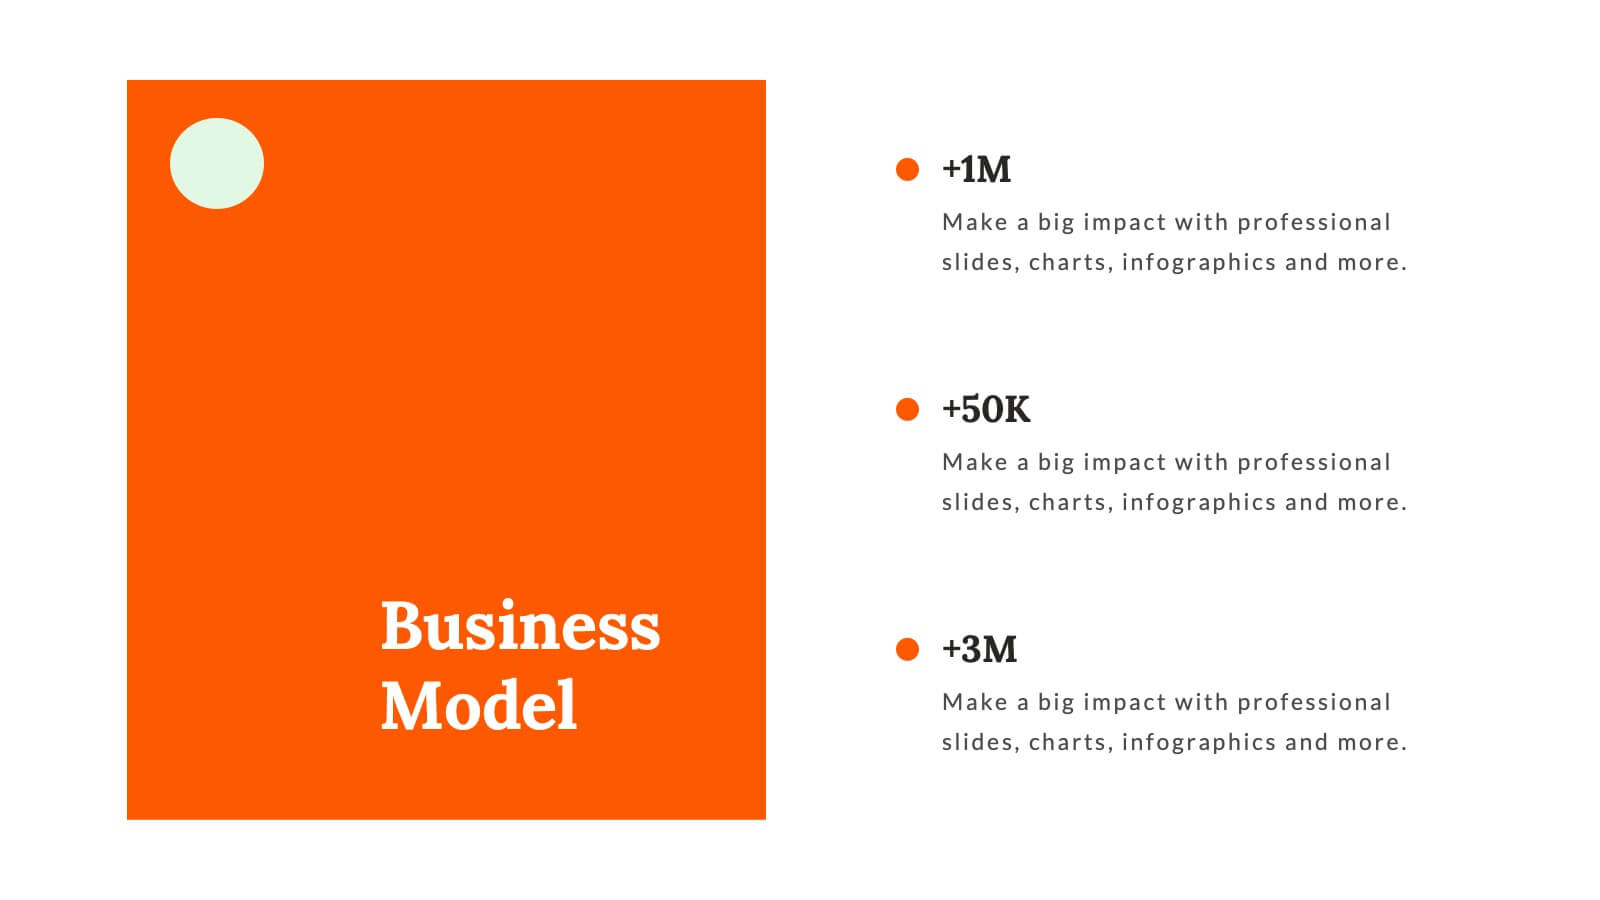
Transform your startup funding proposals with this vibrant and professional template. Designed to impress potential investors, it features sections for mission & vision, founding story, market analysis, and financial overview. Highlight your unique value proposition and business model with clarity and style. This template is compatible with PowerPoint, Keynote, and Google Slides, ensuring seamless presentations on any platform. Perfect for conveying your innovative ideas and growth plans effectively.


4 slides
Corporate Hierarchy Levels Diagram Presentation
Visualize organizational structures clearly with this Corporate Hierarchy Levels Diagram Presentation. Designed for showcasing leadership flow, team divisions, or reporting relationships, each slide features a simple tiered layout with editable icons and placeholders. Great for business planning, team introductions, or org chart overviews. Fully customizable in PowerPoint, Keynote, Canva, and Google Slides.
21 slides
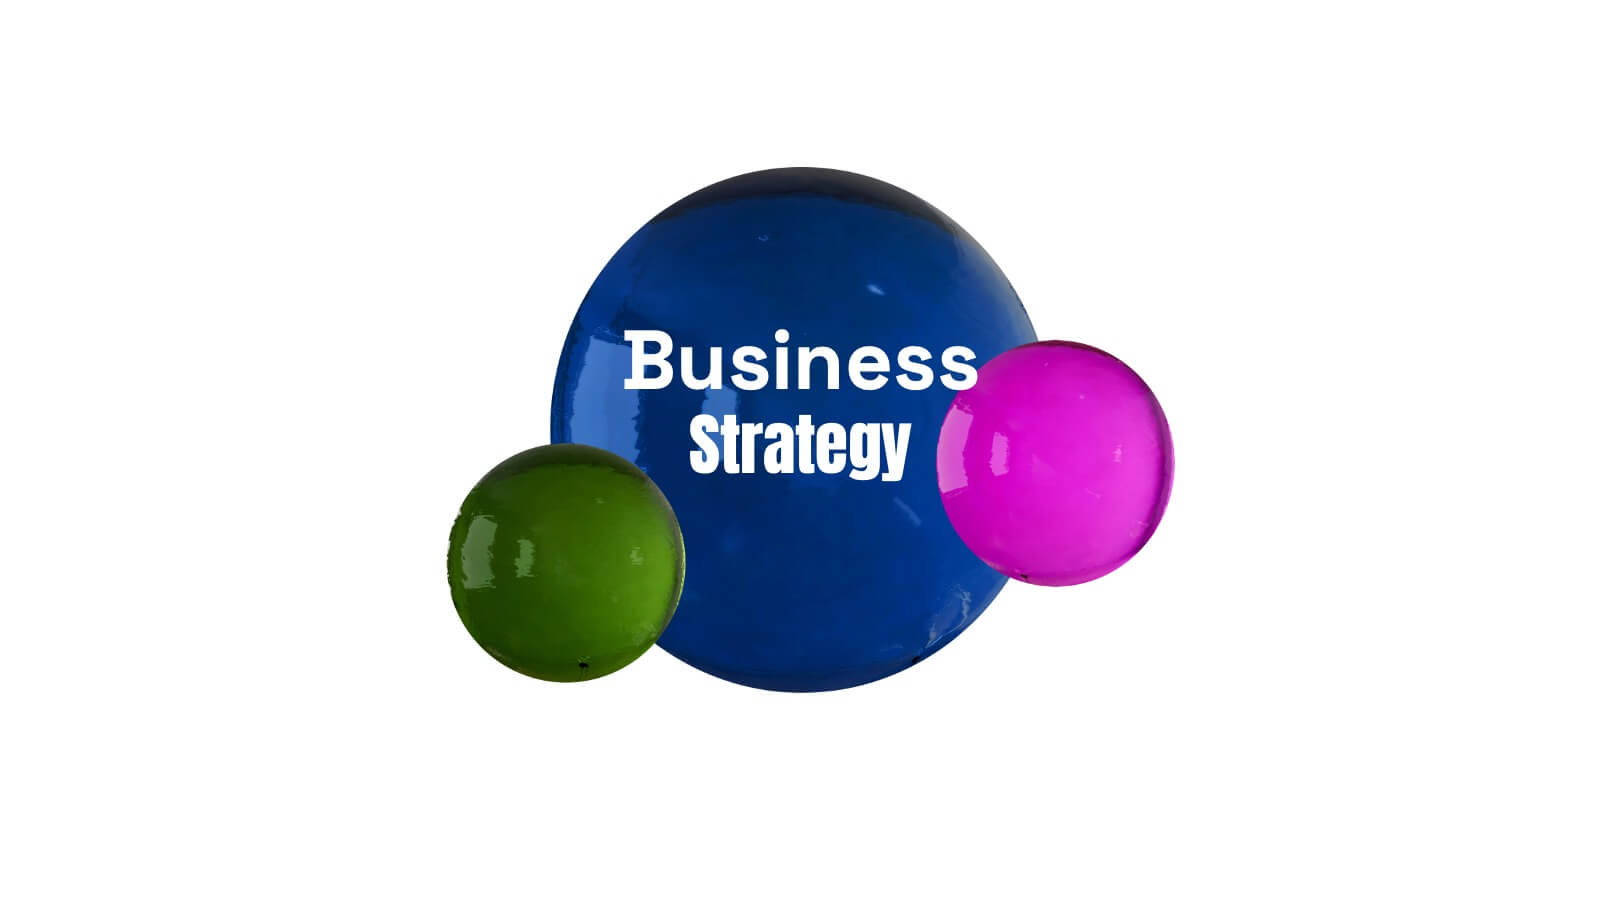
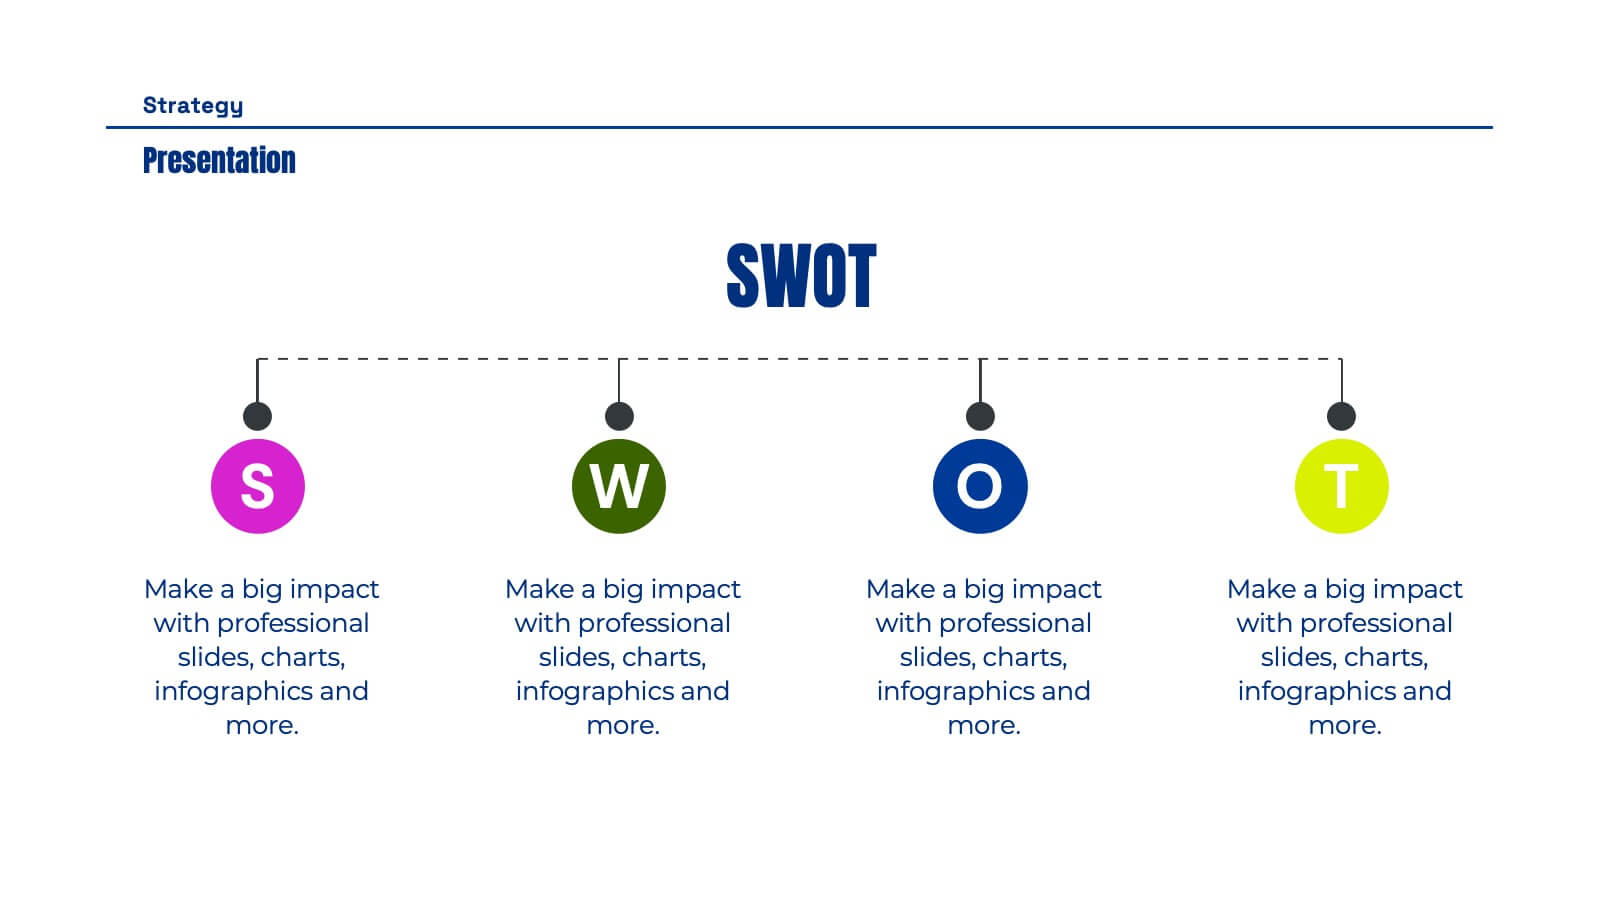
Ops Business Strategy Presentation
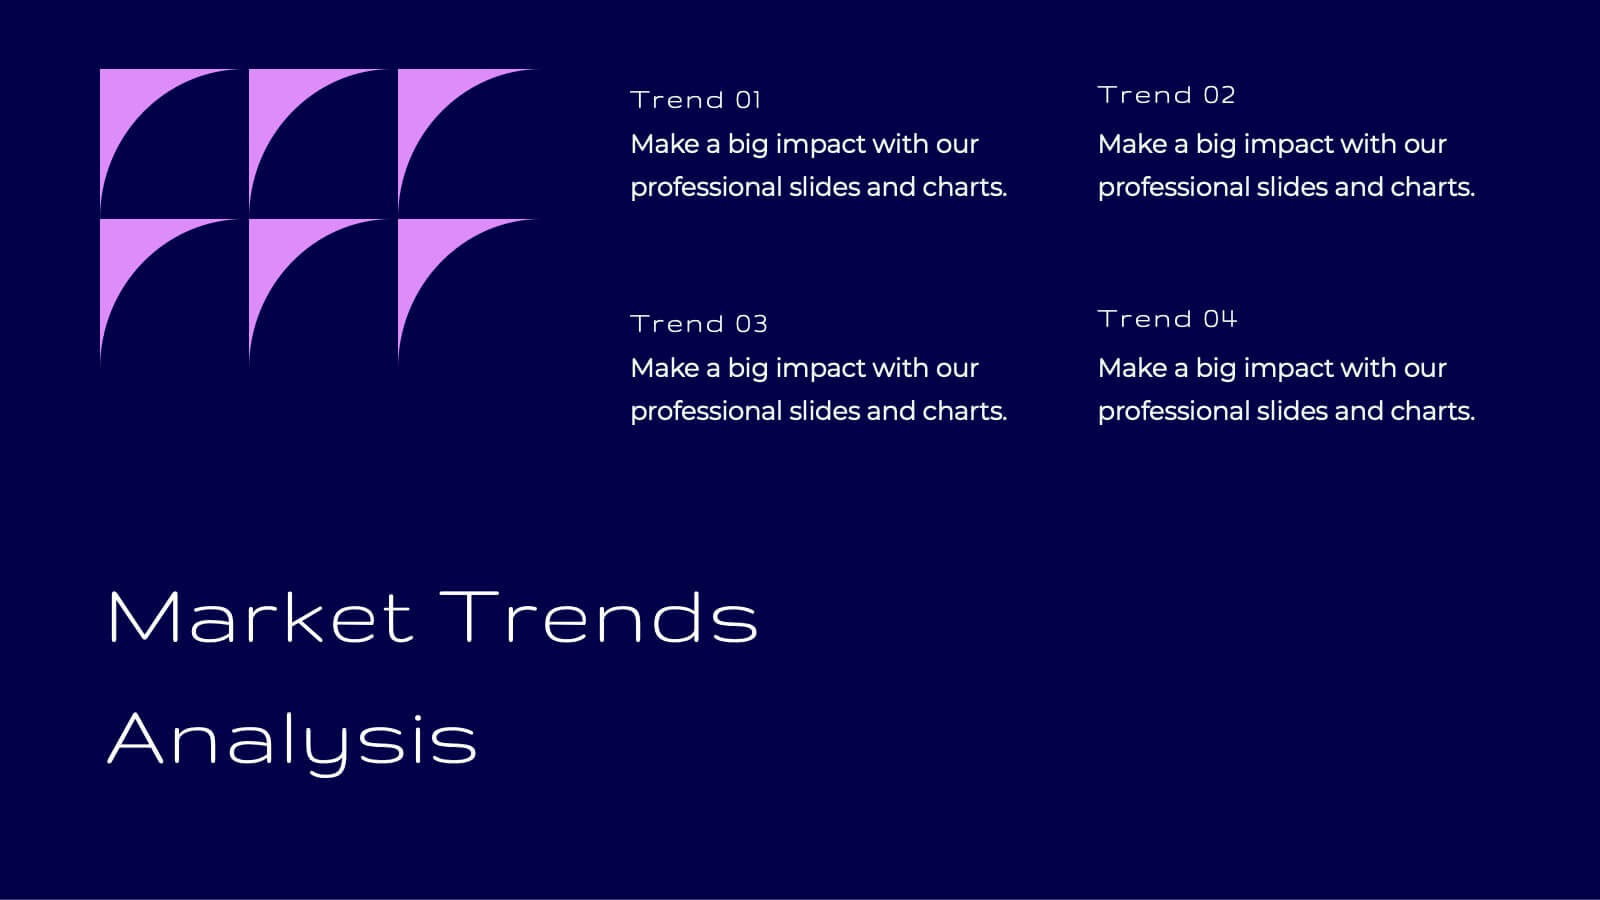
Set your strategy in motion with this dynamic, visually striking presentation template! Perfect for conveying key business insights like competitive analysis, market trends, and strategic objectives, it helps organize your plan for success. Each slide focuses on clarity and effectiveness, making it ideal for impactful presentations. Compatible with PowerPoint, Keynote, and Google Slides for effortless use across platforms.


7 slides
Half Year Survey Results Infographic
Evaluating progress mid-year is essential for adapting and thriving. Our half-year survey results infographic, painted in vibrant hues of orange and blue, transforms raw data into visually appealing insights. Whether it's customer feedback, employee performance, or market trends, this template makes understanding findings both effortless and impactful. Ideal for business managers, data analysts, market researchers, and educators, it's designed to communicate complex survey results in an easily digestible manner. Fully compatible with PowerPoint, Keynote, and Google Slides, it's your companion for dynamic presentations that resonate and inform.


22 slides
Tidal Research Findings Report Presentation
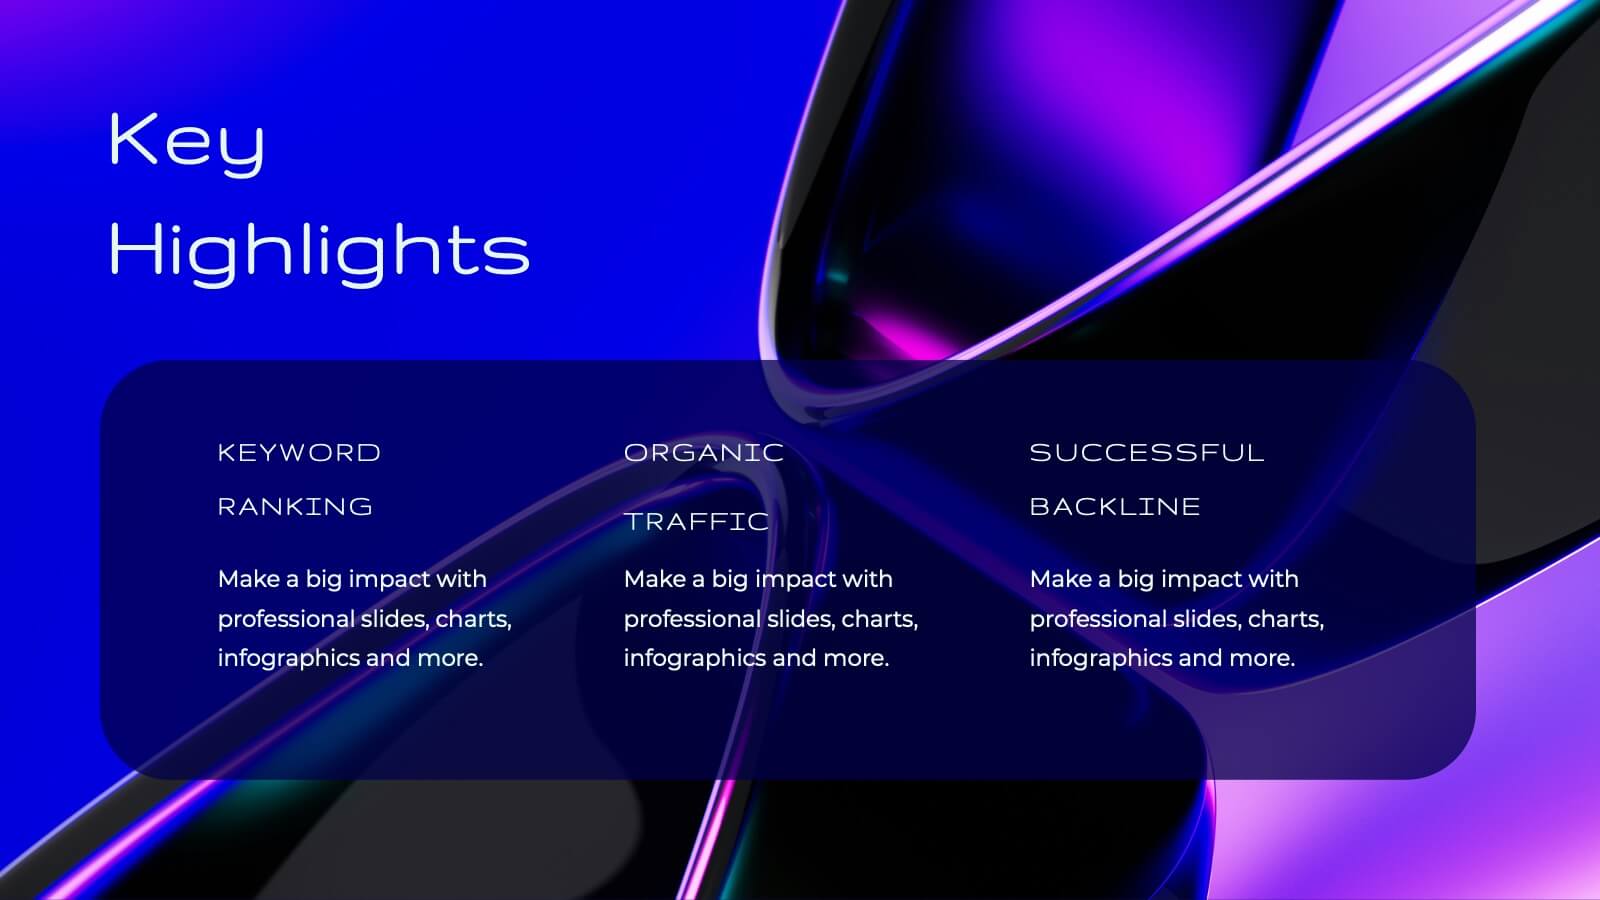
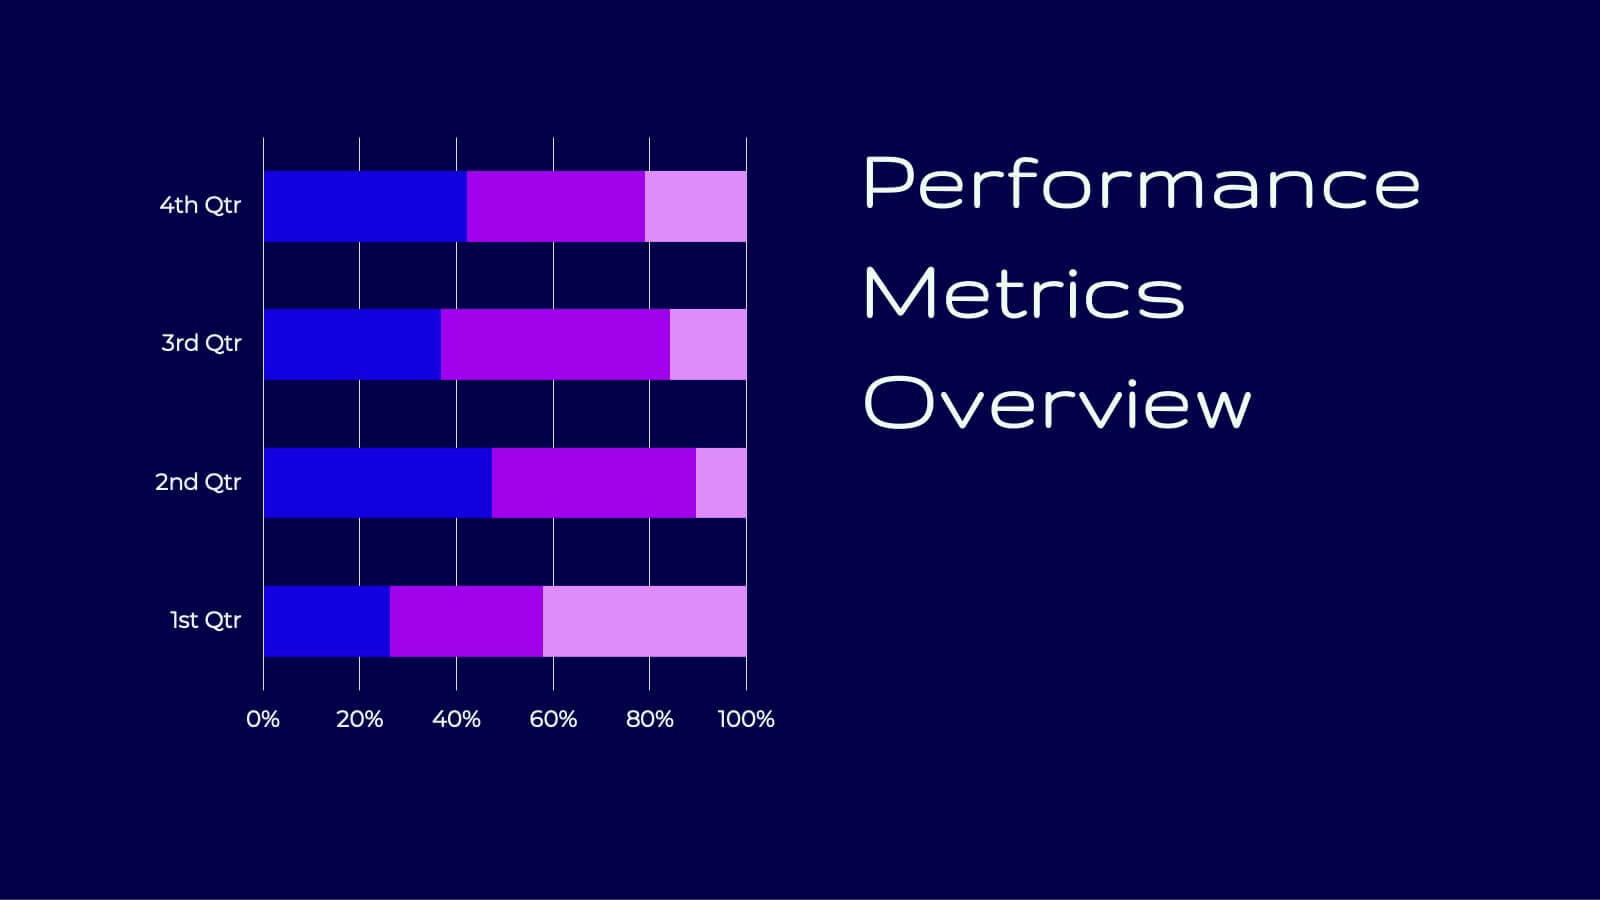
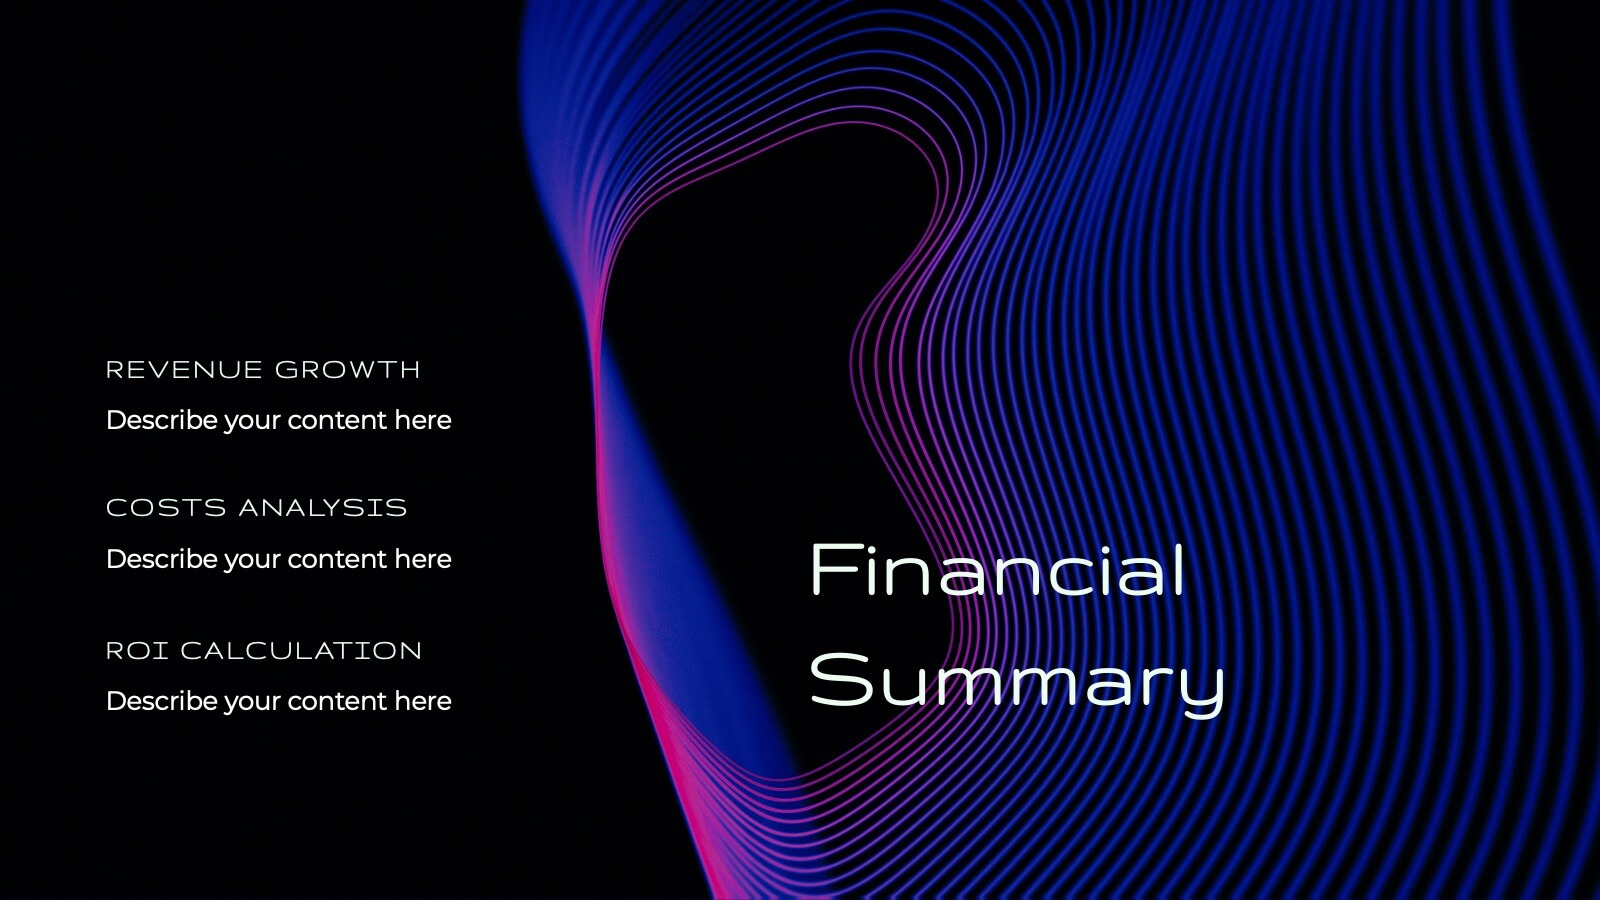
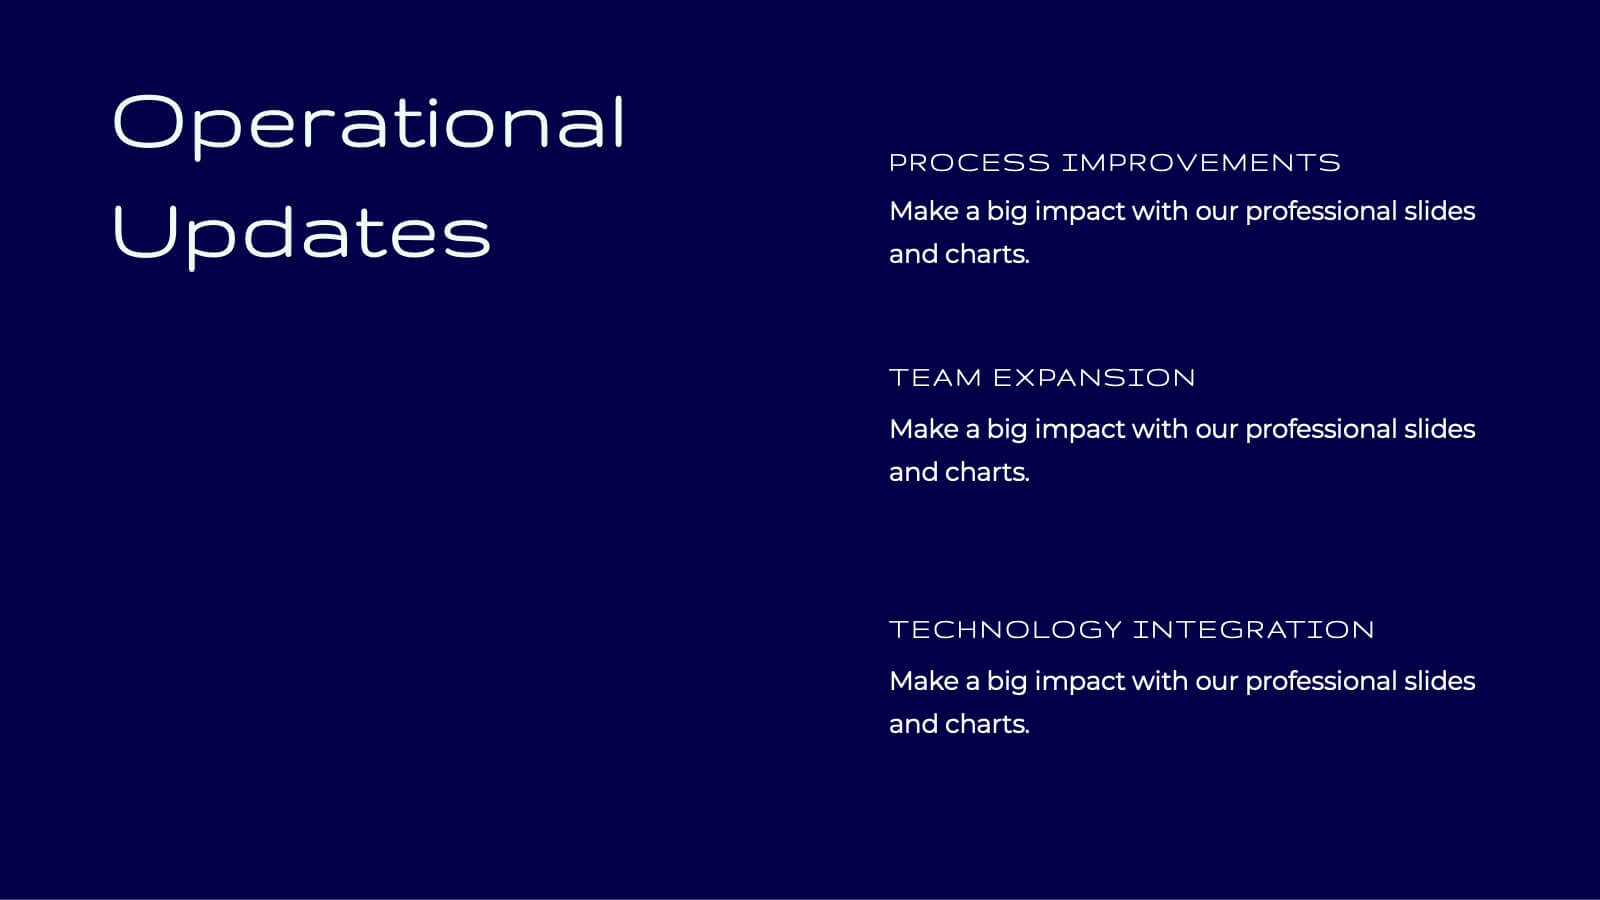
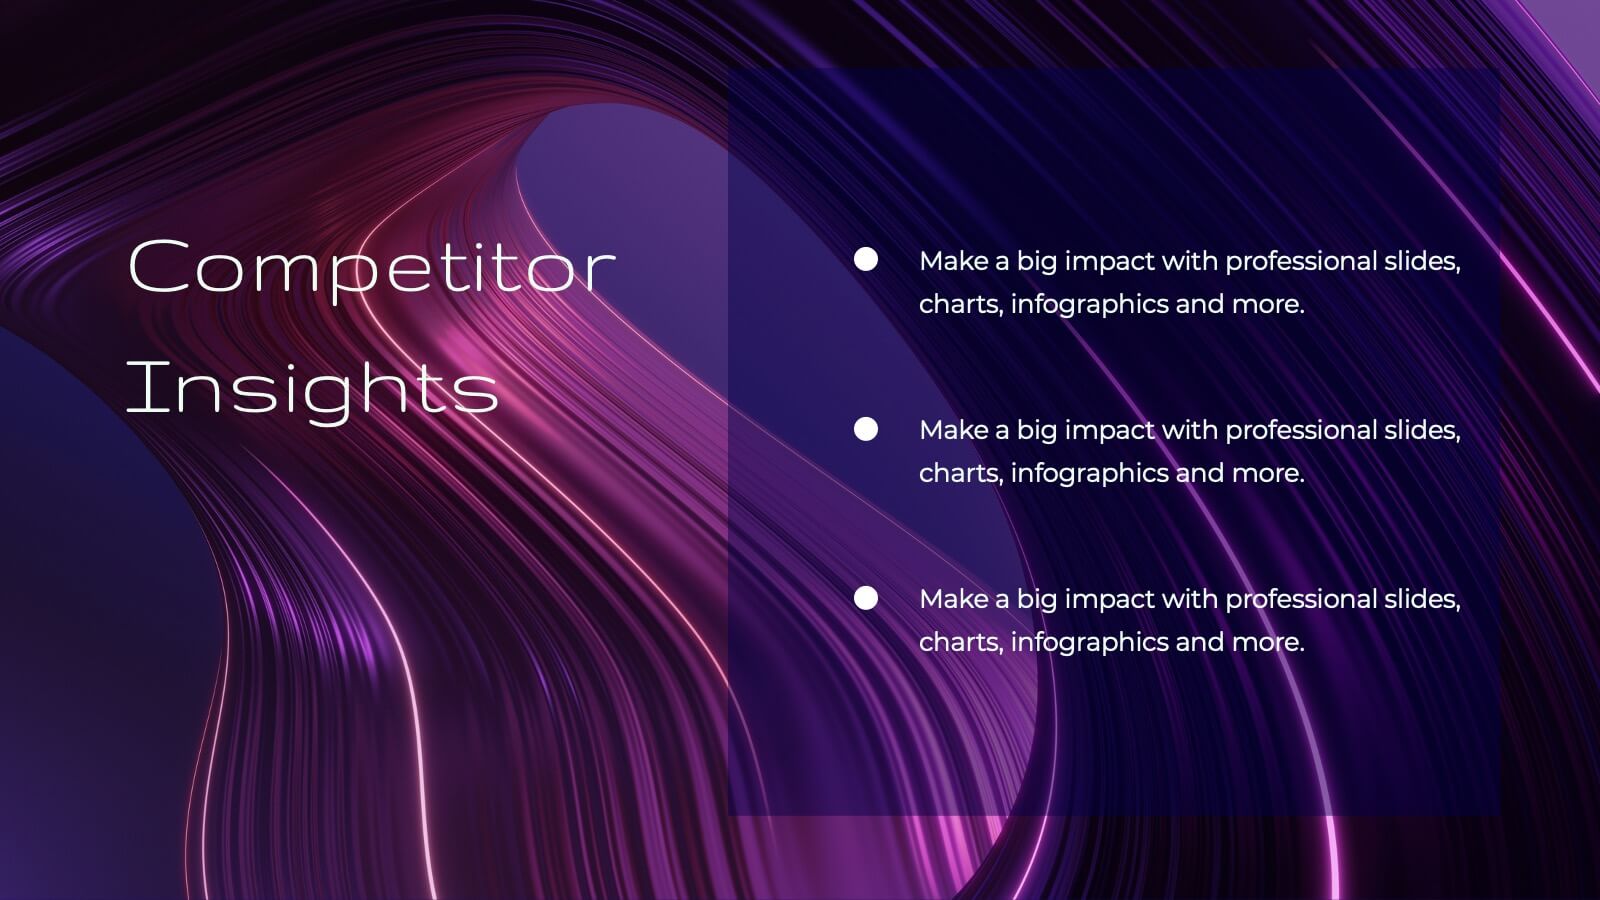
Deliver your research findings with impact using this sleek and modern report template! It covers key highlights, performance metrics, project progress, and competitor insights, making it ideal for clear, professional presentations. Perfect for summarizing challenges, solutions, and strategic initiatives. Compatible with PowerPoint, Keynote, and Google Slides for seamless reporting.


21 slides
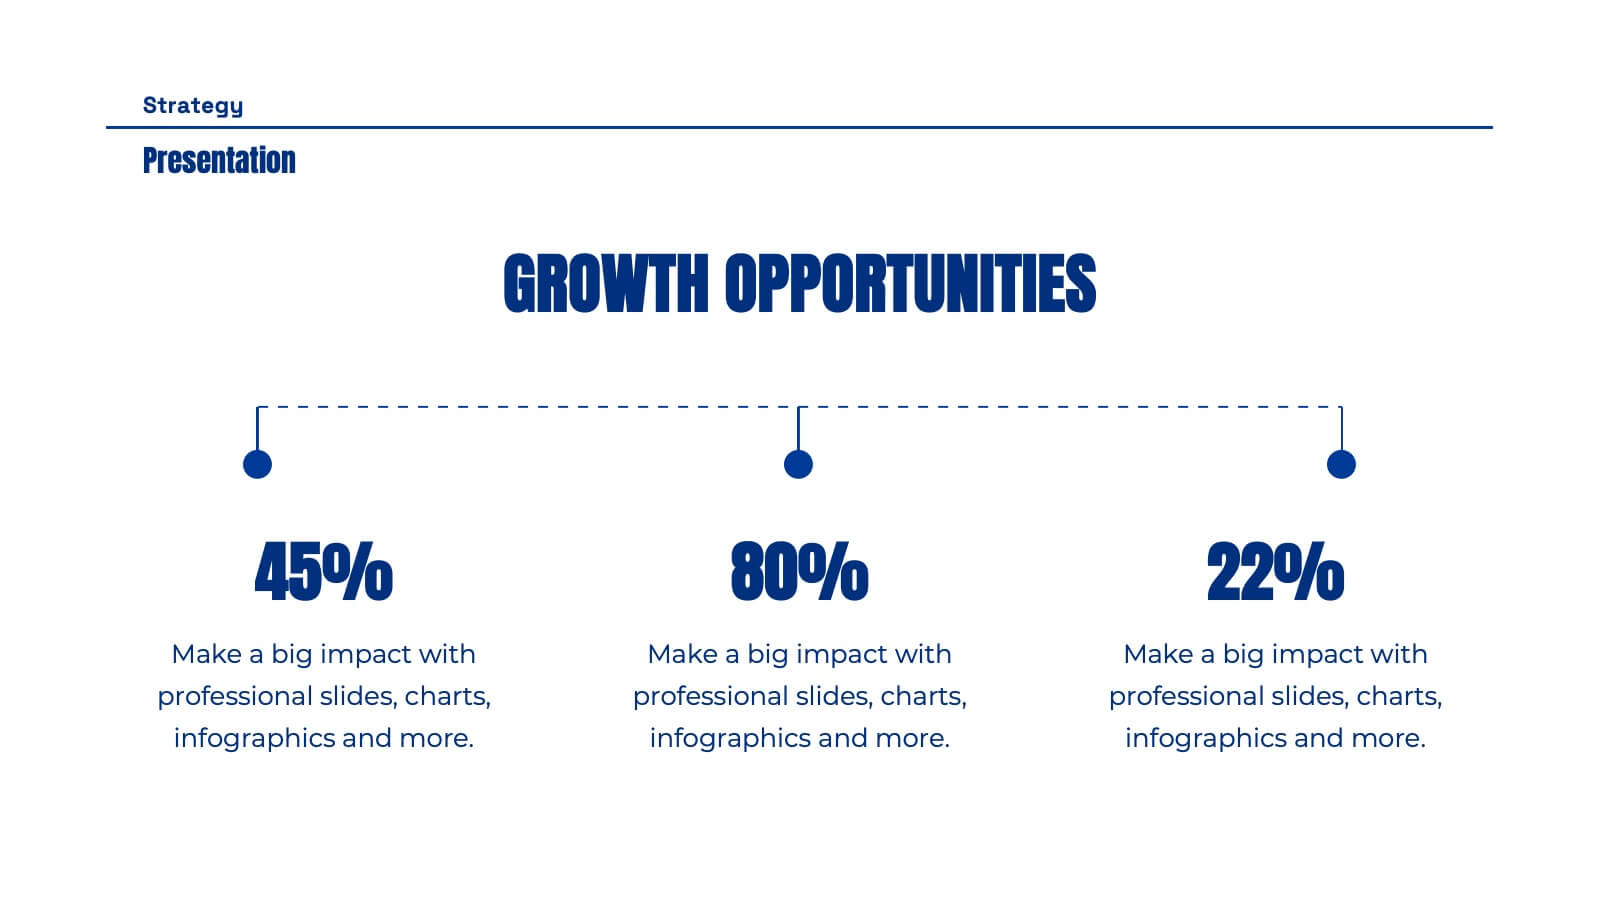
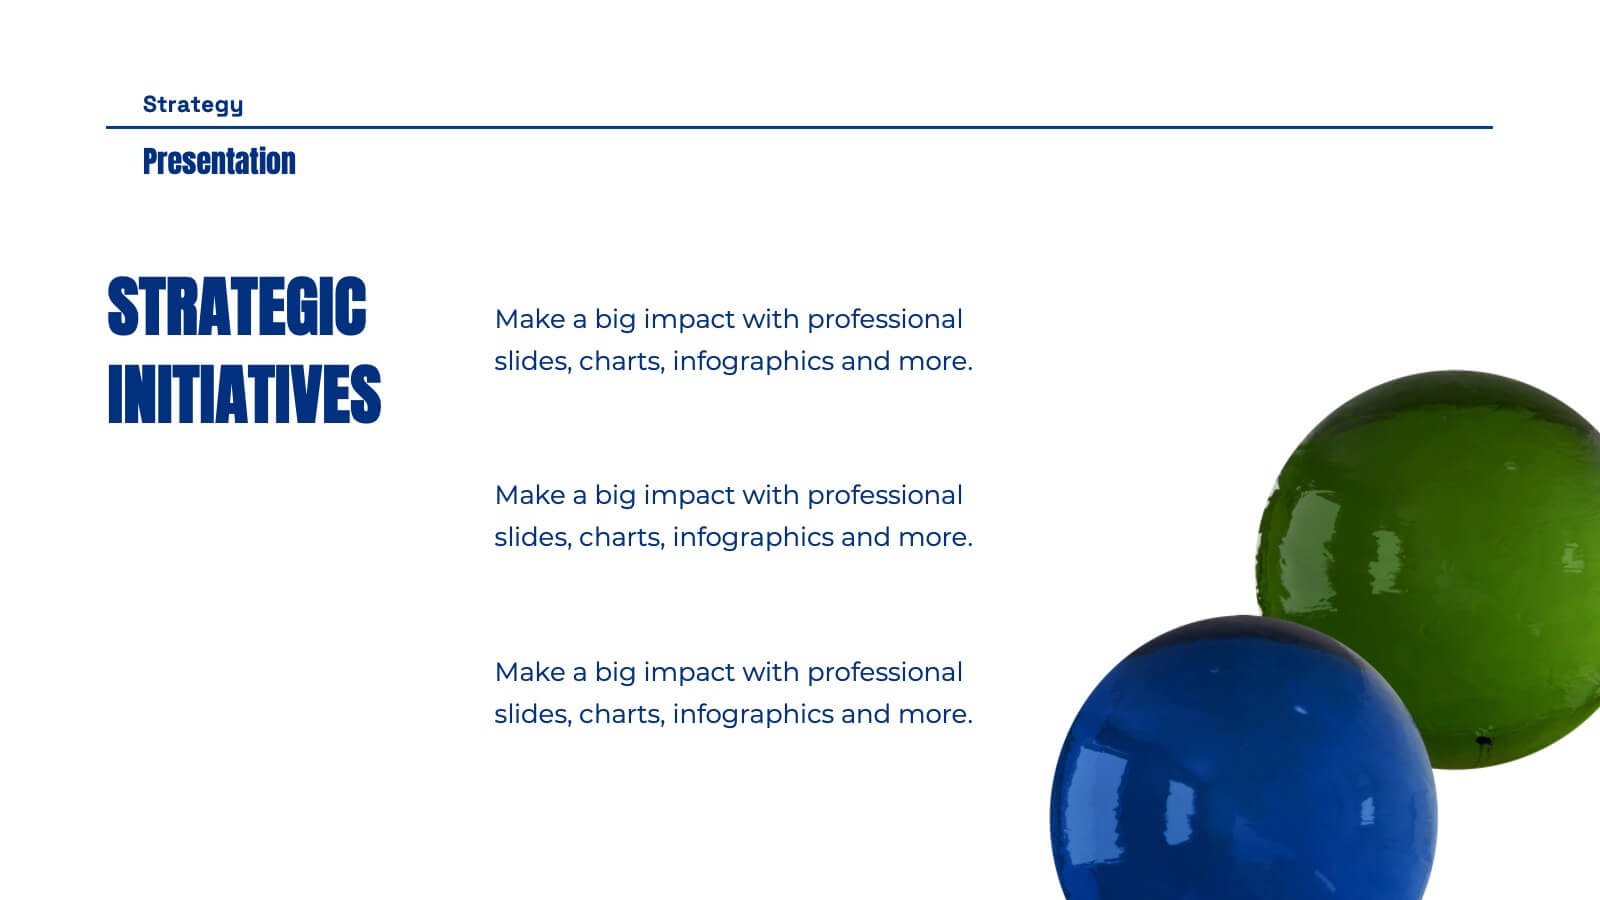
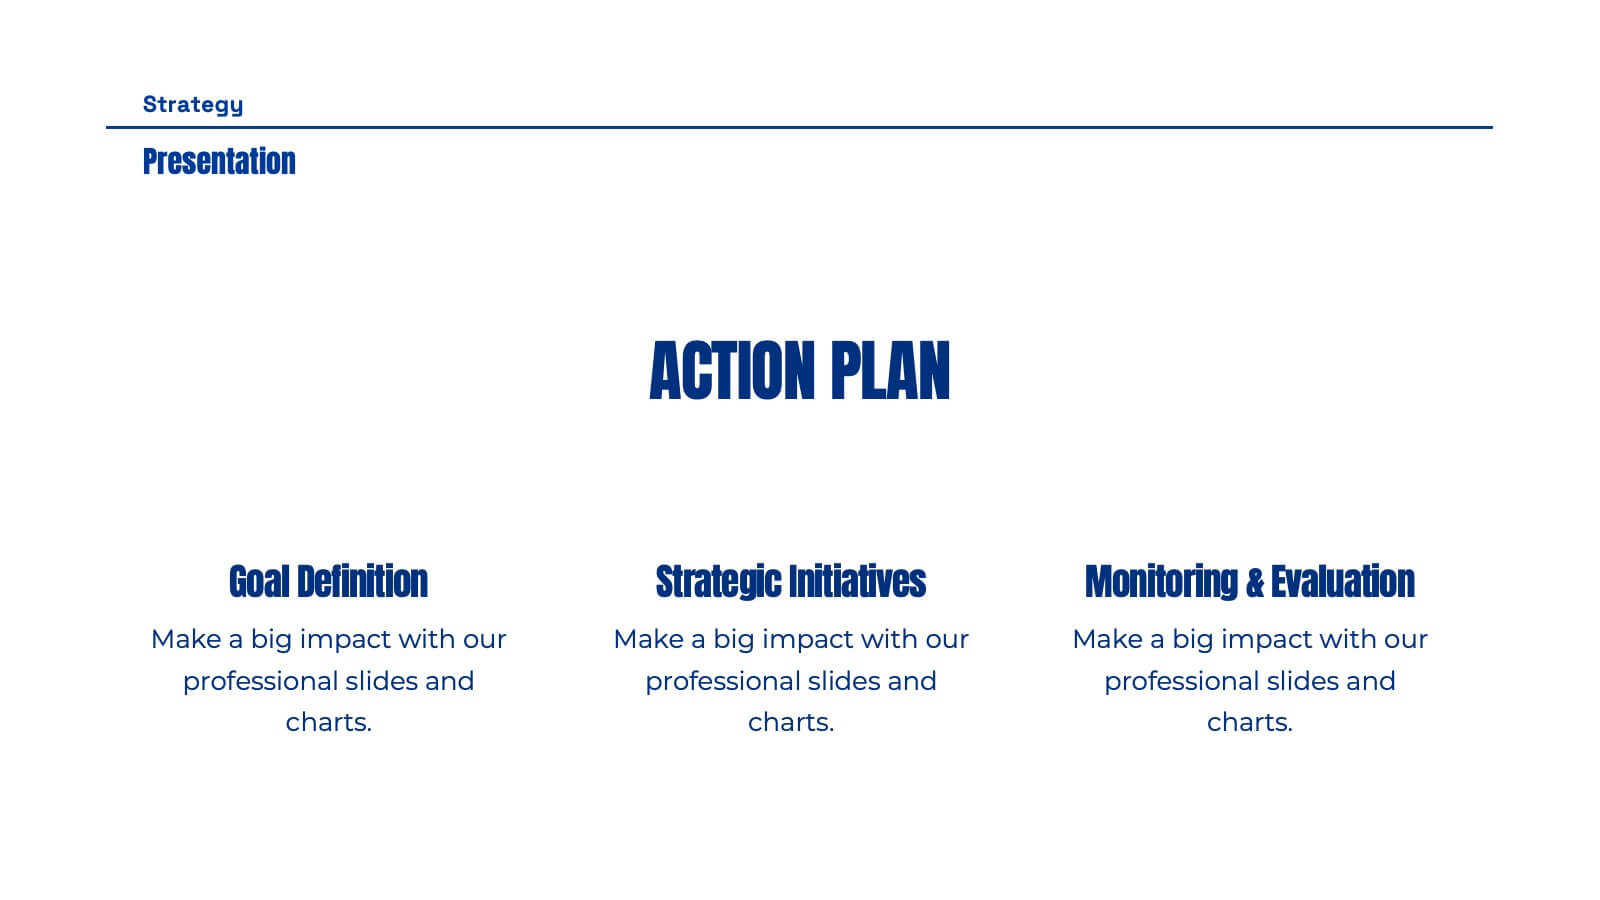
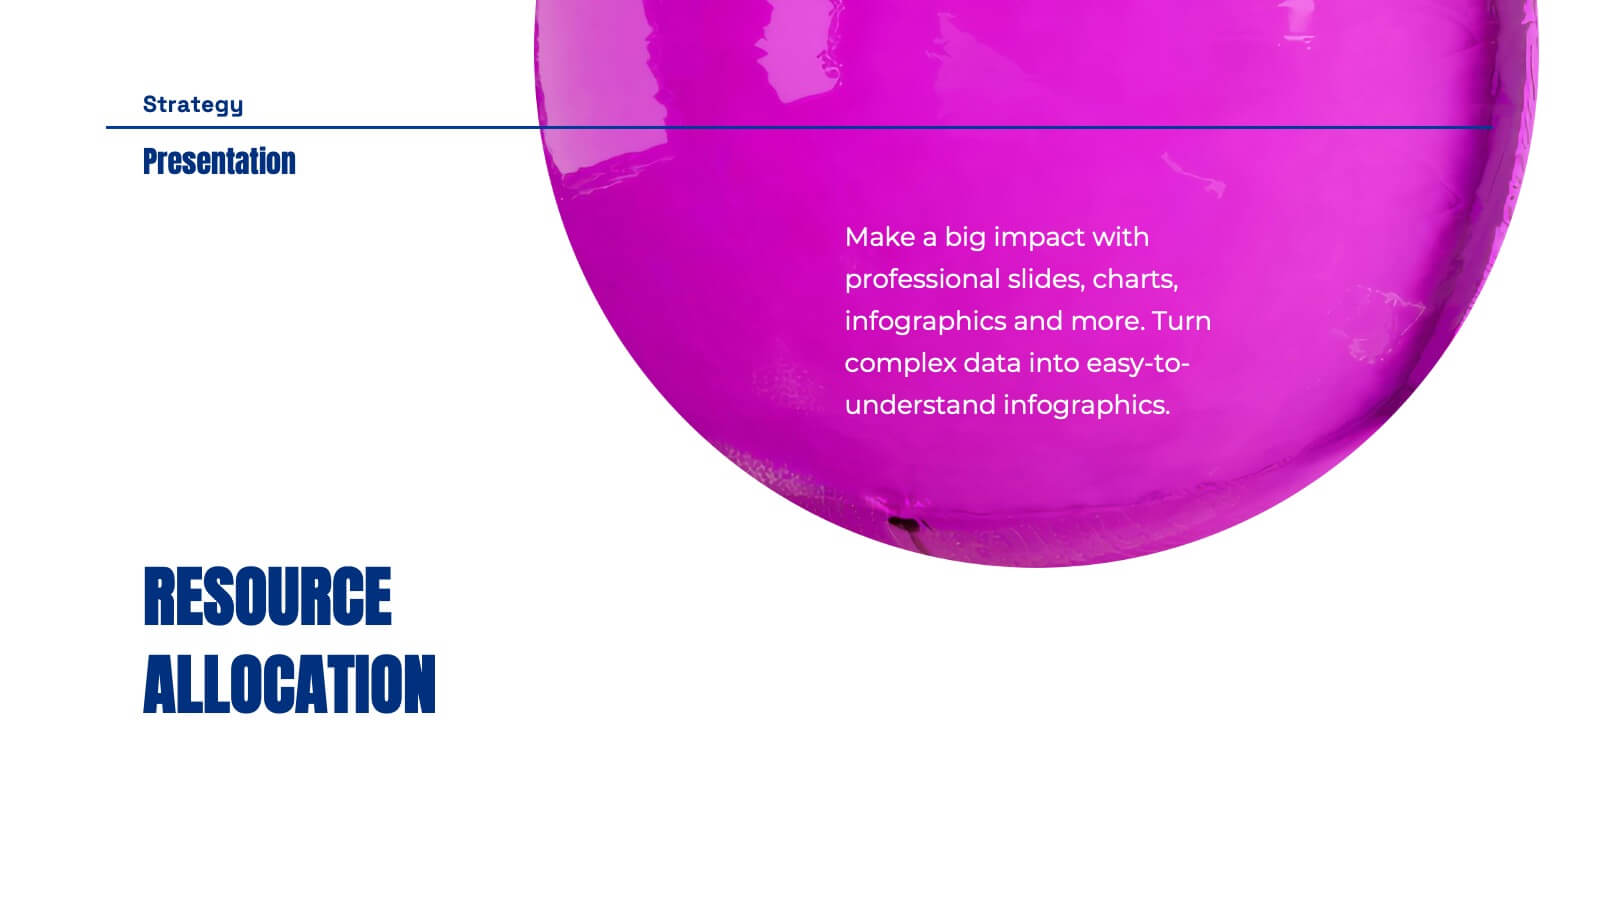
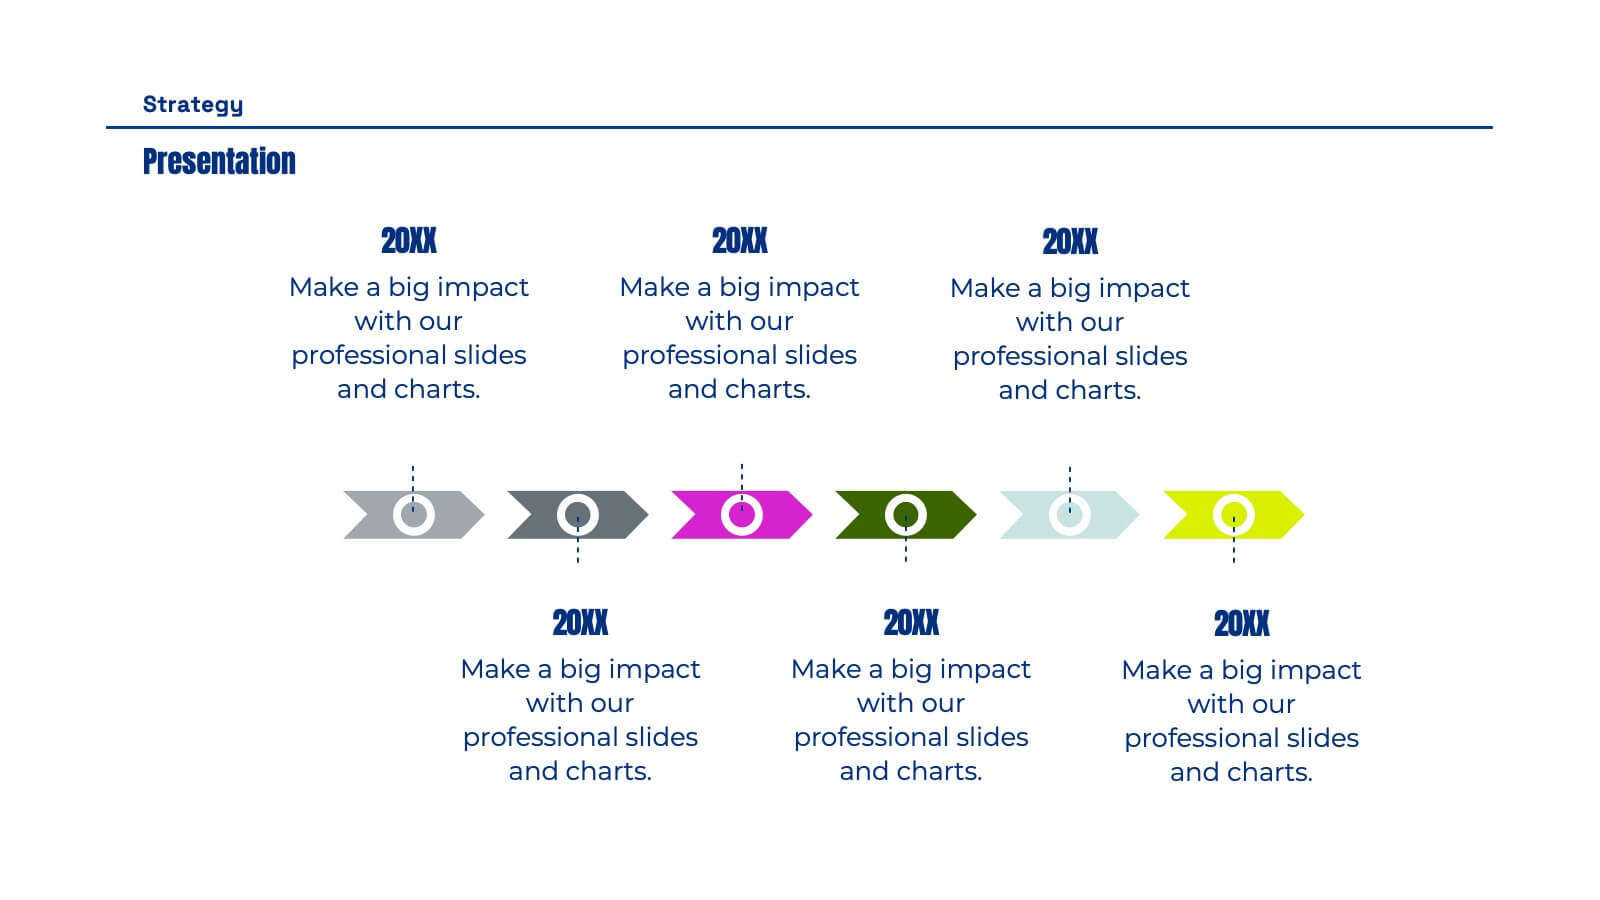
Thistlewood Strategic Planning Report Presentation
This comprehensive template is ideal for strategic planning, featuring slides for market analysis, SWOT evaluation, growth opportunities, and resource allocation. Showcase timelines, milestones, risk management, and communication strategies. Fully customizable, it’s perfect for delivering professional insights. Compatible with PowerPoint, Keynote, and Google Slides.


7 slides
Criminal Law Infographic
The Criminal Law Infographic presents an engaging and informative visual breakdown of key components within the field of criminal law. Each segment highlights different aspects such as crime rates, judicial processes, or enforcement statistics. This template is designed to be user-friendly, making it an ideal choice for legal professionals, or students who need to present complex legal information. Compatible with PowerPoint, Google Slides, and Keynote, it offers a versatile way to communicate legal concepts and data in both educational and professional settings. Its clear structure ensures that viewers can easily follow and comprehend the critical elements of criminal law.


5 slides
Breast Cancer Treatment Infographics
Breast cancer is a type of cancer that develops in the breast cells. These vertical infographics serve as a valuable resource for healthcare professionals, patients, advocacy groups, and educational institutions involved in breast cancer awareness and support. They provide a visually engaging and informative overview of common causes, different treatment options, stages, side effects, survivorship, and ongoing research in breast cancer treatment. This template will help you convey crucial information in a clear manner, empowering individuals with knowledge about breast cancer treatment options and fostering informed decision-making.


22 slides
Zephyr Product Launch Pitch Deck Presentation
Step into the spotlight with this modern and captivating product launch pitch deck! Designed to showcase your ideas with clarity, it covers every key aspect from market opportunities to financials. Impress investors with strategic insights and sleek visuals that guide them through your business plan. Perfect for PowerPoint, Keynote, and Google Slides!


5 slides
Business Problem Statement Presentation
Clarify challenges and drive solutions with this business problem statement template! Designed for strategic planning, this structured layout helps you define key issues, analyze root causes, and communicate insights effectively. Ideal for business leaders, consultants, and project managers. Fully customizable and compatible with PowerPoint, Keynote, and Google Slides for seamless use.