


Features
- 6 Unique slides
- Fully editable and easy to edit in Microsoft Powerpoint, Keynote and Google Slides
- 16:9 widescreen layout
- Clean and professional designs
- Export to JPG, PDF or send by email


Do you have any questions?
Recommend


20 slides
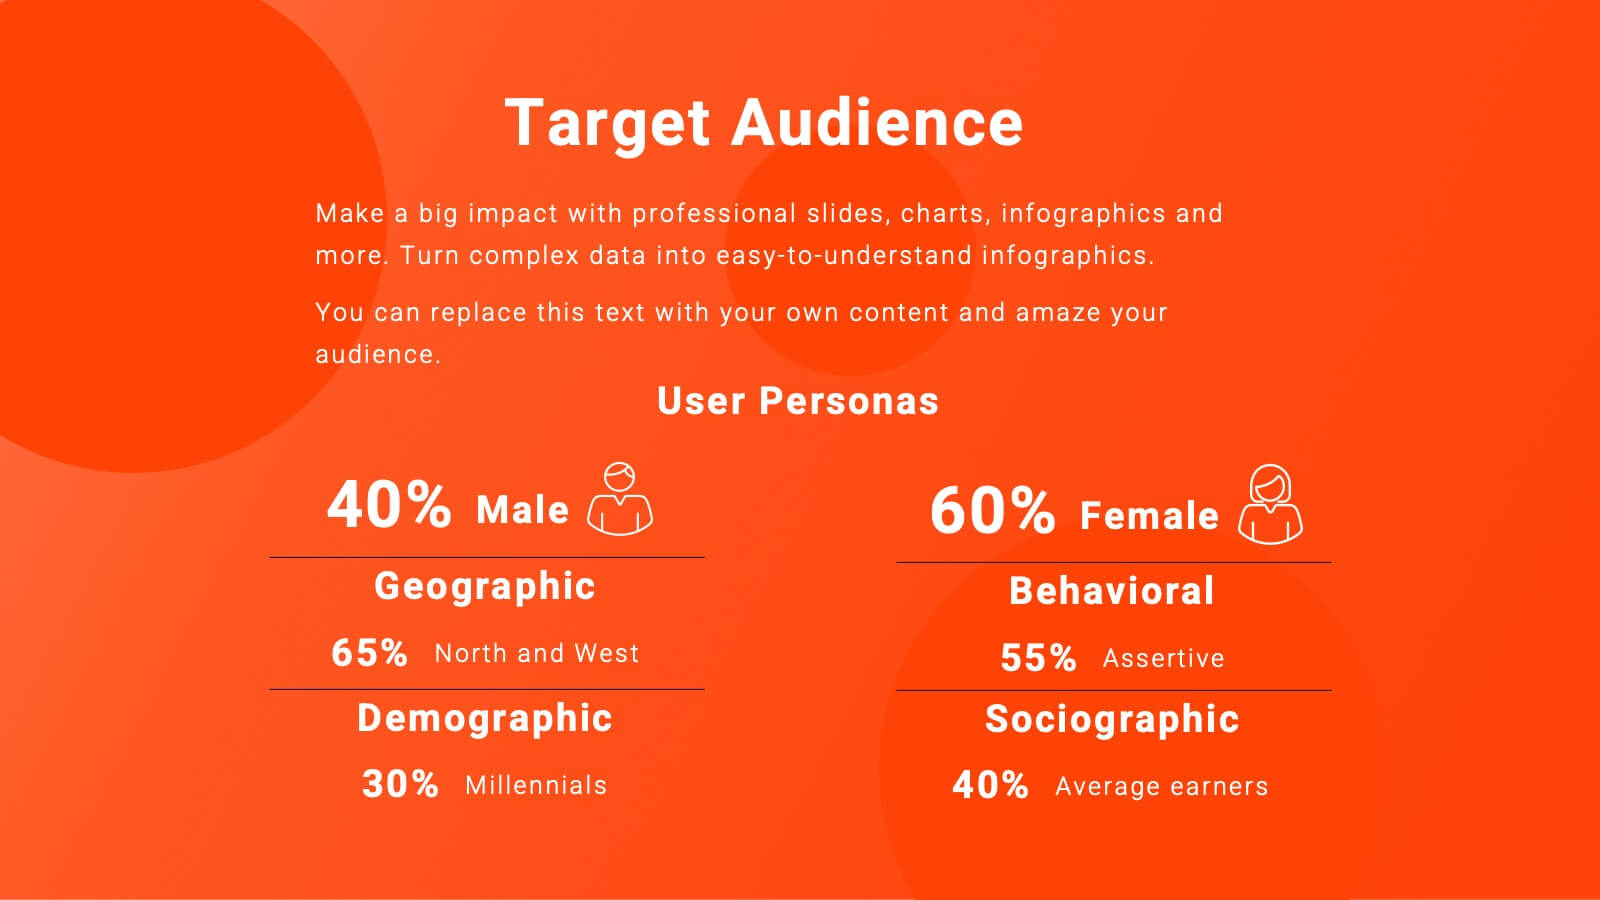
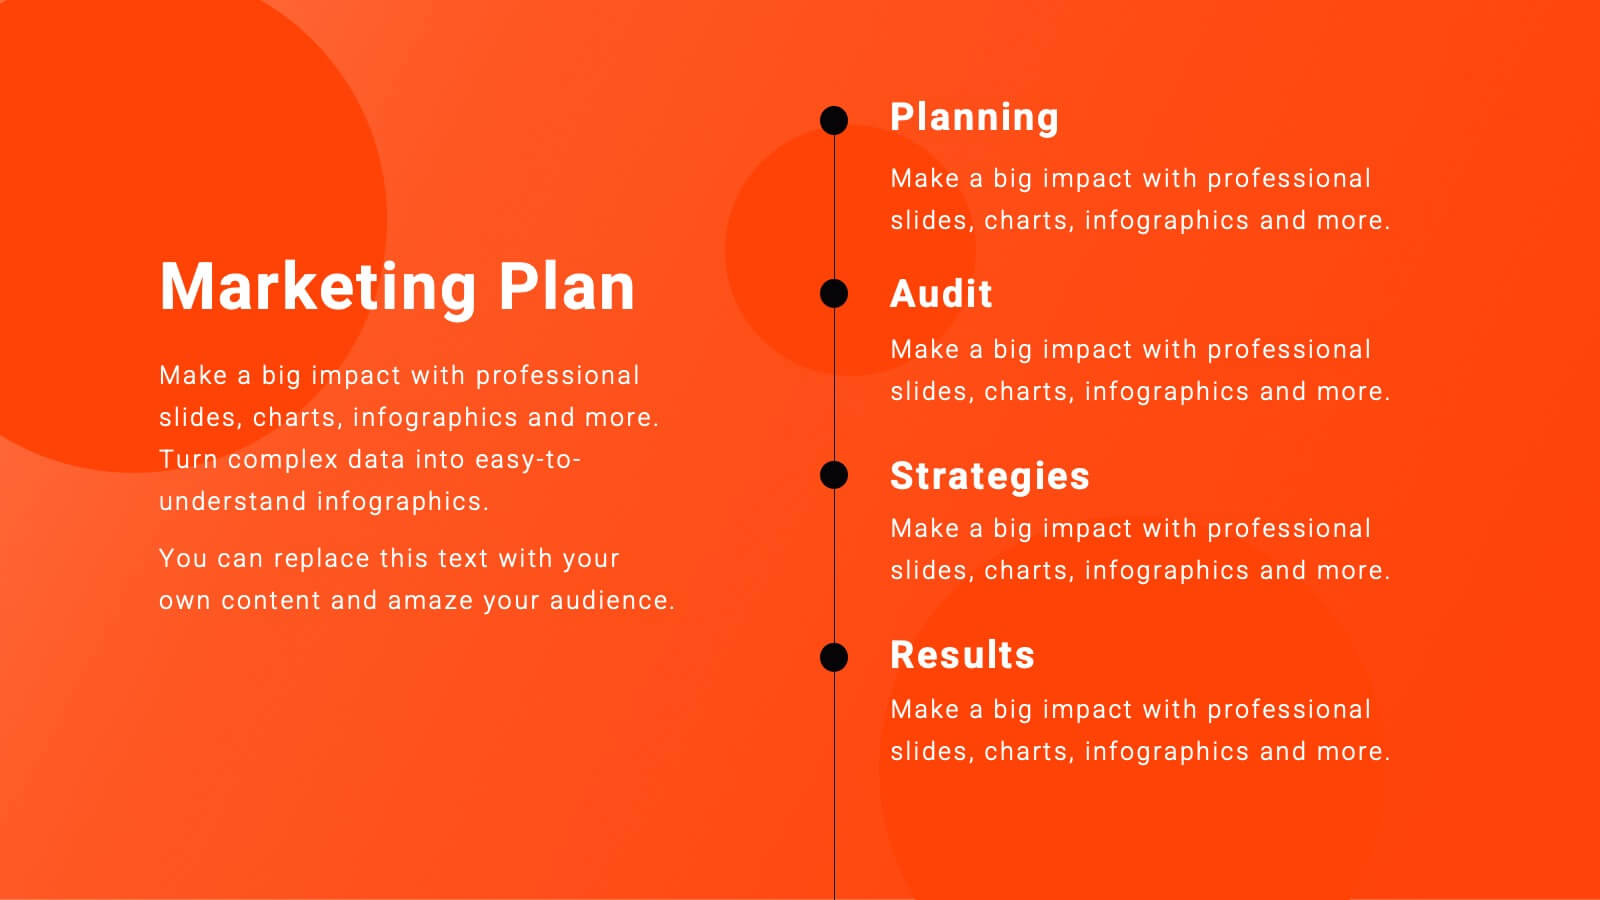
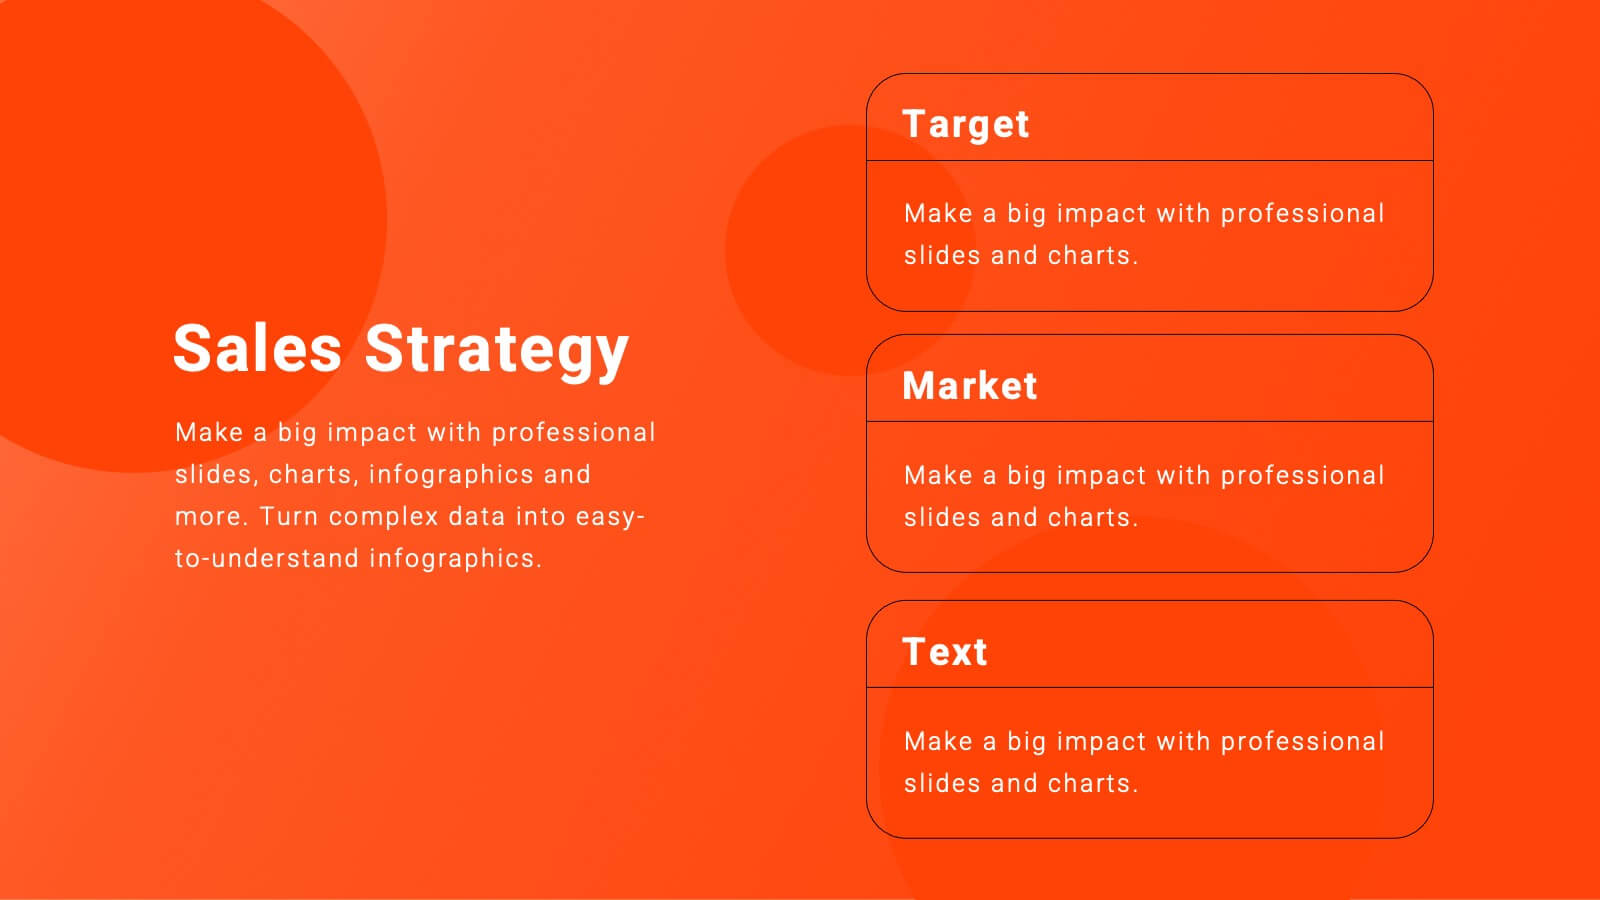
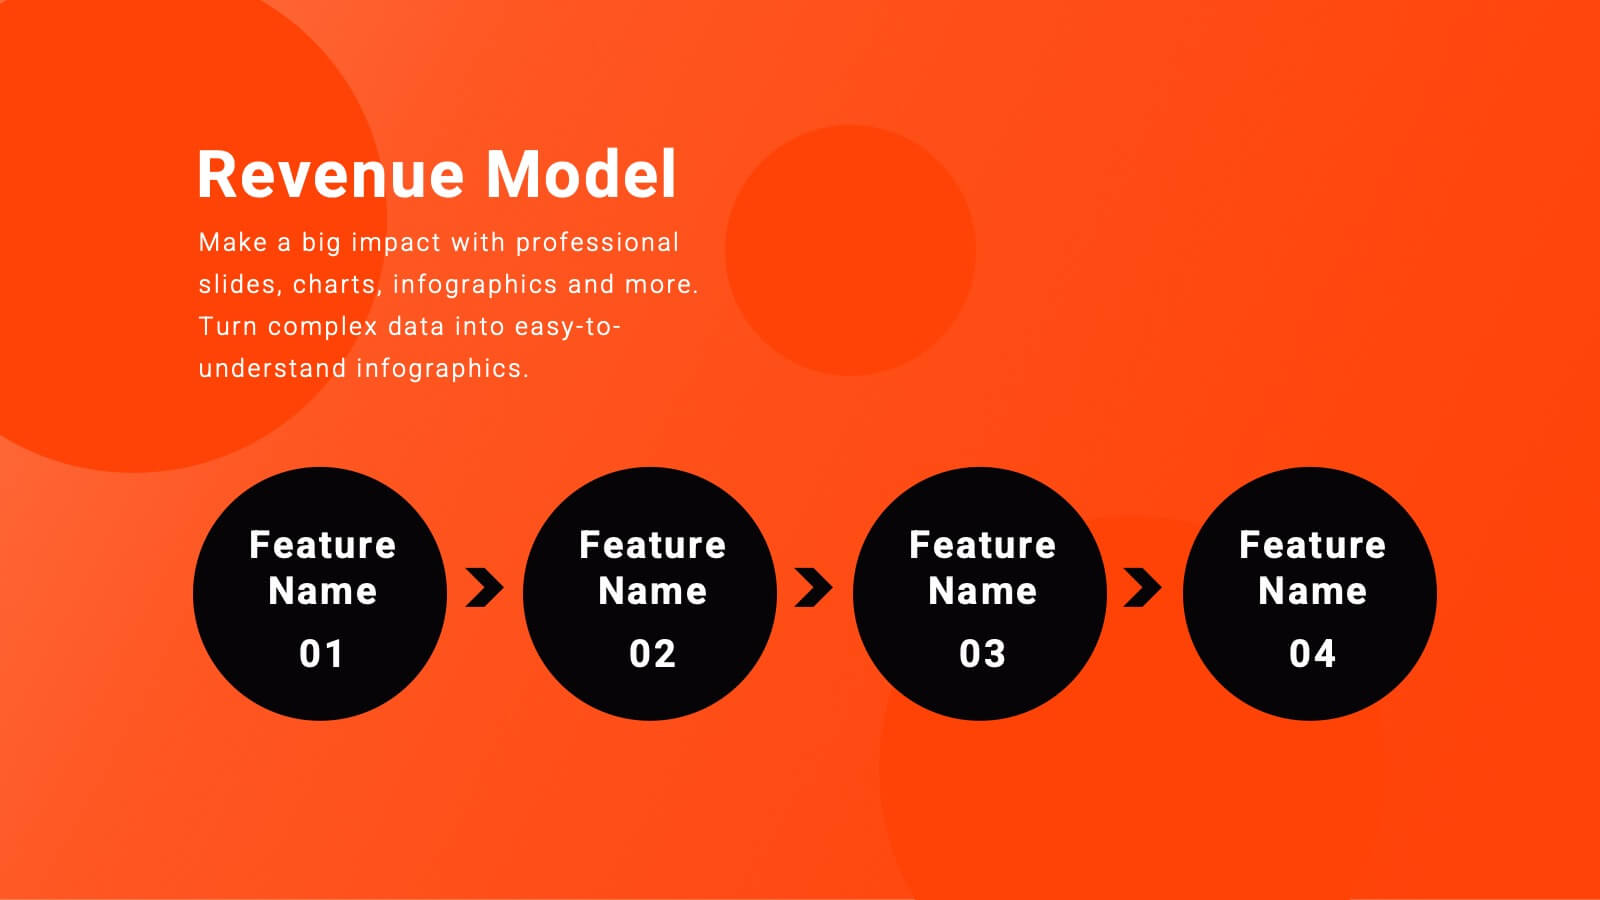
Legacy Sales Strategy Presentation
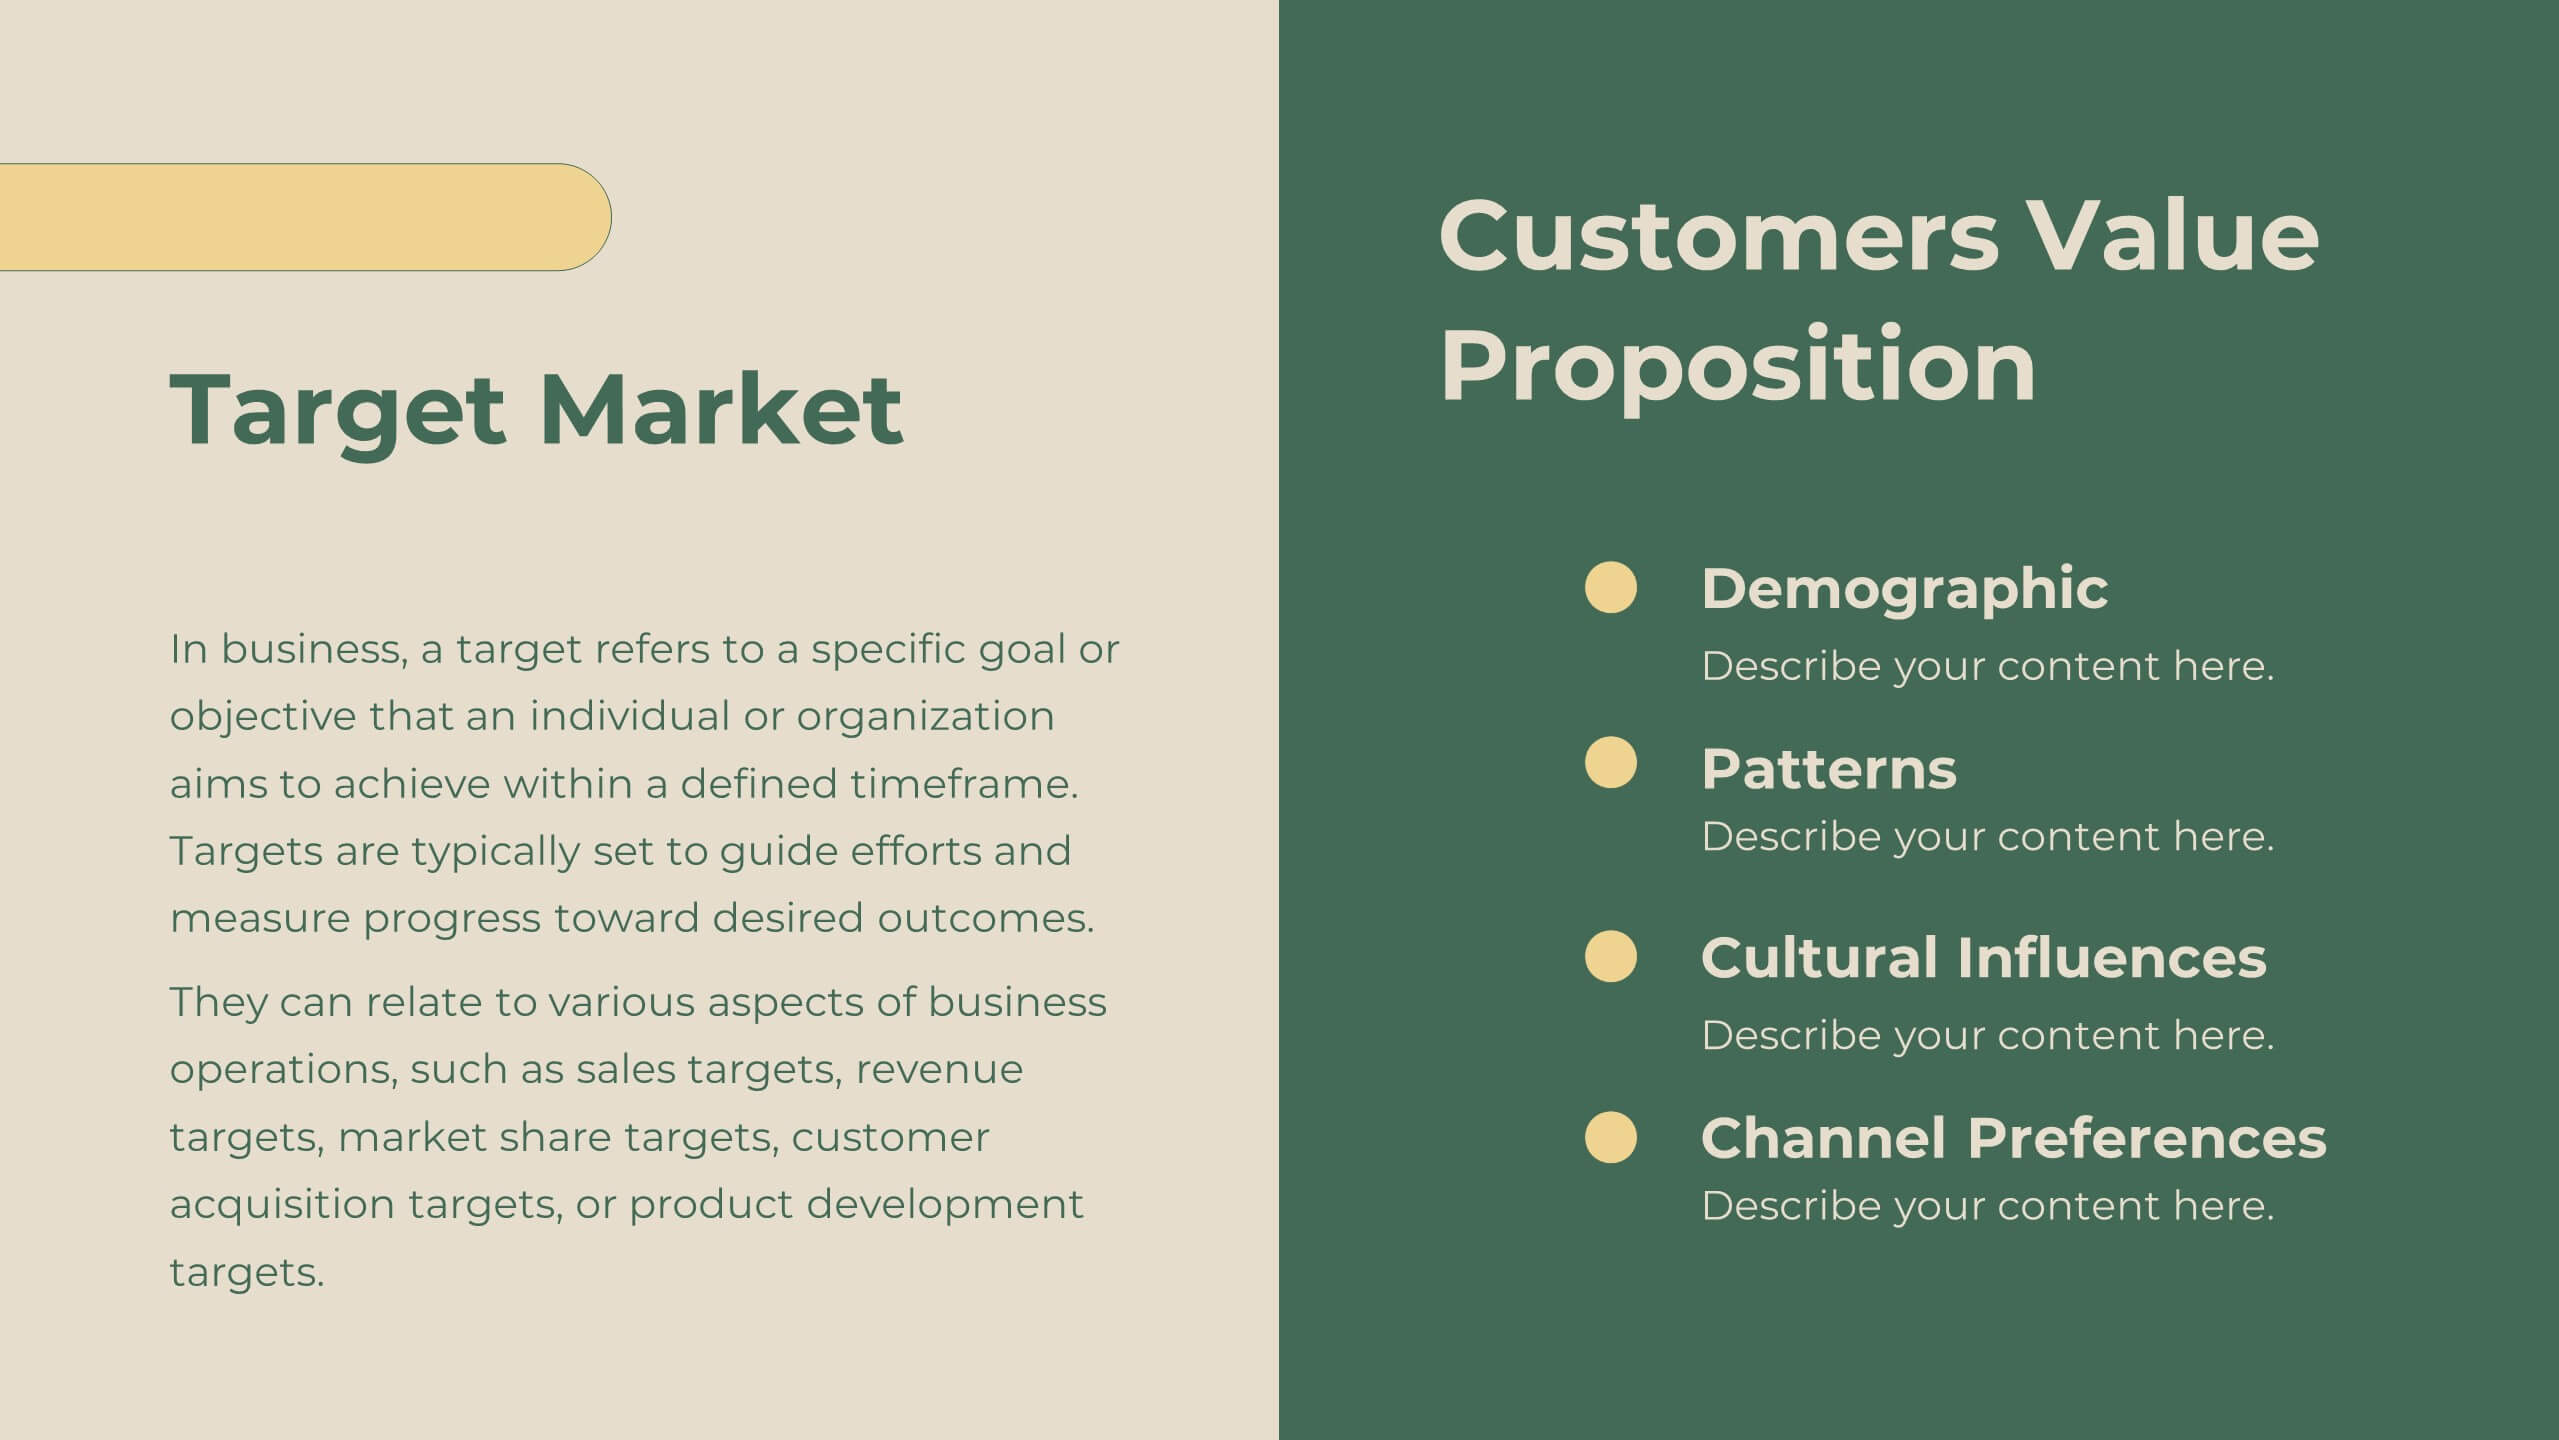
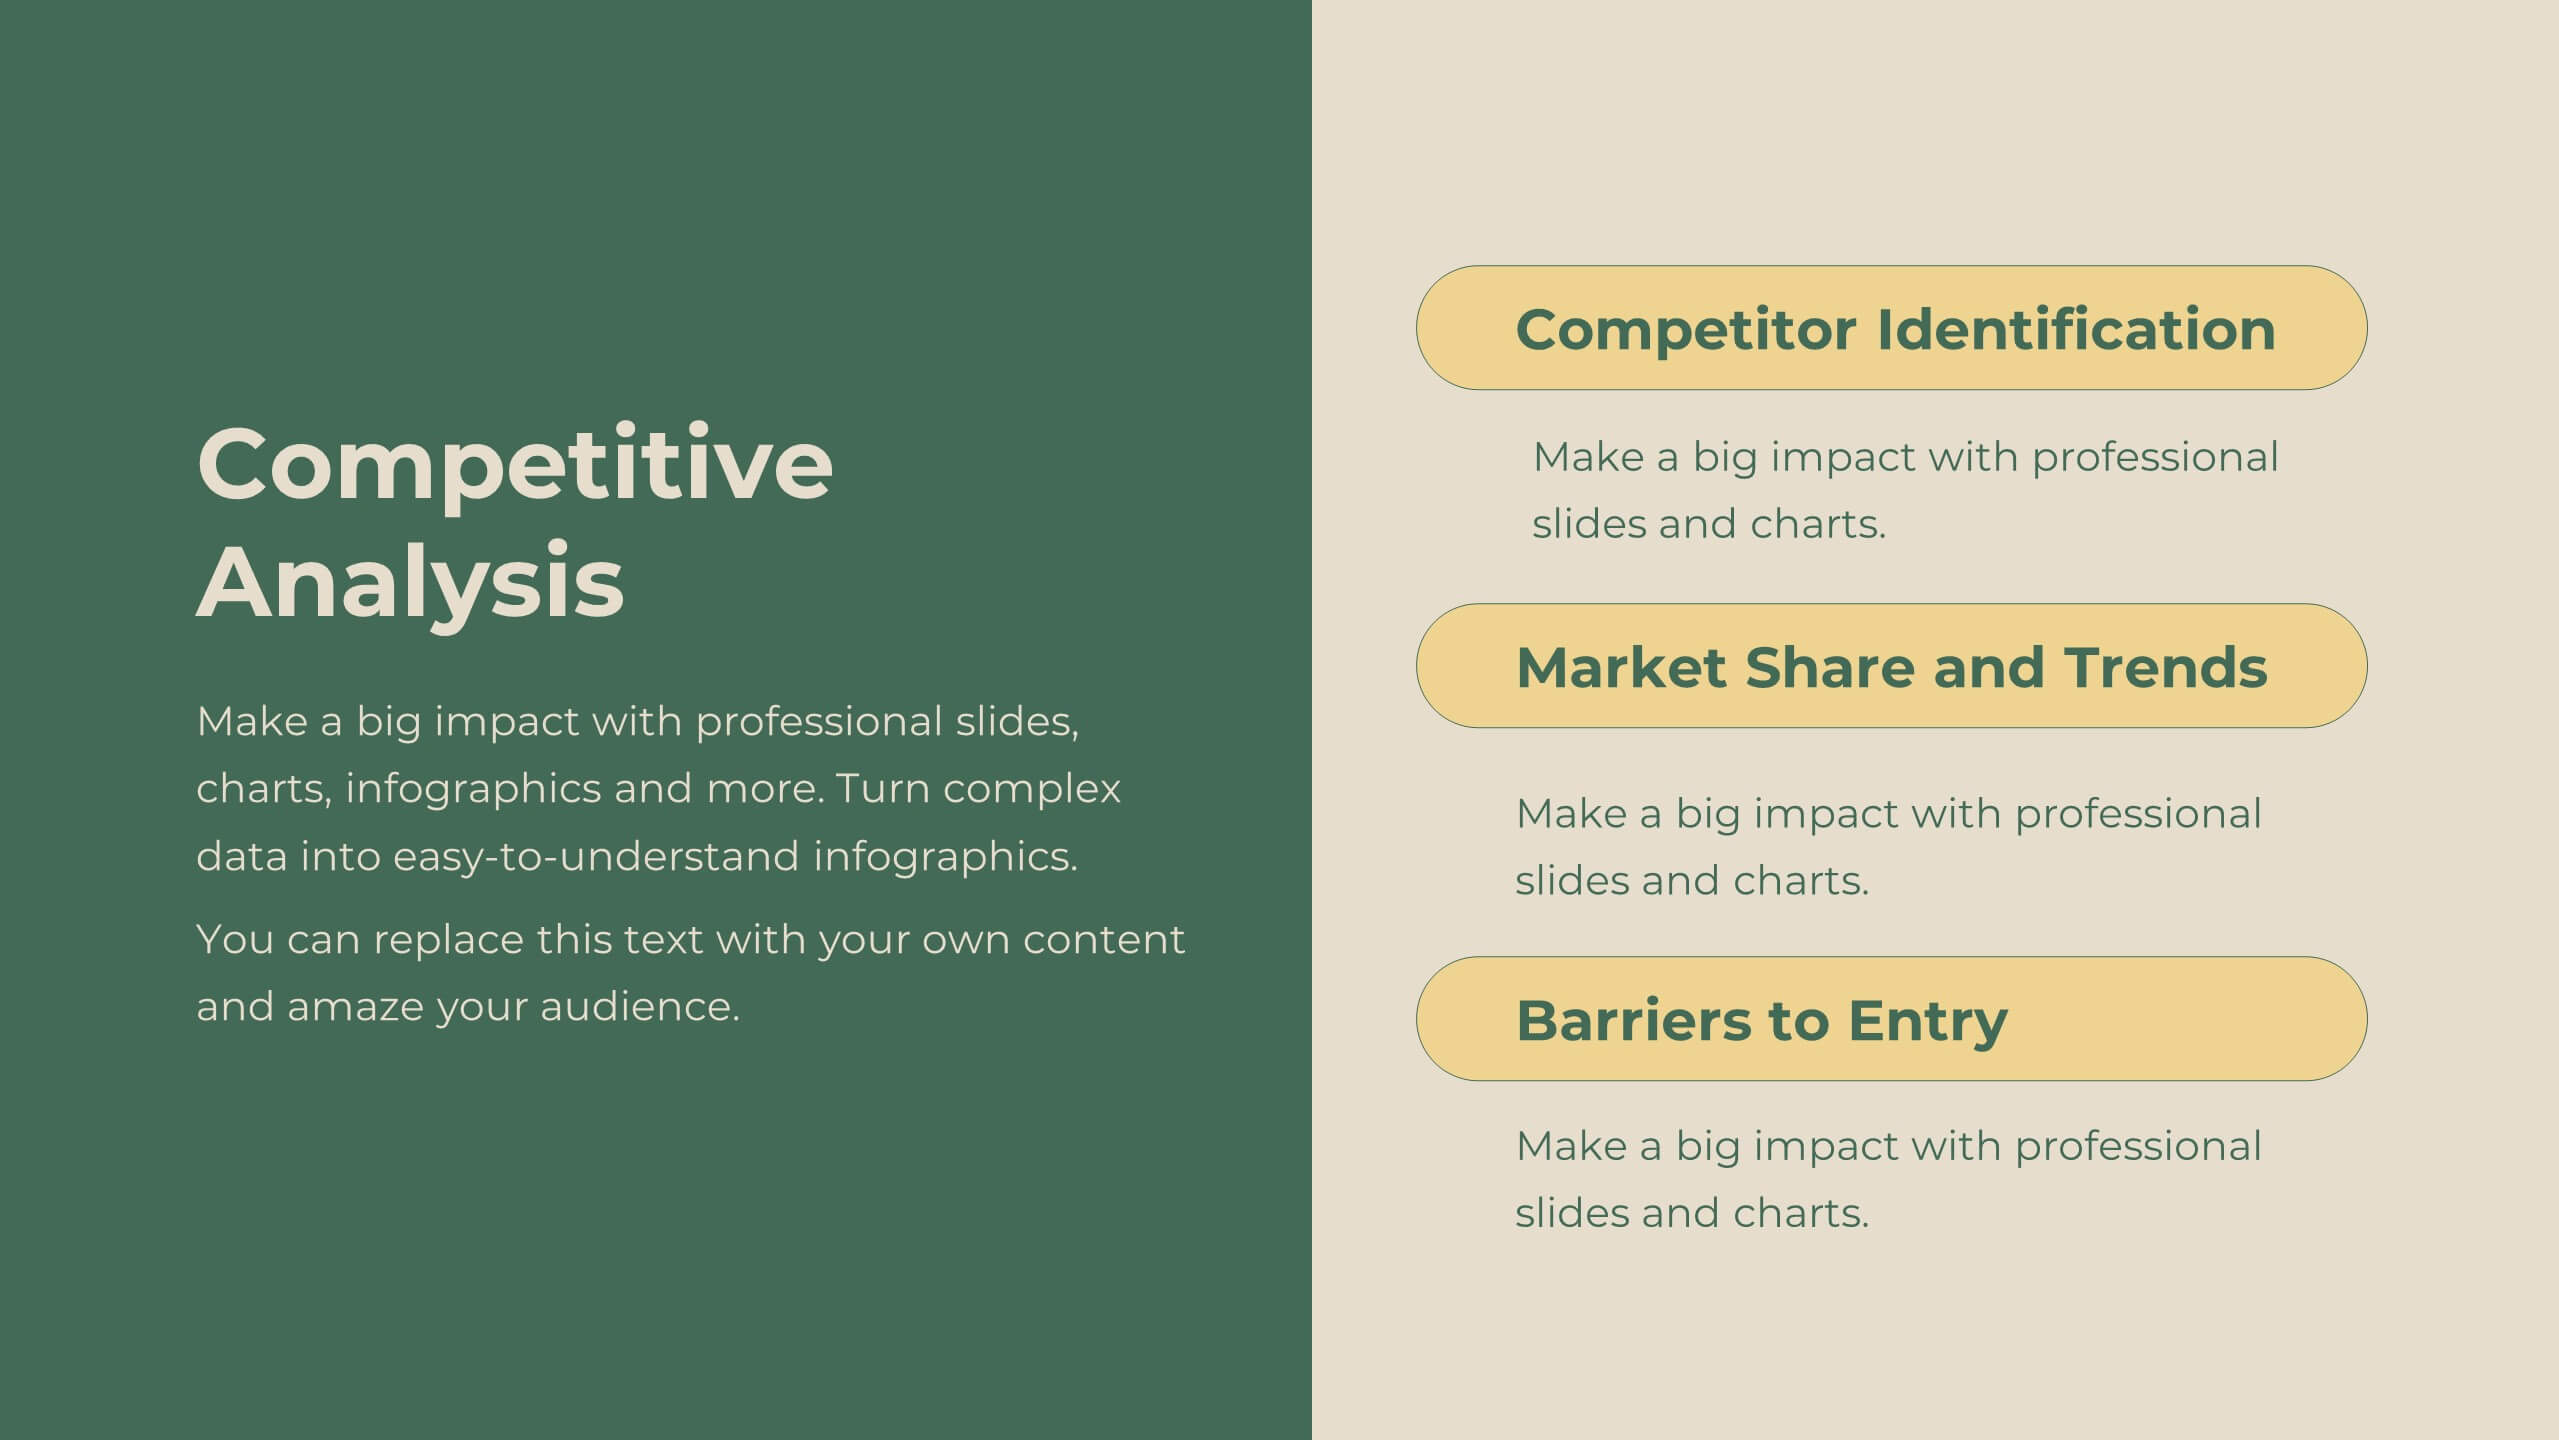
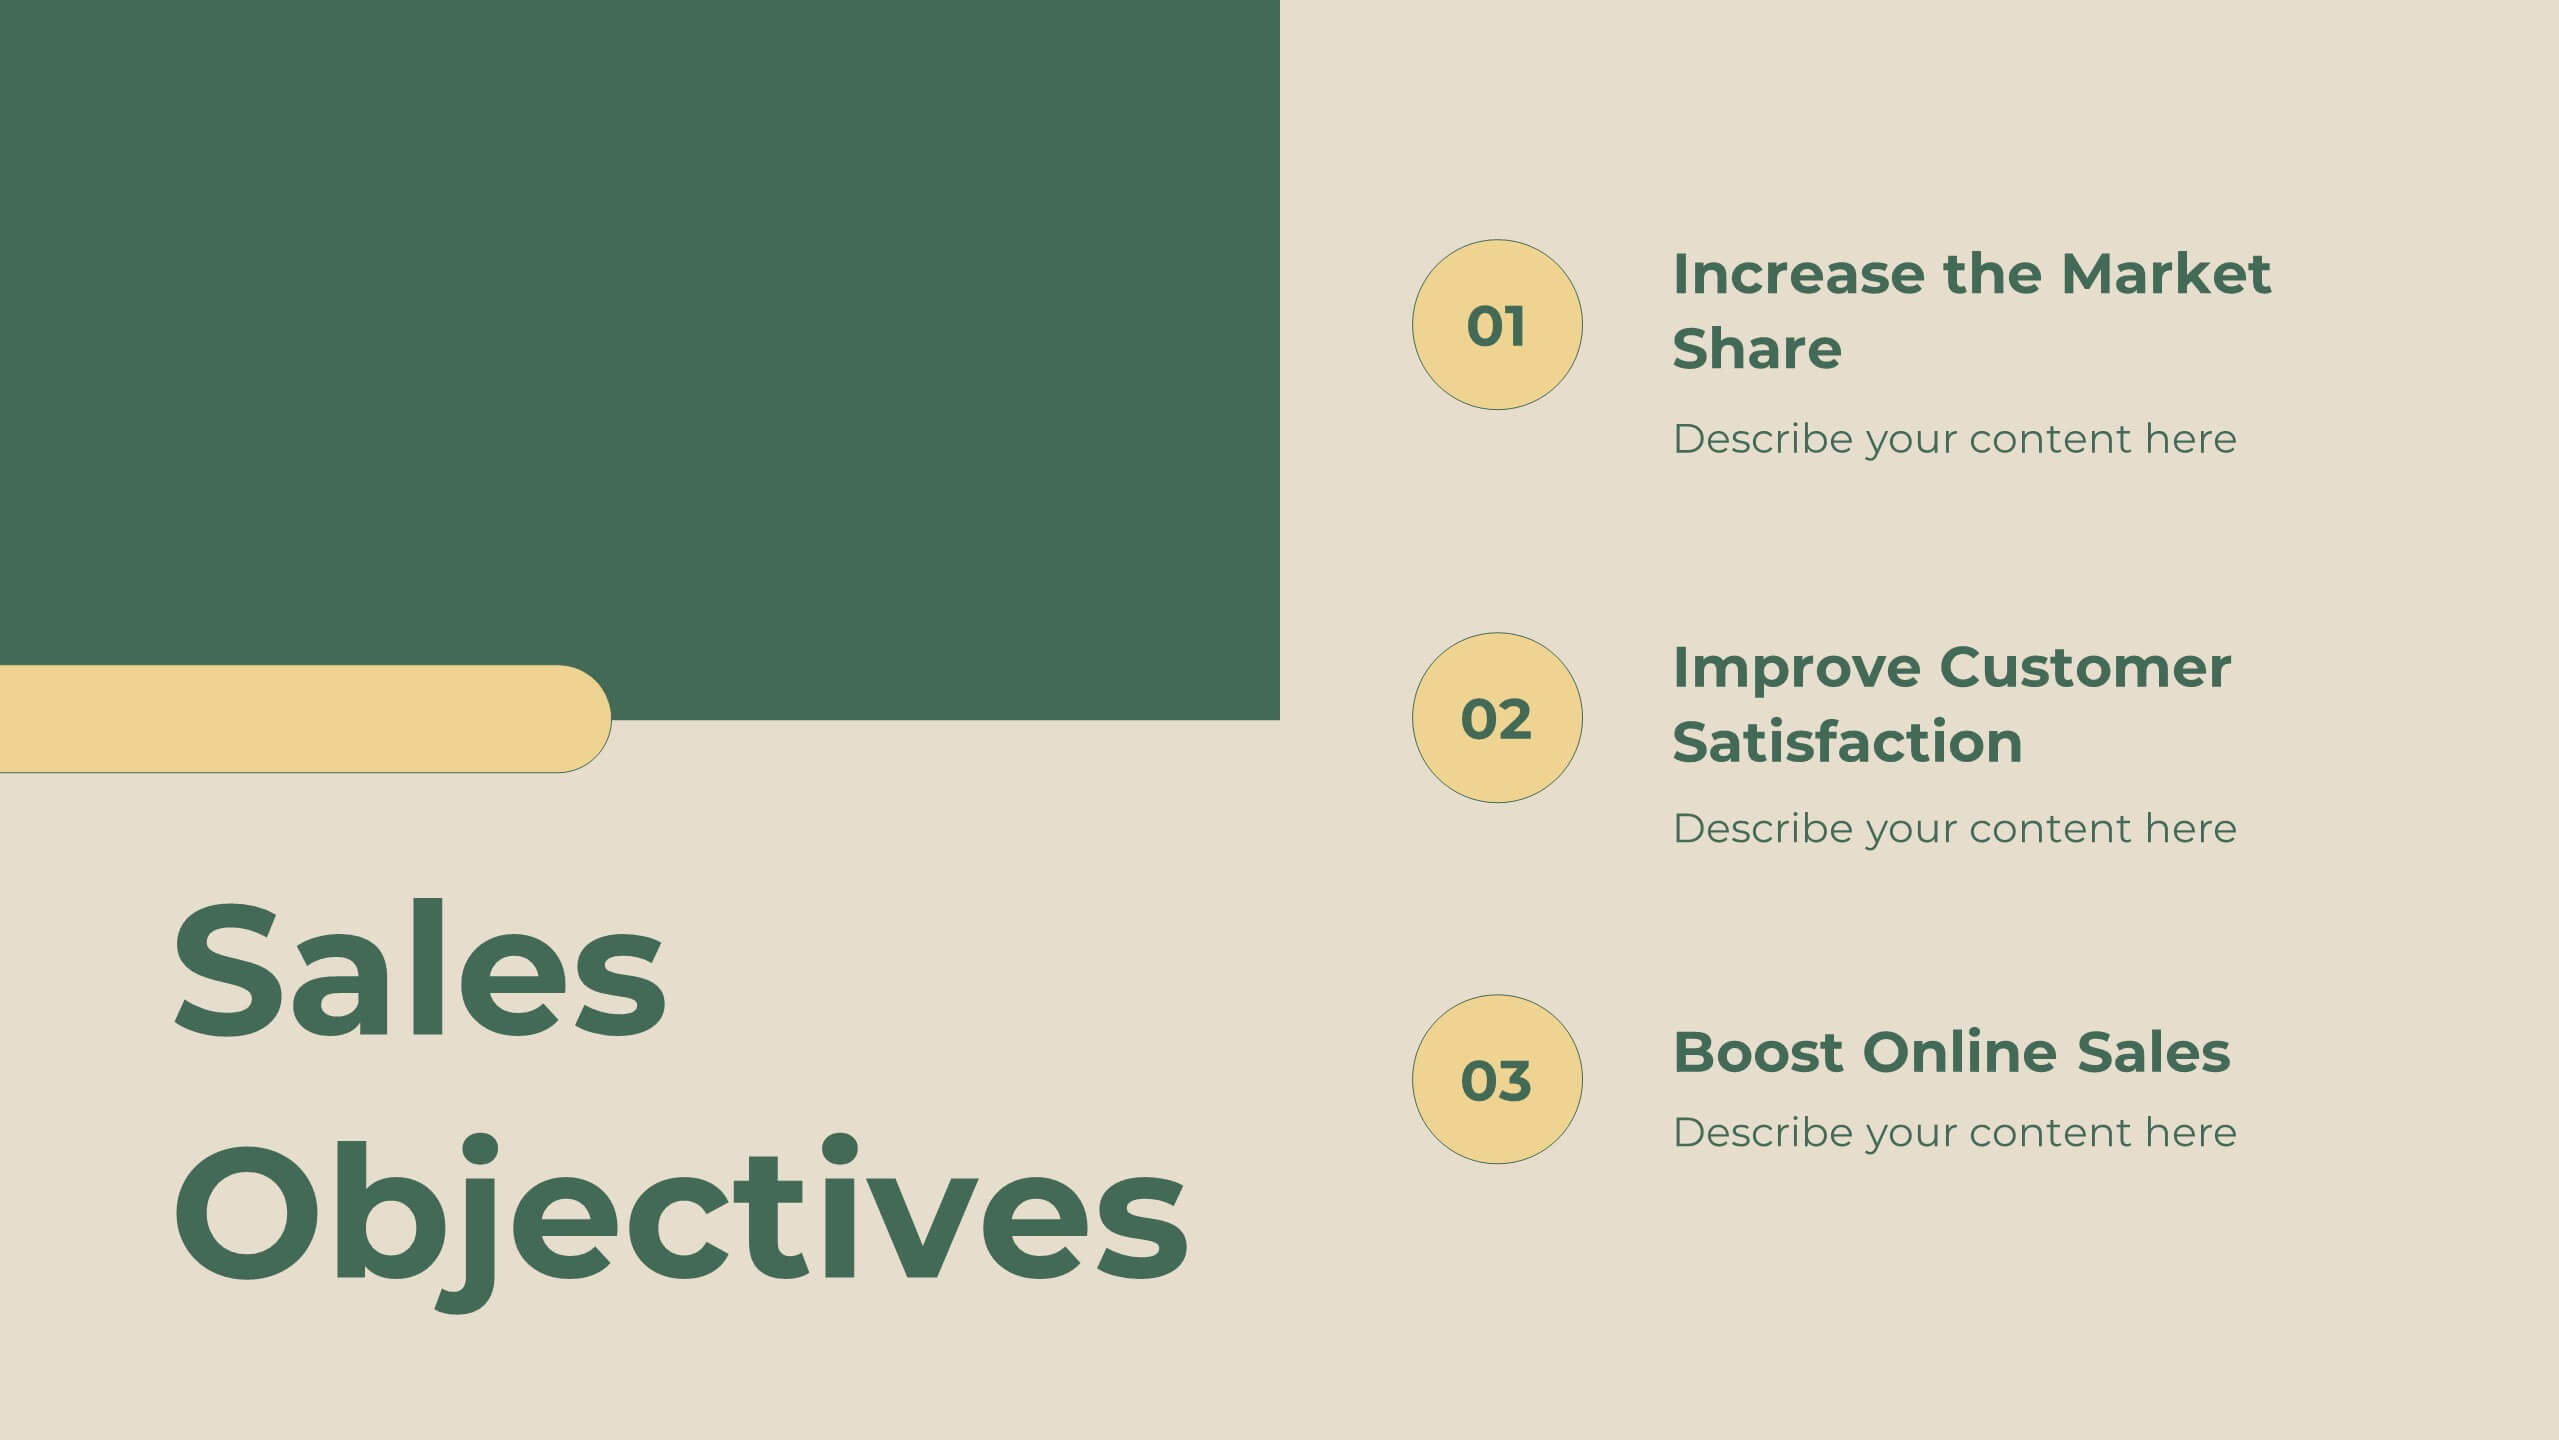
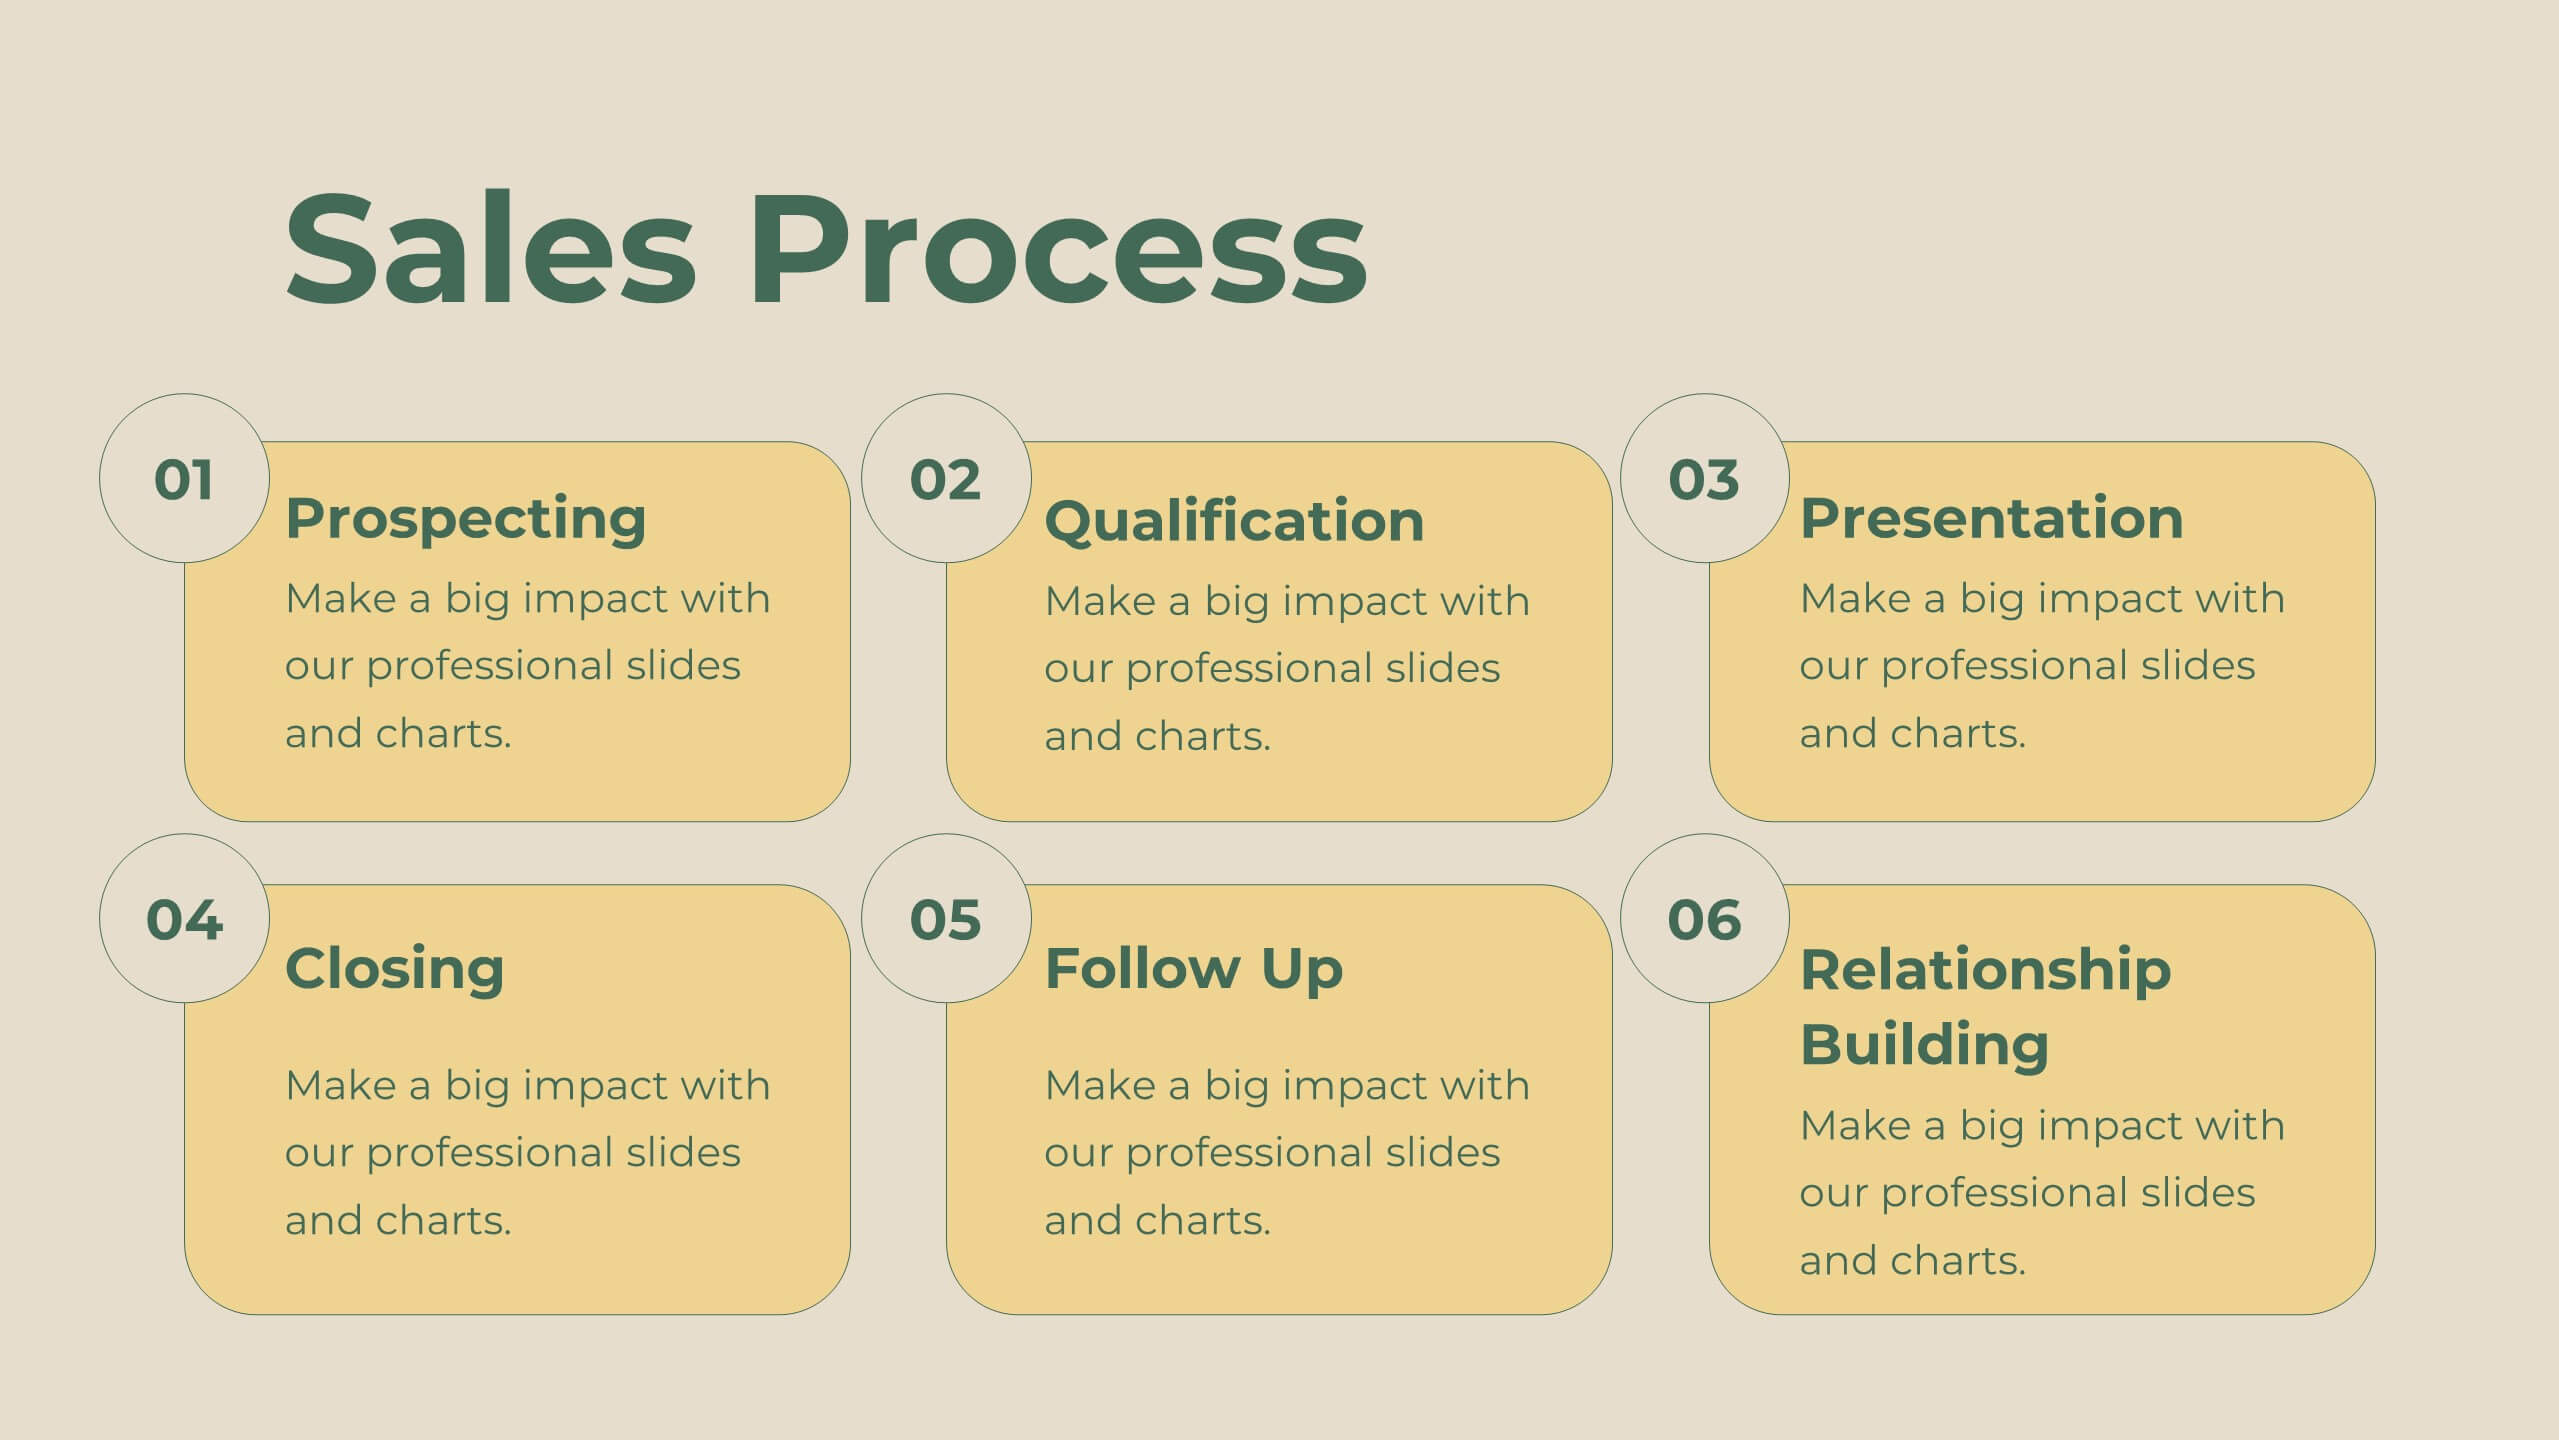
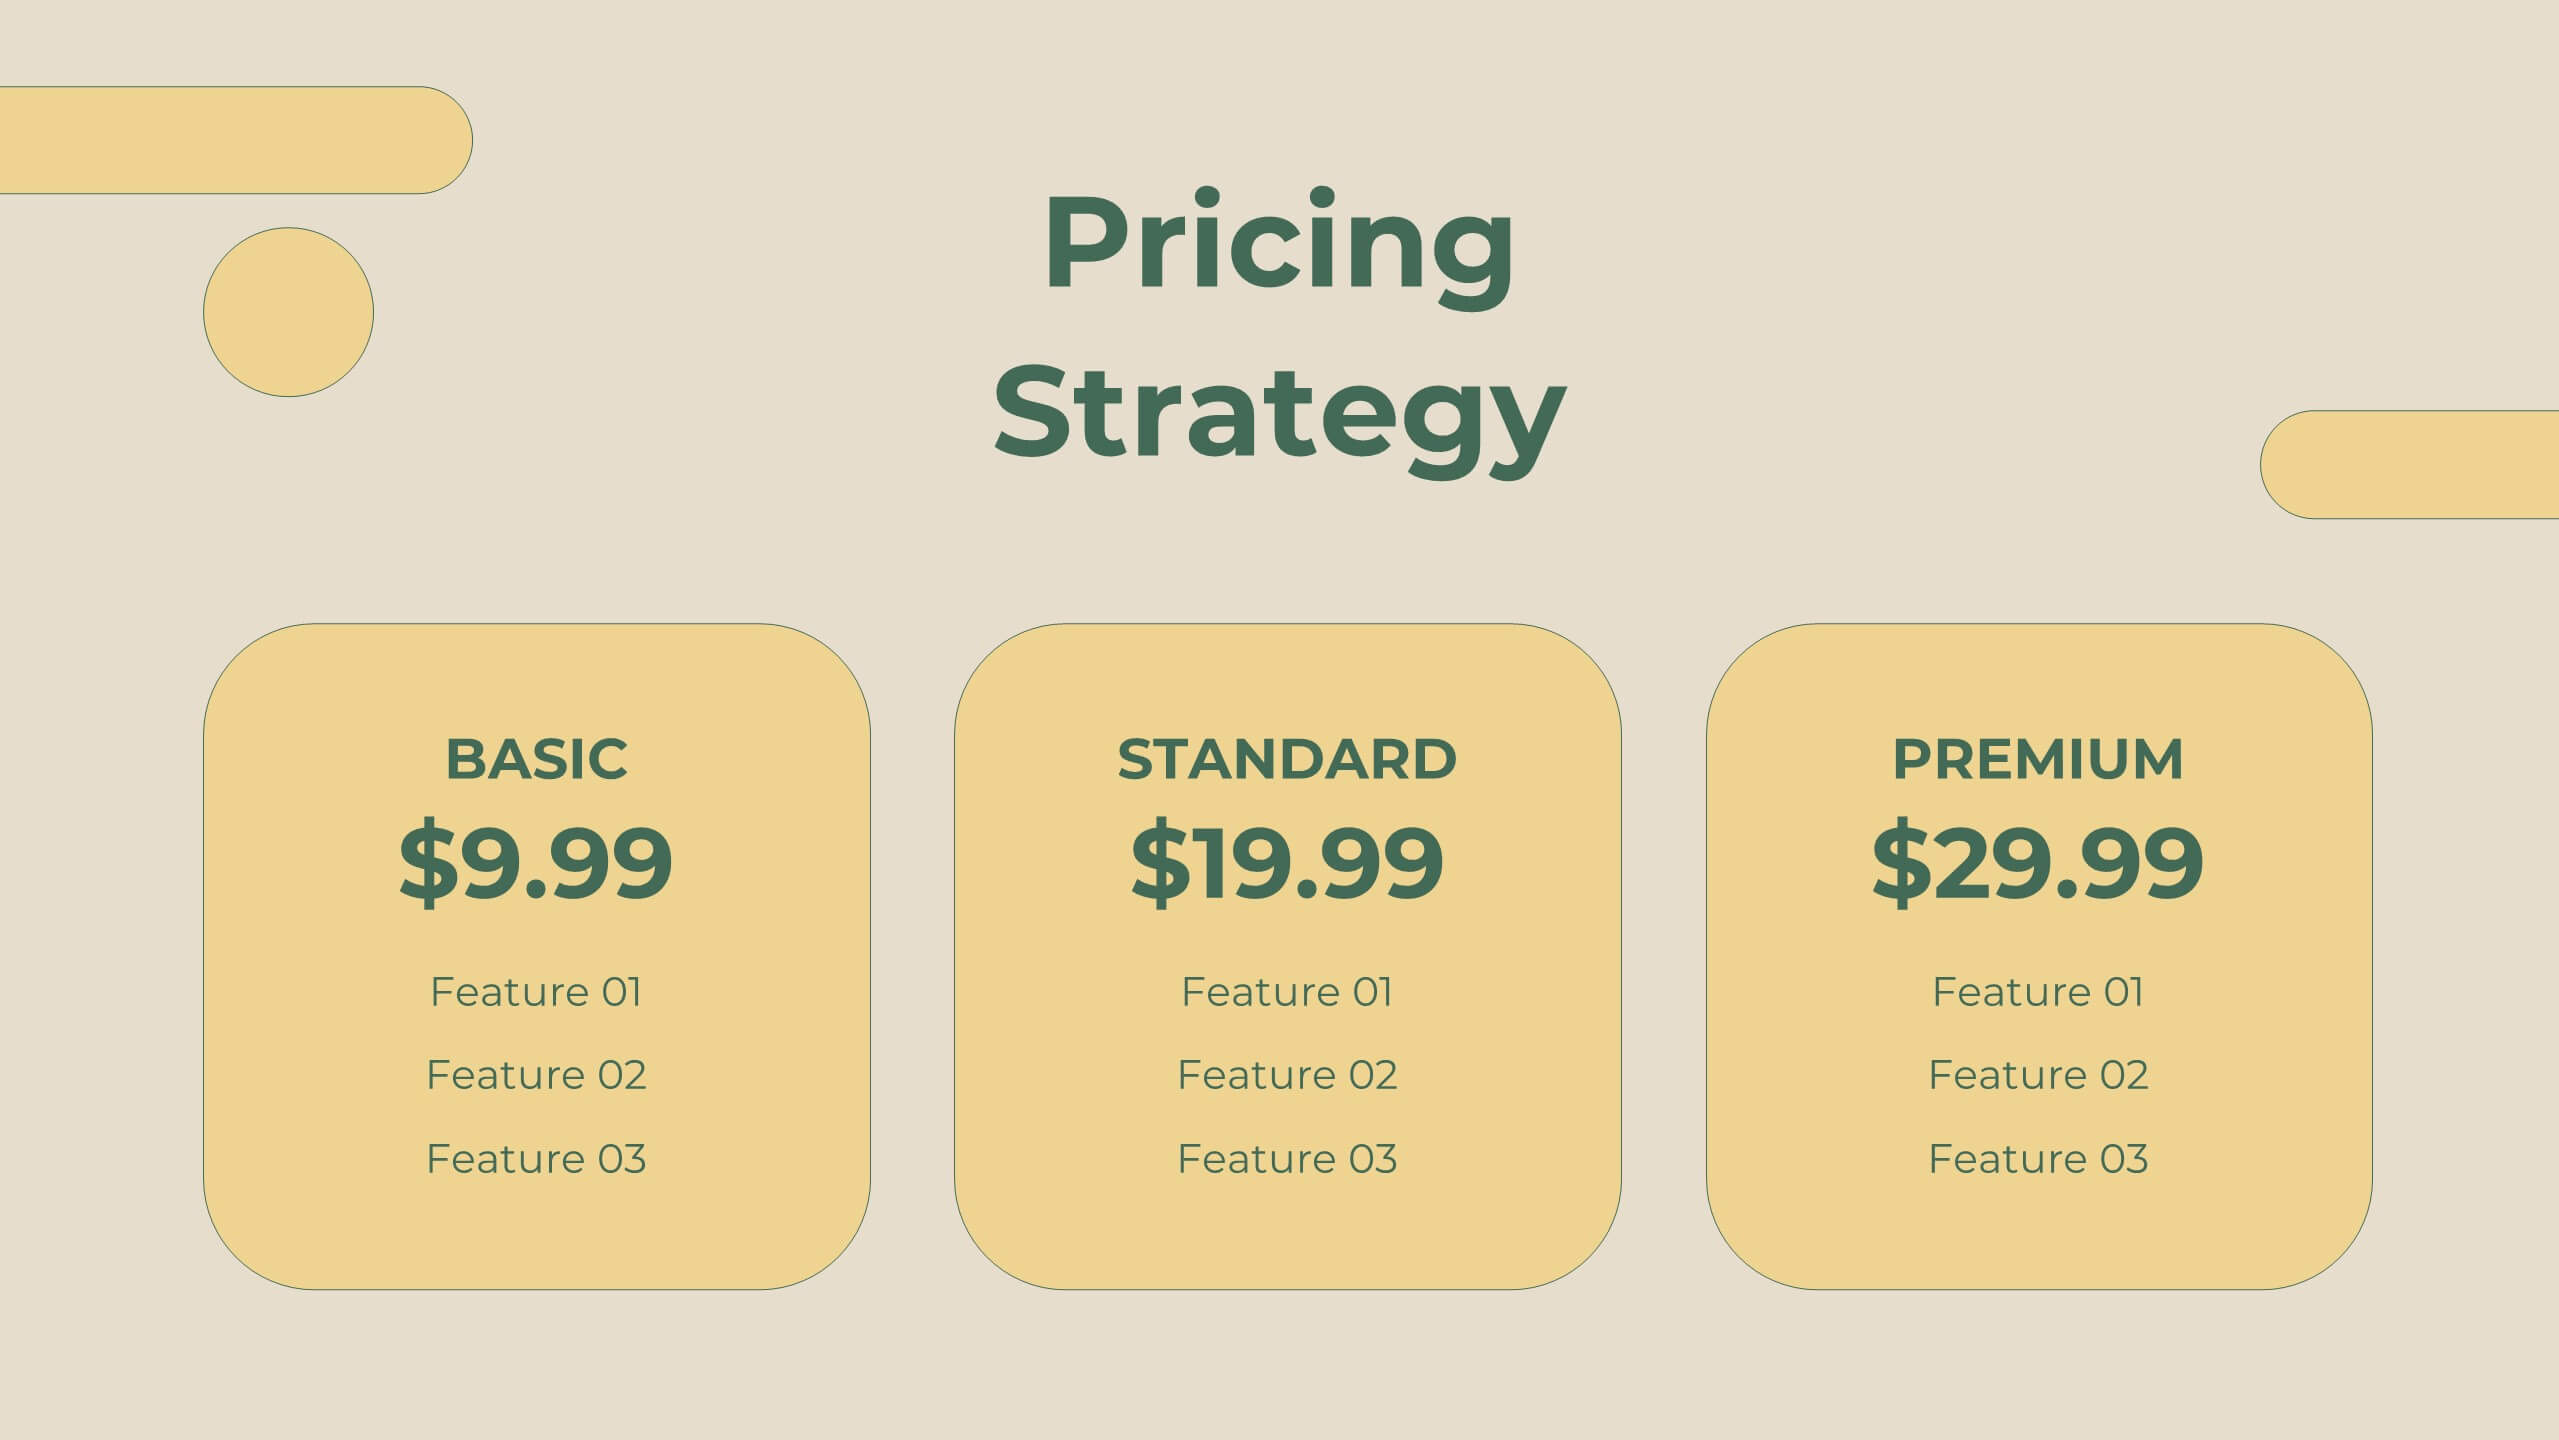
Boost your sales presentations with this modern template! It features sections for objectives, process, team introduction, customer testimonials, and performance metrics. Ideal for outlining strategies, opportunities, and pricing. Engage your audience with a professional, clean design. Compatible with PowerPoint, Keynote, and Google Slides for seamless integration. Make your sales strategy stand out!


5 slides
Types of Photography Infographics
There are various types of photography that cater to different subjects, styles, and purposes. These vertical infographics are designed to serve as a comprehensive guide for individuals interested in exploring different genres and styles of photography. These will allow you to provide an overview of different genres and types of photography. They aim to inform viewers about the diverse fields of photography, allowing them to explore various styles and find their areas of interest. Whether used in photography workshops, educational materials, or creative presentations, this template provides valuable insights and inspiration for individuals passionate about the art of photography.


6 slides
Professional Meeting Agenda Presentation
Plan your meetings with clarity and structure using the Professional Meeting Agenda Presentation. This clean, 5-step layout visually organizes agenda items alongside bold numbers and relevant icons to guide discussion. Perfect for team syncs, business reviews, or project briefings. Fully customizable in PowerPoint, Keynote, and Google Slides.


5 slides
Cybersecurity Protocols and Threat Response Presentation
Visualize your security framework with the Cybersecurity Protocols and Threat Response presentation slide. Featuring a central lock icon surrounded by four quadrant-based callouts and symbolic icons (e.g., fingerprint, shield, malware), it’s ideal for outlining access controls, incident response, and threat monitoring strategies. Fully editable in PowerPoint, Keynote, and Google Slides.


6 slides
Branching Structure Tree Chart Presentation
Visualize ideas, processes, or team structures with the Branching Structure Tree Chart Presentation. This elegant tree diagram layout allows you to display six key points or stages branching out naturally from a central concept. Ideal for organizational charts, decision flows, or brainstorming visuals. Fully editable in PowerPoint, Keynote, and Google Slides.


7 slides
Business Structure Infographic
Understanding a business's organizational structure is pivotal for effective operations, strategy, and growth. Our business structure infographic, colored in shades of blue, white, green, and yellow, lays out these intricacies in a visually compelling manner. Whether you're showcasing hierarchies, operational roles, or departmental divides, this infographic captures it all. Tailored for business students, entrepreneurs, and corporate trainers, this tool simplifies complex concepts. Seamlessly integrated with PowerPoint, Keynote, and Google Slides, it provides a dynamic aid to ensure your presentations are both enlightening and engaging.


7 slides
Humanistic Psychology Infographics
Explore the depths of human experience with our Humanistic Psychology Infographic, an essential tool for educators, students, and professionals in the field of psychology. This infographic is designed to visually communicate the principles and applications of humanistic psychology. Our infographic provides a snapshot of the core concepts of humanistic psychology, including self-actualization, the hierarchy of needs, and the importance of personal growth and fulfillment. It features sections on therapeutic techniques, the significance of empathy, and the focus on individual potential. With customizable graphics, you can illustrate the stages of personal development and the humanistic approach to well-being. This SEO-optimized infographic is tailored to convey the humanistic perspective effectively, making it an invaluable resource for presentations, educational materials, and mental health advocacy. Utilize this infographic to foster a deeper understanding of humanistic psychology and its role in promoting holistic mental health and human potential.


6 slides
Executive Summary of Findings Presentation
Summarize your key insights with clarity using this Executive Summary of Findings slide. Designed with a centered target icon and surrounding data points, it’s ideal for spotlighting major conclusions. Fully editable in PowerPoint, Keynote, and Google Slides.


7 slides
Transportation & Logistics Solutions Infographic
Navigate the intricate pathways of transportation and logistics with our infographic. With a refreshing color palette of white and yellow, the infographic is reminiscent of the roads and paths that make up the very heart of this sector. The design incorporates intuitive icons that represent various facets of transportation – from vehicles, ships, and planes to route optimization. Each segment is clearly defined, ensuring the conveyed data is crisp and engaging. Compatible with PowerPoint, Keynote, and Google Slides. The use of yellow provides a cheerful, optimistic backdrop that accentuates the intricate details, making the content vibrant and easy to understand.


5 slides
Residential Market Trends Overview Presentation
Track market insights with clarity using the Residential Market Trends Overview Presentation. Featuring a clean, linear layout with four content points and a central house icon, this slide is ideal for showcasing housing data, price trends, investment insights, or neighborhood developments. Fully editable in Canva, PowerPoint, Keynote, and Google Slides—perfect for real estate pros, analysts, or urban planners.


8 slides
Eco-Friendly Business Practices Presentation
The "Eco-Friendly Business Practices" presentation template is thoughtfully designed to showcase sustainable business practices. Each section of the template features a labeled bin, representing different aspects or initiatives within a company's eco-friendly approach. The clear, colorful representations facilitate easy understanding and effective communication of key environmental strategies. This template is perfect for businesses looking to highlight their commitment to sustainability, discuss green policies, or outline specific recycling or waste reduction methods. It's especially useful for presentations aimed at stakeholders interested in corporate responsibility and environmental stewardship.


3 slides
Customers Loyalty Program Strategy Presentation
Turn customer rewards into a story worth sharing with this modern, visually engaging layout. Ideal for showcasing loyalty program concepts, benefits, and engagement strategies, it helps businesses highlight how they retain and reward loyal clients. Fully customizable and compatible with PowerPoint, Keynote, and Google Slides for effortless presentation design.

20 slides
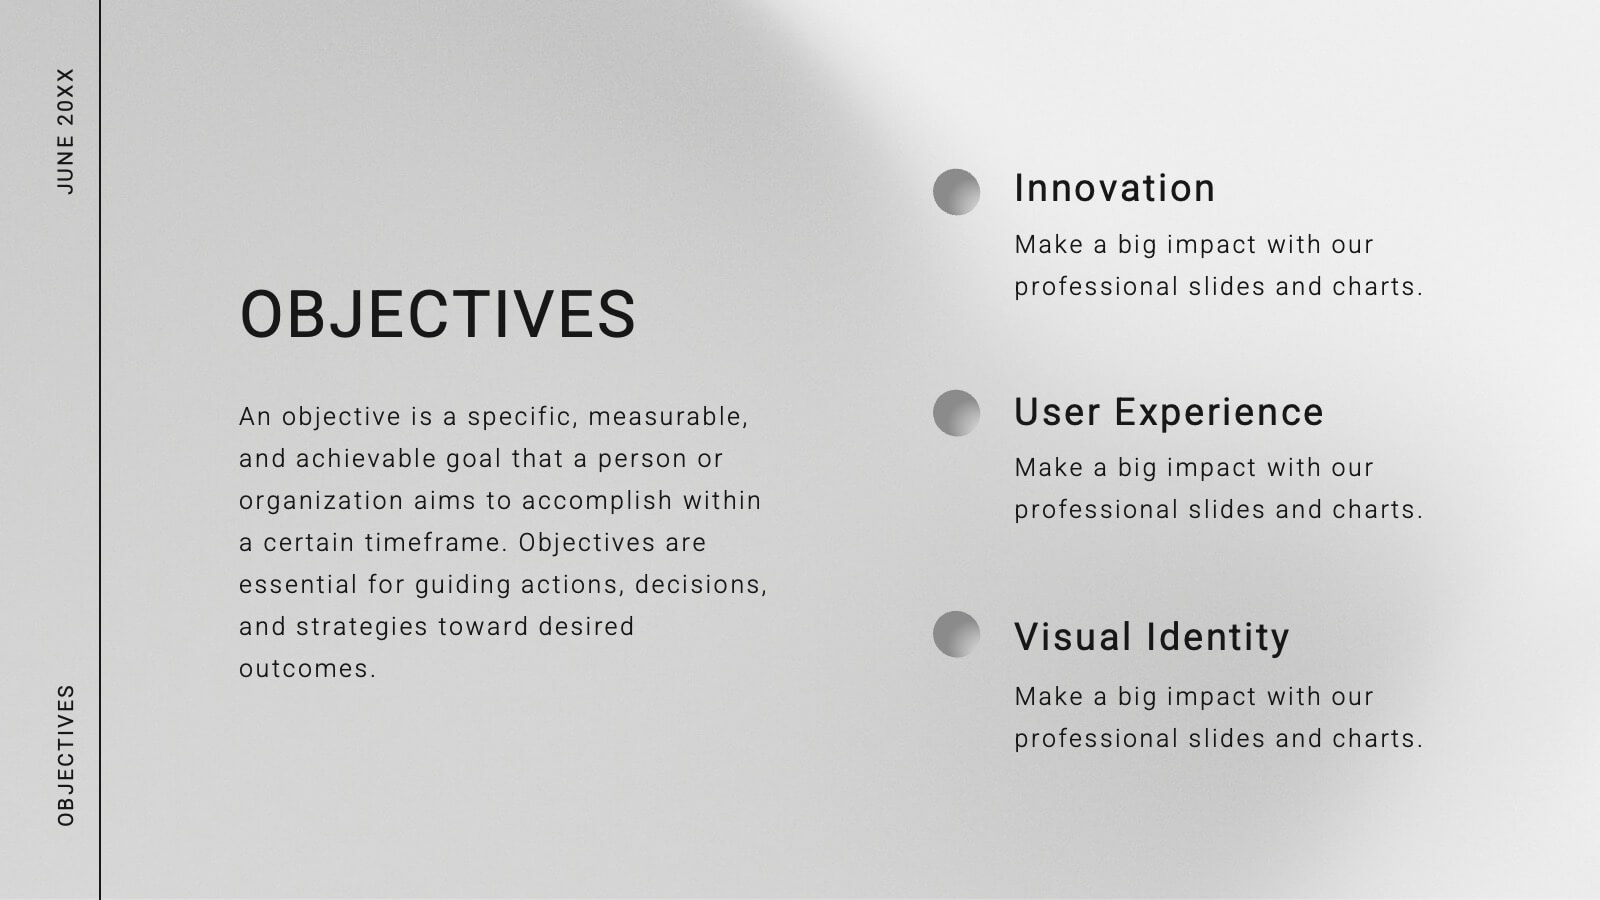
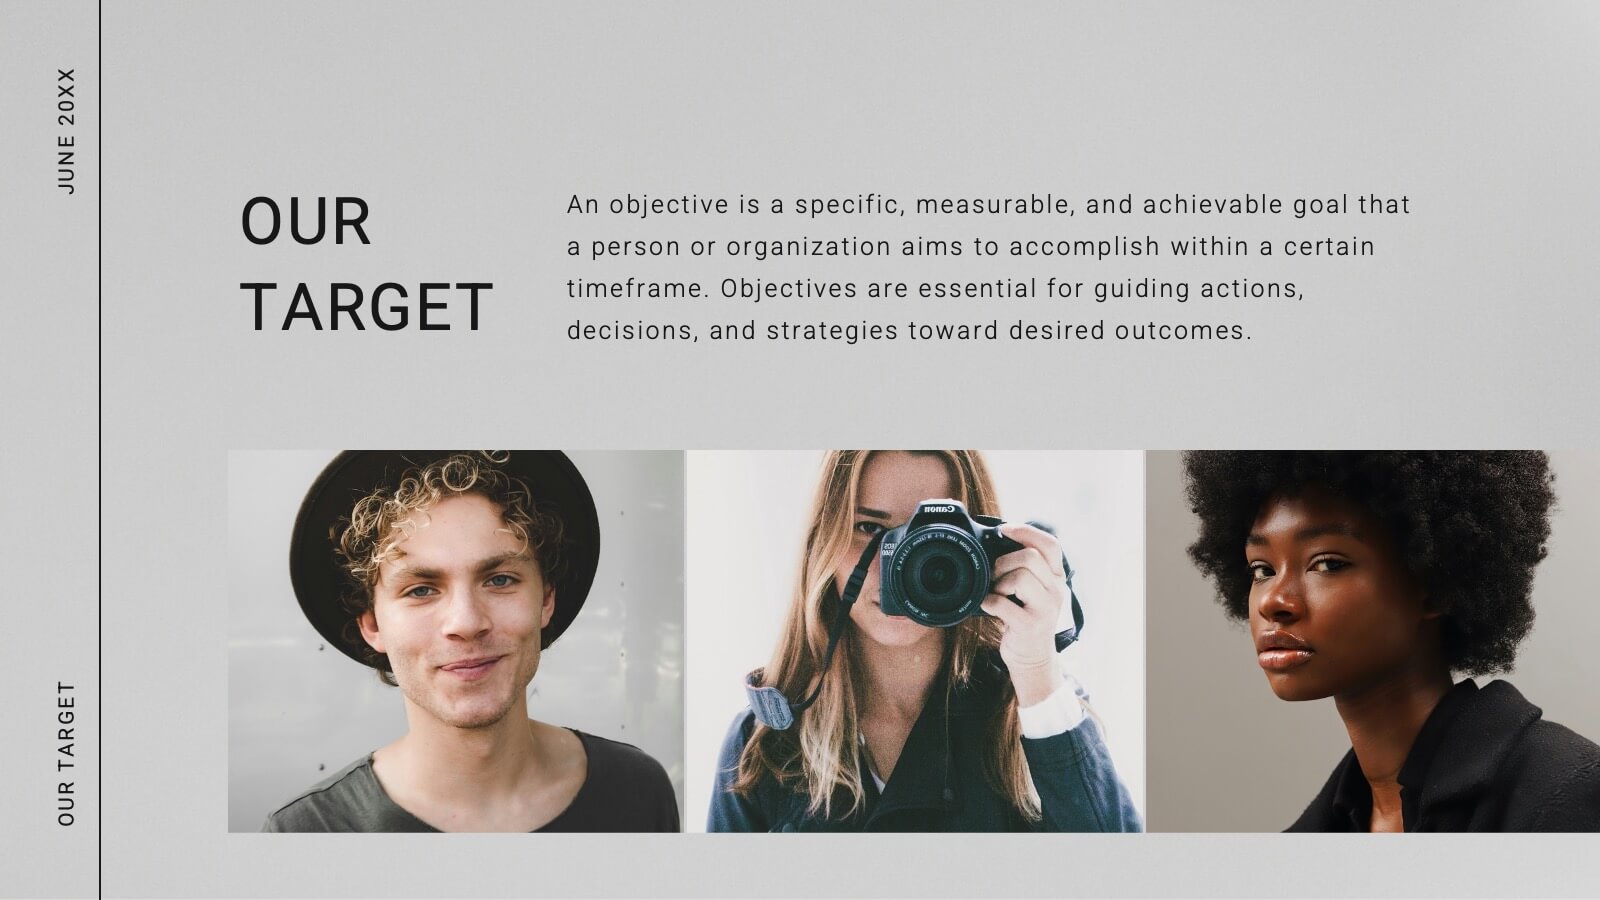
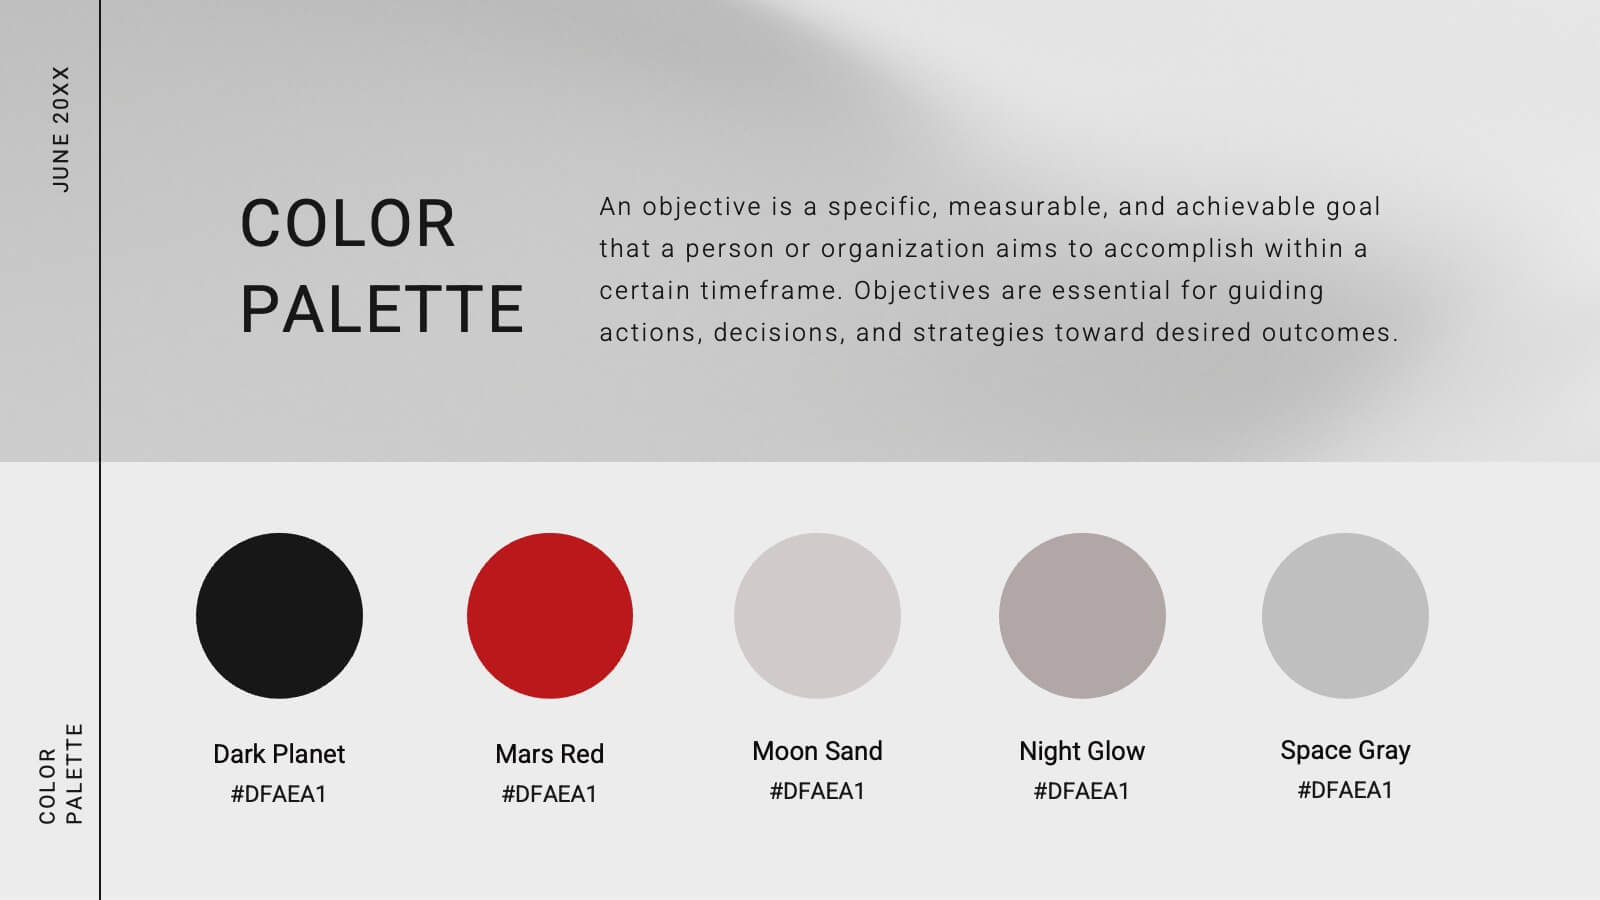
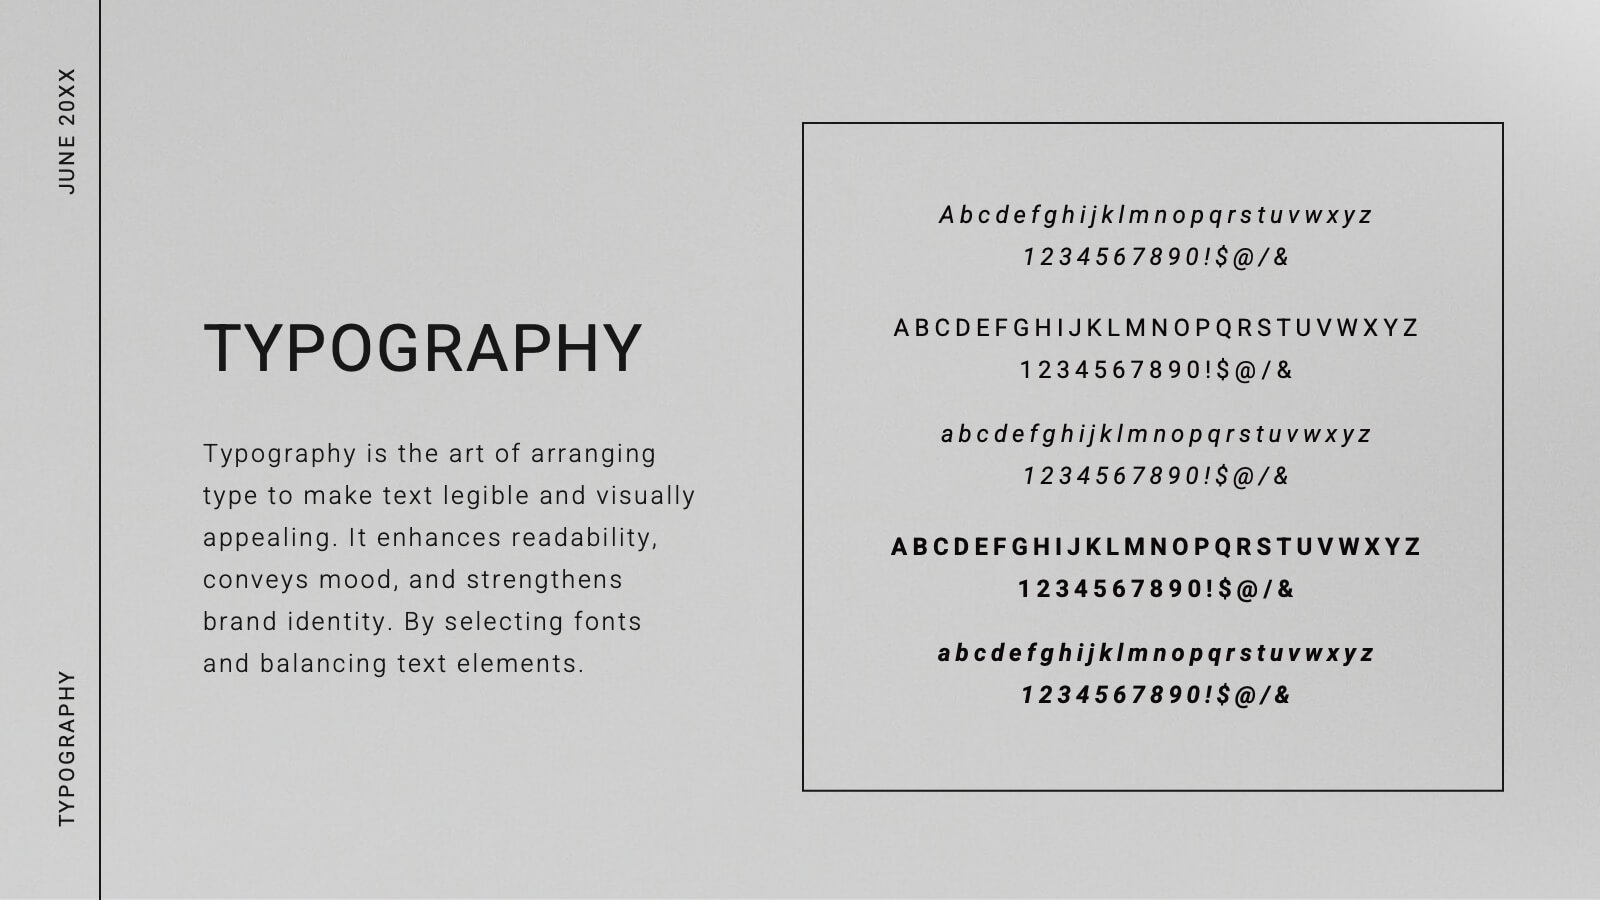
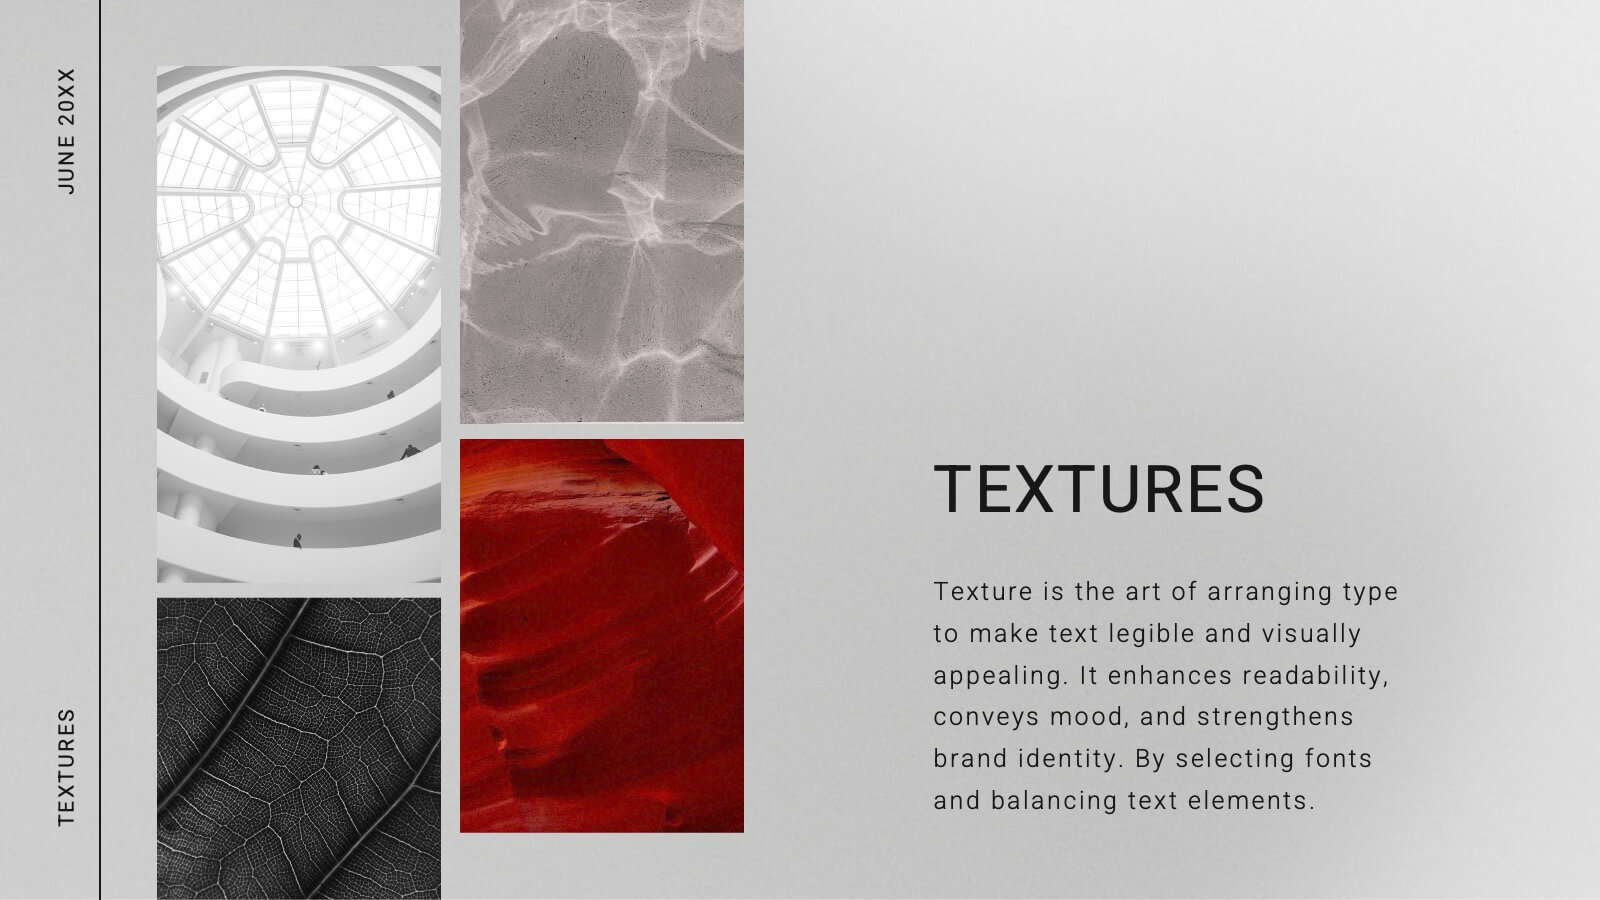
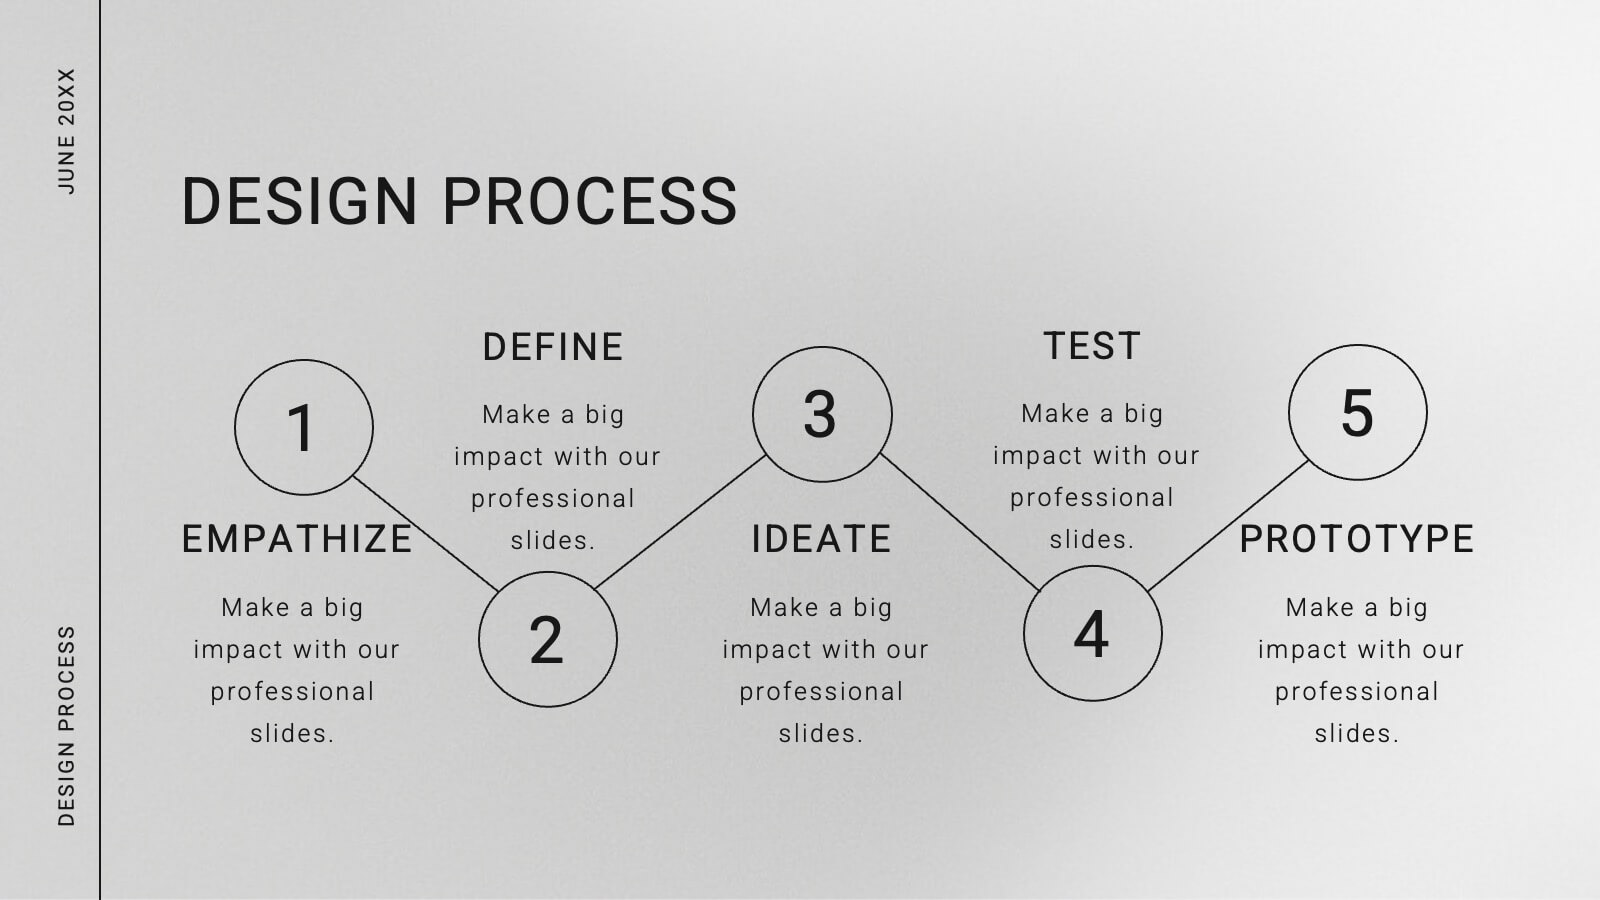
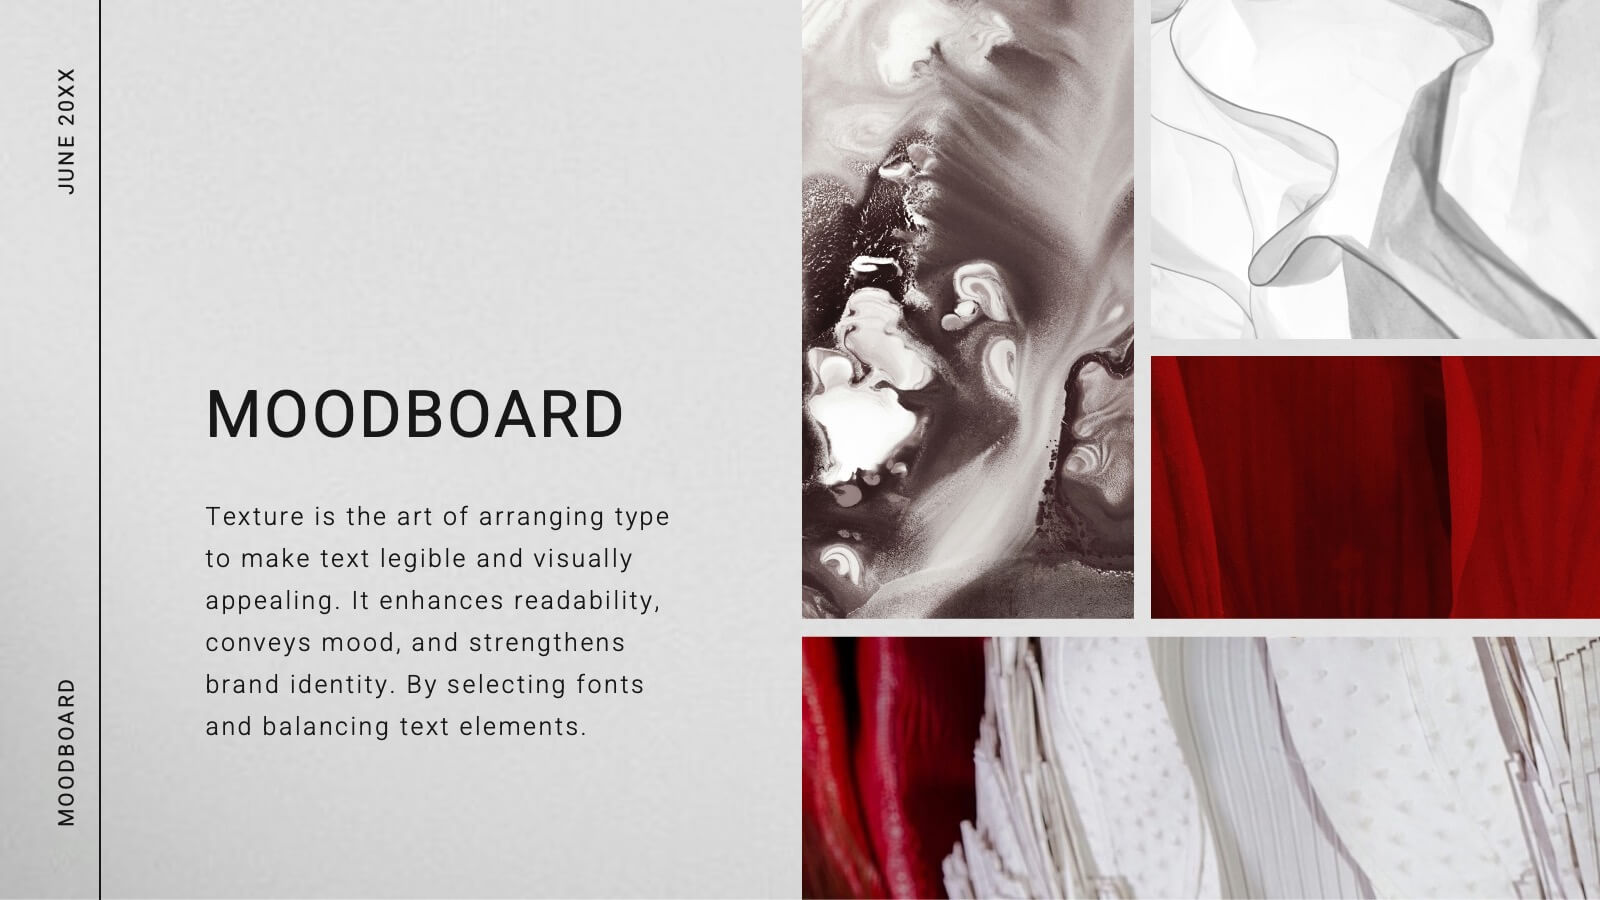
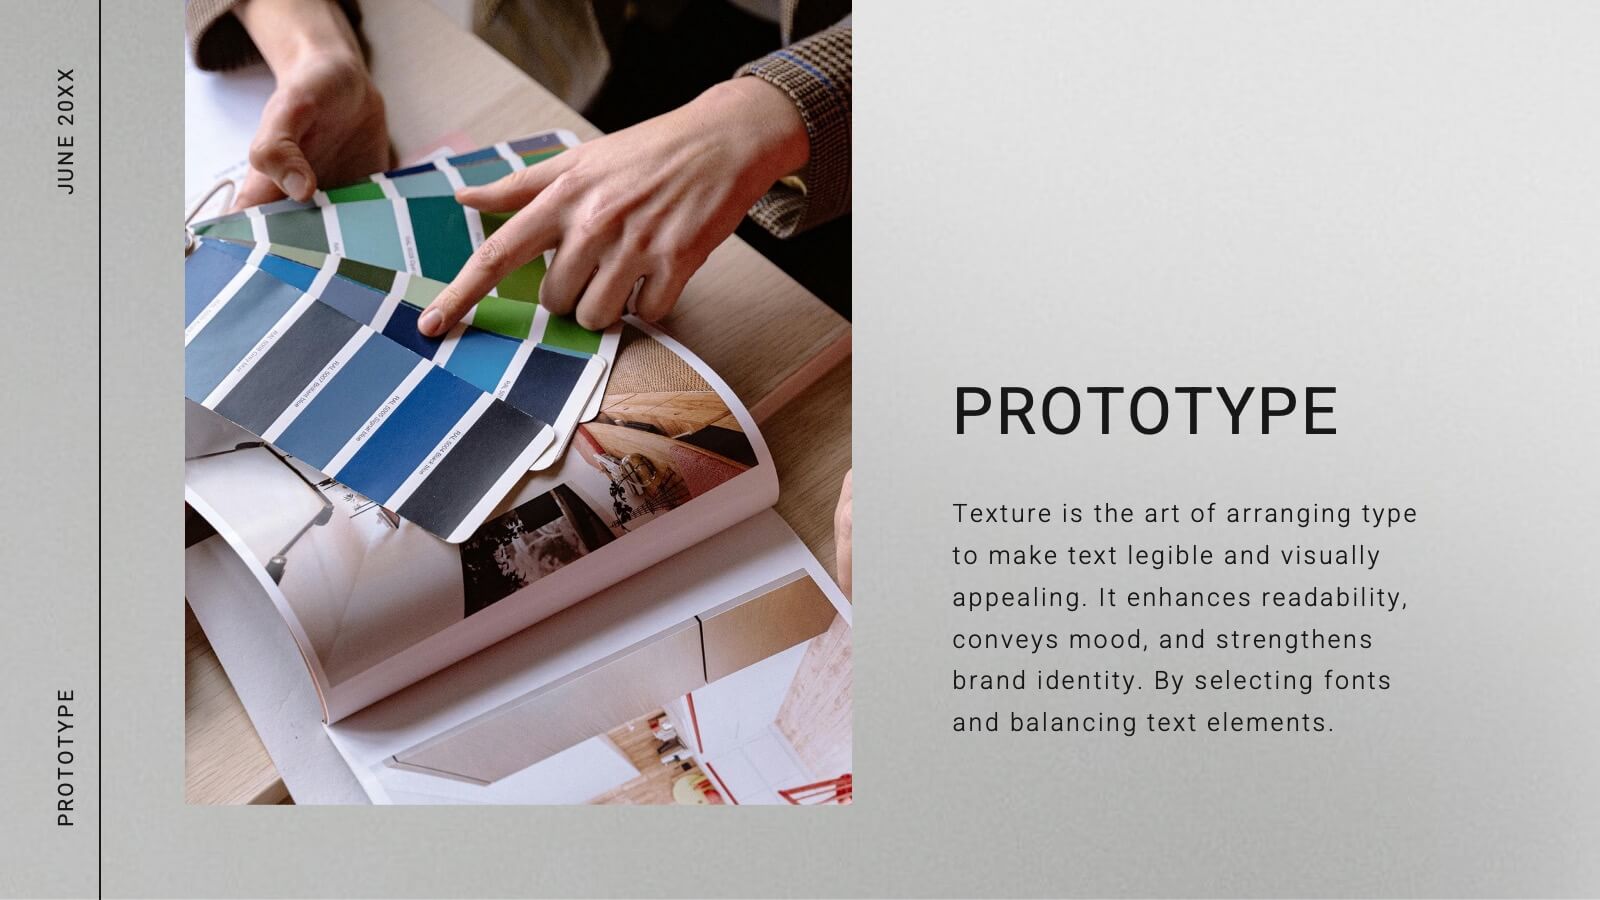
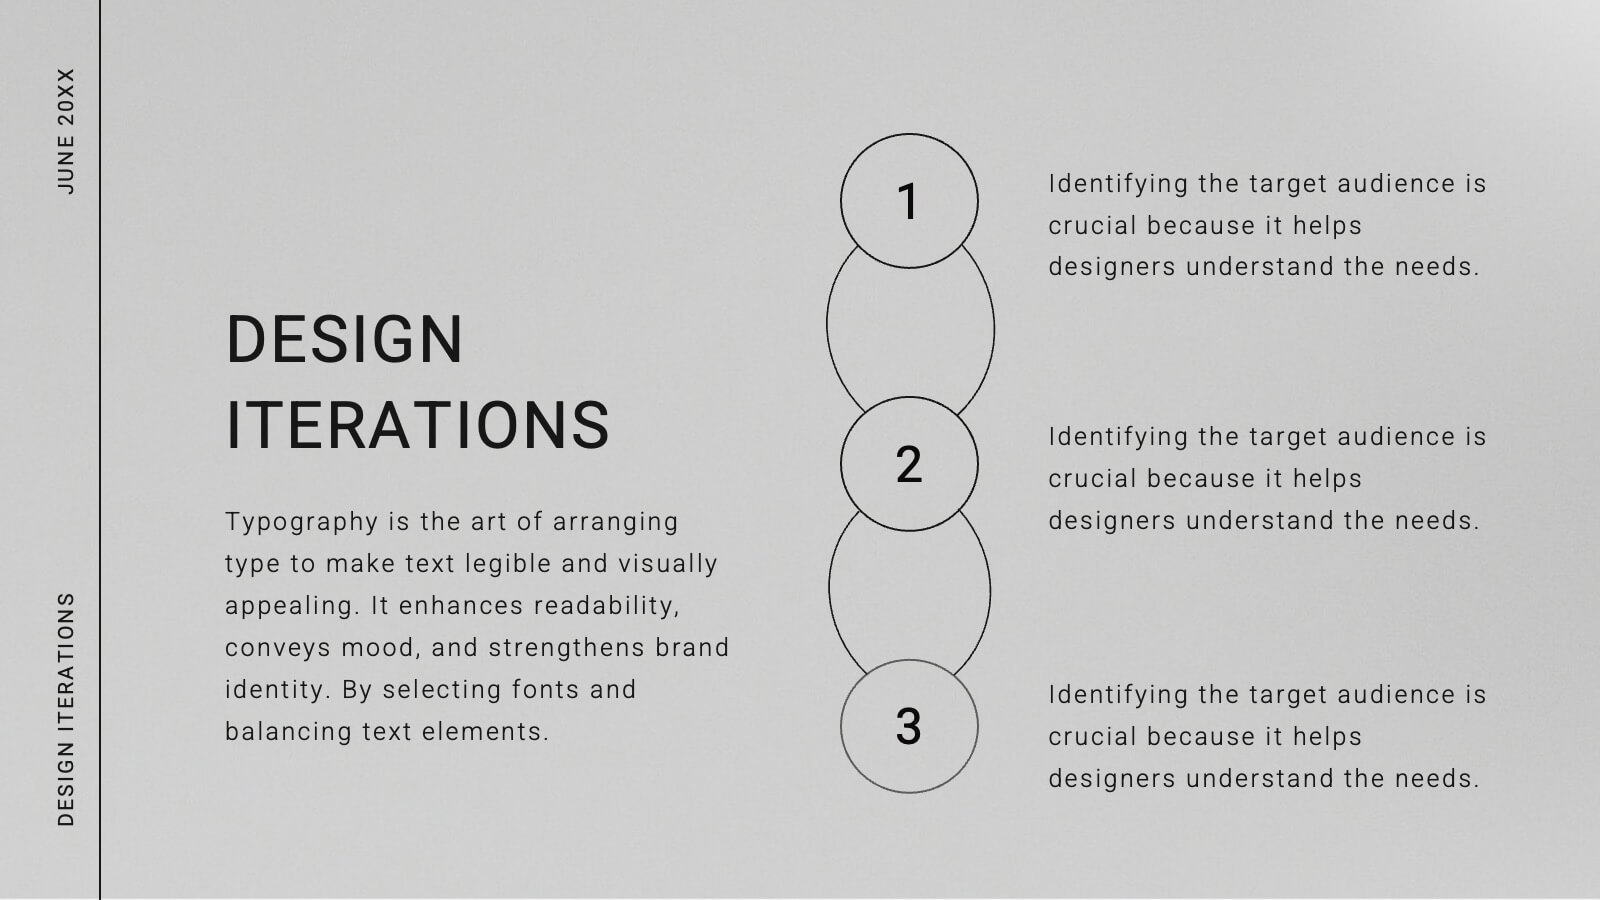
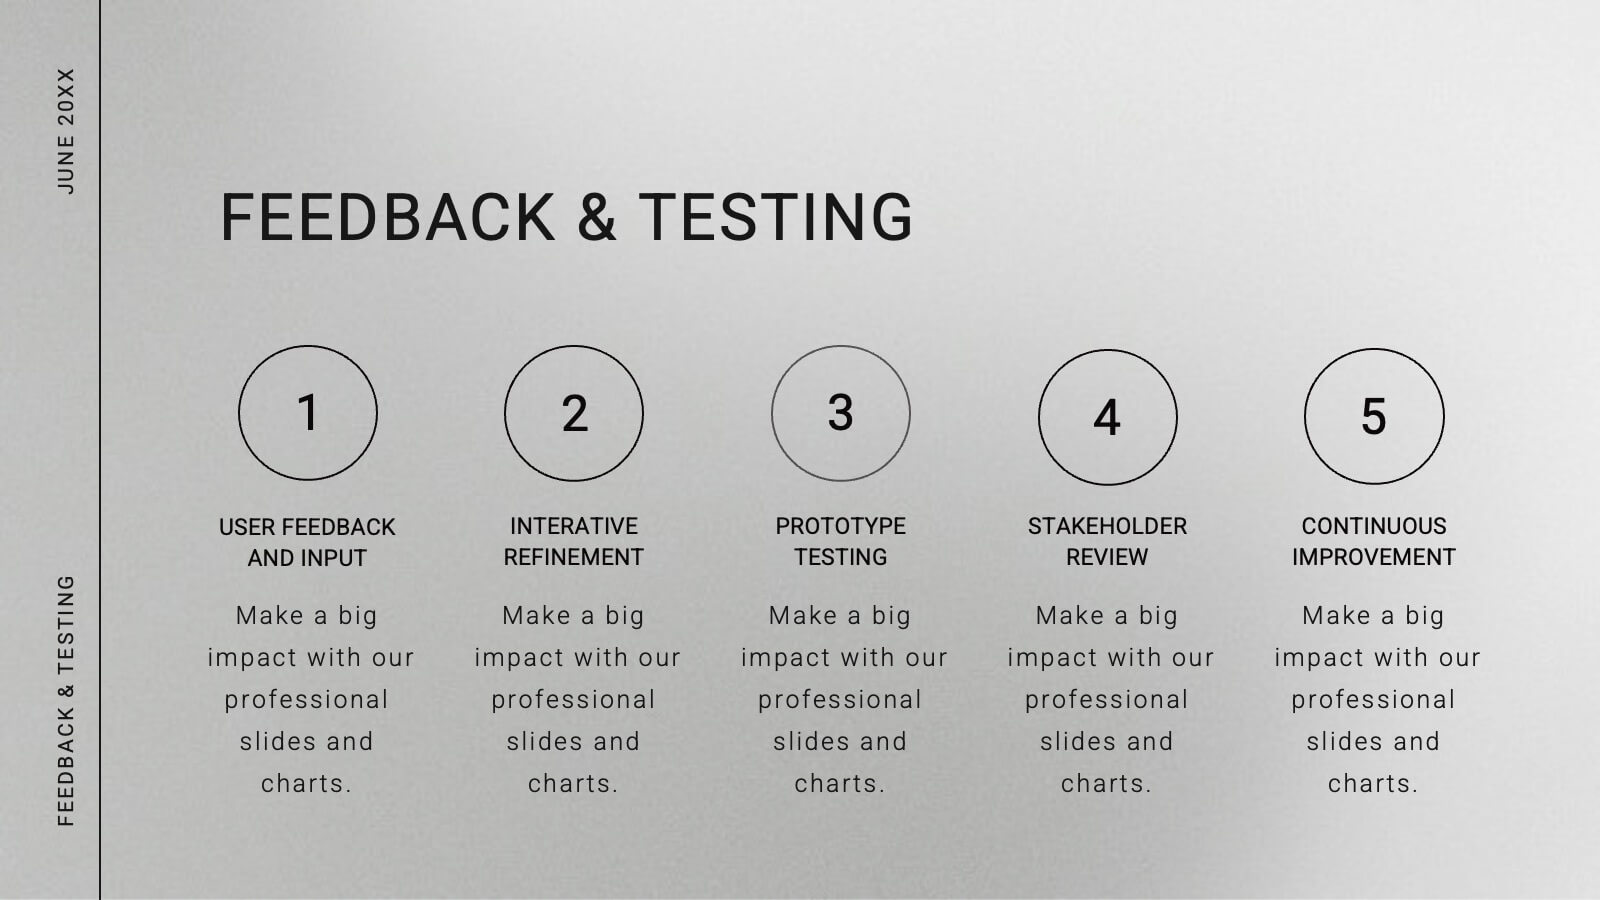
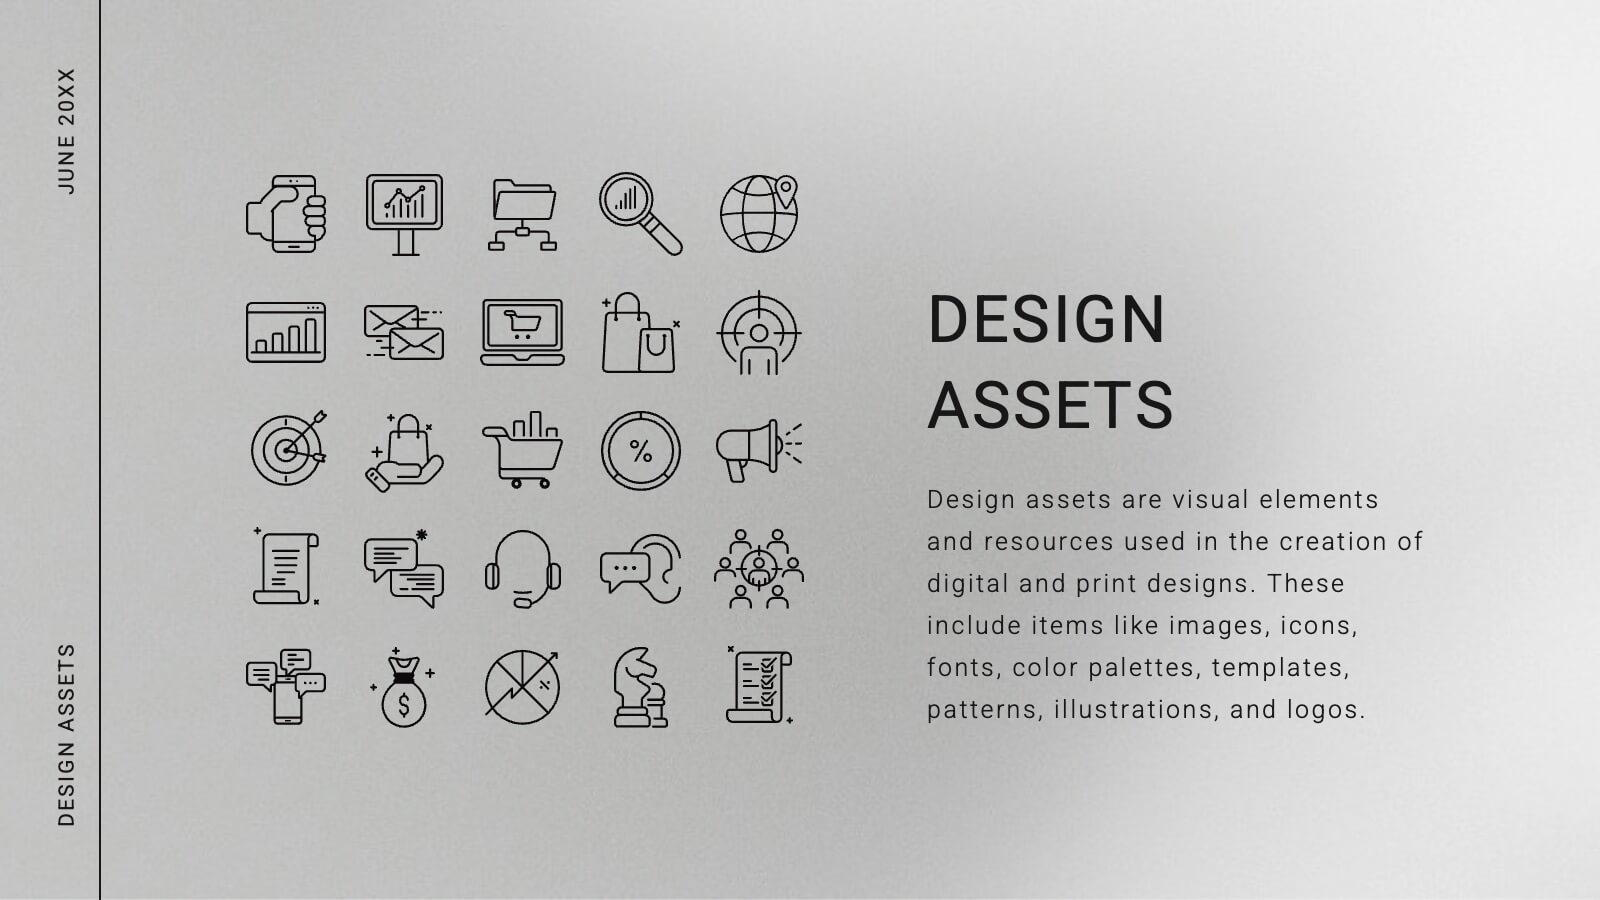
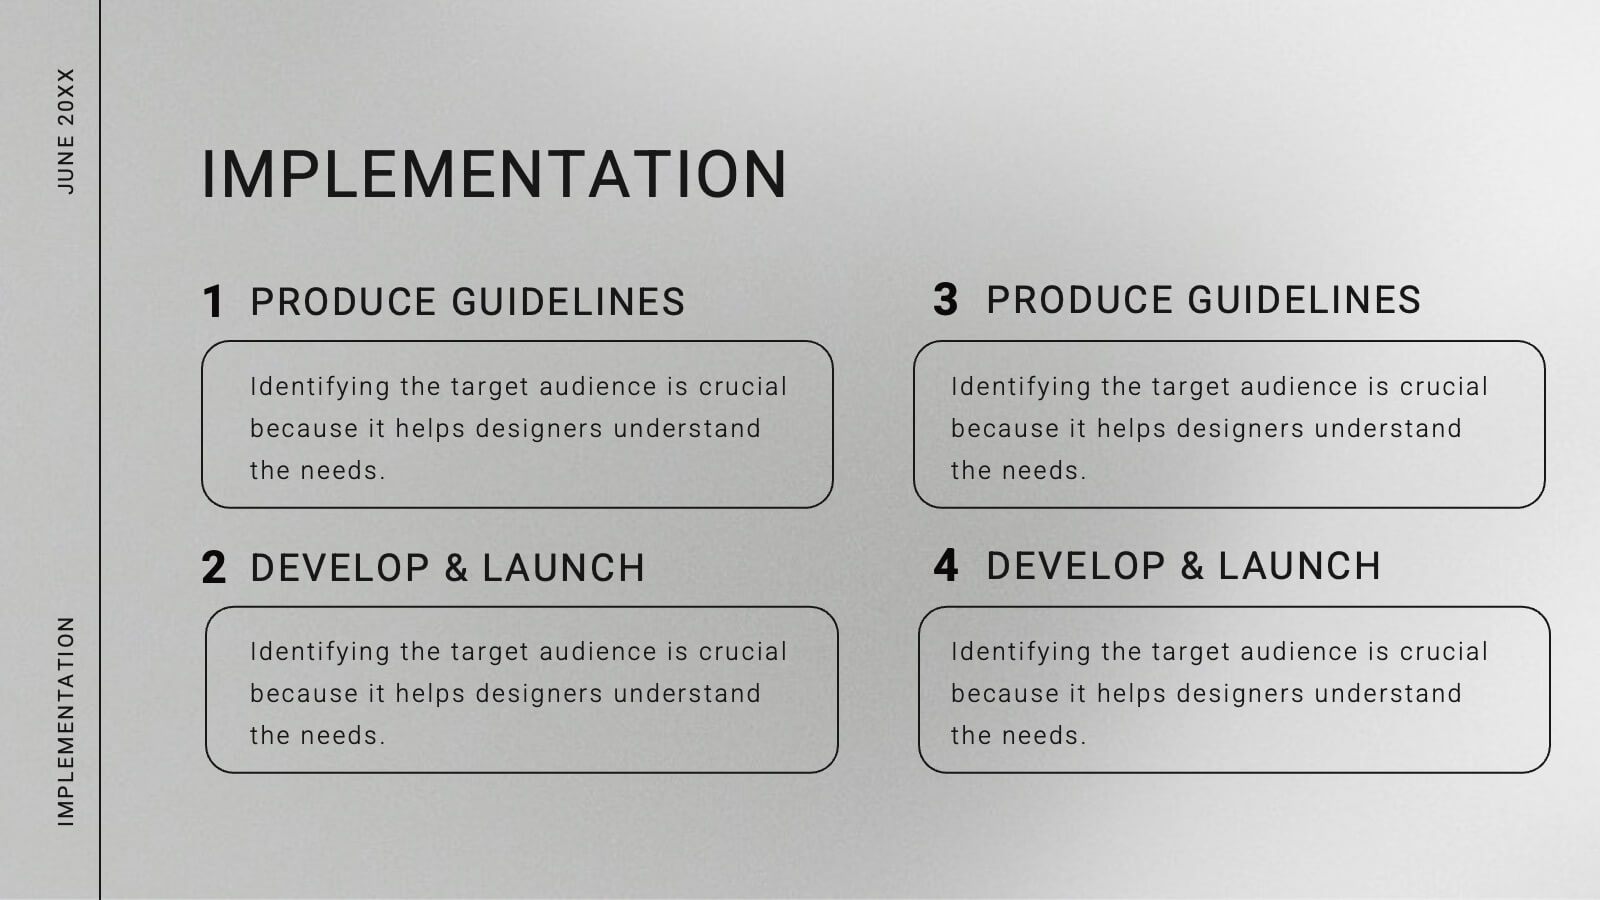
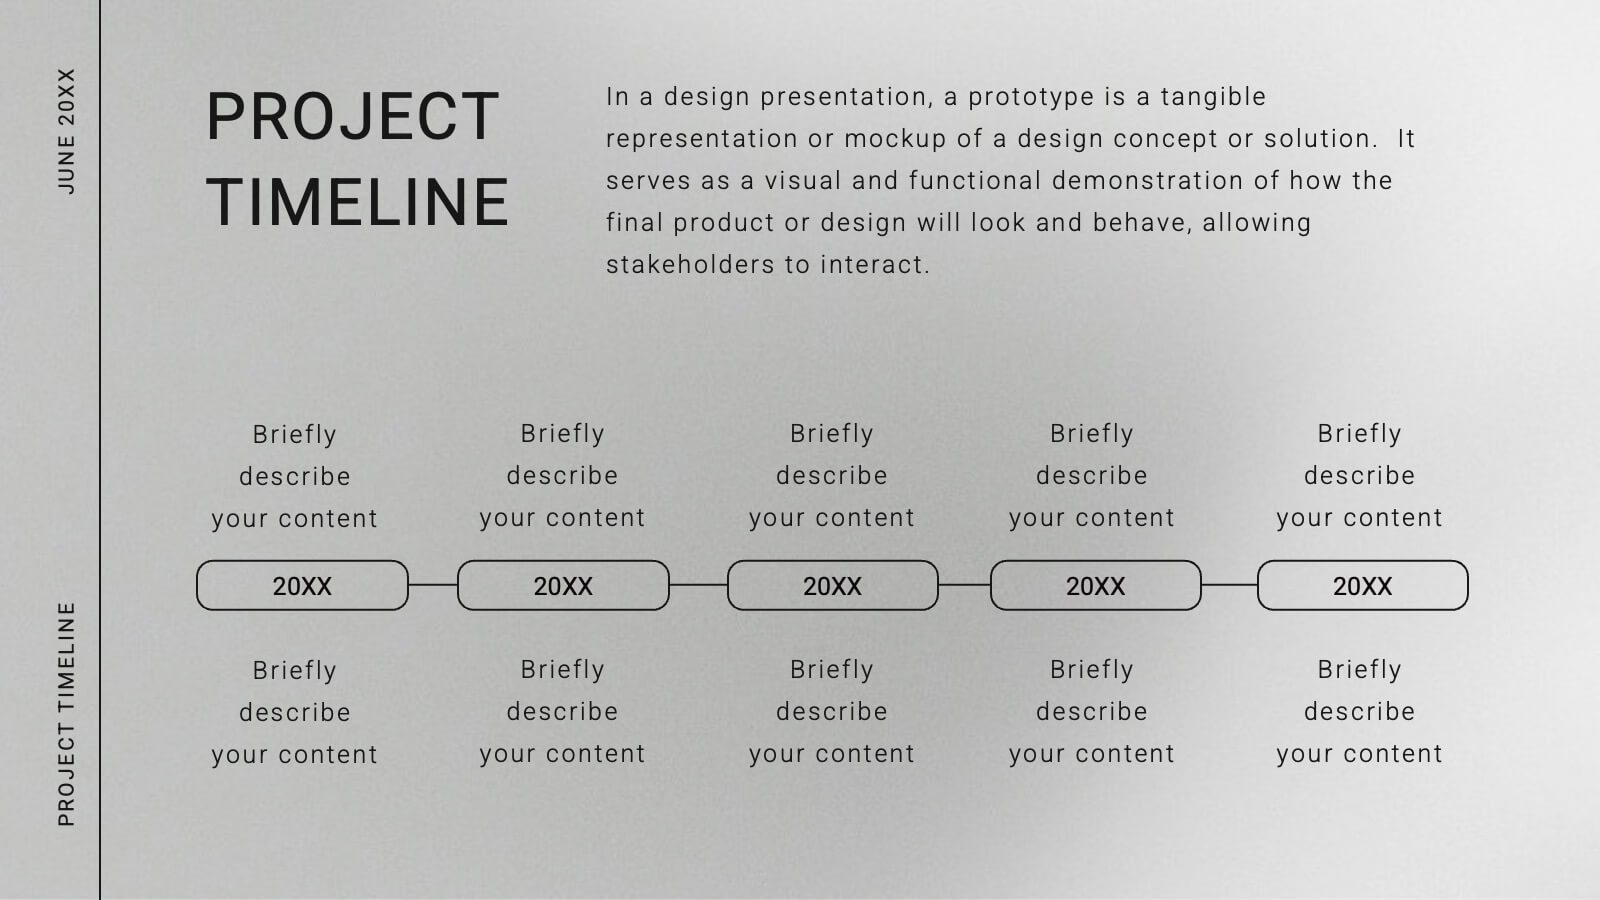
Comet Graphic Design Project Plan Presentation
Craft stunning design project presentations with this elegant template. Showcase objectives, processes, mood boards, and final designs effectively. Ideal for creative teams and clients. Fully compatible with PowerPoint, Keynote, and Google Slides.


23 slides
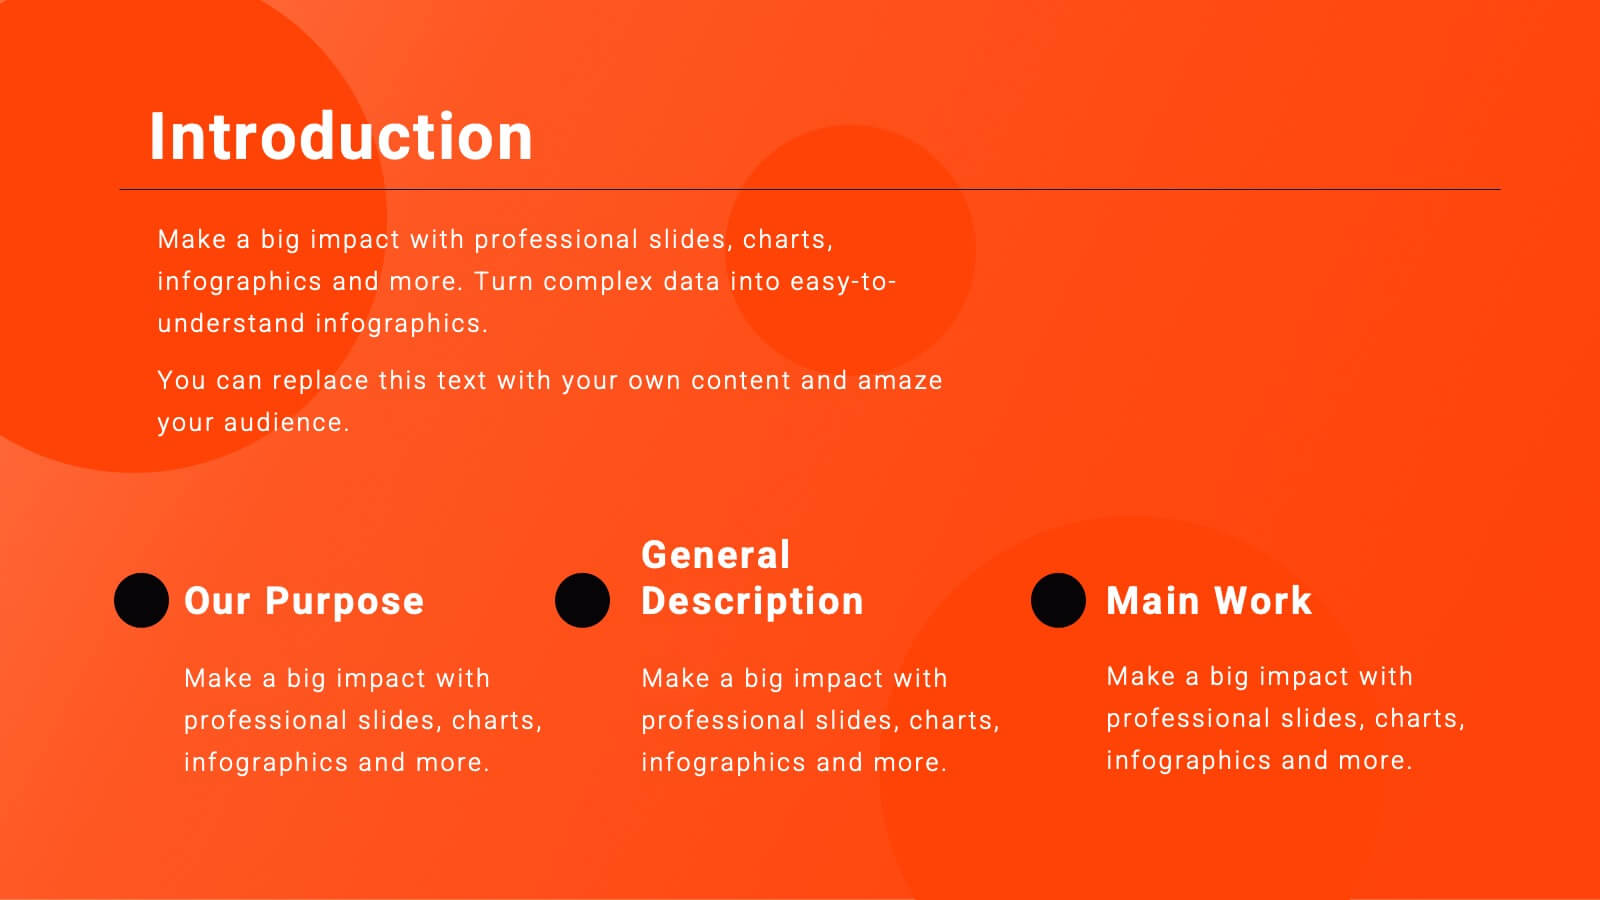
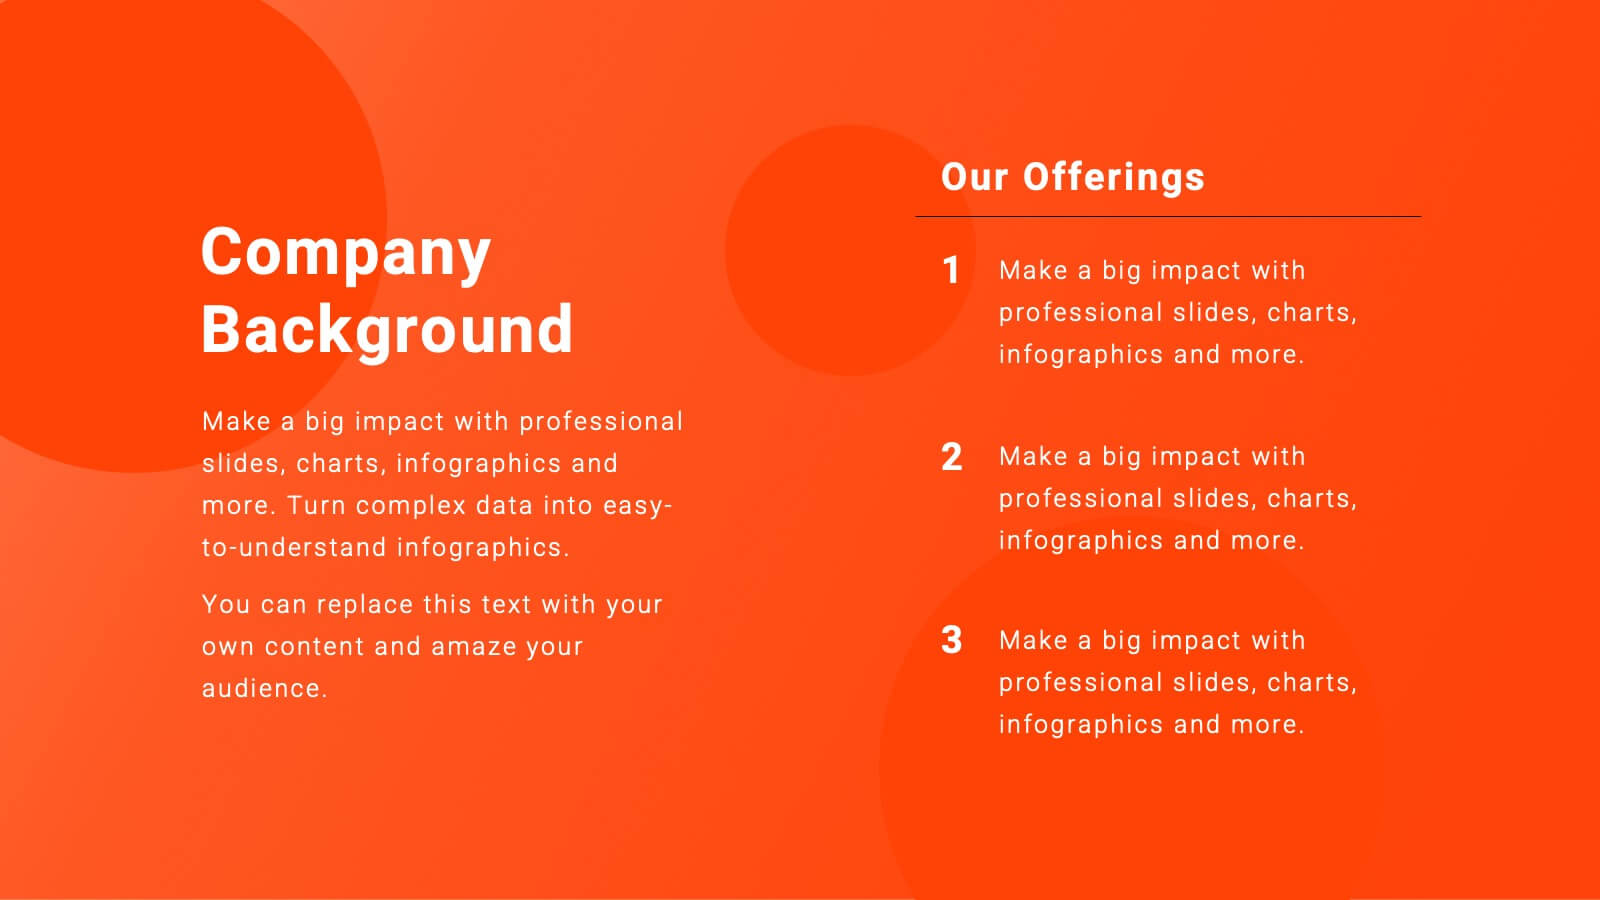
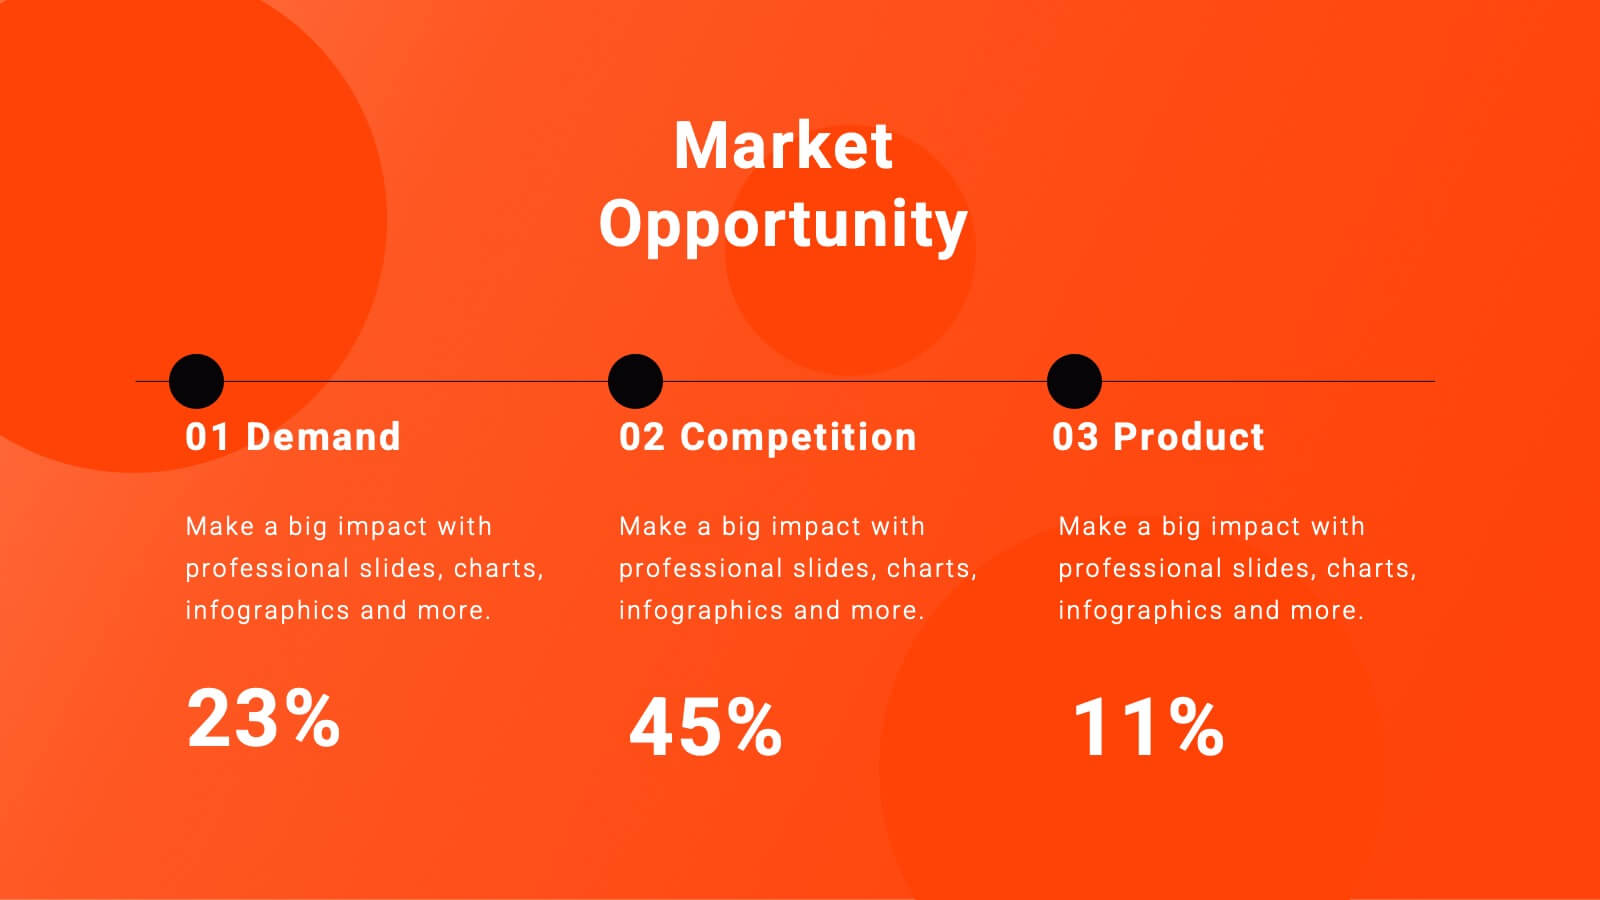
Equinox Business Operations Plan Presentation
Elevate your business operations with this dynamic plan template! Perfect for detailing company background, market opportunities, and strategic objectives. Ideal for business leaders and managers aiming to streamline operations and drive growth. Compatible with PowerPoint, Keynote, and Google Slides, this template ensures your business plan is clear, professional, and impactful. Drive success today!


10 slides
Work Schedule and Task Management Presentation
Enhance your project management with the Work Schedule and Task Management template, expertly designed to organize and visualize tasks efficiently, ensuring productivity and clarity in your workflow. It features distinct icons and color-coded stages to delineate project phases, ideal for tracking progress and ensuring team alignment. This versatile template is compatible with PowerPoint, Keynote, and Google Slides, allowing for seamless integration into any presentation workflow.


4 slides
Strategic Business Objectives Framework
Showcase your company's top strategic goals with this clean and professional slide. Each briefcase icon represents a key business objective, perfect for planning, reporting, or investor updates. Fully customizable in PowerPoint, Keynote, and Google Slides.


6 slides
Detailed Case Analysis Report Presentation
Turn complex findings into a clear and engaging story with this modern, data-focused layout. Ideal for professionals presenting research, performance reviews, or audit results, it helps you organize insights with precision and clarity. Fully editable and compatible with PowerPoint, Keynote, and Google Slides for effortless customization and presentation delivery.