


Features
- 7 Unique slides
- Fully editable and easy to edit in Microsoft Powerpoint, Keynote and Google Slides
- 16:9 widescreen layout
- Clean and professional designs
- Export to JPG, PDF or send by email


Do you have any questions?
Recommend


7 slides
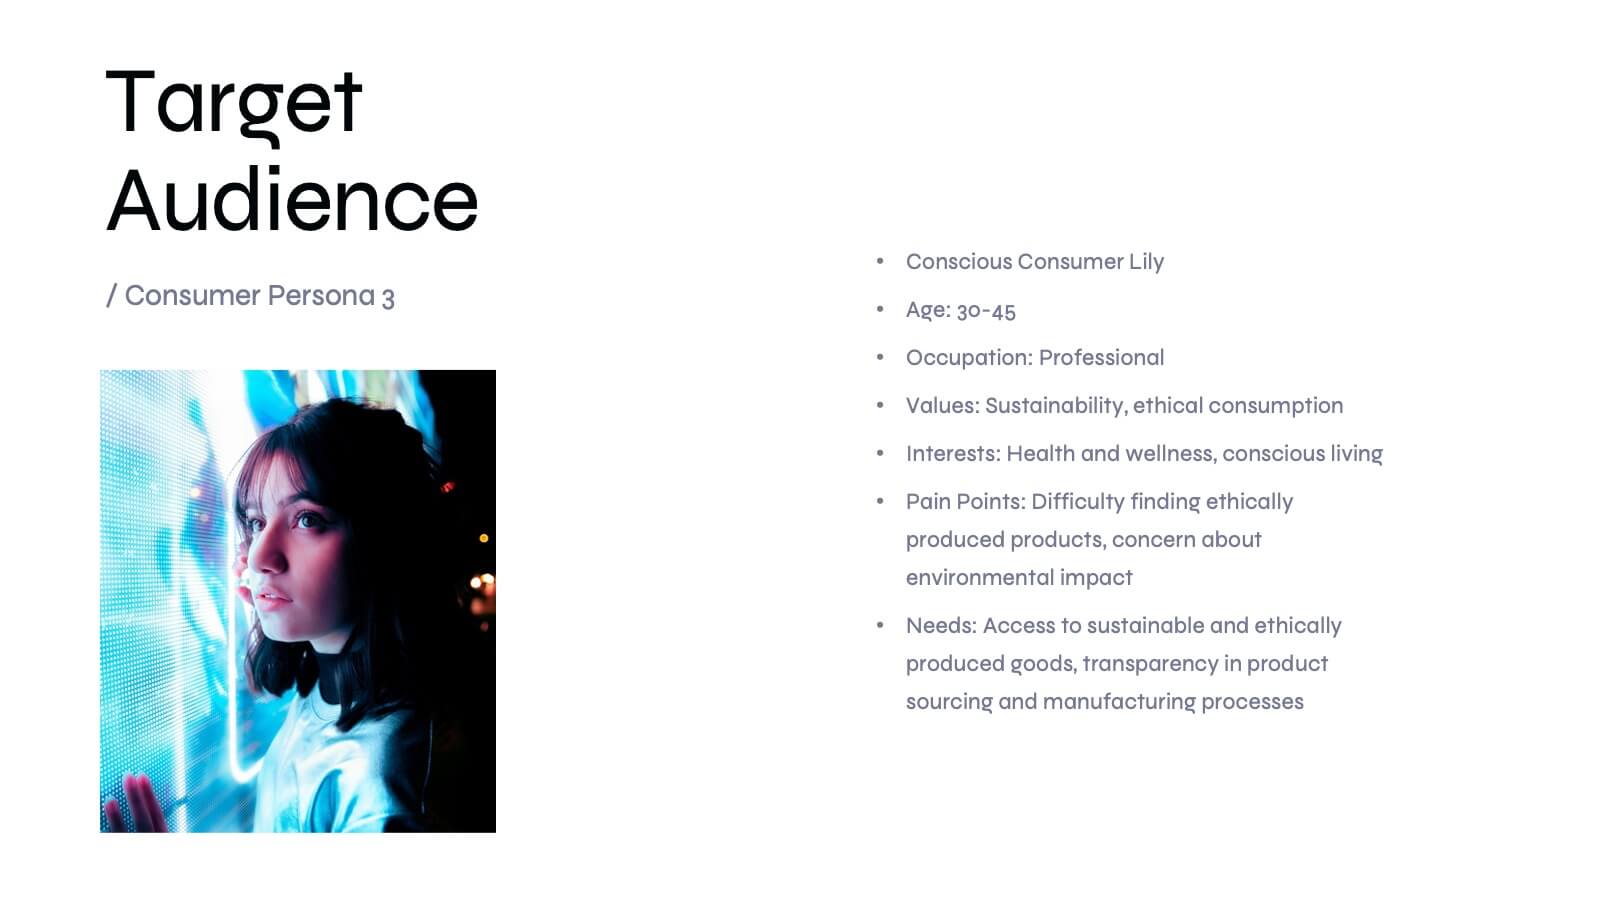
Empathy Map Infographic Presentation Template
An Empathy Map is a collaborative tool organizations can use to gain a deeper insight into their customers. Similar to a user persona, an empathy map can represent a group of users, such as a customer segment. An empathy map helps to map what a design team knows about the potential audience. Use this template to gain a deeper understanding of your target audience. This template comes with many empathy maps you can use to discover how to empathize with your customers. The empathy maps available in this template are designed to give you an avenue into the mind of your target audience.


21 slides
Dreamwood Sales Pitch Deck Presentation
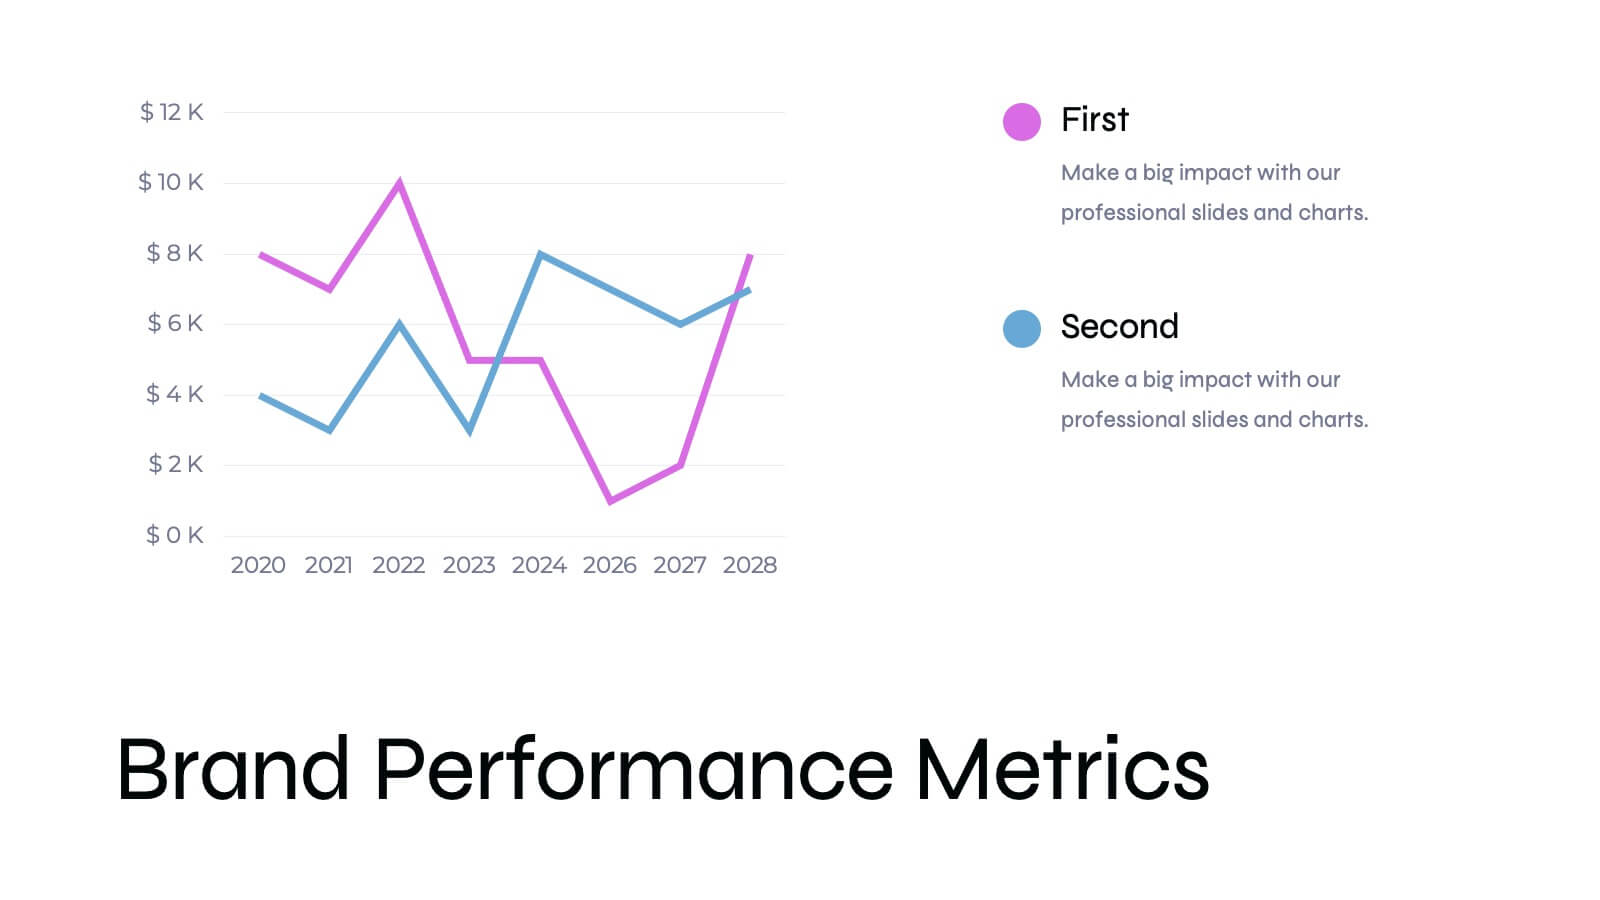
Deliver powerful sales presentations with this vibrant and engaging sales pitch deck template! It provides all essential sections, including sales objectives, customer testimonials, pricing strategy, and performance metrics, to help you leave a lasting impact. Perfect for business teams and client pitches, it’s compatible with PowerPoint, Keynote, and Google Slides for seamless customization.


7 slides
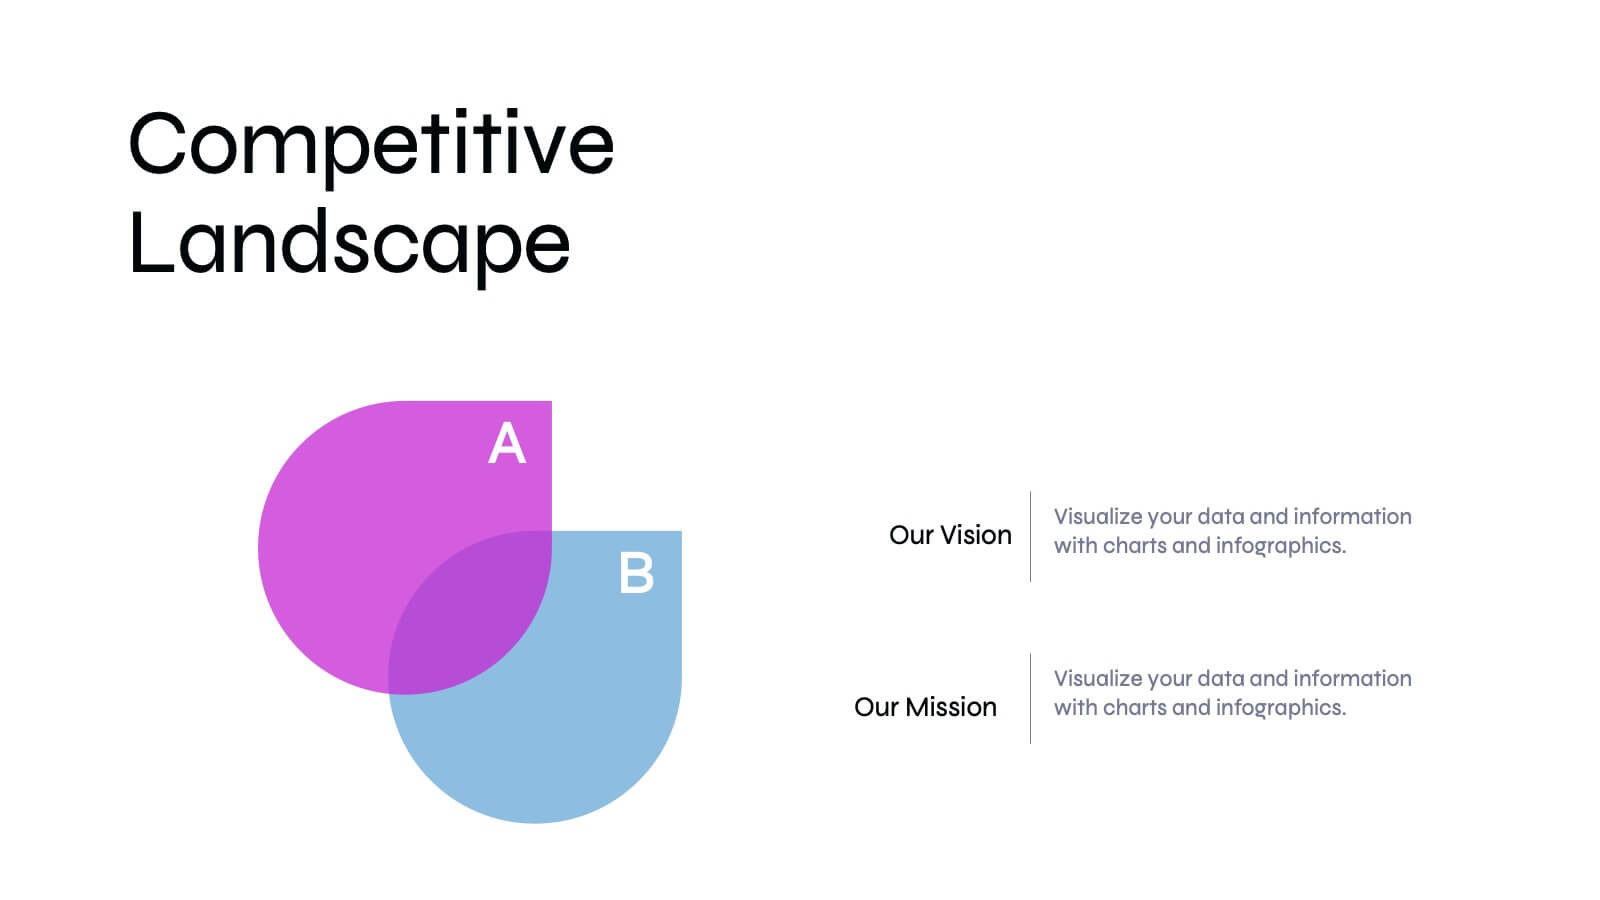
Concentric Circle Diagrams Infographic Presentation Template
Concentric Circle Diagrams can display interrelated and independent units of a concept in overlapping circular designs. The diagram is really helpful for organizing information, displaying relationships among concepts, showing whole-part relationships and more. It uses overlapping circular designs to display ideas and separate them with their own size, color and position on a chart. This template contains a variety of circular diagram that display in overlapping different-shaded circles. This template can be used to demonstrate the relationship of all elements to the central idea.


7 slides
Product Innovation Infographic
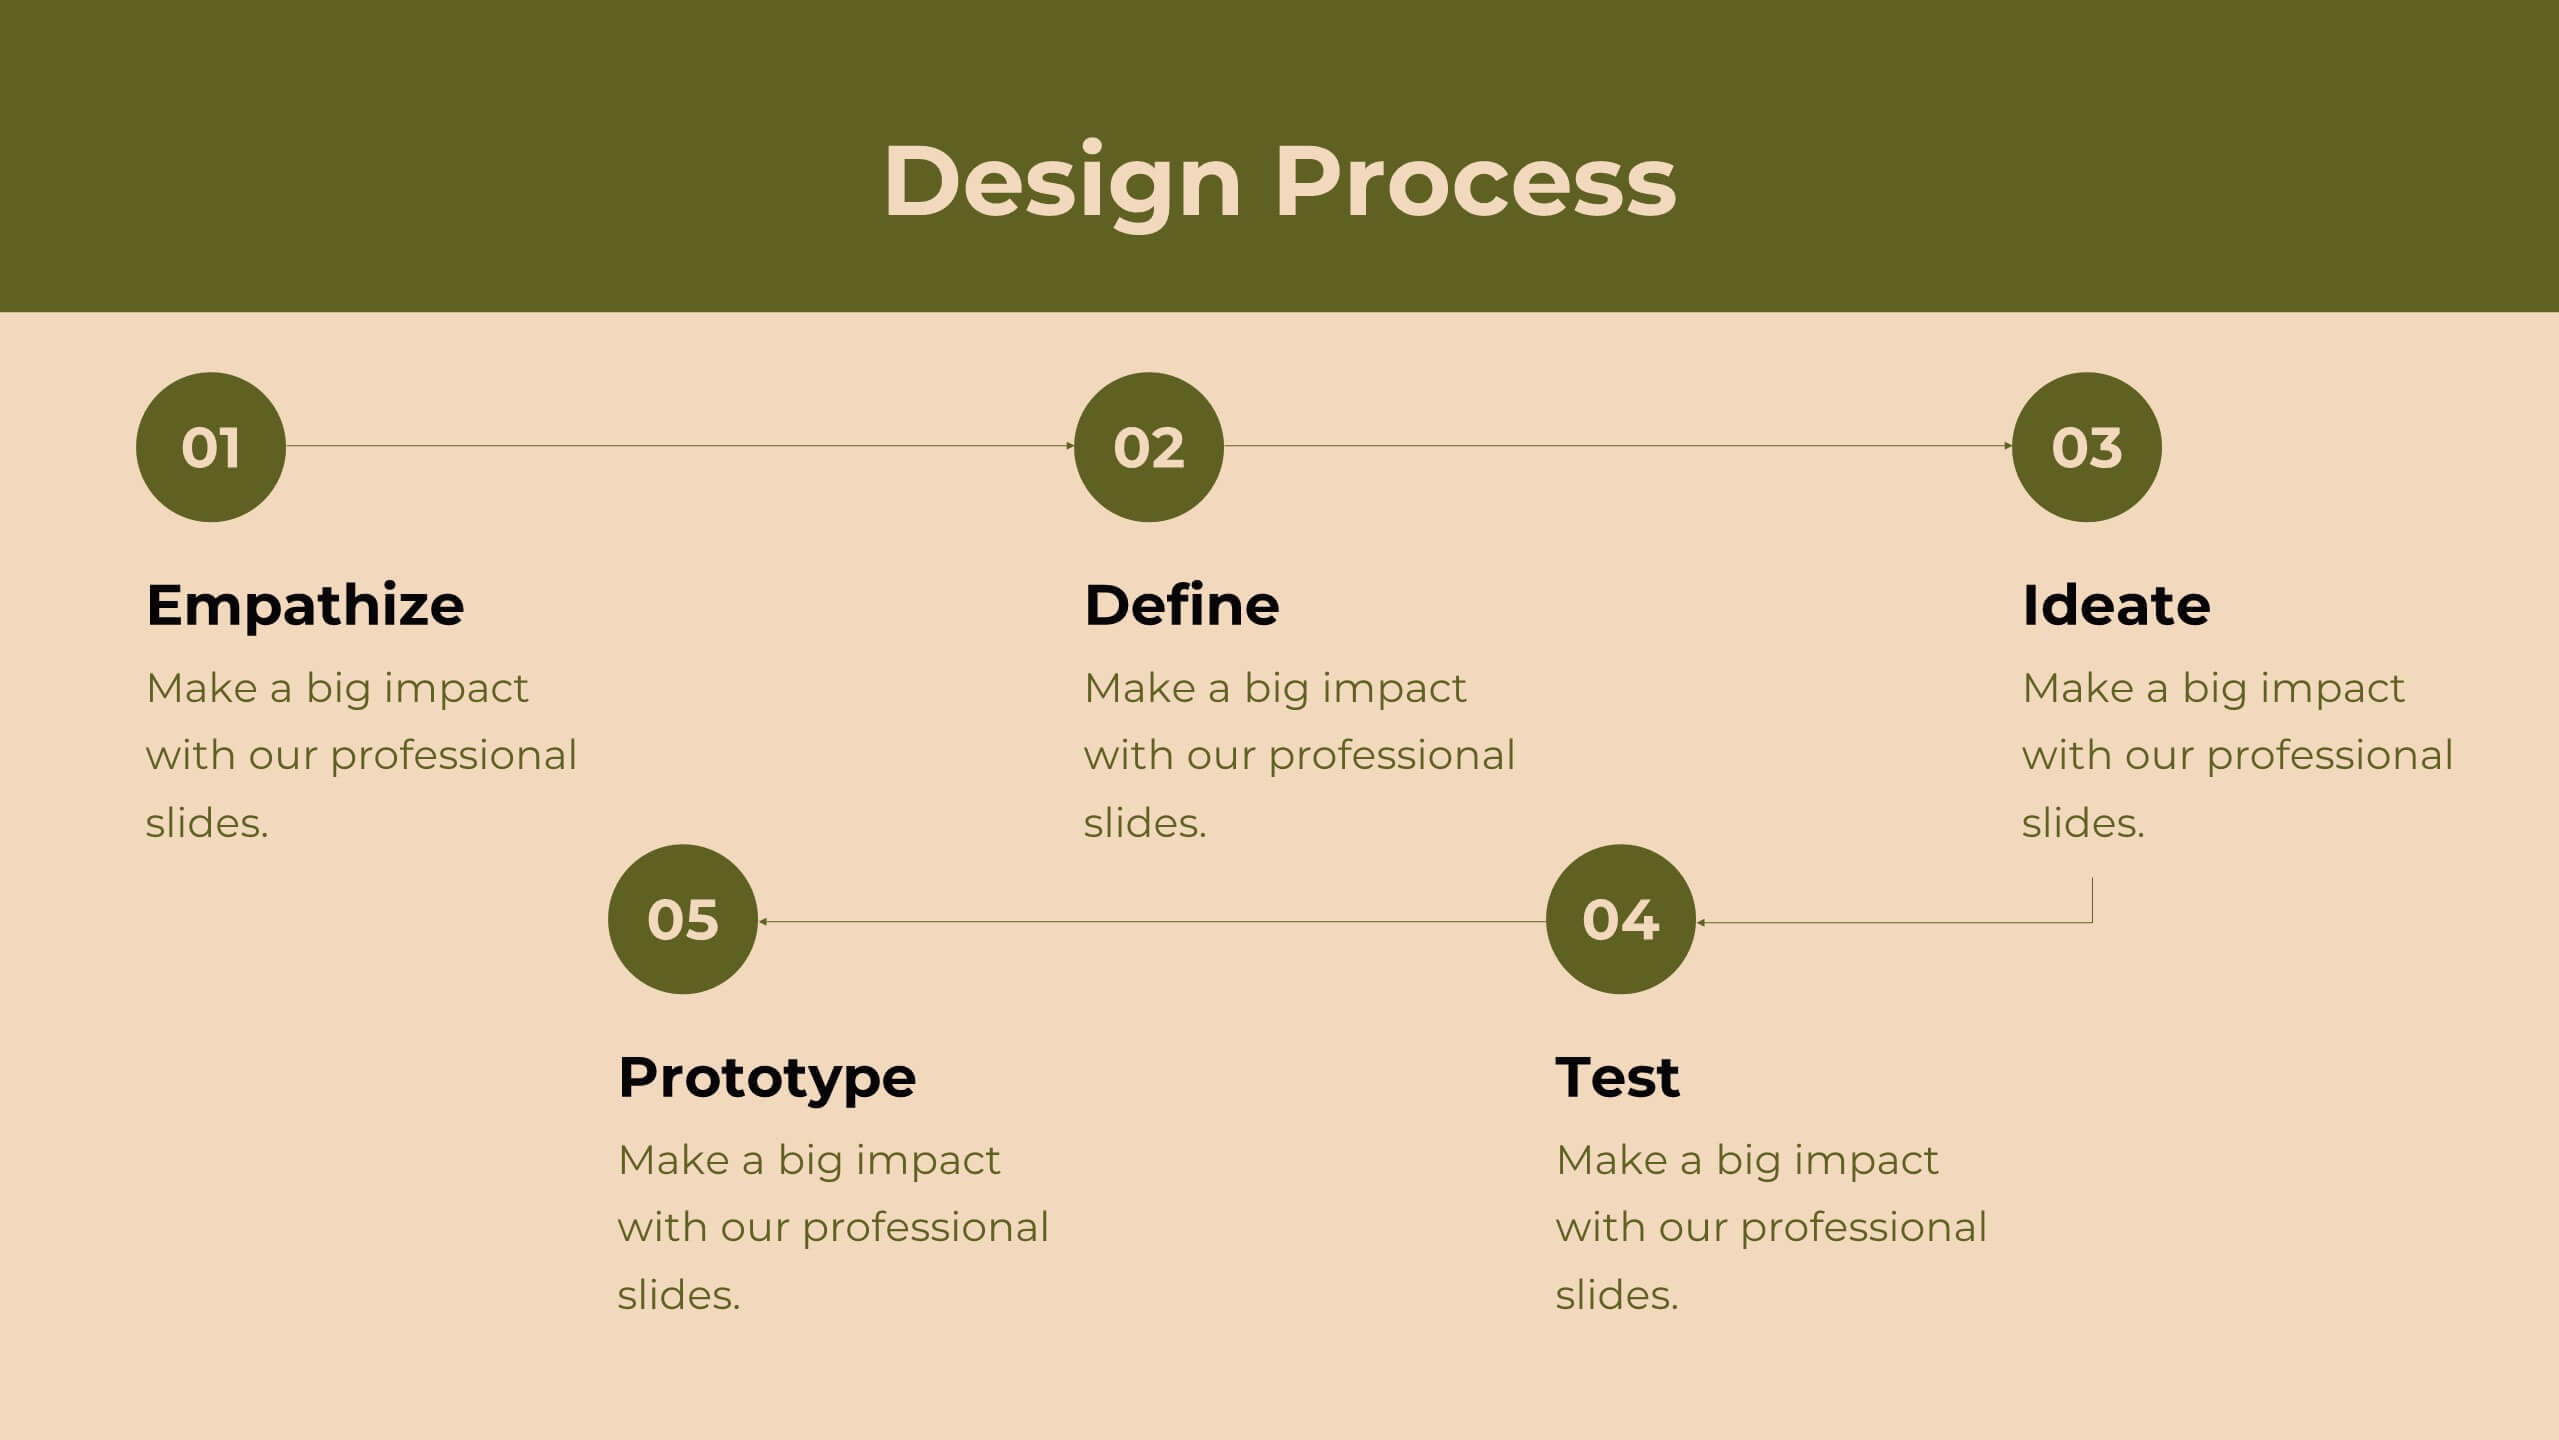
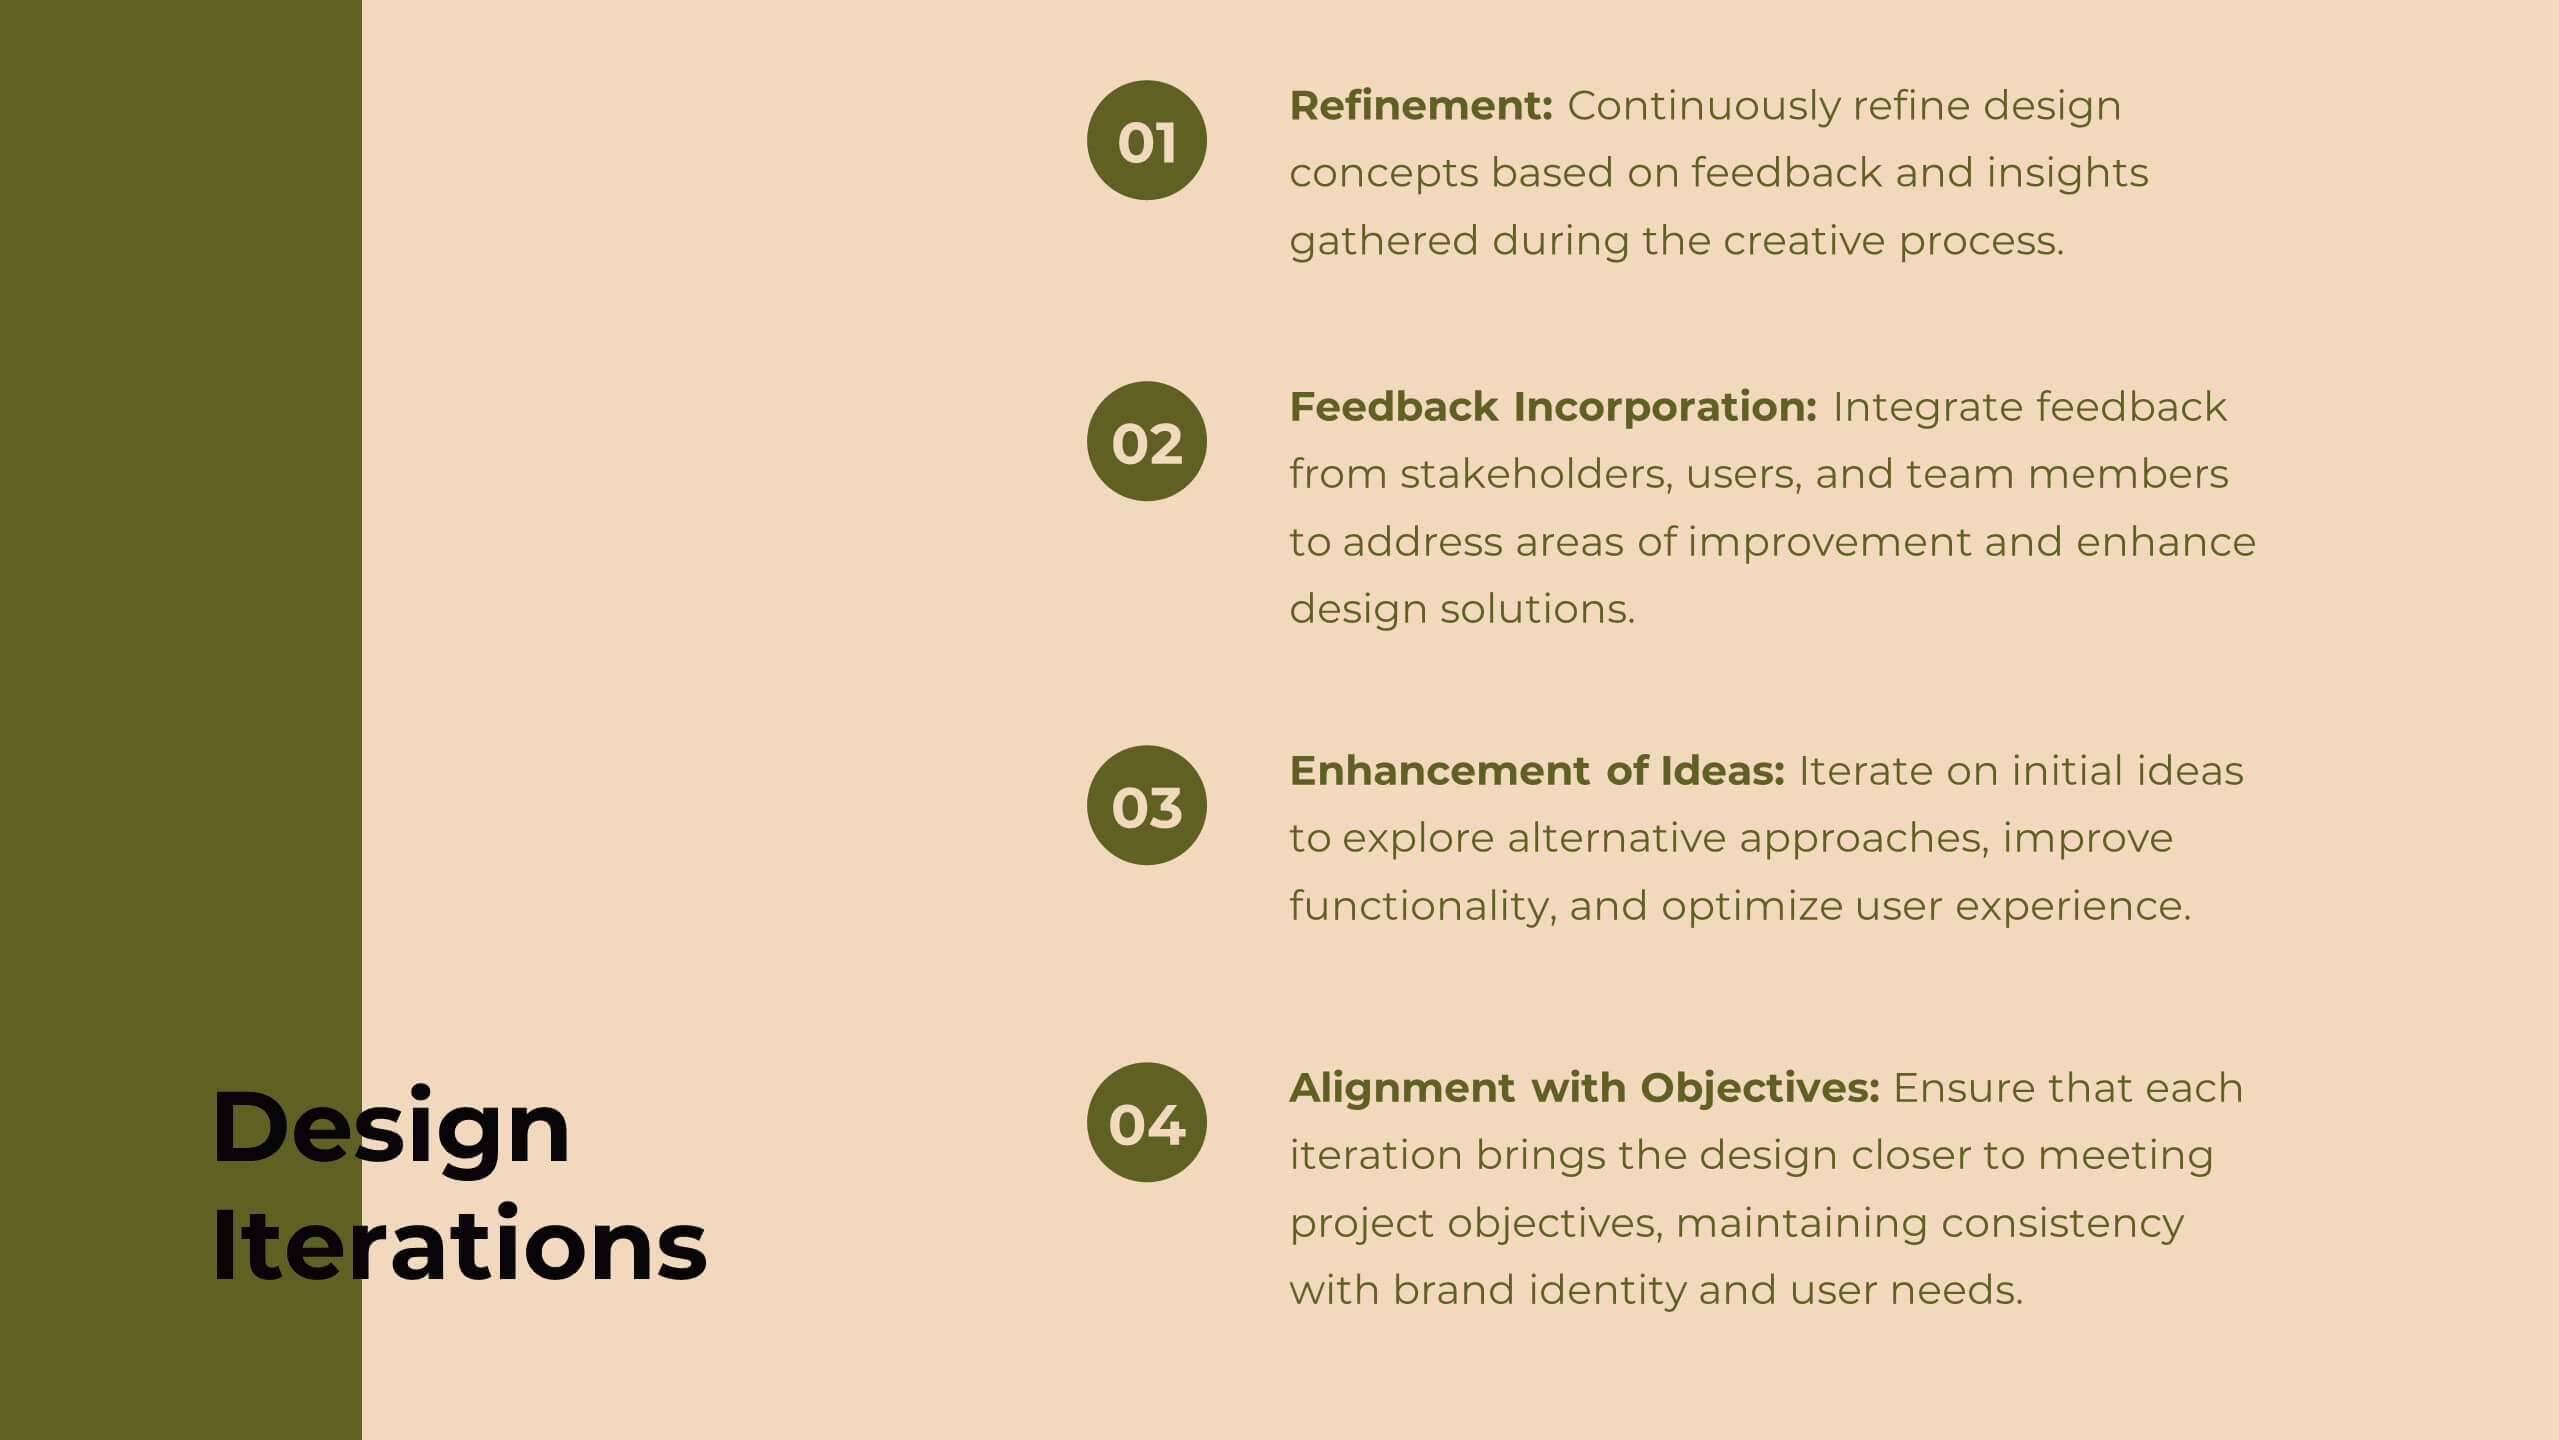
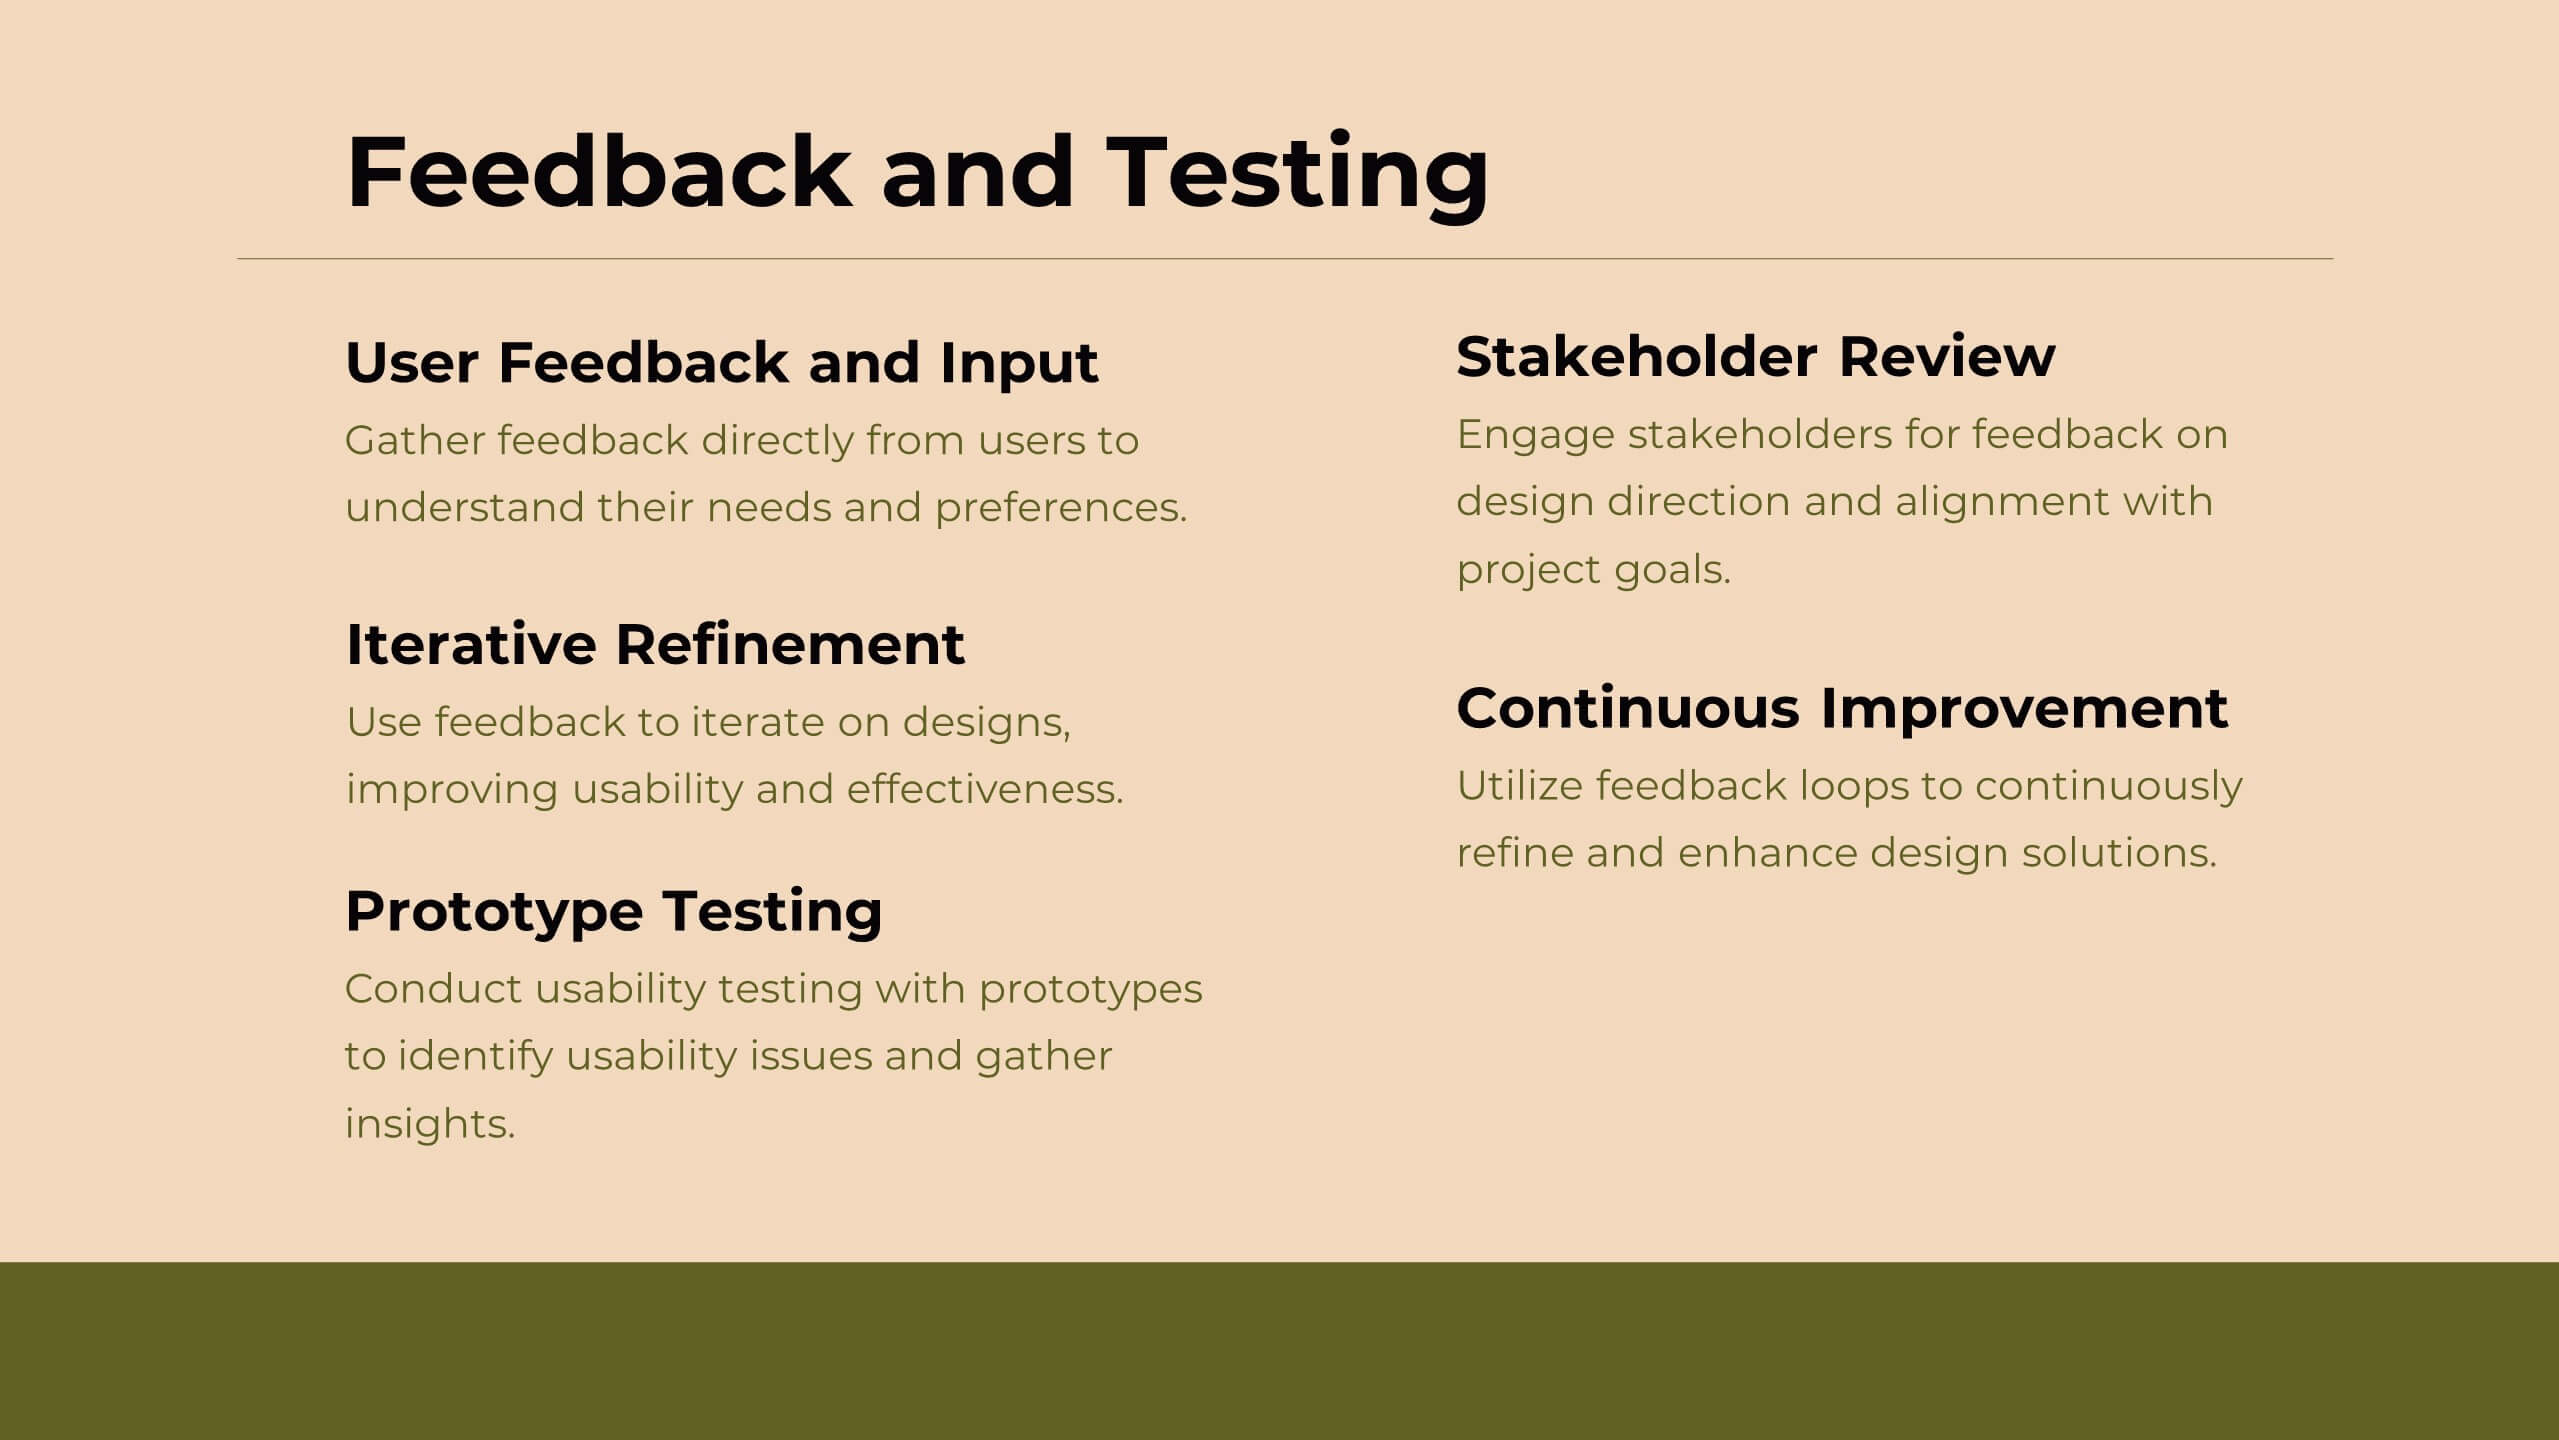
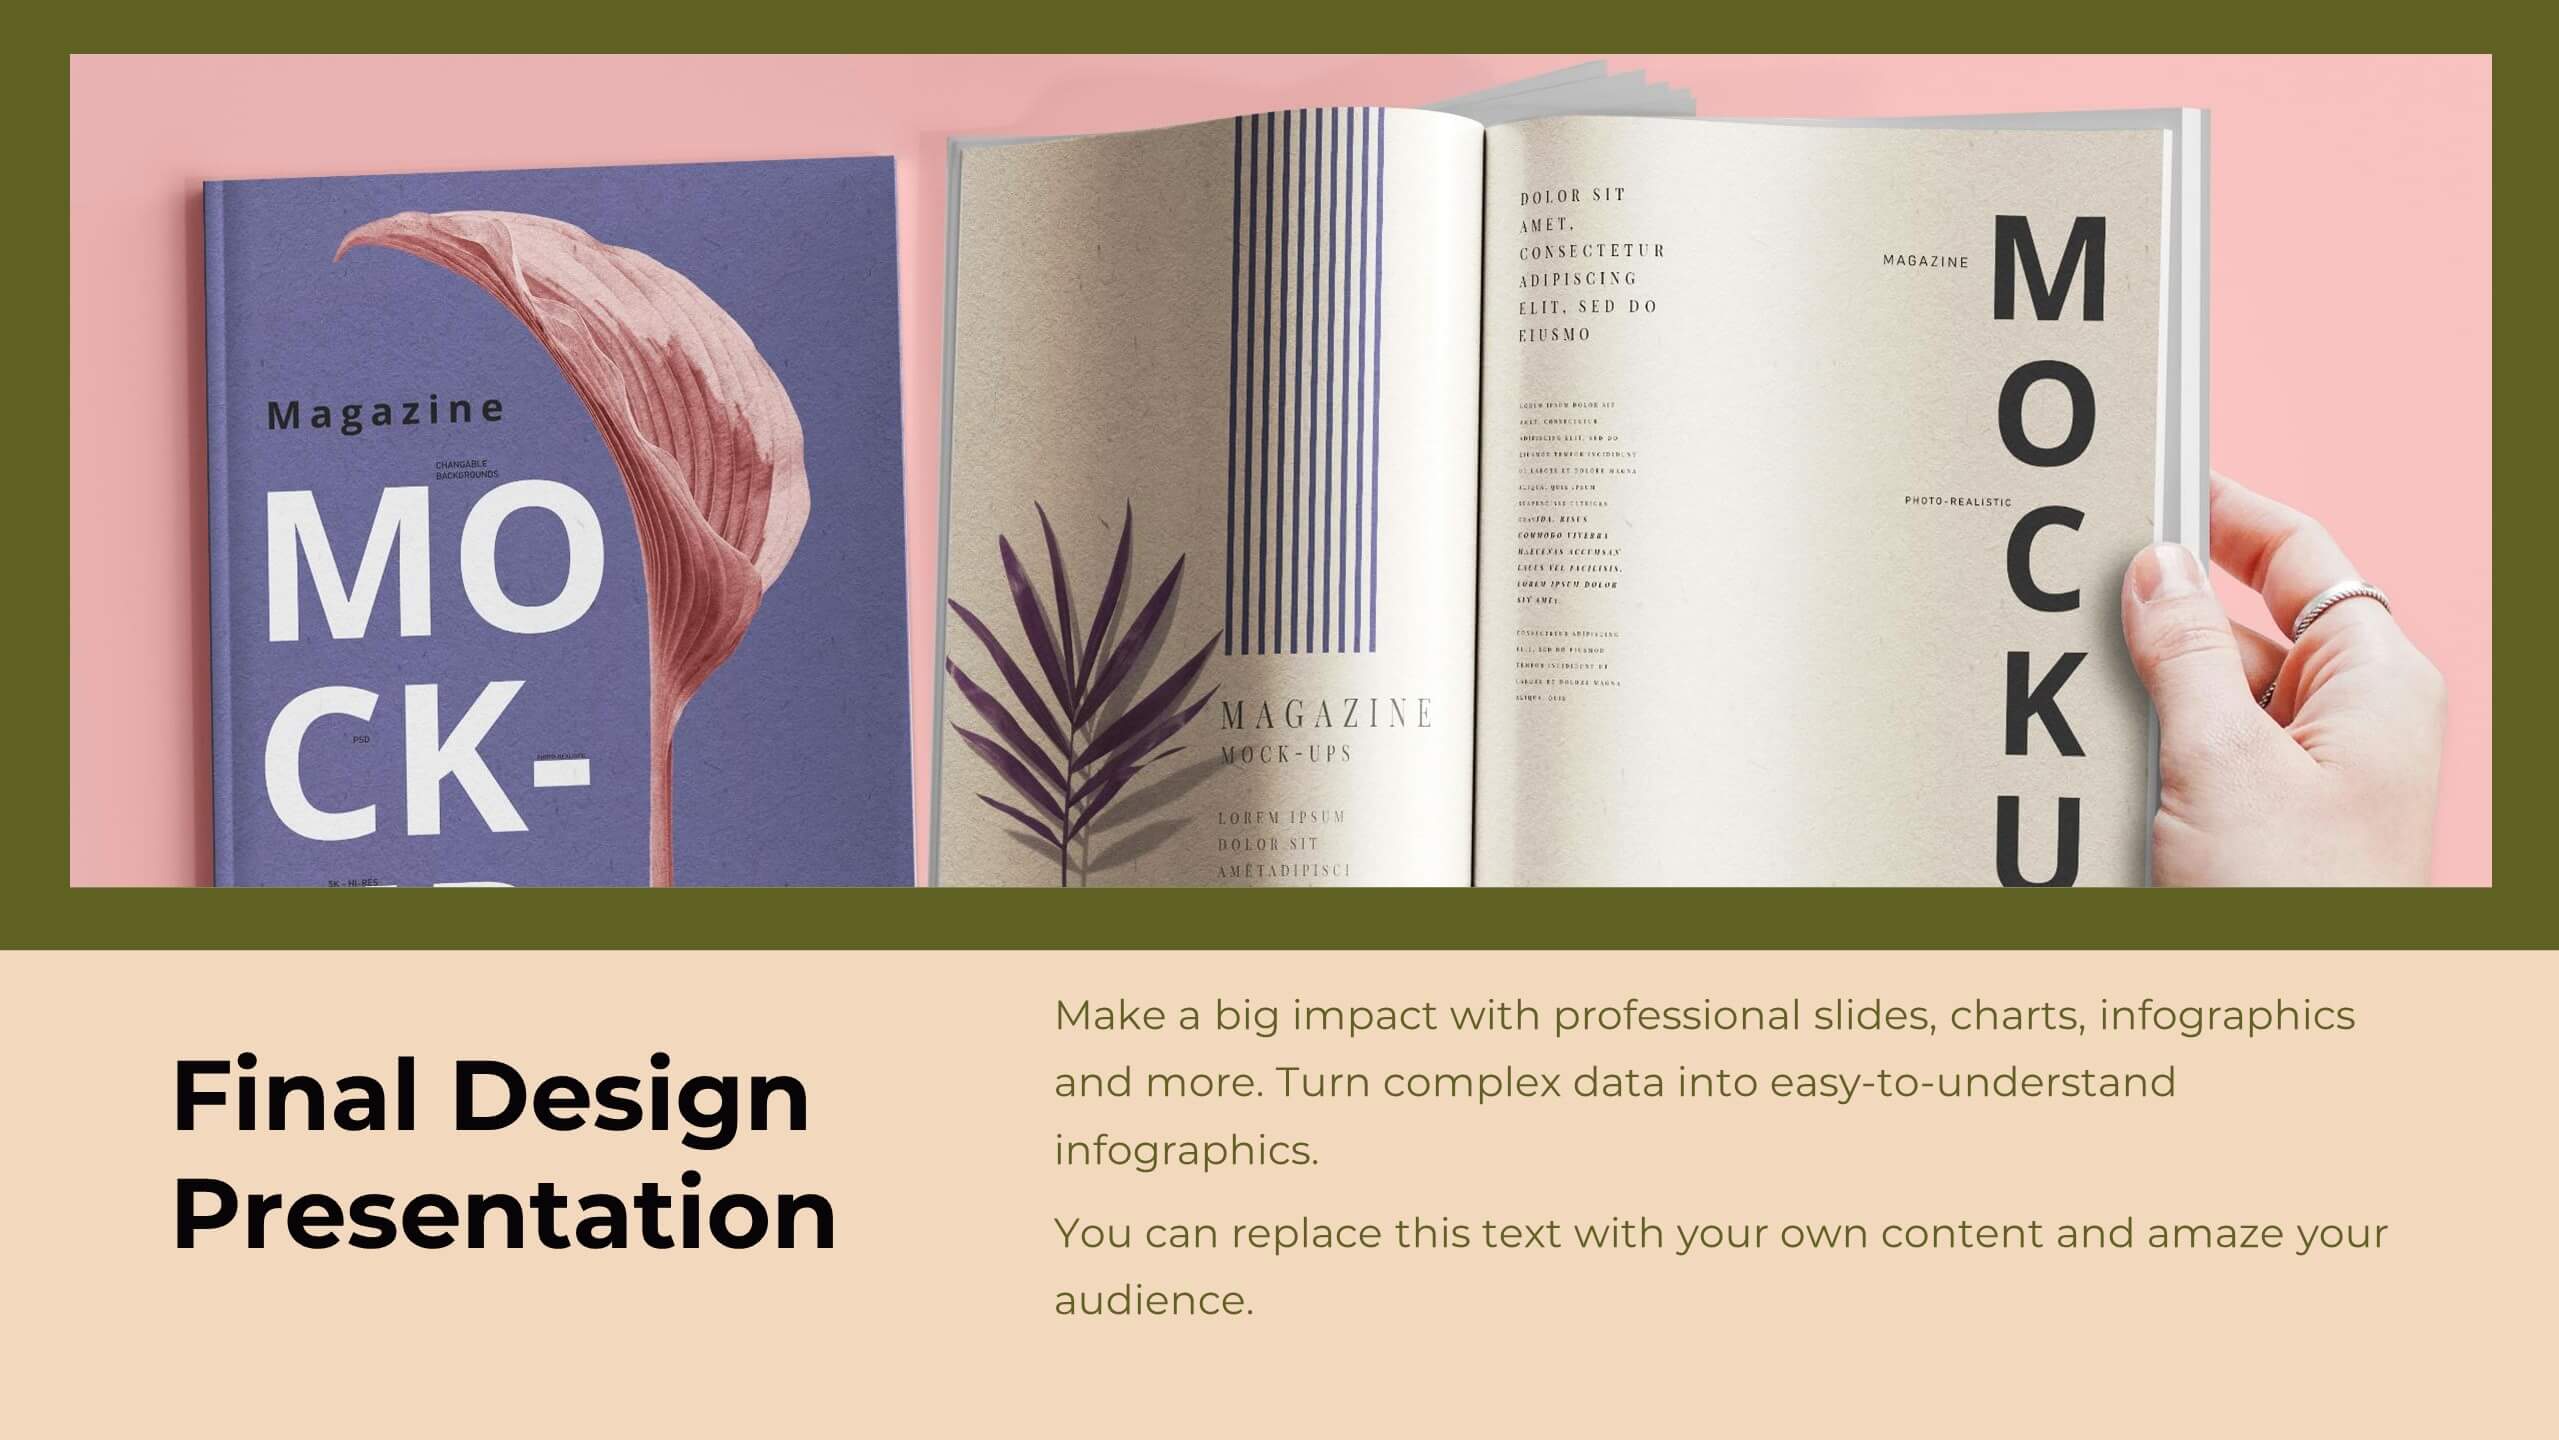
Illuminate the path to creativity with our Product Innovation infographic, specifically designed for Powerpoint, Keynote, and Google Slides. This engaging infographic is an excellent resource for professionals seeking to present the innovation process in an accessible format. The eye-catching design breaks down complex ideas into digestible segments, perfect for sparking discussions on product development and creative brainstorming sessions. Our Product Innovation infographic is a versatile tool, offering a visual representation of the stages of innovation. It's ideal for educators, business leaders, and entrepreneurs who aim to inspire and educate their audience on the intricacies of innovative thinking. Each element of the infographic is crafted to encourage audience engagement, making it easier to convey the nuances of product innovation strategies. Compatibility with major presentation platforms ensures that this infographic can be seamlessly integrated into your slide deck. Use it to enhance your message and captivate your audience with a clear visual journey through the innovation process. Add this infographic to your presentation toolkit to bring your vision of innovation to life.


7 slides
Credit Card Services Infographic Presentation
Credit Cards help build your credit, they can be extremely convenient, and they can even earn awesome rewards. This Template can be used to highlight the various benefits of owning a credit card to the public. You can also use this to represent the different types of cards, product descriptions, and facts about credit cards. You can present your information through customizable icons, charts and graphs. This template is designed to illustrate Information about credit cards in an attractive way. Use this to develop creative presentations that will be interesting and promising for your audience.


6 slides
KPI Metric Infographic
KPI stands for Key Performance Indicator, and it is a measurable value that helps organizations track their progress and performance towards achieving specific business goals and objectives. This infographic template is designed to display key performance indicators and metrics in a concise and easy-to-understand manner. KPIs are quantifiable measurements used to evaluate the success of an organization, project, or specific business activities. The infographic provides a visual representation of these KPIs, making it easier for stakeholders and decision-makers to interpret the data and track progress.


20 slides
Nexisphere Marketing Proposal Presentation
Showcase your marketing plan with this proposal deck, featuring sections on consumer analysis, digital trends, influencer strategies, and SEO insights. Ideal for presenting a comprehensive marketing approach, it’s compatible with PowerPoint, Keynote, and Google Slides, offering flexibility for engaging presentations tailored to any audience.


6 slides
Pillar Ideas Infographic
"Pillar ideas" usually refer to the fundamental principles, concepts, or key components that form the foundation of a particular topic, strategy, or framework. This infographic template outlines and explains the core pillars or key principles of a particular topic, concept, or strategy. These pillars are essential for understanding and implementing the core aspects of that subject. The pillars included in the infographic provide structure and a clear understanding of the foundational elements that contribute to the success and effectiveness of various endeavors. This template is compatible with Powerpoint, Keynote, and Google Slides.


6 slides
Scrum and Kanban Agile Delivery Presentation
Streamline your Agile processes with this modern Scrum and Kanban workflow slide. Highlight six key stages in your delivery cycle using a sleek, color-coded format with icons. Ideal for project managers, developers, and Agile teams. Fully editable in PowerPoint, Keynote, and Google Slides. Clean, professional layout for maximum clarity.


6 slides
Business Strategy Wheel Presentation
Bring your ideas full circle with this dynamic and colorful presentation design. Perfect for illustrating key strategies, continuous improvement cycles, or interconnected business concepts, it transforms complex processes into simple, engaging visuals. Fully customizable and compatible with PowerPoint, Keynote, and Google Slides for effortless editing and professional presentation.


5 slides
Suicide Prevention & Awareness Infographics
Suicide Awareness plays a vital role in addressing the global public health issue of suicide. These vertical infographics are powerful and informative designs that aim to raise awareness about suicide prevention, promote mental health, and provide essential information to help individuals recognize the signs and support those in need. With its thoughtful and sensitive design, the template communicates important statistics, facts, and resources. The template is fully customizable, allowing you to personalize the infographics with your own content, including local helpline numbers, support services, or specific awareness campaigns.


4 slides
Governance Practices for Risk Mitigation Presentation
Break down your risk strategy with the Governance Practices for Risk Mitigation Presentation. This slide features a step-stair 3D block visual, ideal for illustrating layered compliance initiatives, control measures, and escalation paths. Perfect for corporate governance teams, compliance officers, and strategic risk planners. Fully editable in PowerPoint, Keynote, and Google Slides.


27 slides
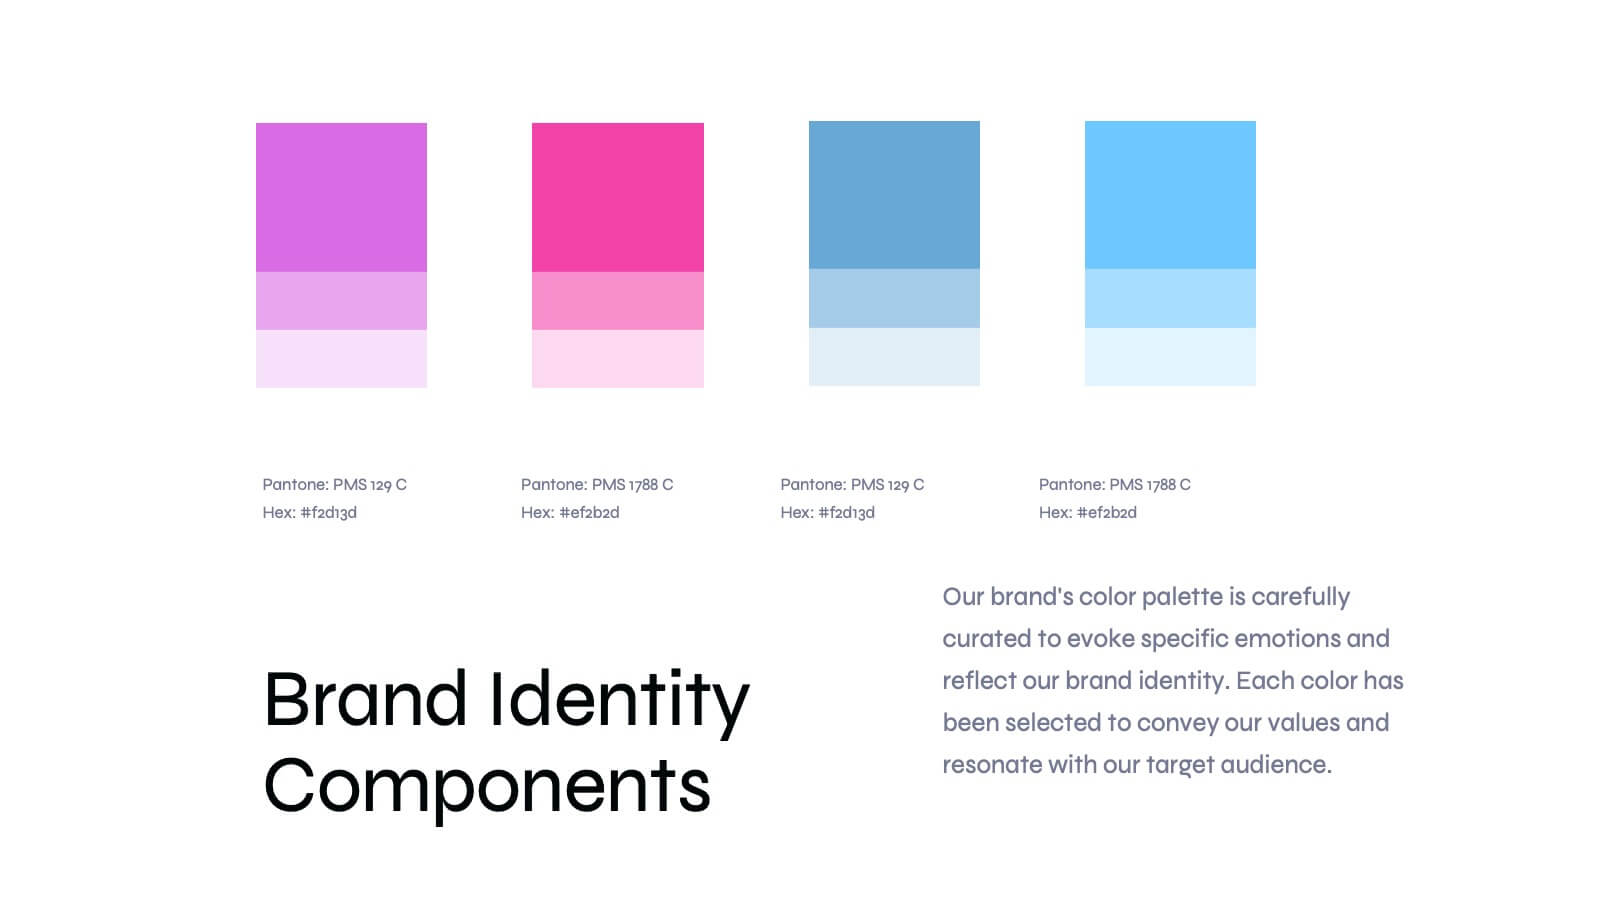
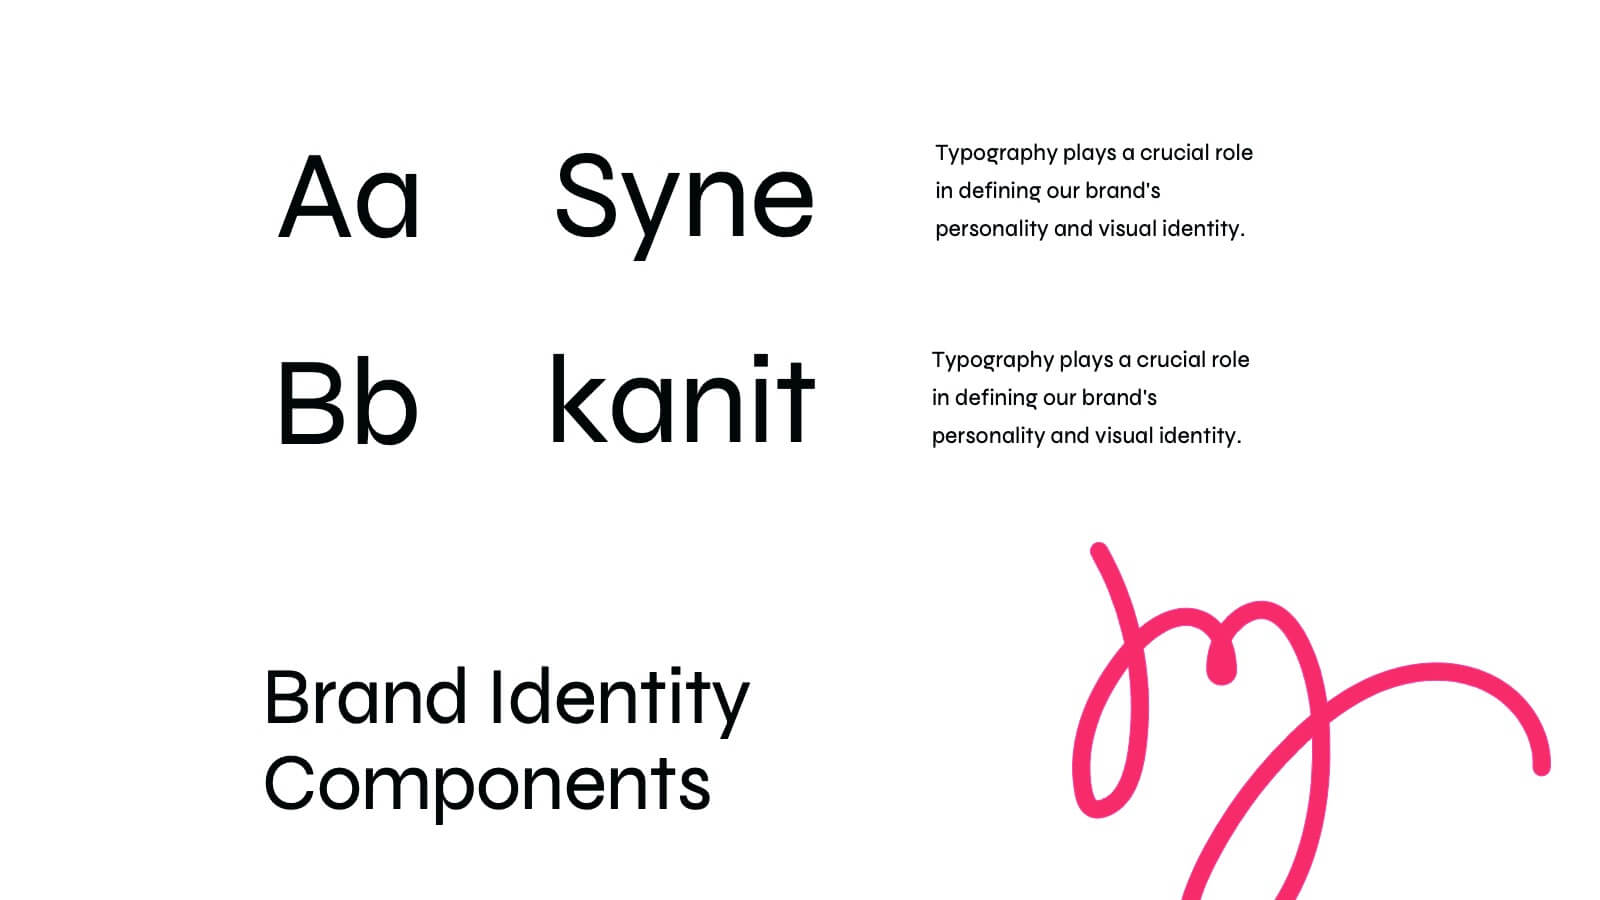
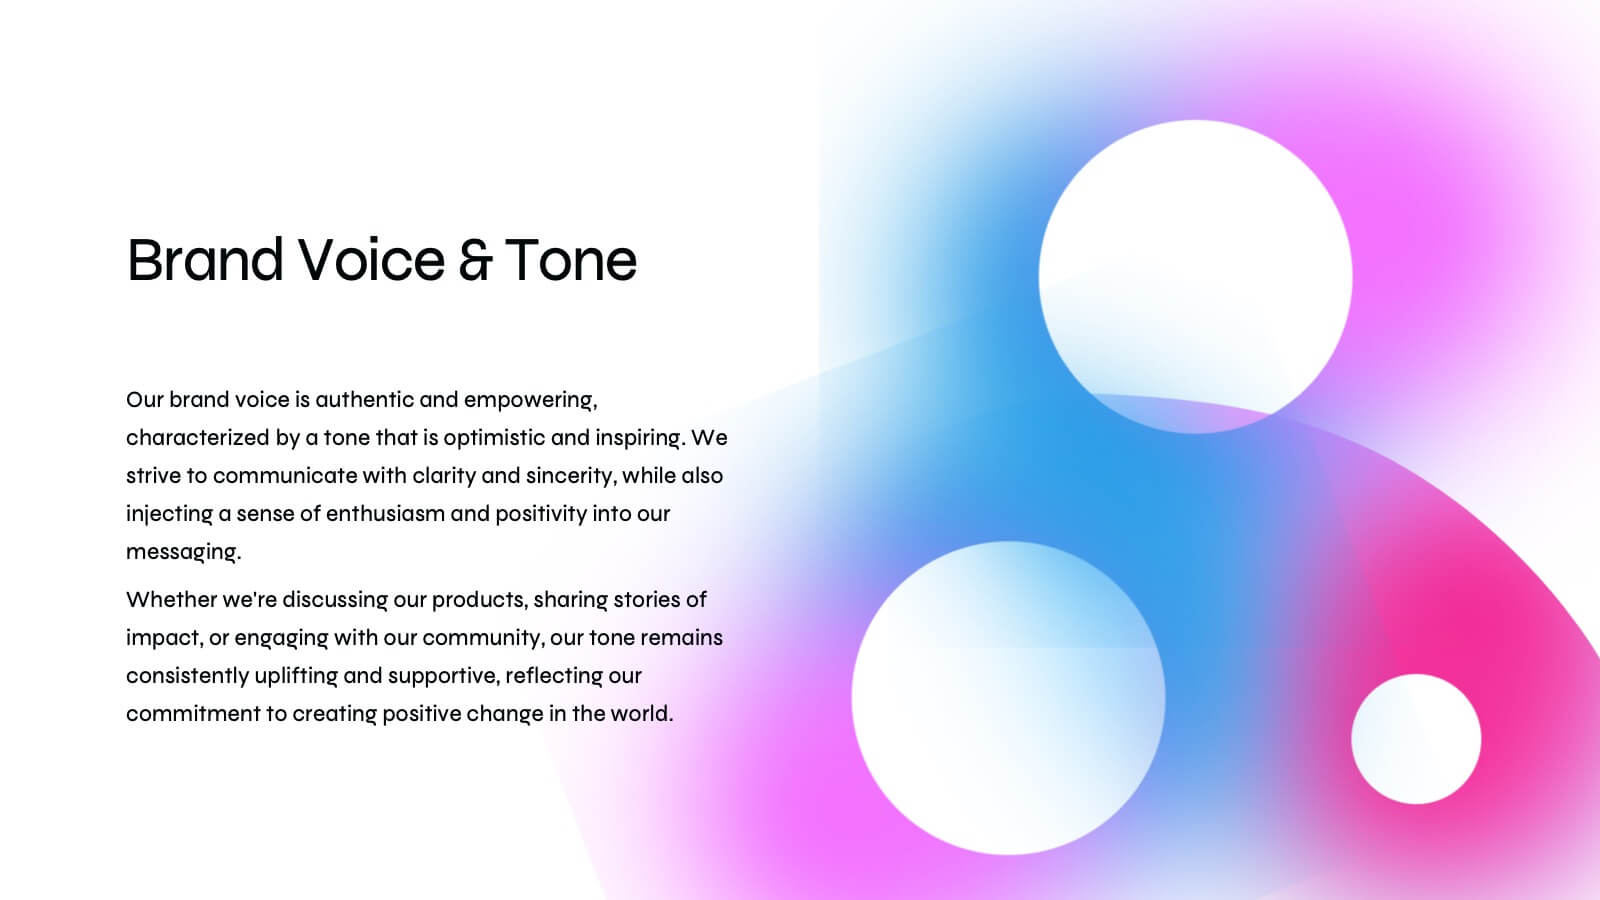
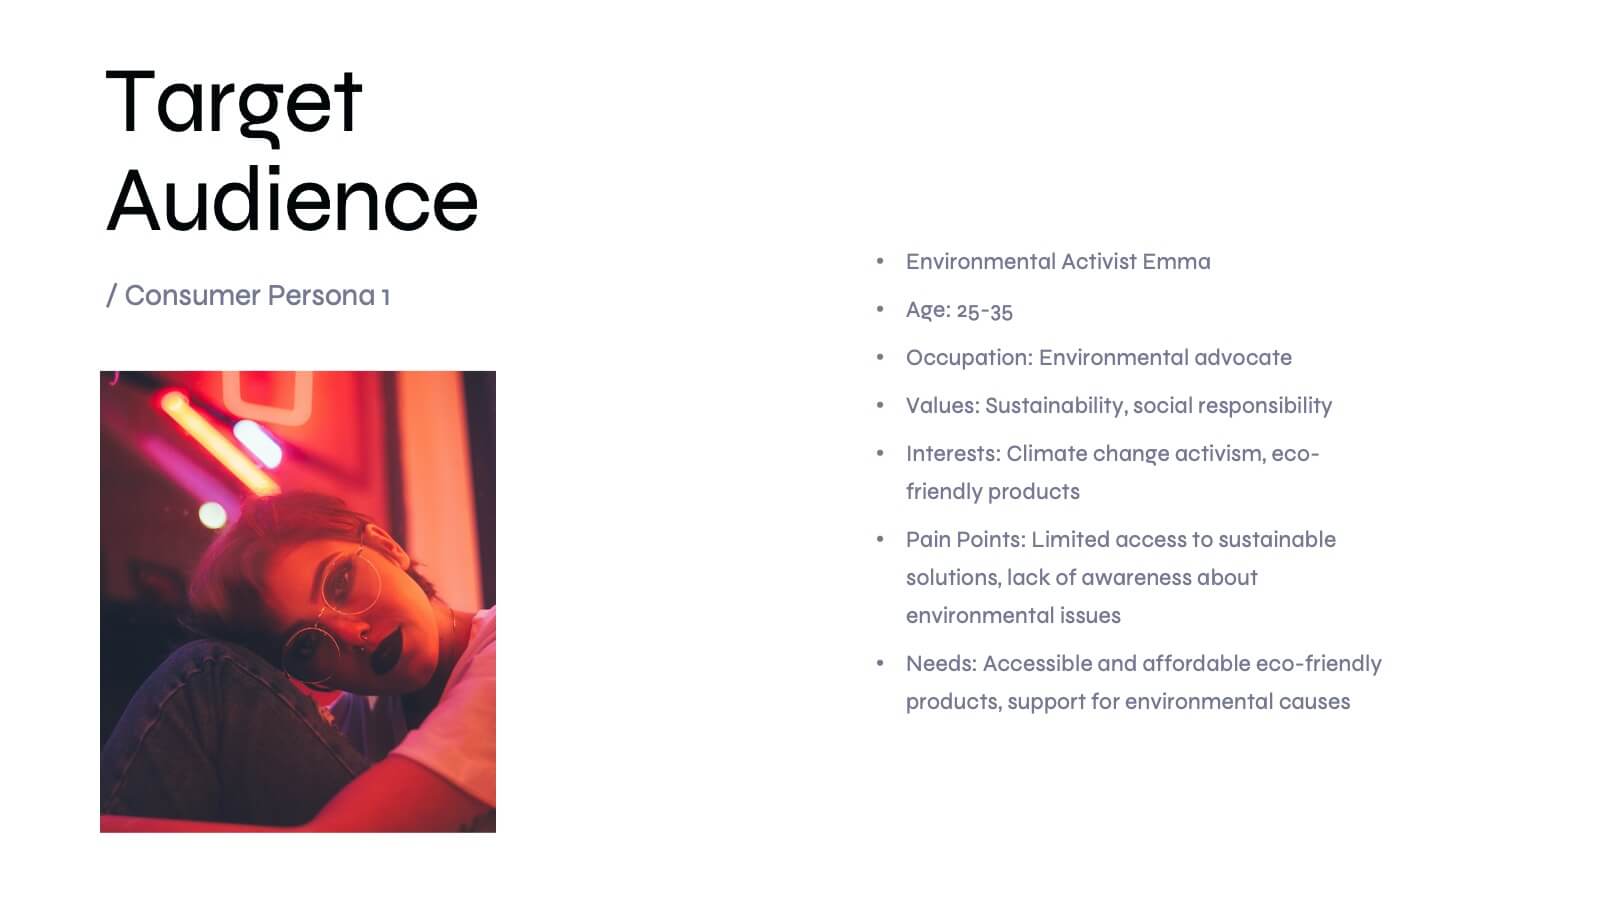
Basilisk Brand Guidelines Proposal Presentation
Present your brand strategy effectively with this modern brand guidelines proposal template! It includes sections for brand vision, values, identity, and market analysis. Fully customizable and compatible with PowerPoint, Keynote, and Google Slides, it’s perfect for showcasing your brand's identity and ensuring consistency across all platforms.


7 slides
Construction Jobs Infographic
Construction jobs refer to various roles and professions within the construction industry involved in planning, designing, building, and maintaining structures such as buildings, roads, bridges, dams, and other infrastructures. This infographic template sheds light on various career opportunities within the construction industry, offering a roadmap for aspiring professionals. Compatible with Powerpoint, Keynote, and Google Slides. With this infographic you're not just exploring careers; you're navigating a landscape of opportunities, ready to build a successful career in the dynamic world of construction.


21 slides
Delta Design Strategy Proposal Presentation
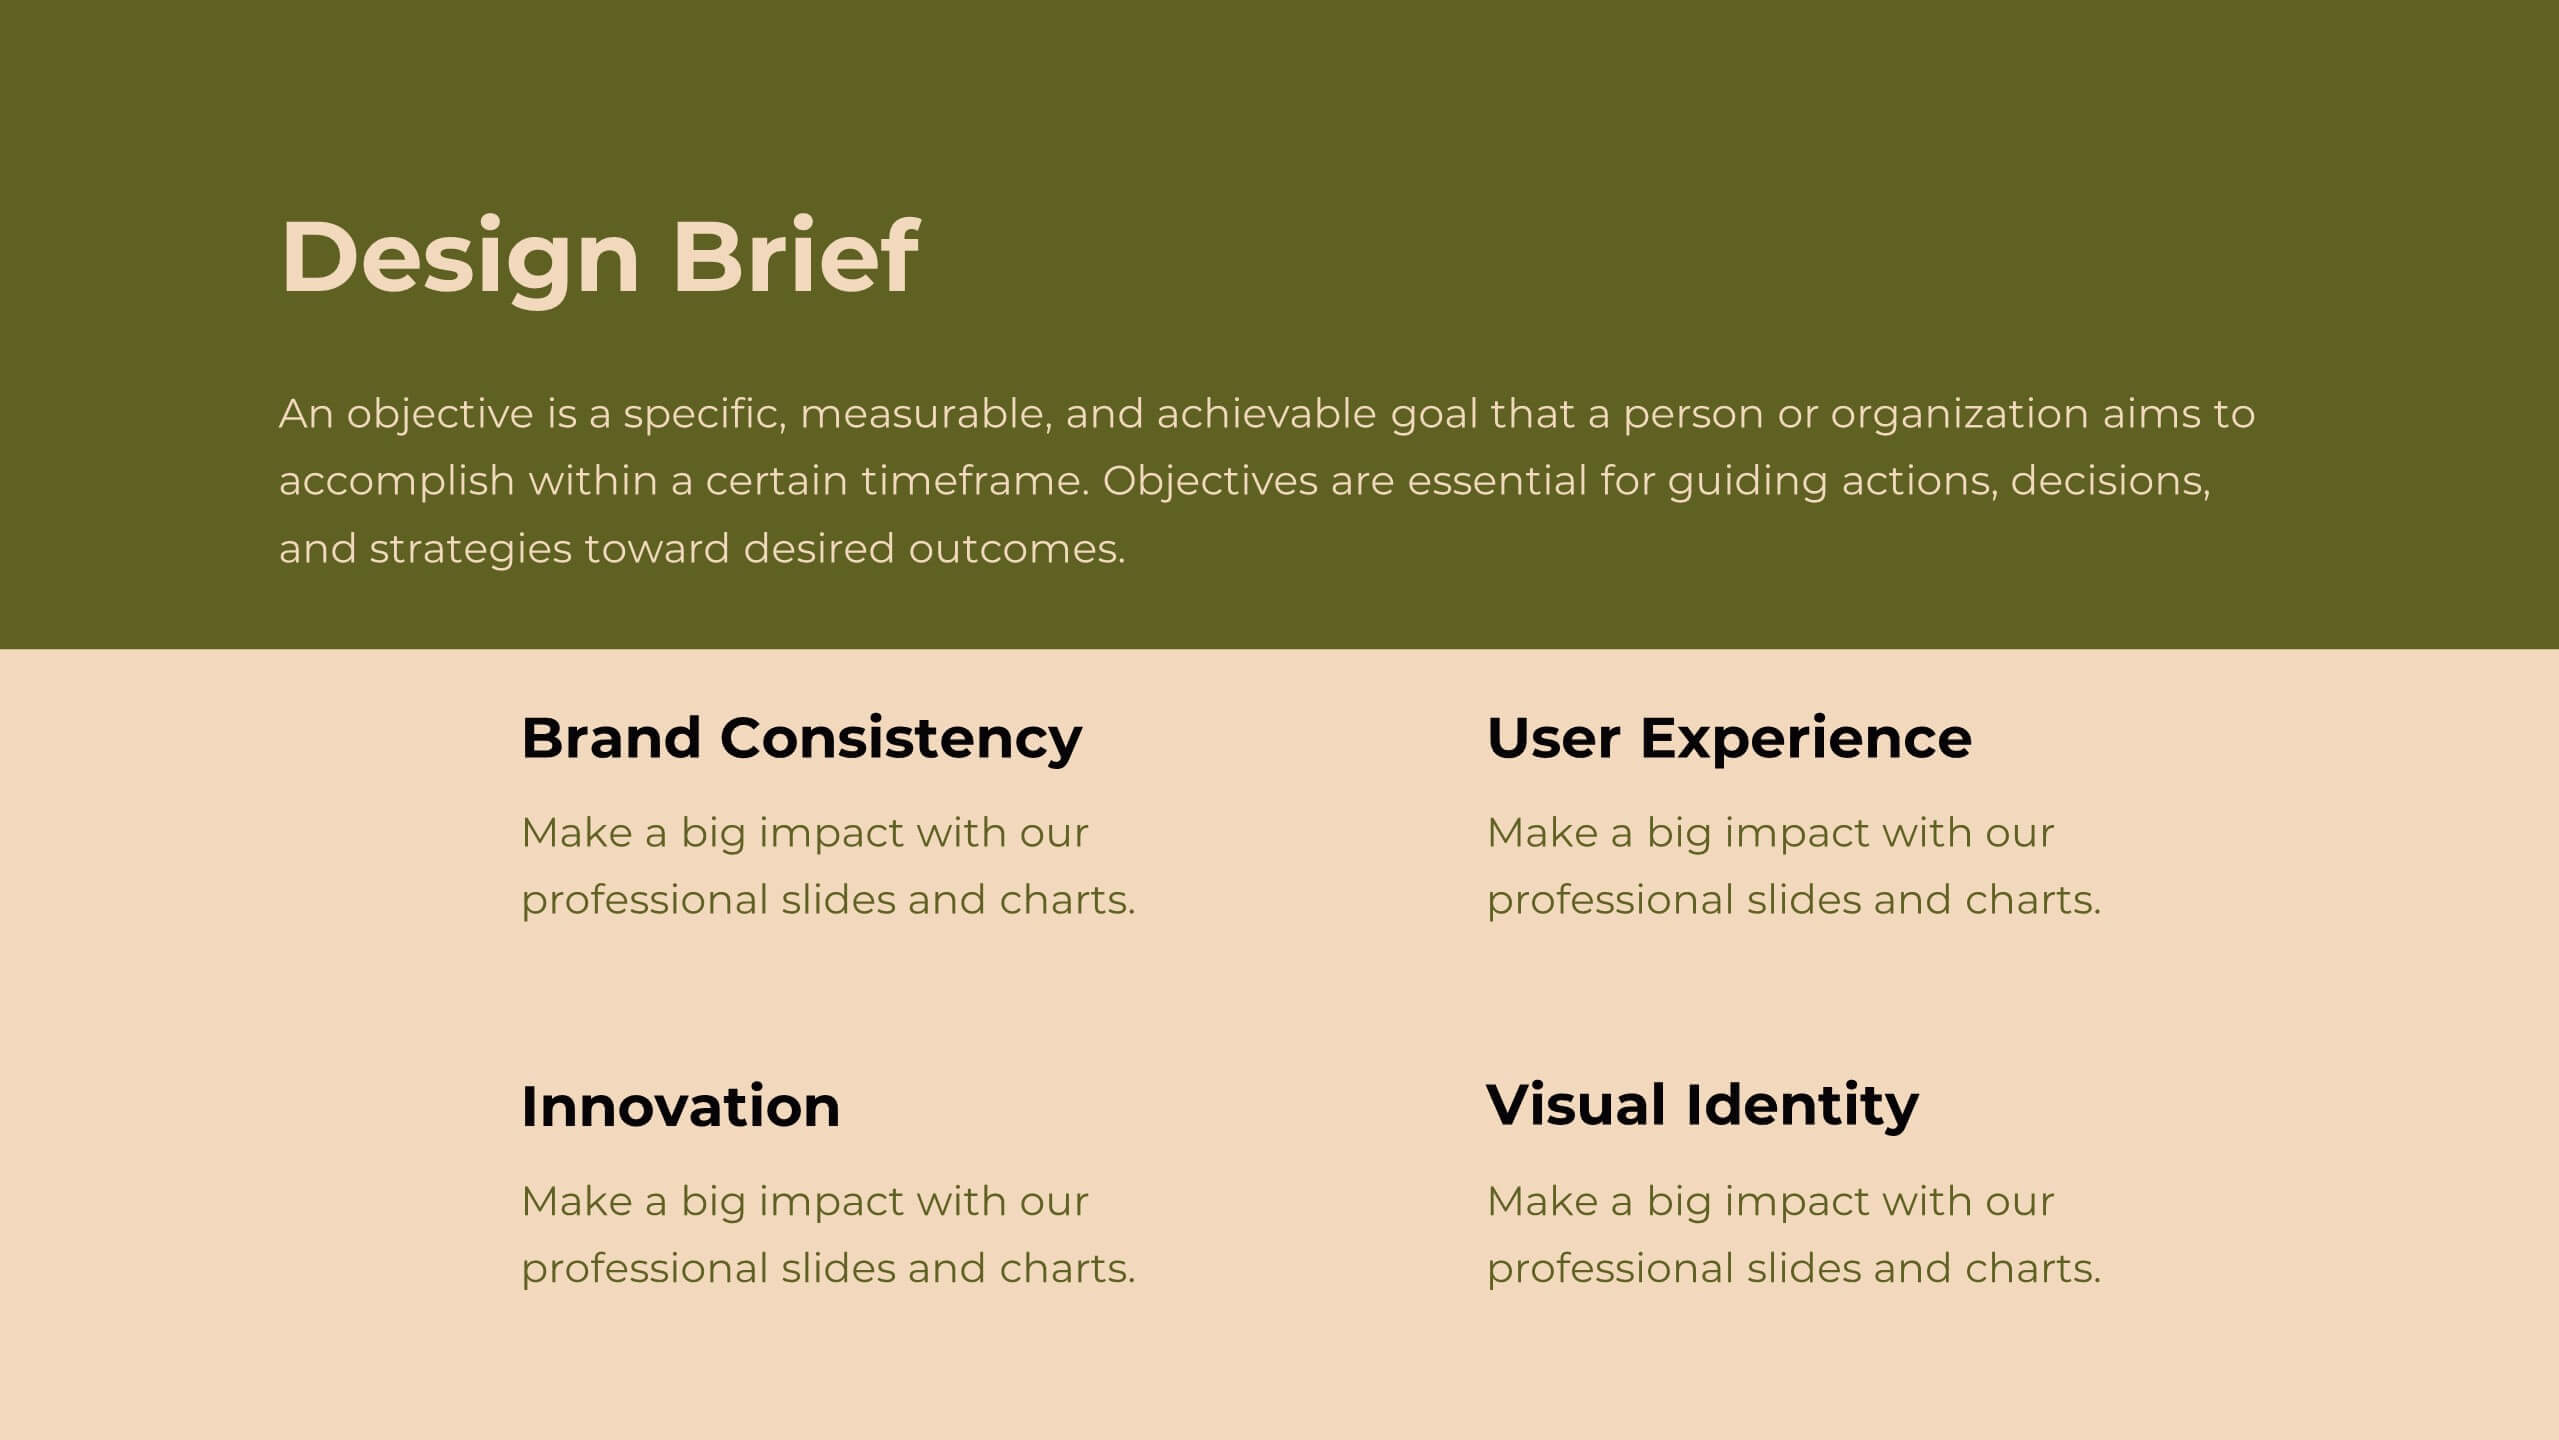
Transform your design strategy with this elegant proposal template! Perfect for presenting design briefs, target audience insights, and concept development. Ideal for designers and creative teams aiming to align vision and execution. Compatible with PowerPoint, Keynote, and Google Slides, this template ensures your design strategy is clear, professional, and compelling. Elevate your projects today!


4 slides
Corporate Planning and Analysis Presentation
Simplify strategic discussions with this Corporate Planning and Analysis Presentation. Featuring a circular 4-piece puzzle diagram, each section highlights a different business focus area using icons and color coding. Ideal for illustrating synergy between departments or initiatives. Fully customizable in PowerPoint, Keynote, and Google Slides.


5 slides
Project Execution Next Steps Presentation
Streamline your workflow with the Project Execution Next Steps Presentation template. Designed for project managers and teams, this visual slide helps break down execution phases into clear, actionable steps. The connected chain layout ensures smooth project tracking, making it easy to communicate progress and responsibilities. Fully customizable in PowerPoint, Keynote, and Google Slides for seamless project planning and execution.