


Features
- 3 Unique slides
- Fully editable and easy to edit in Microsoft Powerpoint, Keynote and Google Slides
- 16:9 widescreen layout
- Clean and professional designs
- Export to JPG, PDF or send by email


Do you have any questions?
Recommend


7 slides
Responsibility Assignment Matrix Diagram Presentation
A Responsibility Assignment Matrix is a tool used to define and communicate project roles and responsibilities. This template can be used as a valuable tool for any project team. By representing the various assignments and roles, the (RAM) helps to ensure that projects are completed on time, within budget, and to the expected quality standards. Use the tips provided to create a clear and effective matrix for your next project. This template includes helpful illustrations and allows you to add tips and additional details related with the roles and responsibilities in context with the task.


6 slides
Customer Empathy Mapping Presentation
Step into your audience’s world with a visual layout that brings their thoughts, feelings, and motivations into focus. This presentation helps teams understand customer needs more clearly, creating stronger products and experiences through structured empathy insights. Fully compatible with PowerPoint, Keynote, and Google Slides.


8 slides
Structured Table of Content for Reports Presentation
Create clarity and flow in your professional reports with this Structured Table of Content for Reports slide. Featuring a sleek column design with three main sections, each block offers space for a title, description, and a matching icon. Ideal for business reviews, strategy documents, and formal proposals. This layout ensures your audience knows exactly what to expect. Fully customizable in PowerPoint, Keynote, and Google Slides.


6 slides
Conversion Funnel Infographic Presentation
Optimize your marketing strategy with this Conversion Funnel Infographic template. Clearly illustrate lead generation, customer retention, and sales processes in a structured format. Fully editable to match your branding—customize colors, icons, and text effortlessly. Compatible with PowerPoint, Keynote, and Google Slides for a smooth presentation experience.


20 slides
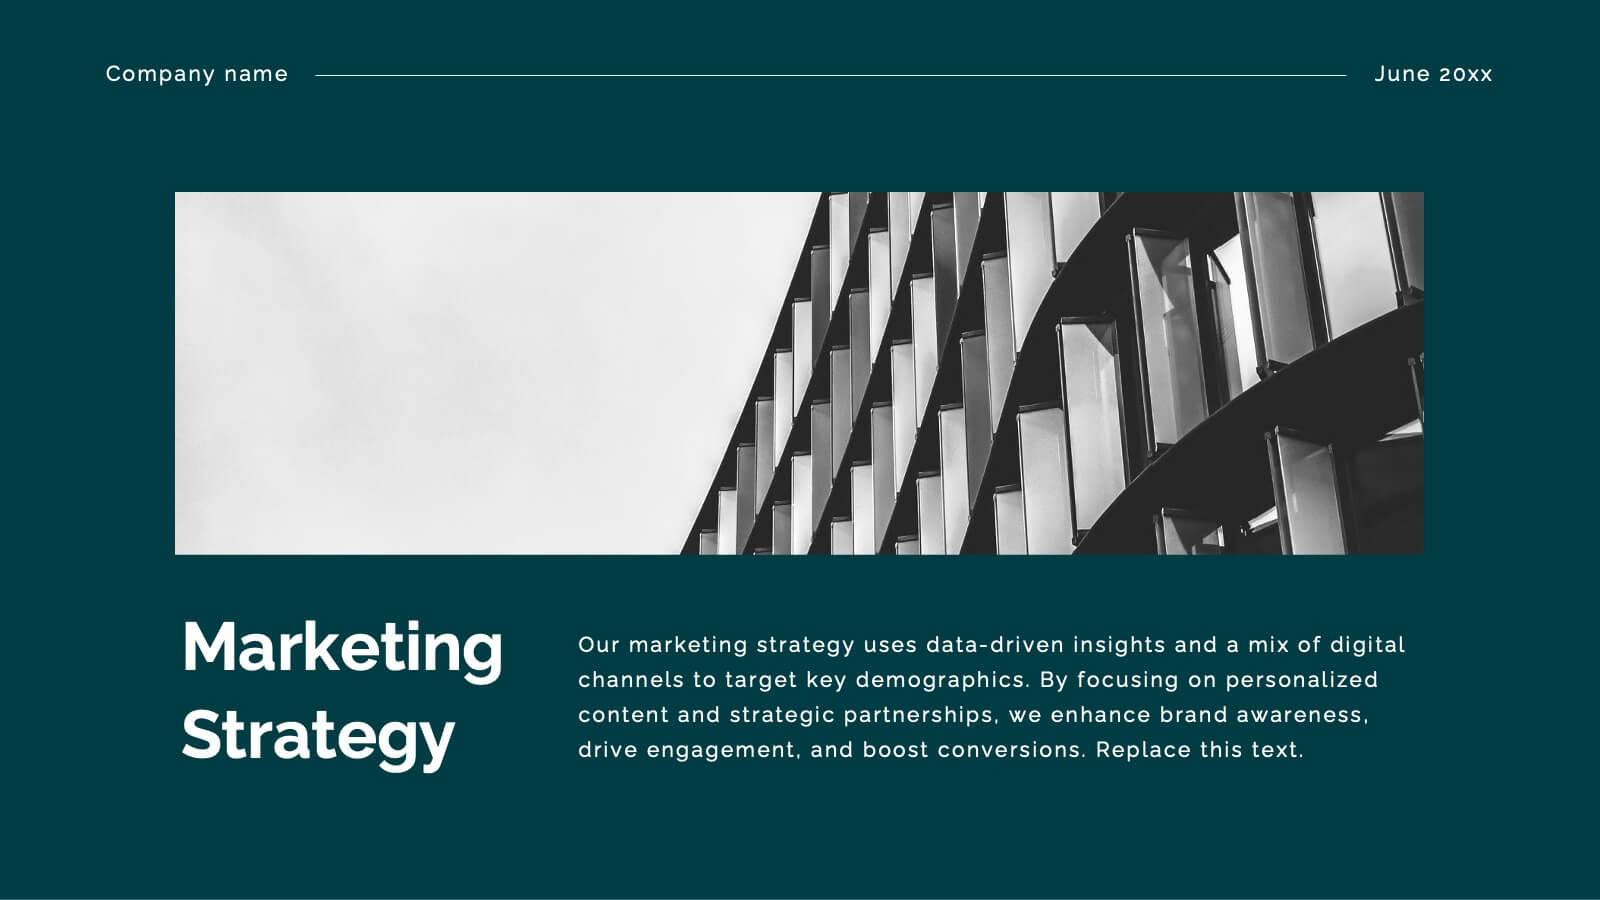
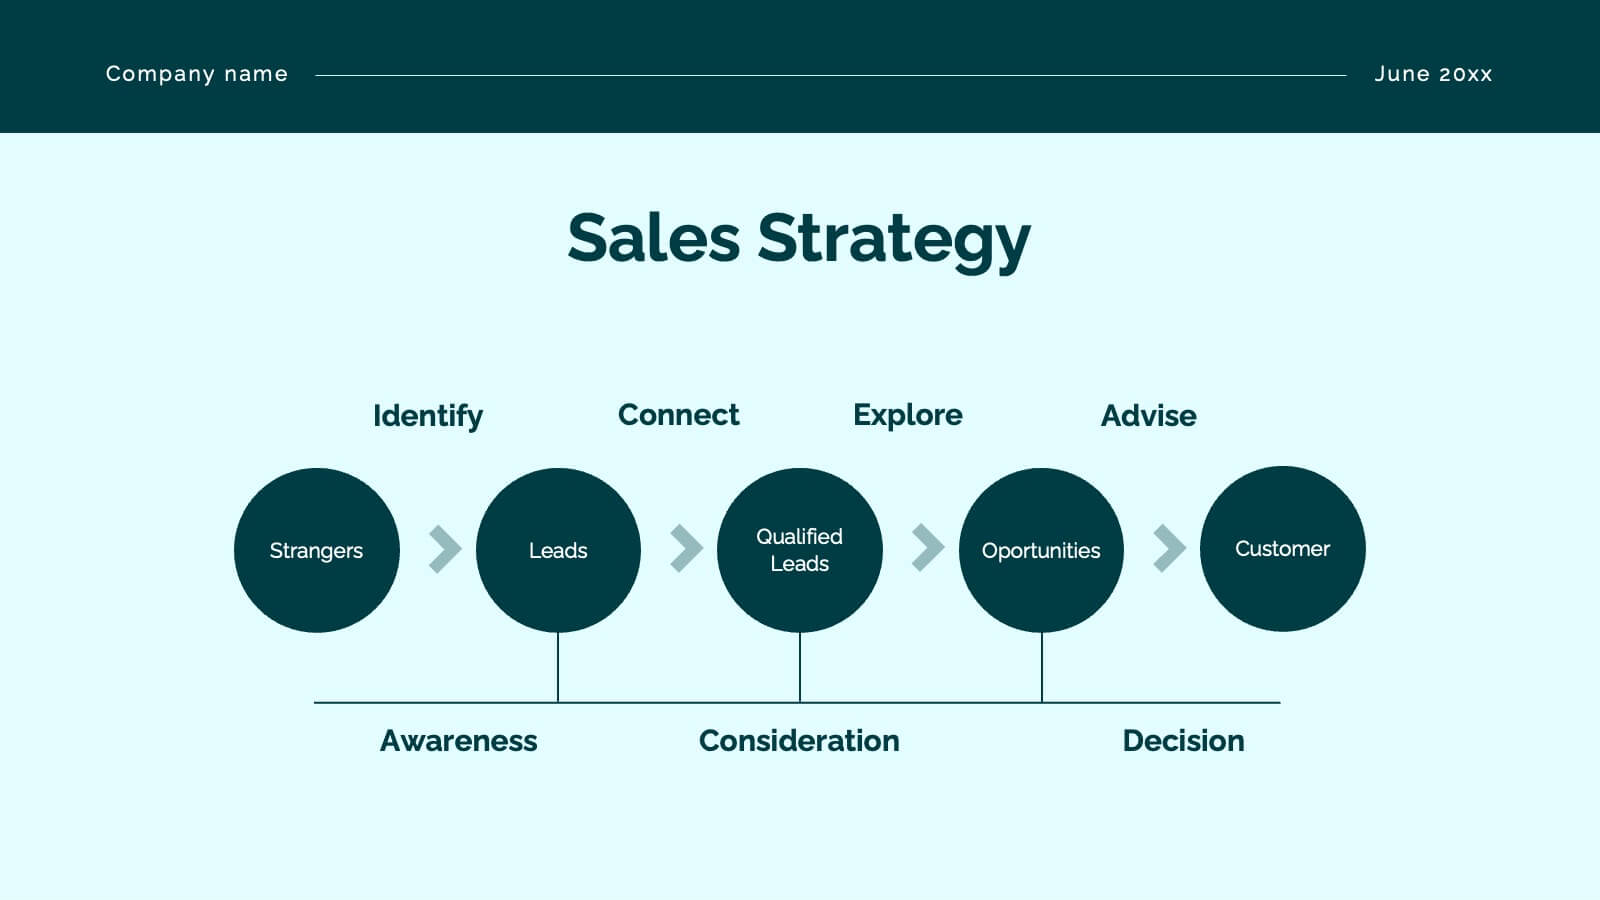
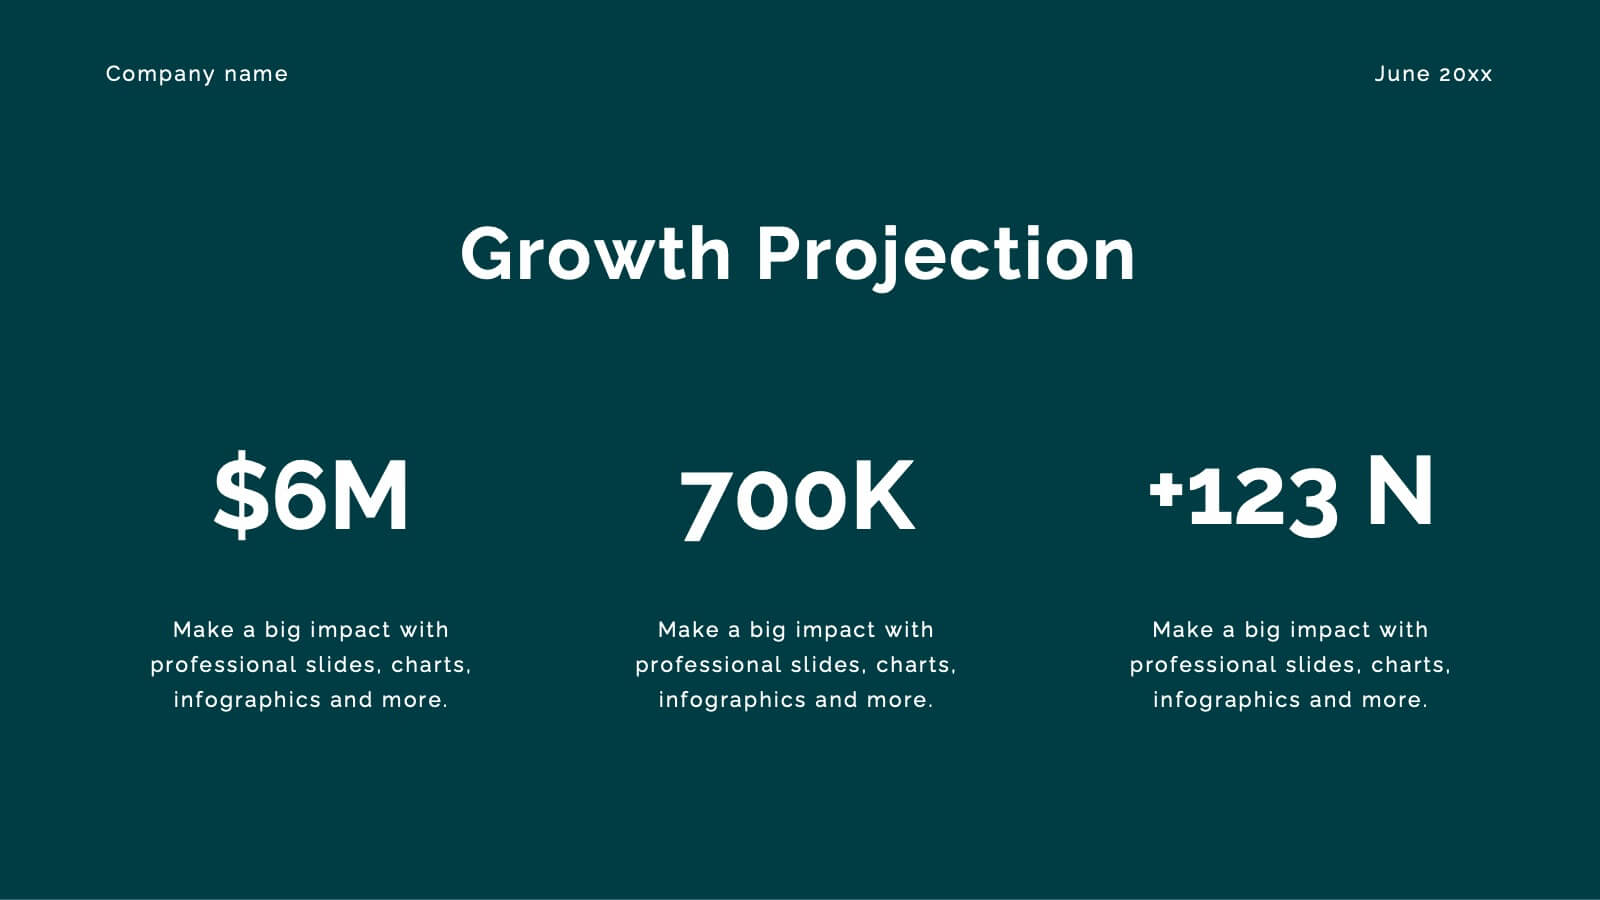
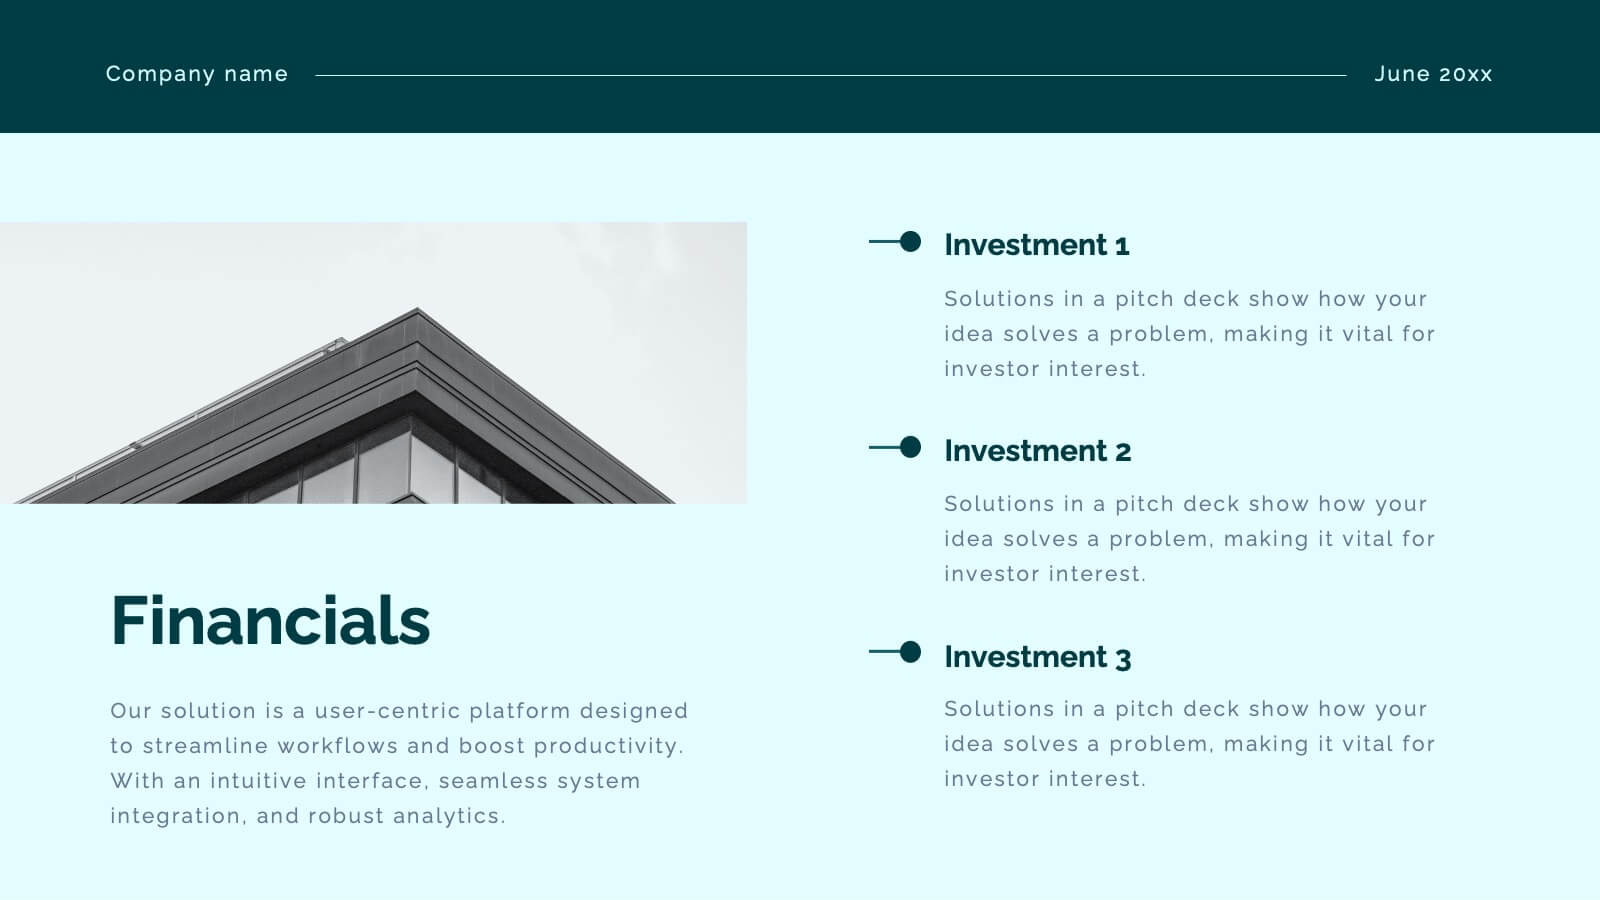
Aurorium Sales Proposal Presentation
Win over clients with confidence using this sleek and modern sales proposal presentation. Designed to highlight key business strategies, pricing plans, competitive analysis, and future opportunities, this template helps you communicate your value with clarity and impact. Fully customizable and compatible with PowerPoint, Keynote, and Google Slides for seamless presentations.


5 slides
Cyber Security Management Infographics
Cyber Security Management is important because it helps to protect organizations from cyber threats and attacks. These Infographics are visual representations of information related to the management of cyber security. This template can be used to provide summaries on the various aspects of cyber security management such as risk assessment, security policies, threat detection and response, and data protection. These infographics are designed to help individuals and organizations understand the importance of cyber security management and the steps that need to be taken to ensure the security of their systems and data.

23 slides
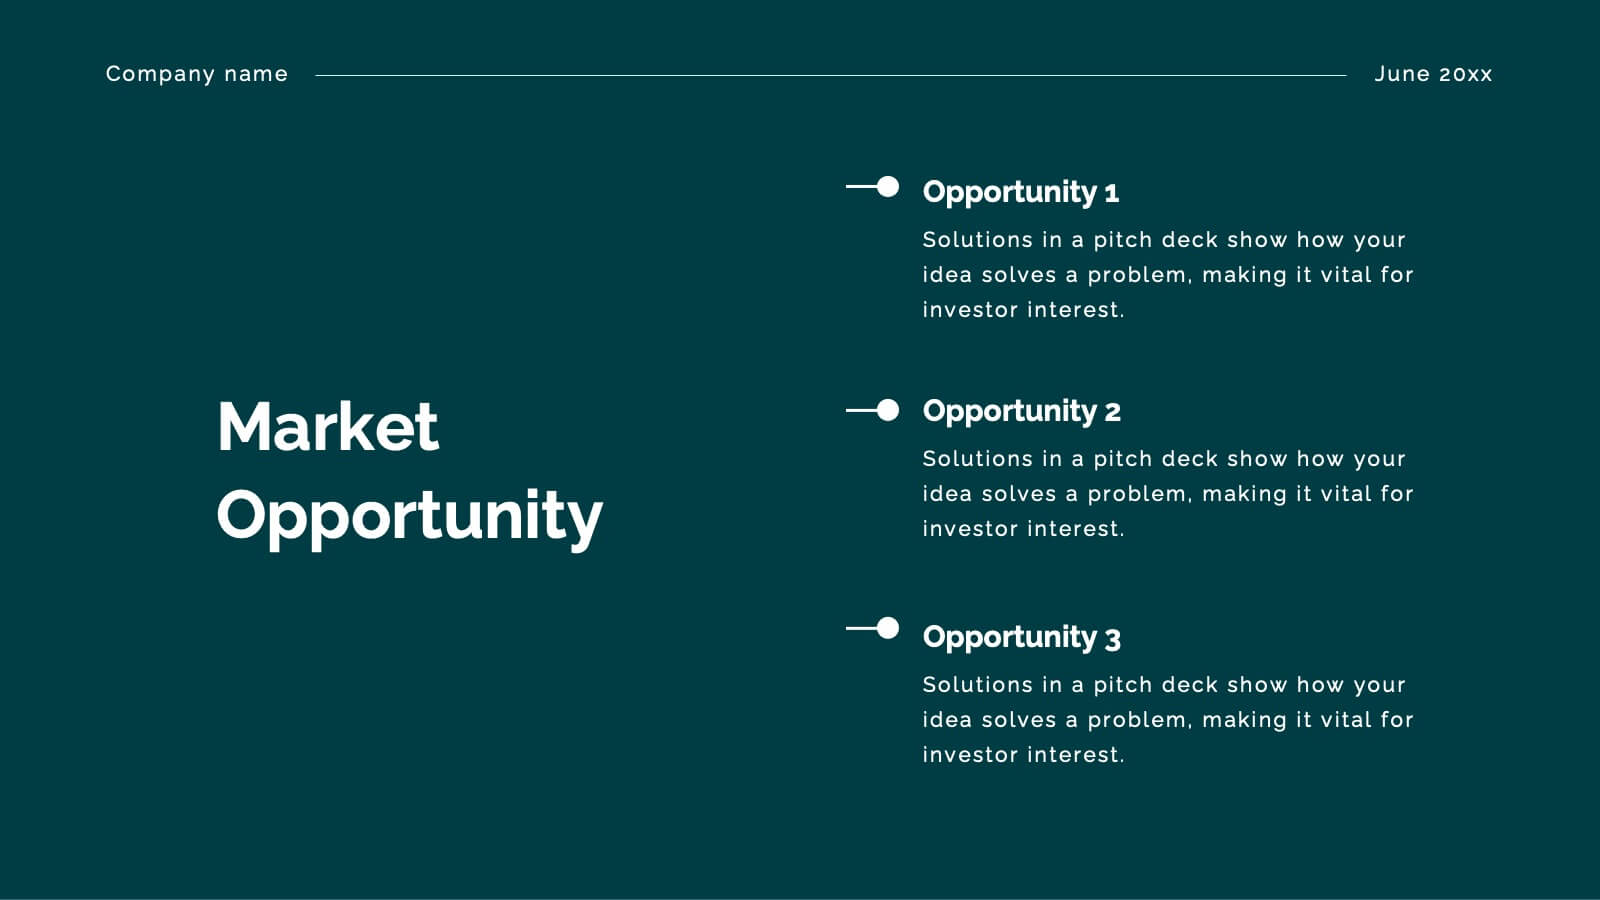
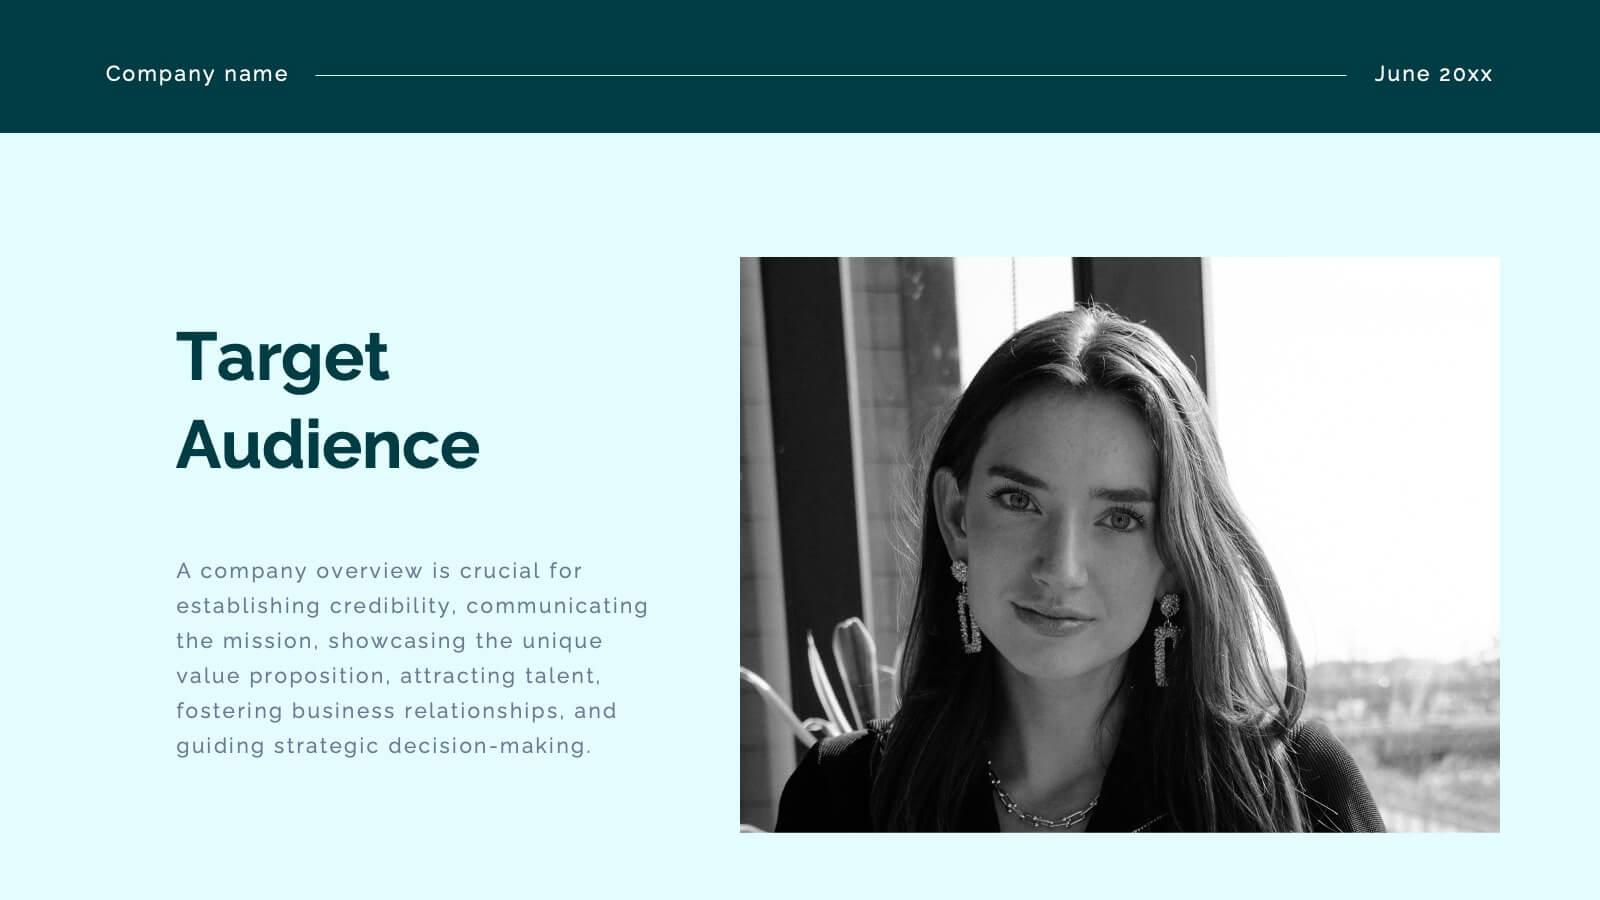
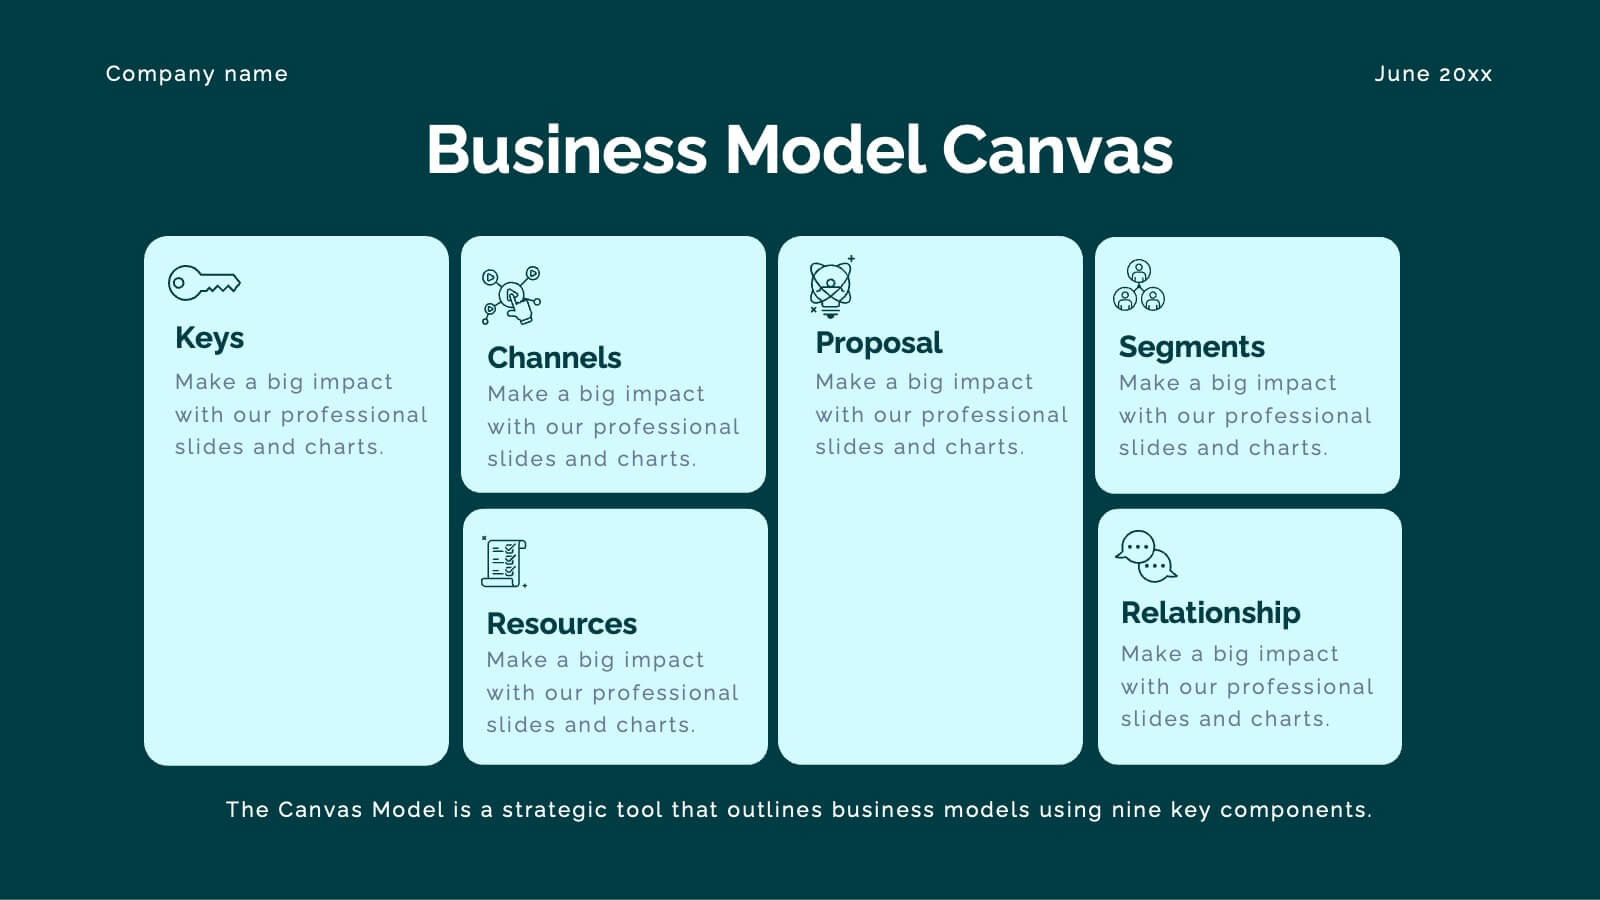
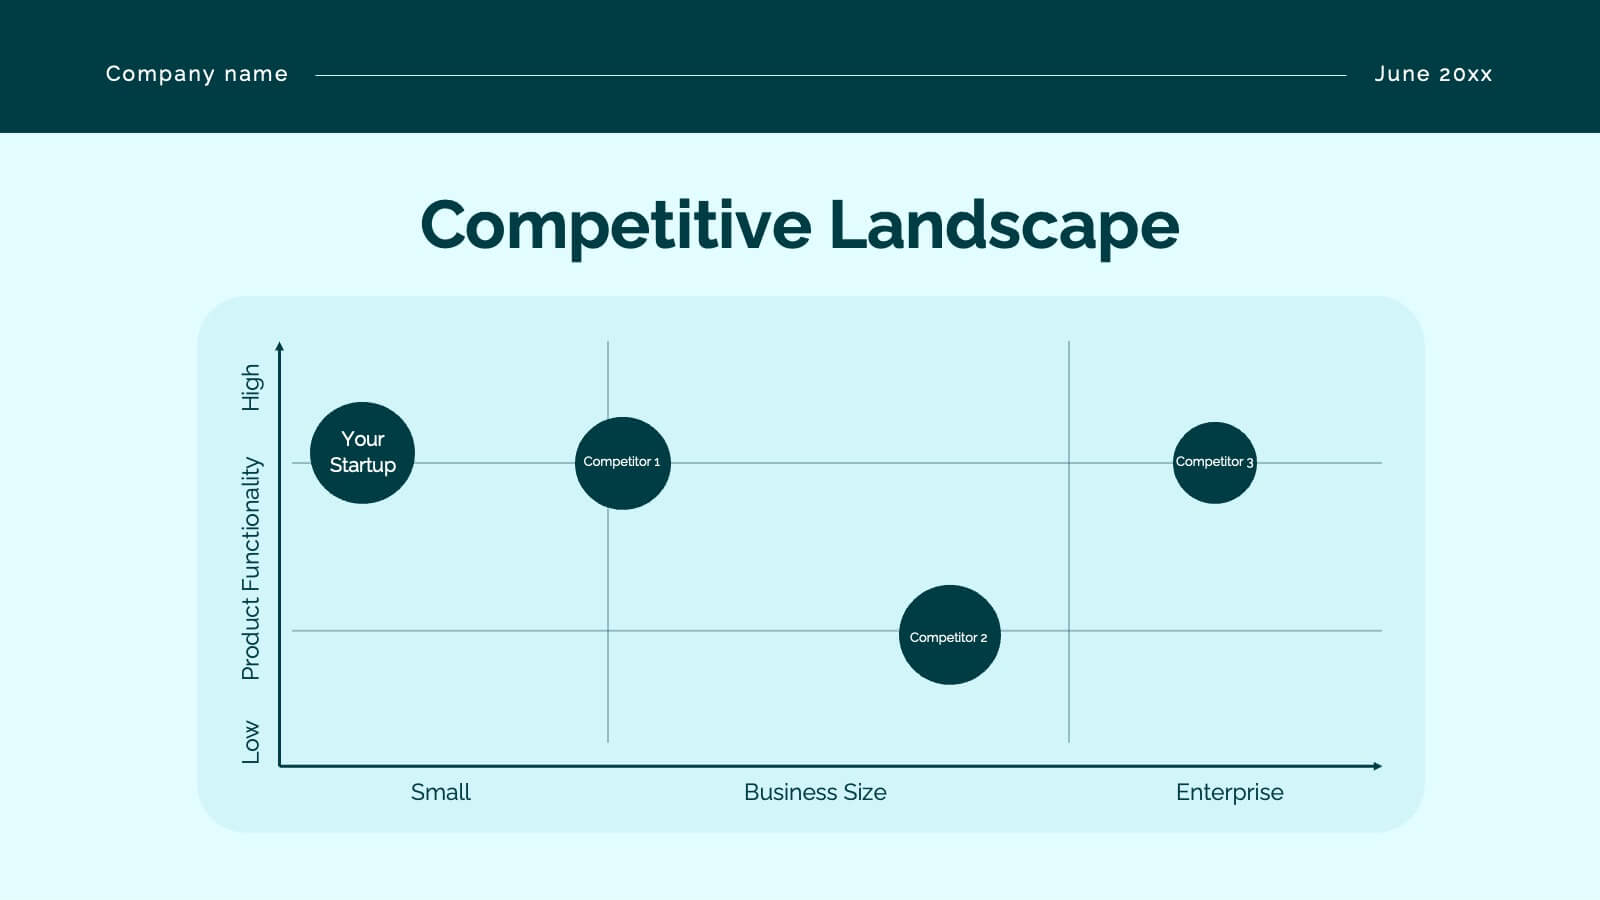
Crest Investor Pitch Presentation Presentation
Unleash your potential with this powerful pitch deck template! Tailored for presenting innovative business ideas, it features slides for company overview, market opportunity, competitive landscape, and financial projections. Clearly communicate your value proposition and impress investors with professional design and concise content. Compatible with PowerPoint, Keynote, and Google Slides for seamless presentations on any platform.

22 slides
Nova Startup Funding Proposal Presentation
Craft an impressive startup funding proposal with this elegant template. It includes sections for mission, vision, market analysis, business model, and financial overview. Ideal for clear and professional presentations. Fully compatible with PowerPoint, Keynote, and Google Slides for easy customization.


5 slides
Organic Search Growth Plan Presentation
Grow your visibility the natural way with this sleek and easy-to-follow organic strategy slide. Perfect for outlining SEO goals, keyword clusters, and growth tactics, this visual layout makes your presentation clean and compelling. Fully compatible with PowerPoint, Keynote, and Google Slides for flexible editing across platforms.


10 slides
Body System Educational Overview Presentation
Dive into anatomy with a slide that makes learning the human body visual, clear, and interactive. This educational overview breaks down key body systems into simple, labeled sections—perfect for classroom teaching, medical training, or health awareness campaigns. Fully editable and compatible with PowerPoint, Keynote, and Google Slides for seamless customization.


6 slides
Strategic Planning with PESTEL Presentation
Dive into comprehensive environmental scanning with our "Strategic Planning with PESTEL" presentation template. This layout meticulously breaks down Political, Economic, Social, Technological, Environmental, and Legal factors, enabling thorough market analysis and strategy formulation. Perfect for strategists and analysts, the template supports PowerPoint, Keynote, and Google Slides, facilitating a dynamic and engaging planning session.


2 slides
Meeting and Business Planning Services Illustrations
Take your planning game to the next level with our meeting and business planning services illustrations pack! This illustrations pack is perfect for companies that need a way to visualize their ideas quickly and easily. Fully compatible with Powerpoint, Keynote, and Google Slides. Boost your productivity and make your meetings more exciting—download the meeting and business planning services illustrations pack today!


6 slides
Sales Team Infographic
The series presented showcases various slide templates tailored for enhancing sales team strategies and communication. Each slide is crafted to assist sales professionals in detailing team structures, sales goals, performance metrics, and strategic initiatives effectively. Utilizing vibrant color blocks and streamlined design elements, these templates make complex sales data approachable and engaging, facilitating clear and impactful presentations. The collection is designed with adaptability in mind, incorporating elements that can be easily customized to fit different team needs and company branding. These include comparative layouts for benchmarking, timeline formats for showcasing sales cycles, and diagrammatic representations for visualizing sales processes and results. Perfect for internal meetings, sales training sessions, and stakeholder presentations, these templates serve as essential tools for sales leaders to convey their team’s progress, celebrate wins, and strategize for future sales endeavors.


7 slides
Creative Timeline Infographic Presentation Template
A Timeline is an essential tool to illustrate the chronology of events; it also provides a method for organizing and summarizing material. With the timelines provided in this template you will be able to visualize the passage of time, so that you can better understand how influences from the past still impact your life today. This template is designed to assist you with crafting your timeline so that it can be easily understood. The color-coding makes it easy to see daily progress. Use the timelines in this template to create useful visualization, and convey the growth of your business or brand.
6 slides
Arrow Segments for Goal Tracking Presentation
Clearly define objectives and measure performance with the Arrow Segments for Goal Tracking Presentation. This visually engaging dartboard-style layout is perfect for showcasing KPIs, targets, or strategic milestones. Each arrow represents a key focus area, allowing you to highlight priorities and progress. Fully customizable in PowerPoint, Google Slides, and Canva.


7 slides
Loves Travel Infographic Presentation
Travel is an opportunity to get out of our comfort zones and be inspired to try new things, it changes our perspective on the world. Use this template to give your audience an overview of a trip and prepare them for what they will be experiencing. This template features an infographic style design, with plenty of room to describe the locations and activities as well as instructions and tips. Build your own infographic with this template, and add it to your presentations. You can easily add your own content in PowerPoint, Keynote, or Google slides and turn it into a fun presentation in minutes.


8 slides
Alphabet List Infographics
Discover the power of alphabet lists, a versatile tool for structured information presentation. This infographic is your guide to understanding alphabet lists, from the basics to the benefits of alphabetical order. Master the art of creating organized and readable content. Learn why arranging information alphabetically is advantageous. Explore its logical sequence that simplifies referencing and comprehension. Unlock the potential of alphabetical order in various contexts, improving content organization for easy access and digestion. Master the use of alphabet lists to boost content readability. Discover techniques such as subheadings and concise descriptions. With this infographic, compatible with PowerPoint, Keynote, and Google Slides, sharing your knowledge of alphabet lists is effortless. Dive into the world of alphabet lists and improve your communication and content organization skills.