


Features
- 5 Unique slides
- Fully editable and easy to edit in Microsoft Powerpoint, Keynote and Google Slides
- 16:9 widescreen layout
- Clean and professional designs
- Export to JPG, PDF or send by email


Do you have any questions?
Recommend


7 slides
SCRUM Infographic Presentation Template
A SCRUM infographic is an Agile methodology for software development. The goal of this infographic template is to provide a clear and easy-to-understand overview of the key principles and practices of scrum, such as the roles, events, and artifacts used in the process. This template can be used as a reference for team members, as a teaching tool for new scrum practitioners, or as a way to communicate scrum to stakeholders. Our well-designed scrum infographic can help you and your audience quickly understand the basics of the framework, as well as its benefits, applications, and best practices.


5 slides
SWOT Analysis Business Presentation
Identify key business factors with the SWOT Analysis Business Infographic. This structured template visually highlights strengths, weaknesses, opportunities, and threats, making it ideal for strategy planning, competitive analysis, and decision-making. Fully customizable with editable colors, text, and icons. Compatible with PowerPoint, Keynote, and Google Slides for effortless presentation use.


21 slides
Tempest Sales Performance Report Presentation
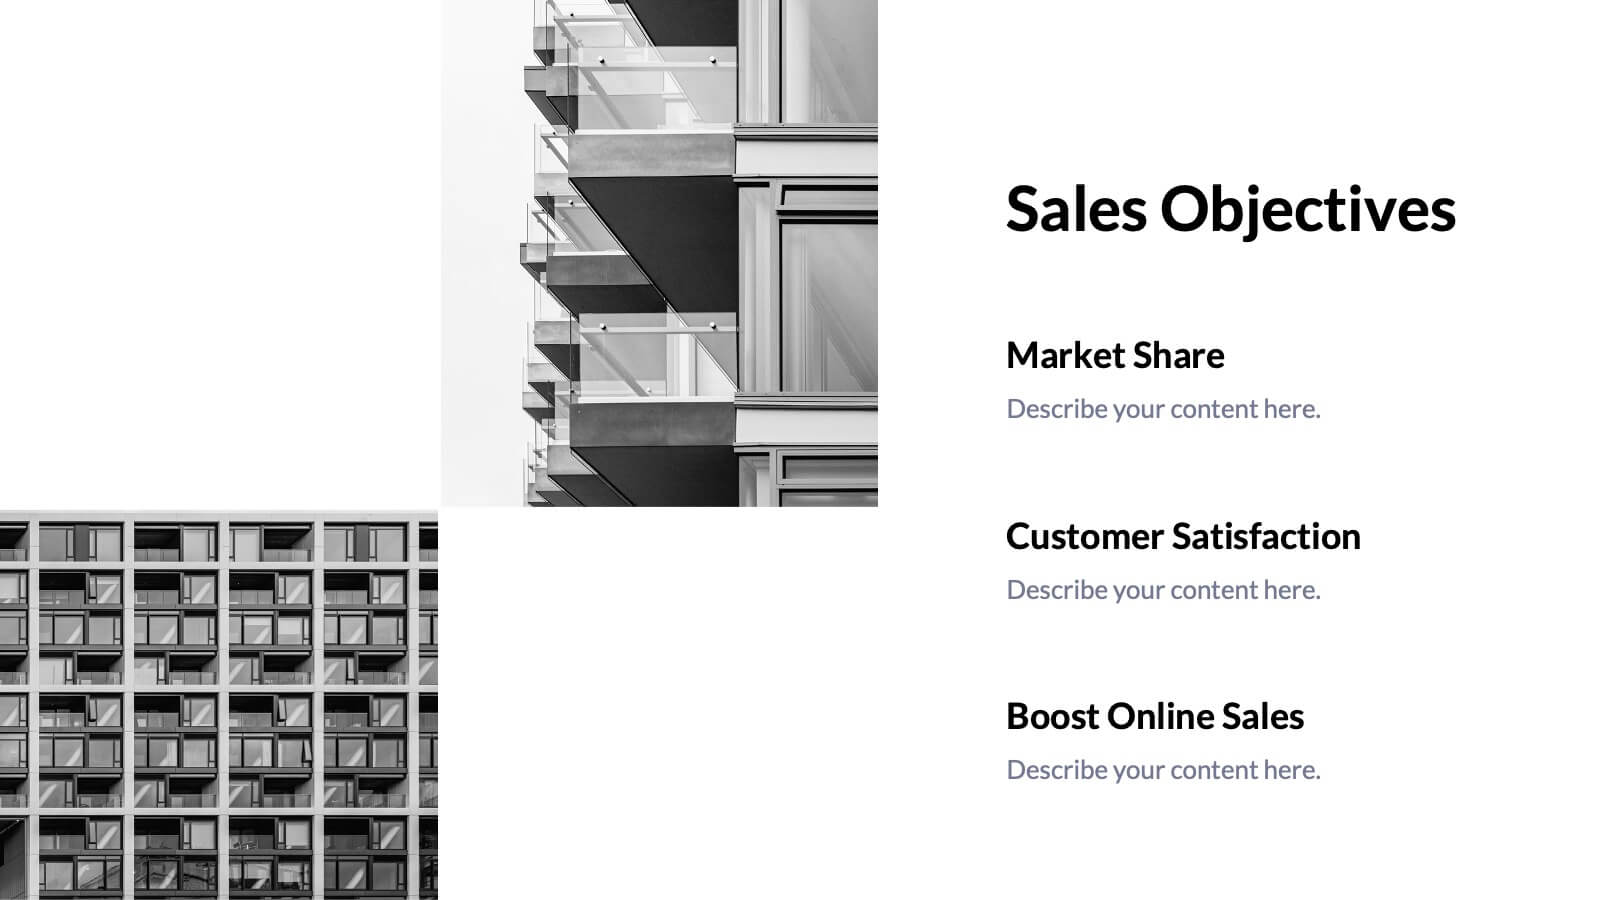
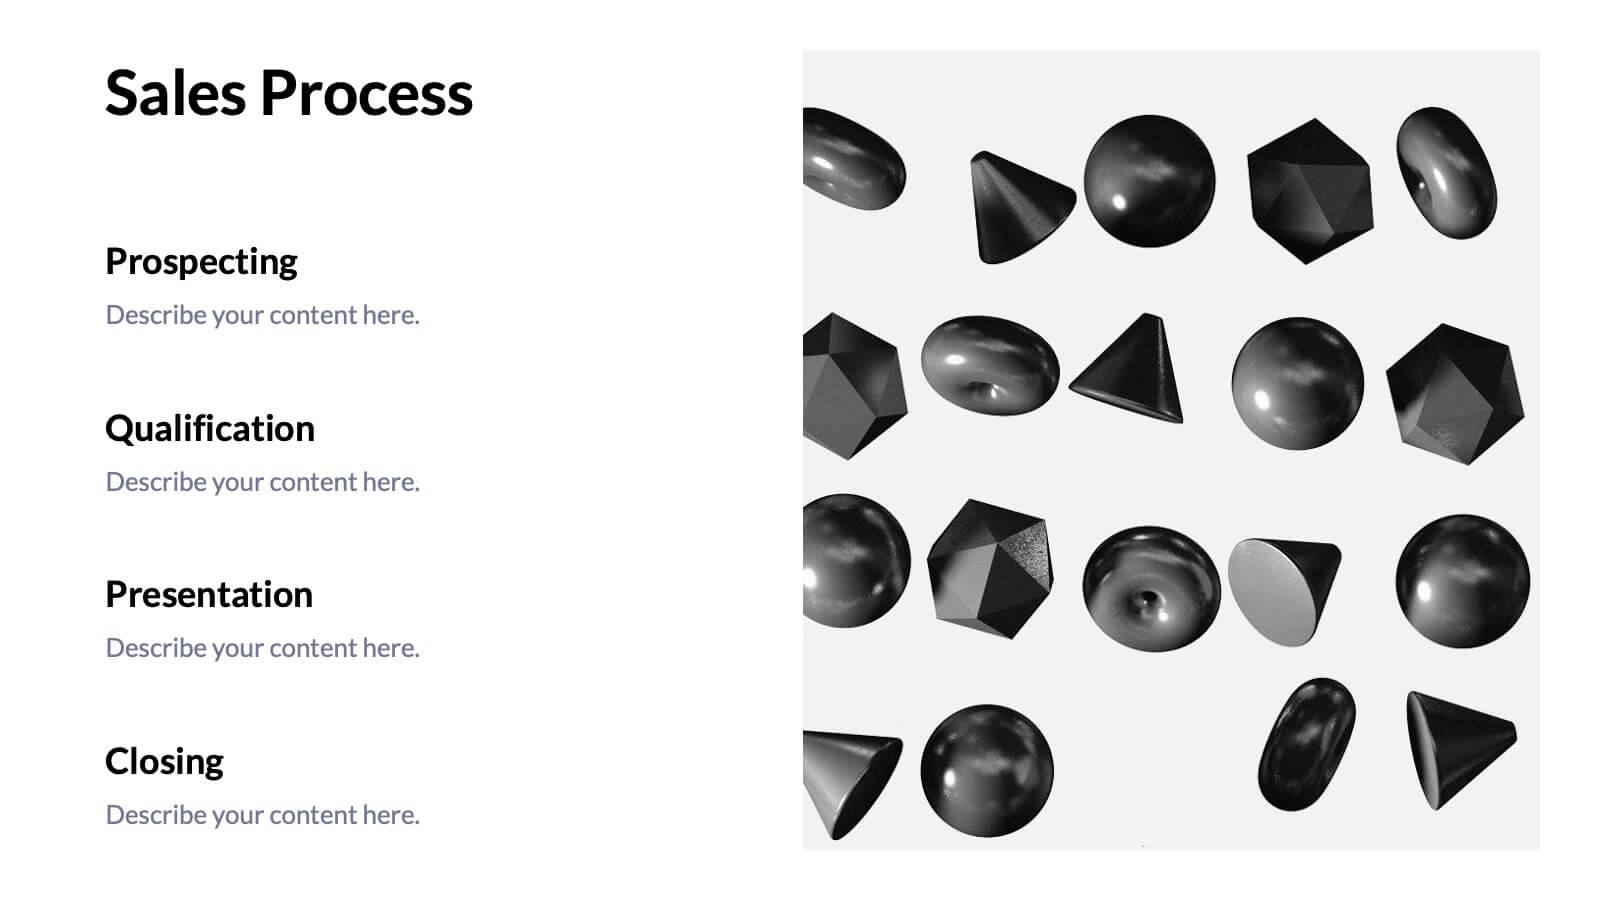
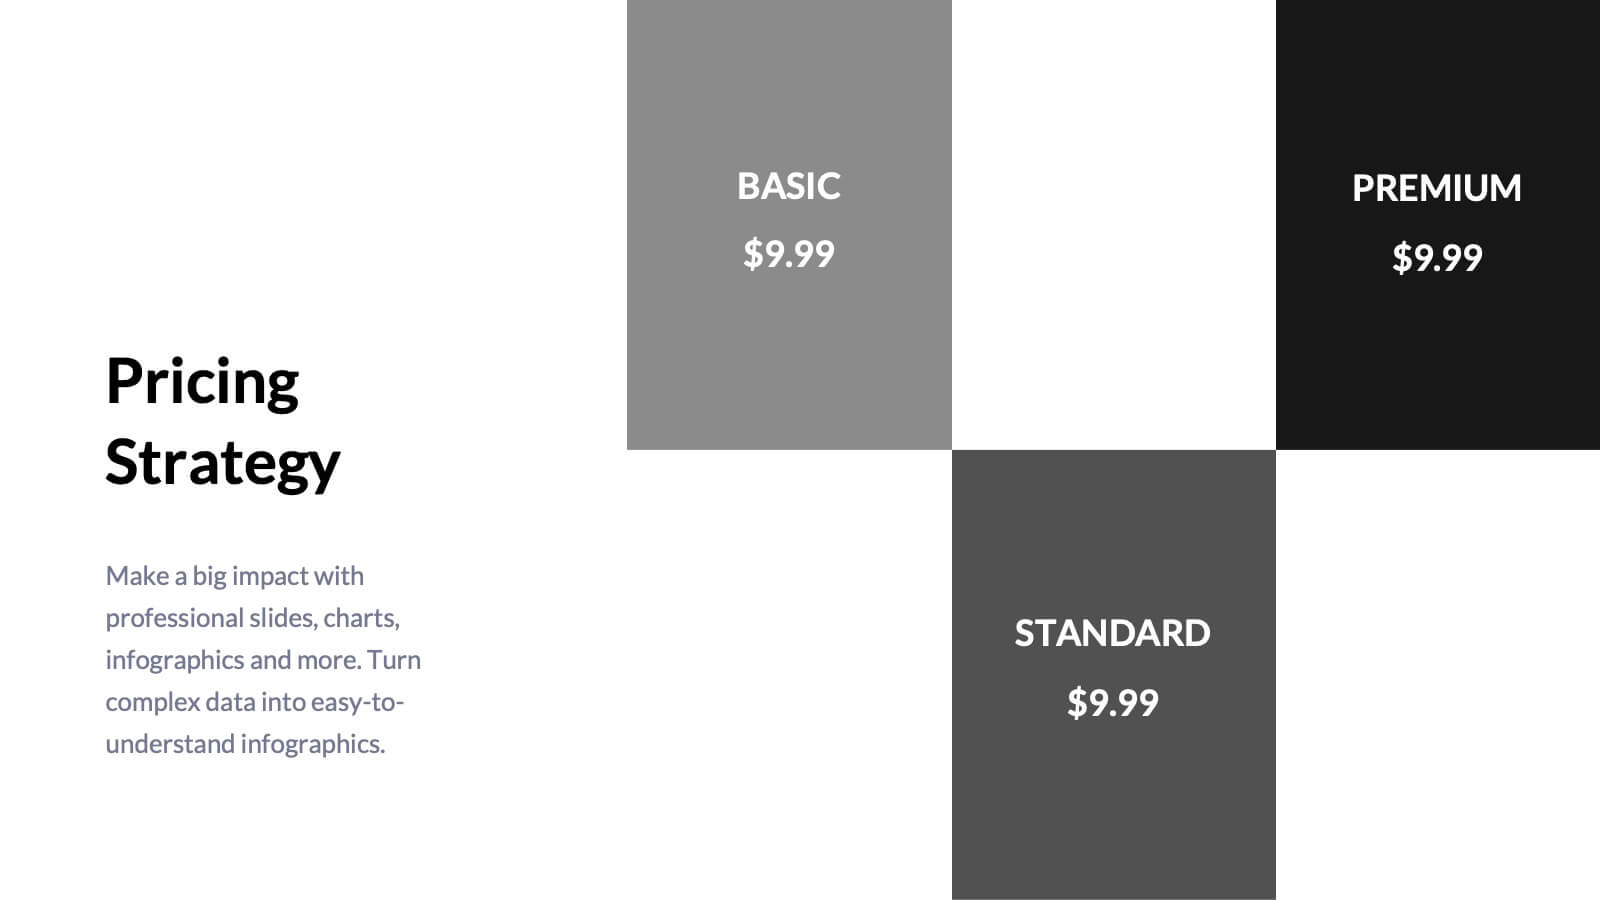
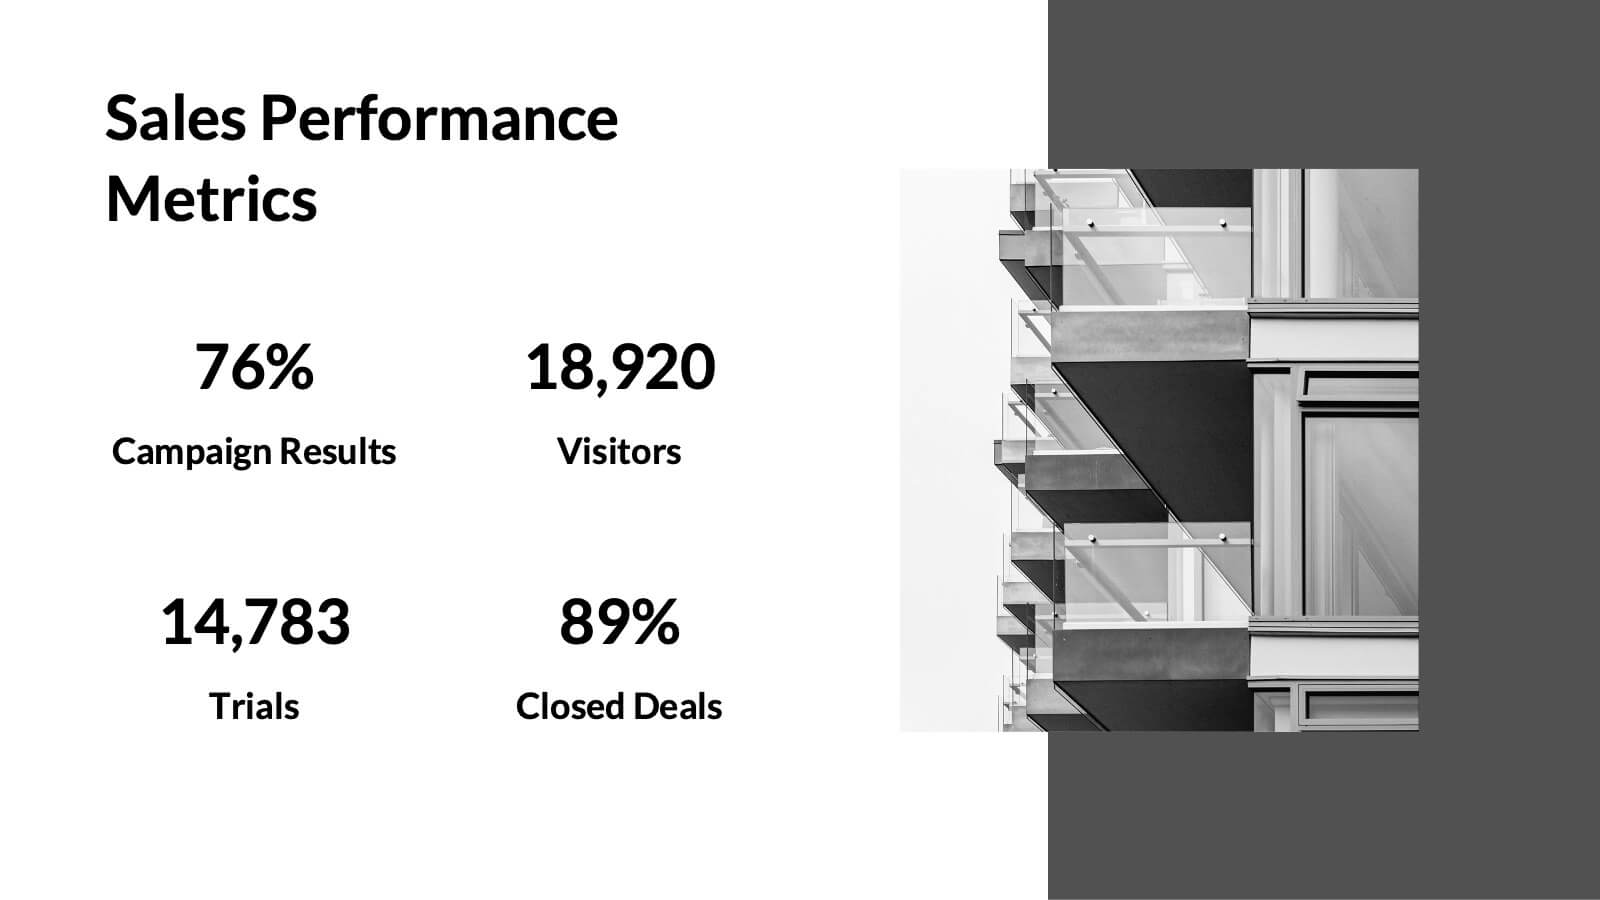
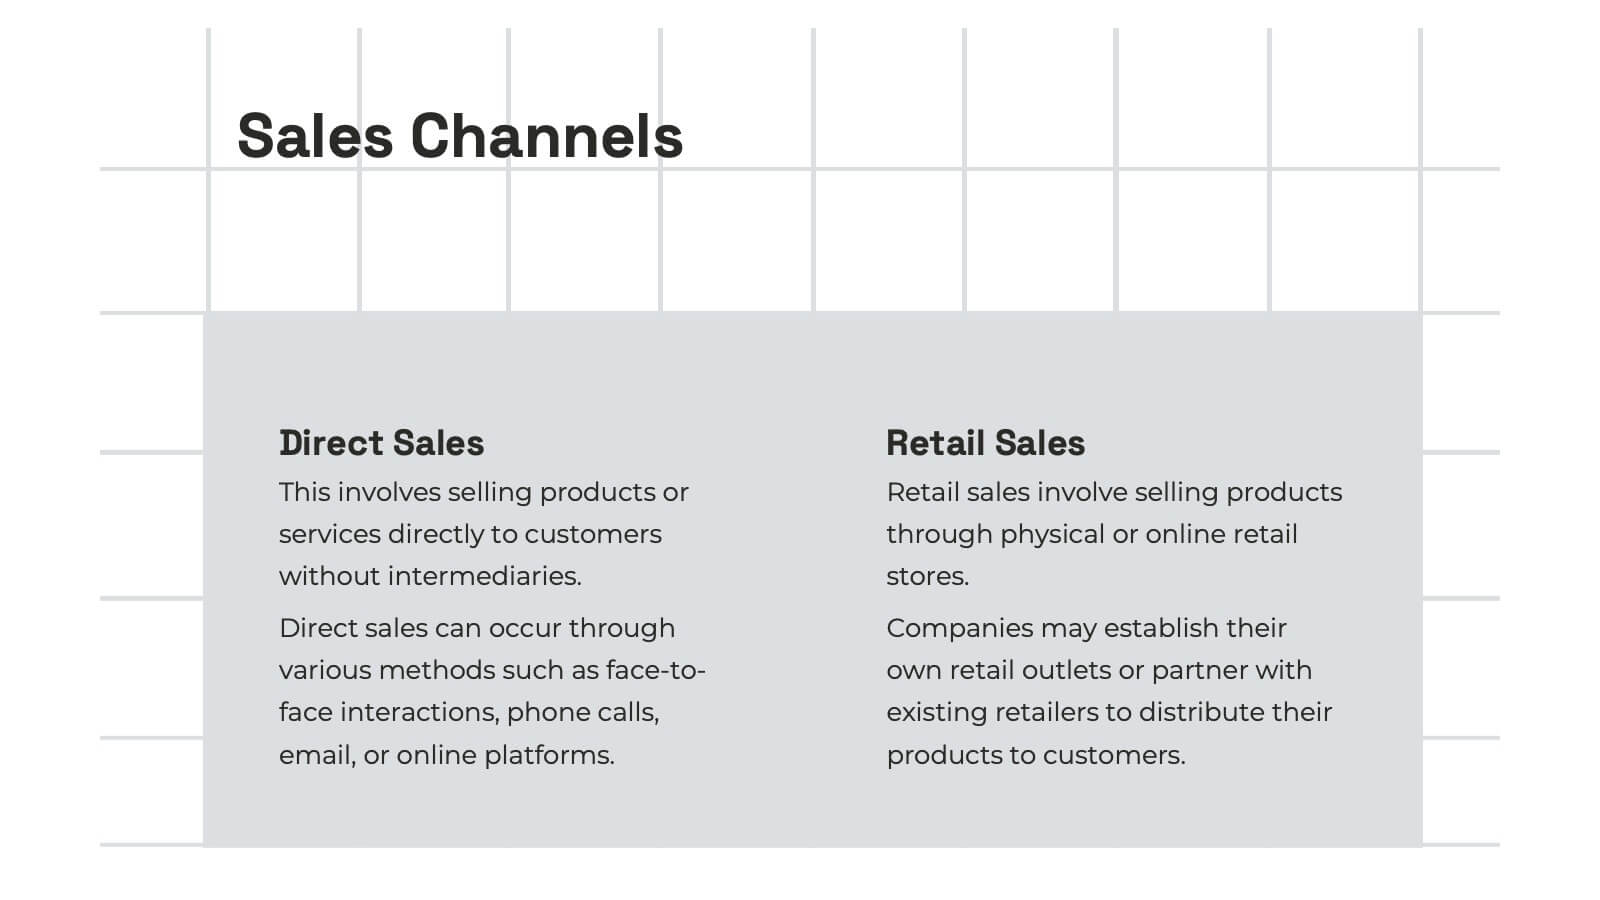
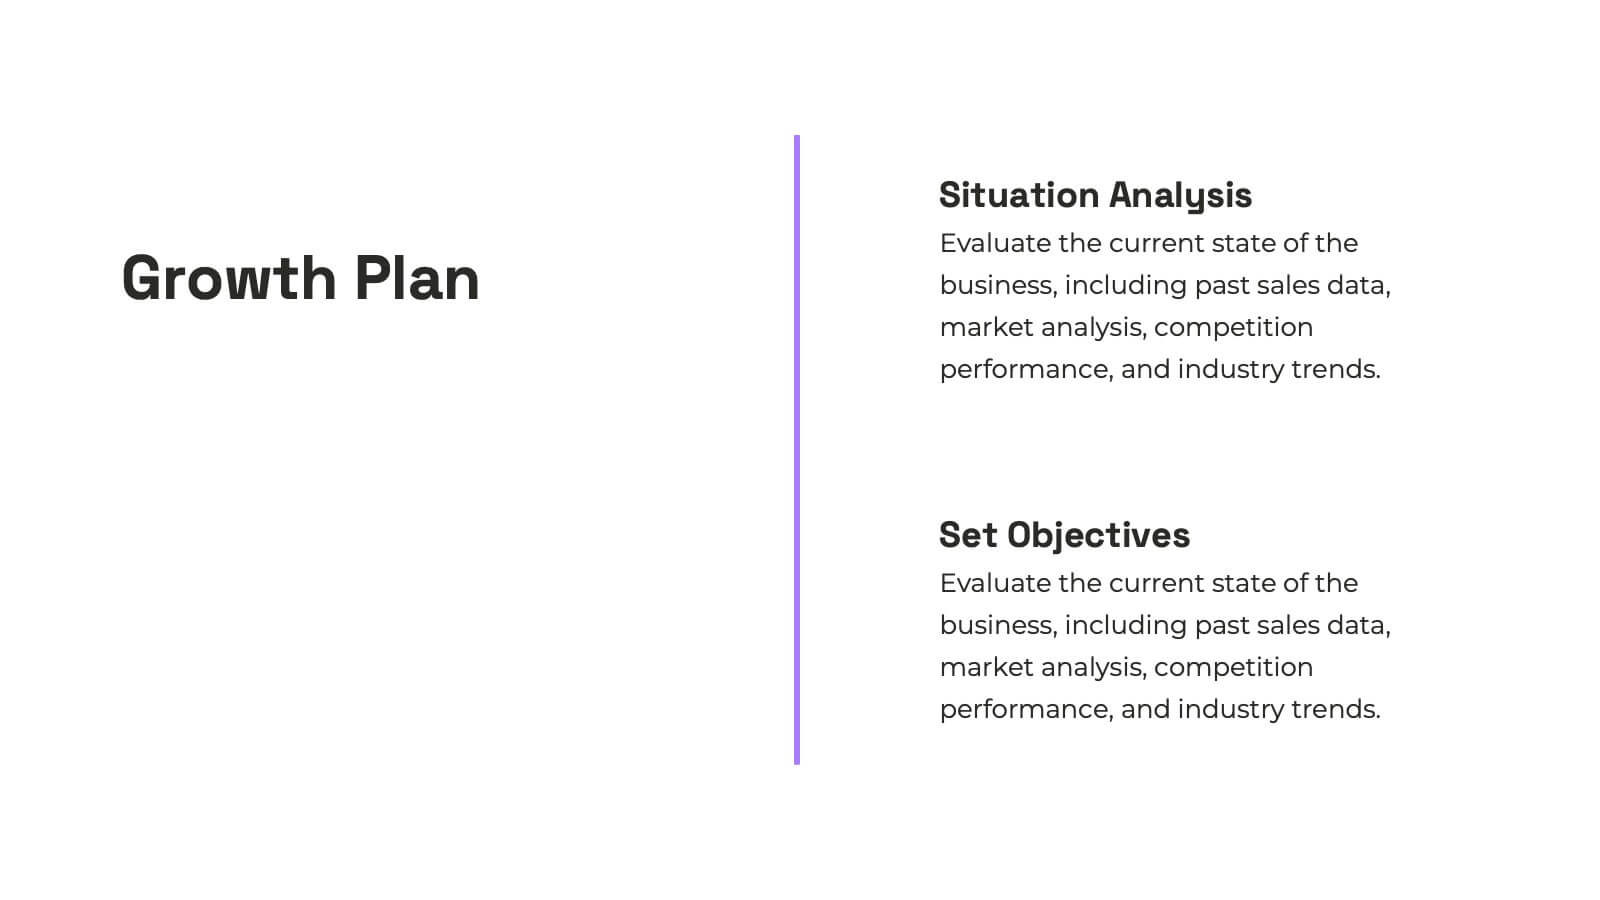
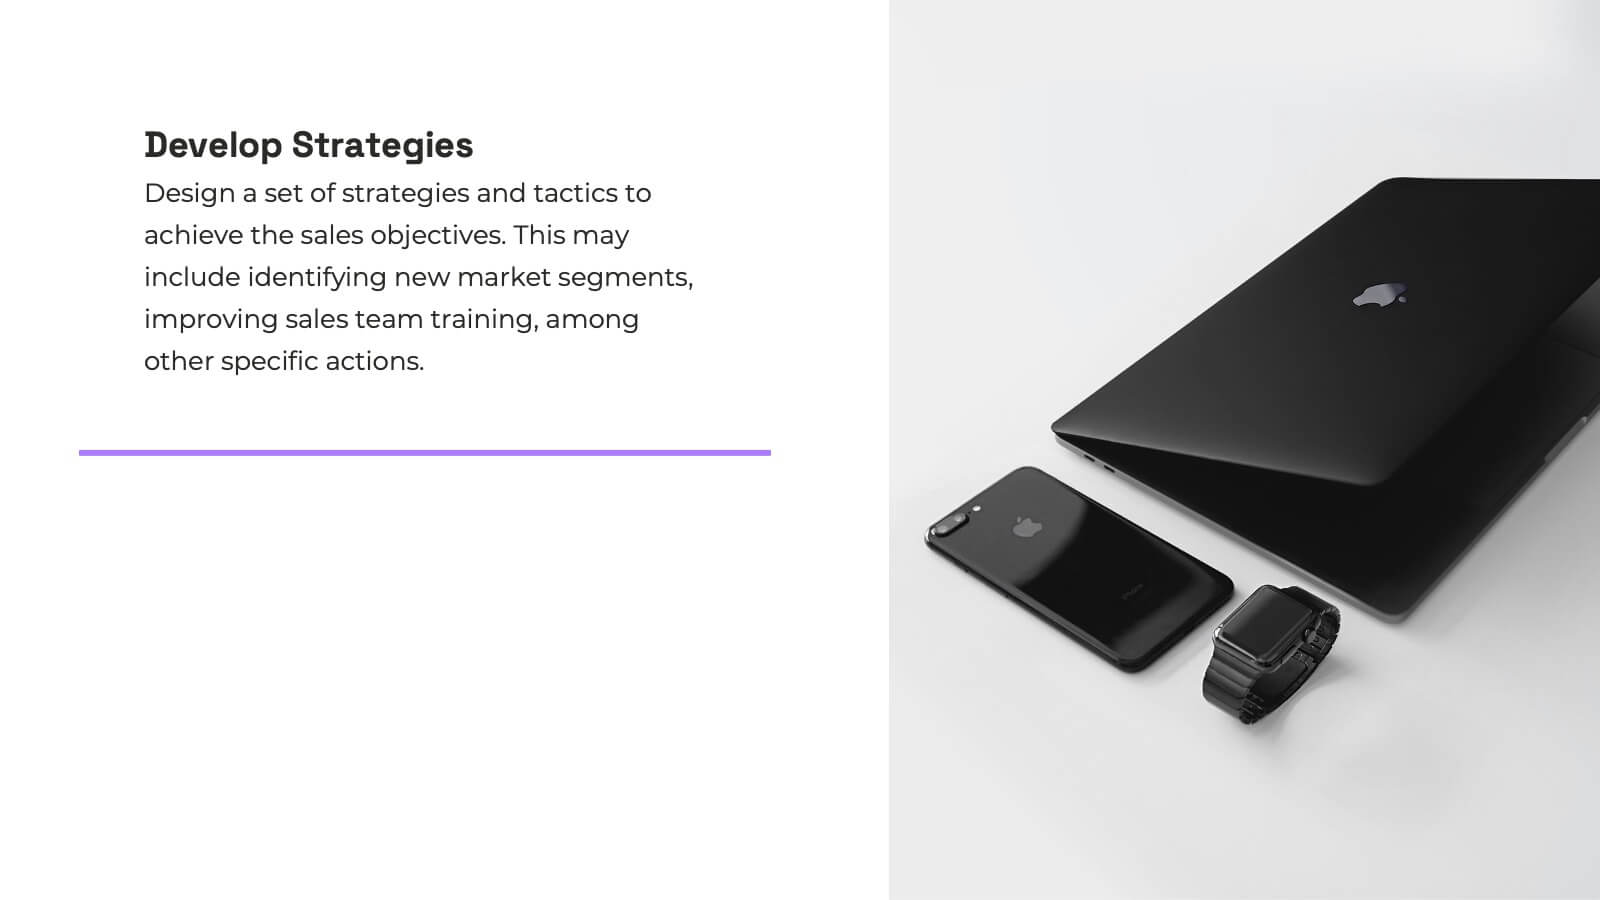
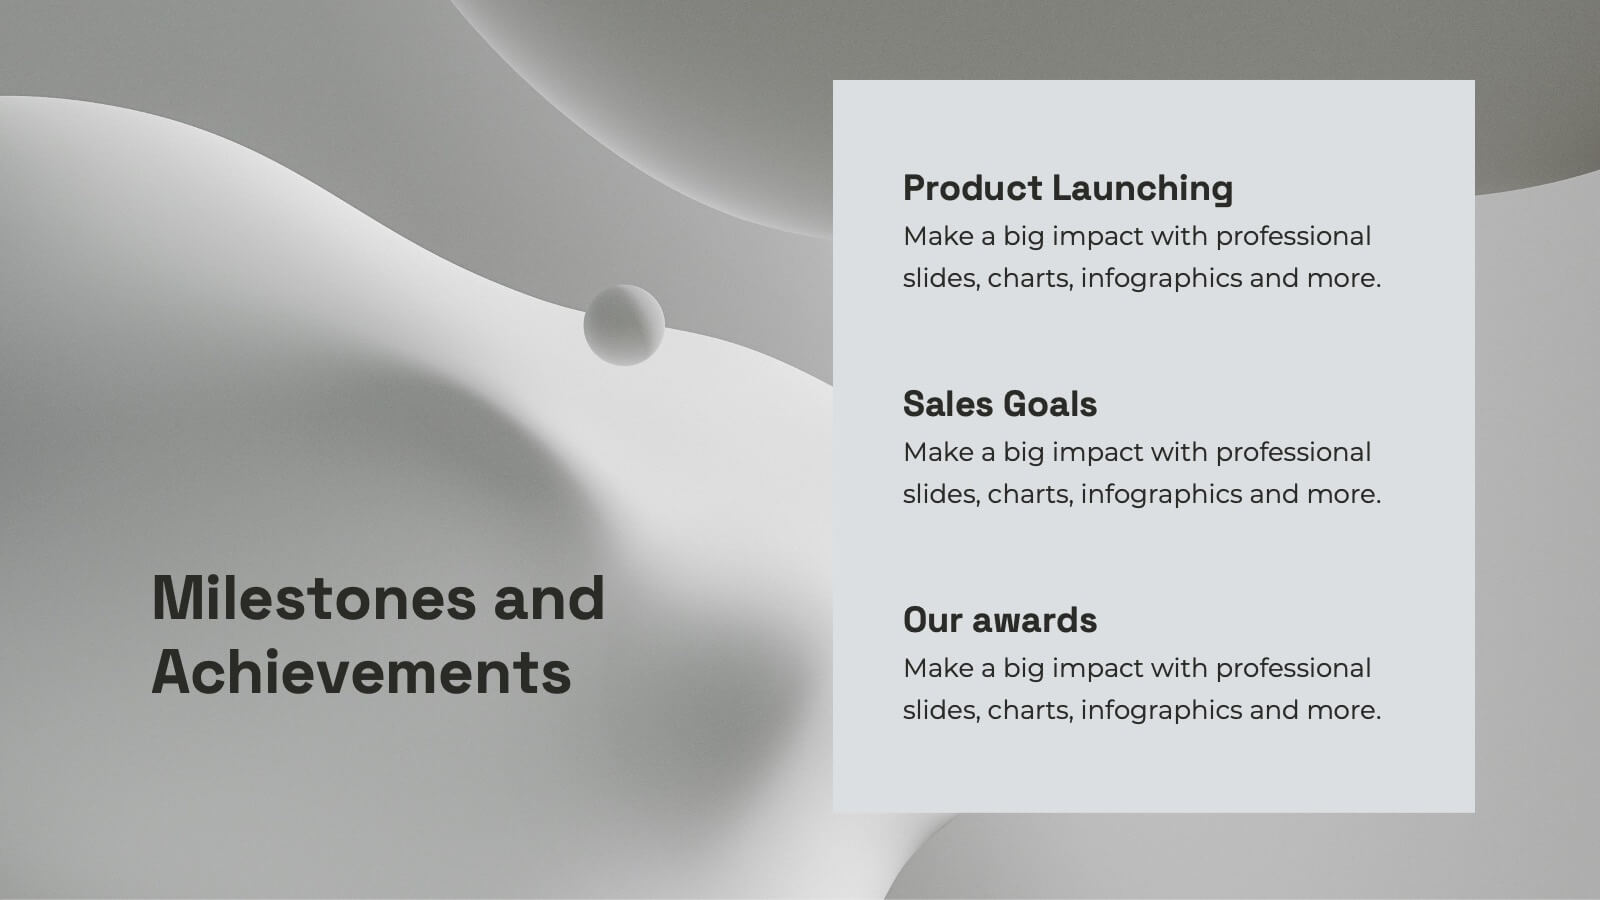
Supercharge your sales presentations with this sleek, professional template. Perfect for outlining sales objectives, processes, and performance metrics, it features a clean, minimalist design that enhances clarity and impact. Highlight key elements like competitive analysis, pricing strategy, and future opportunities to captivate your audience. Compatible with PowerPoint, Keynote, and Google Slides, it ensures seamless presentations on any platform.


4 slides
Data Visualization Pie Chart
Make your insights pop with this engaging Pie Chart slide. Perfect for reporting KPIs or comparing segmented data, the radial design blends clear visuals with editable text sections. Ideal for marketing, analytics, or strategy meetings. Fully customizable in PowerPoint, Keynote, and Google Slides.


7 slides
Analyze Survey Results Infographic
Survey results refer to the outcomes and findings obtained from a survey conducted to gather information, opinions, feedback, or data from a specific group of individuals or a target audience. This visually appealing and insightful infographic template transforms survey findings into captivating visuals, enabling you to grasp trends, patterns, and valuable insights at a glance. Compatible with Powerpoint, Keynote, and Google Slides. This provides valuable insights and analysis based on the responses collected. Our infographic is a common research method used in various fields, including business, academia, social sciences, marketing, and more.


5 slides
Marketing Sales Funnel Presentation
Watch your customer journey come to life with a clean, visual flow that makes each stage easy to understand at a glance. This presentation breaks down your funnel into clear steps, helping you explain conversions, behaviors, and strategy with confidence. Fully compatible with PowerPoint, Keynote, and Google Slides.


6 slides
Project Planning and Task Allocation Presentation
Streamline your project timelines with the Project Planning and Task Allocation Presentation. This template uses a clear horizontal flow to map out six key tasks or stages, making it ideal for visualizing schedules, assigning responsibilities, or showcasing milestones. Fully editable in PowerPoint, Google Slides, Keynote, and Canva.


22 slides
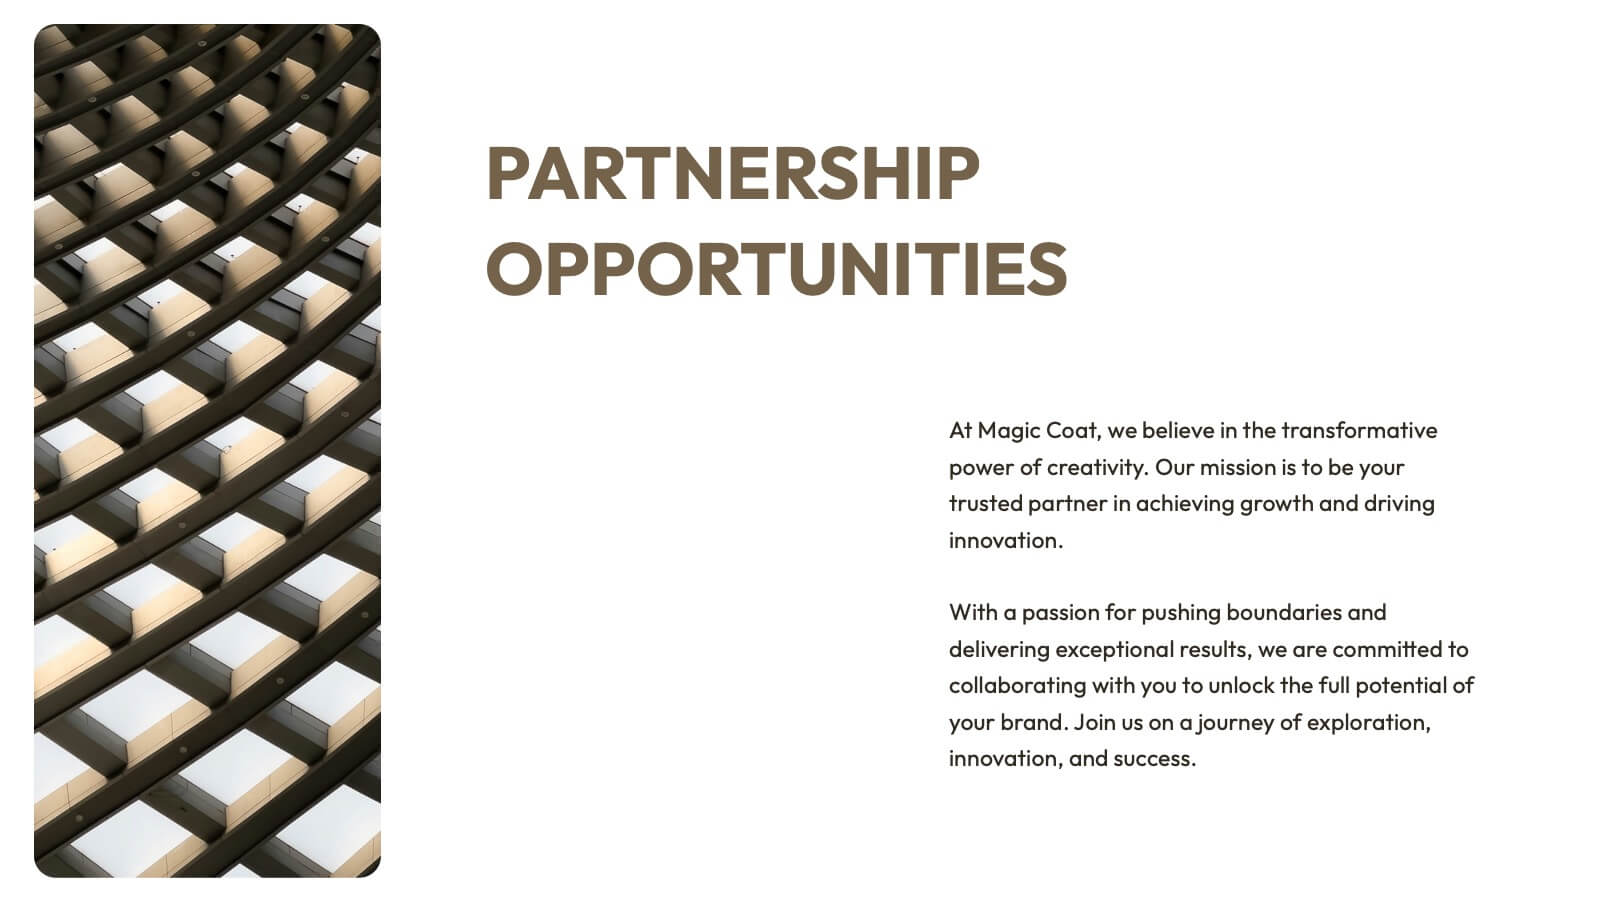
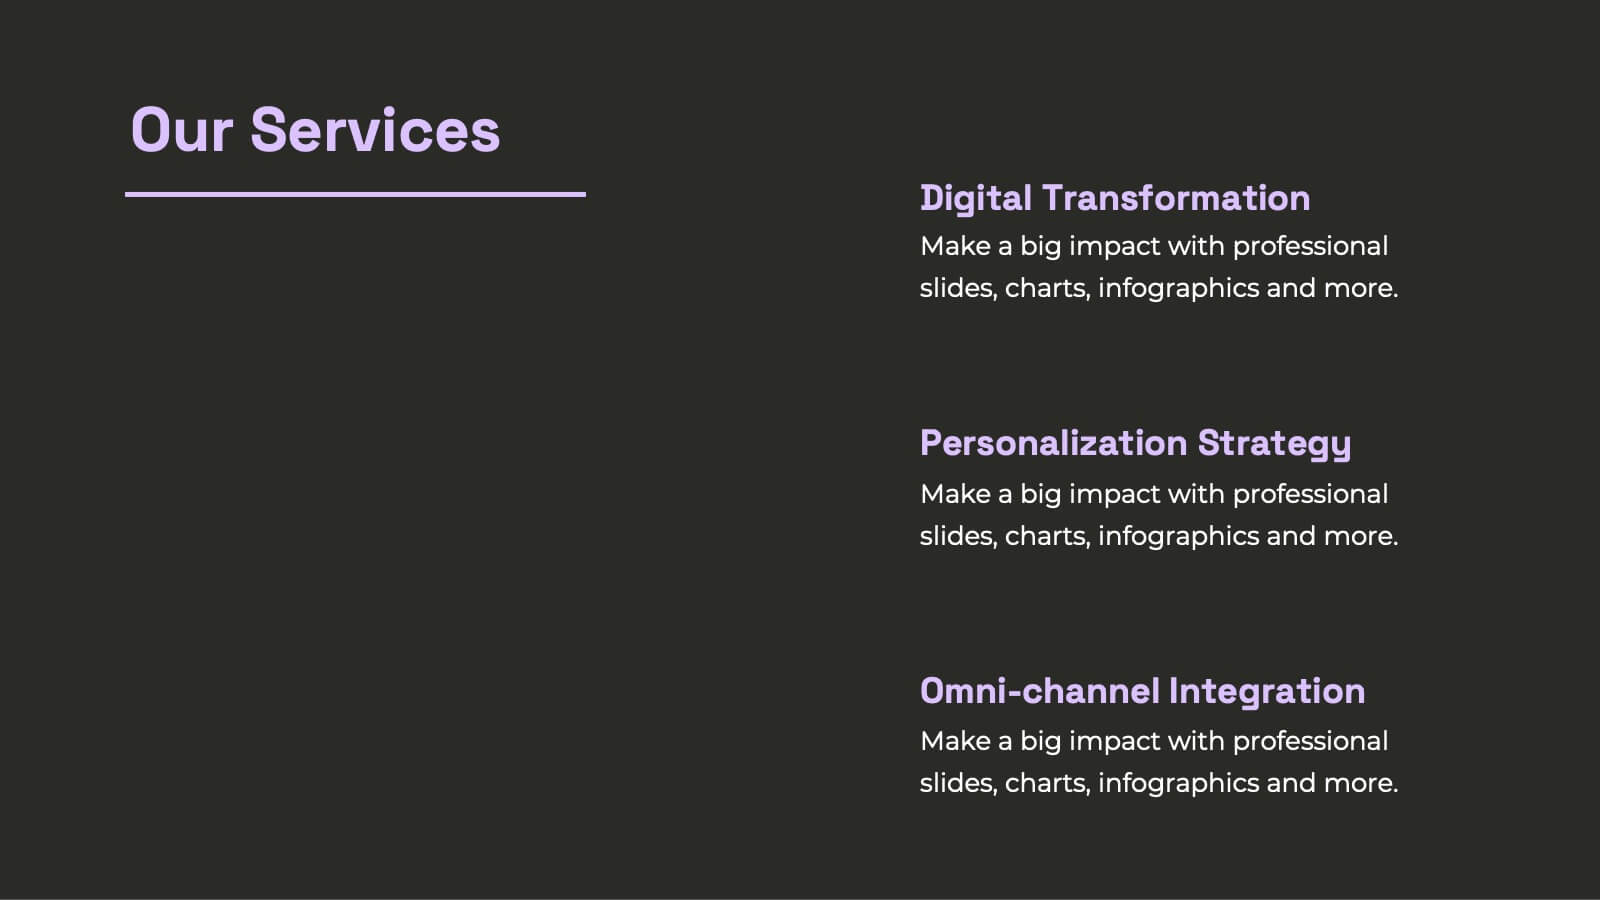
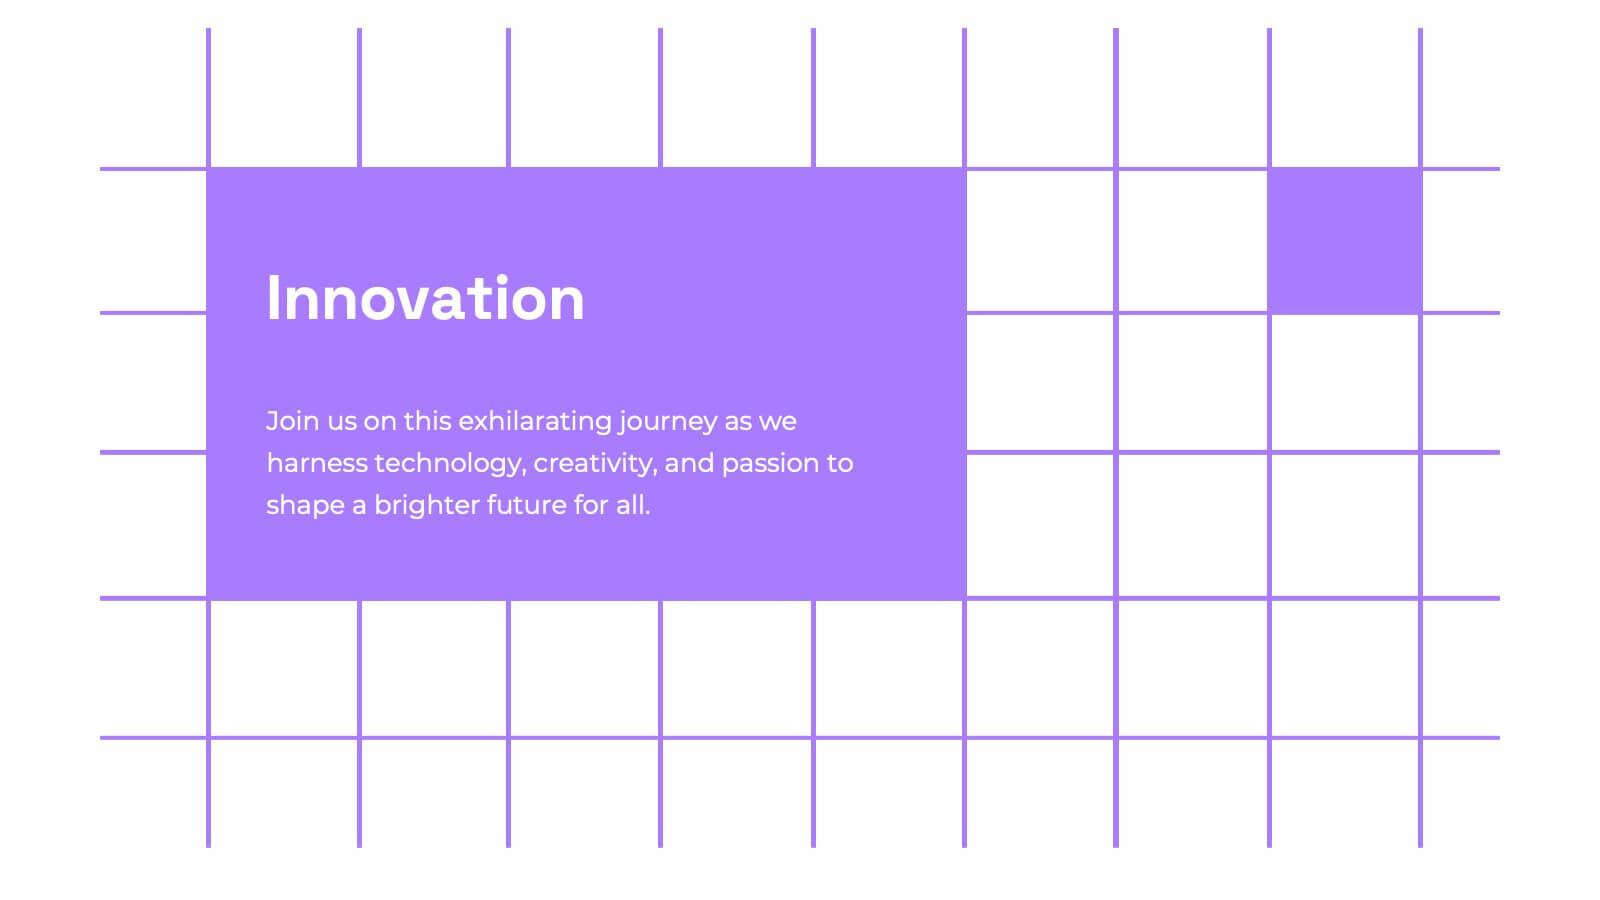
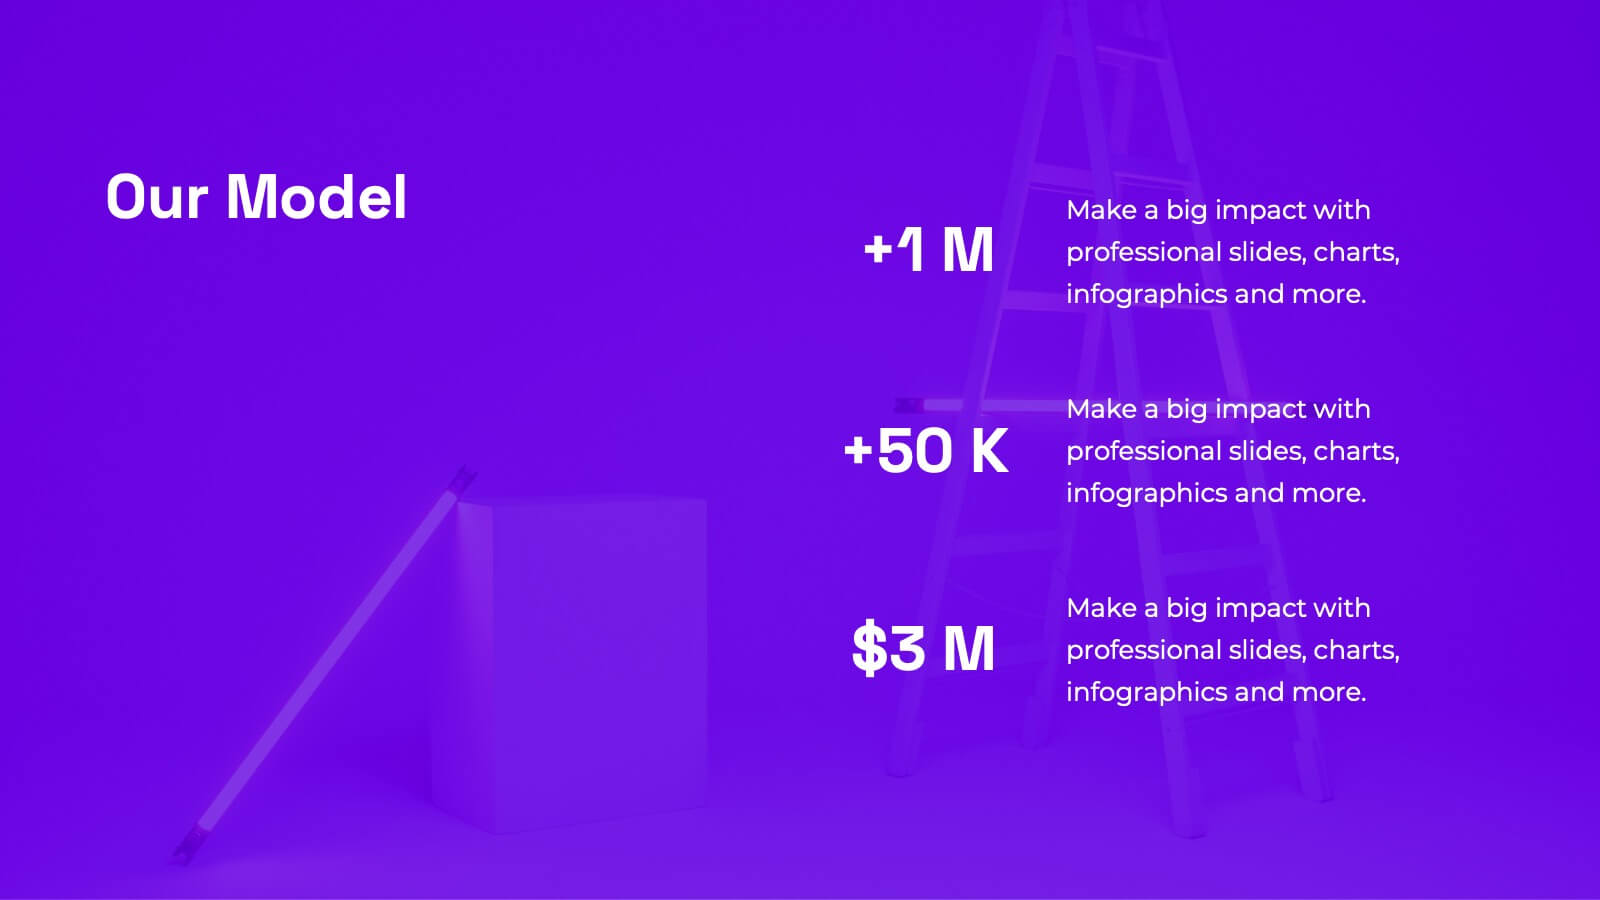
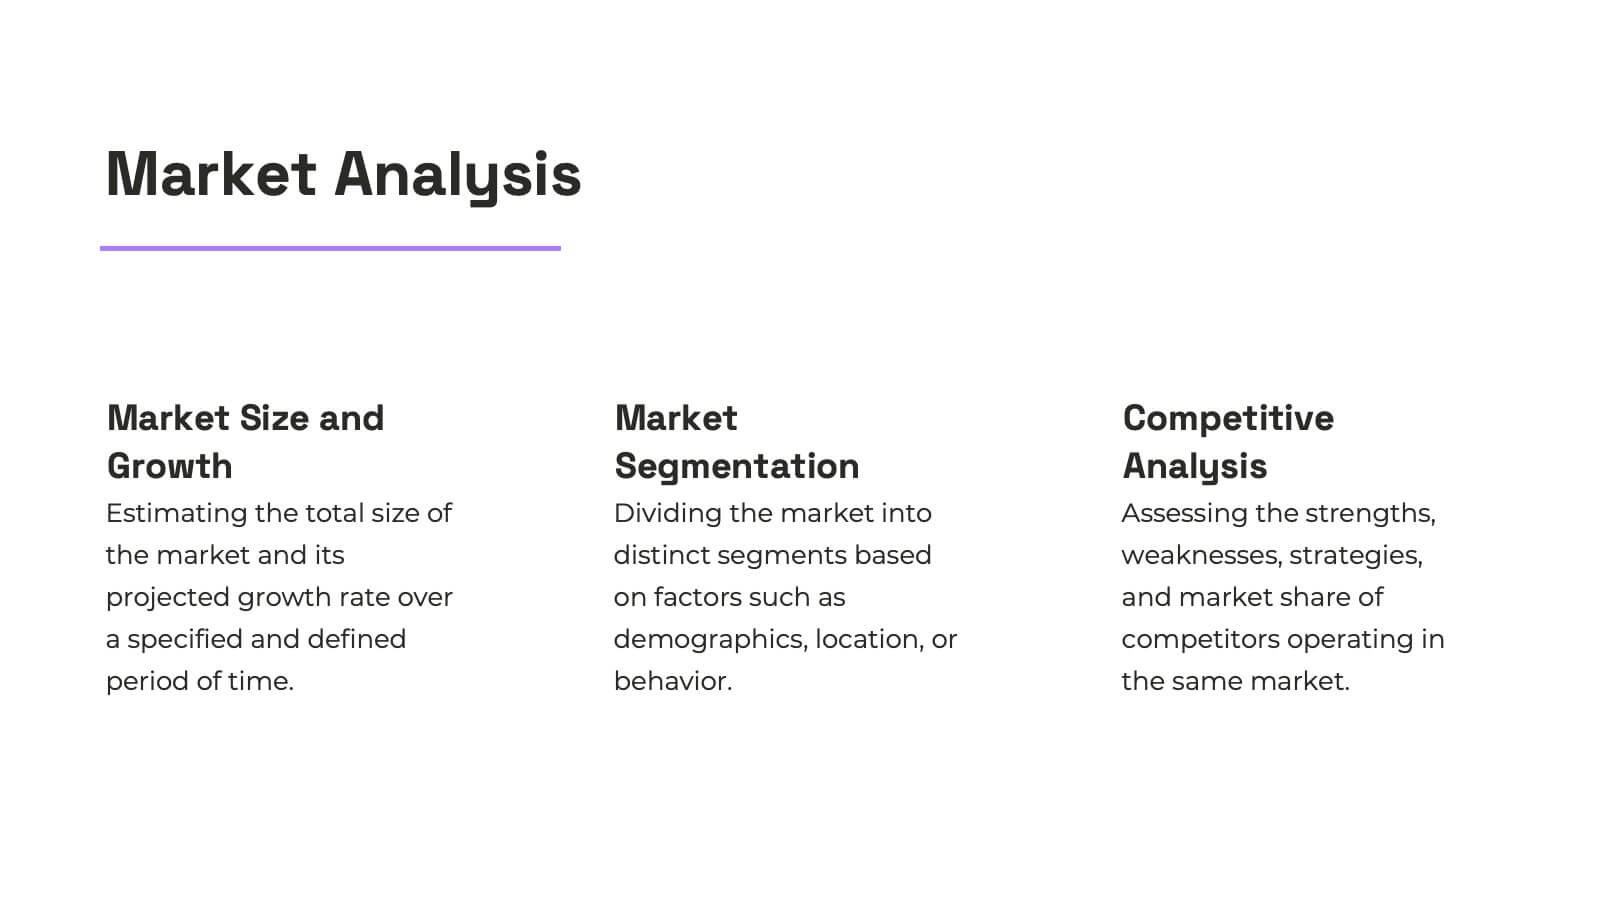
Vivid Creative Agency Pitch Deck Presentation
This sleek creative agency template is ideal for presenting your company's mission, services, and success stories. With a minimalist design, it offers a professional yet stylish approach to showcase case studies, industry trends, and partnership opportunities. It’s perfect for PowerPoint, Keynote, and Google Slides, making your agency stand out with every slide.


5 slides
Water Problems Infographics
Water Problems refer to the various issues that arise due to the scarcity, pollution, or mismanagement of water resources. These vertical infographics are perfect for addressing various issues related to water management and conservation. They are effective tools for raising awareness about water-related issues and promoting sustainable water management practices. This template is completely customizable and includes various icons and images related to water such as water droplets, faucets, and ocean waves. The color scheme is predominantly blue, signifying the importance of water conservation and preservation.


5 slides
Benefits of Good Nutrition Infographics
Good Nutrition is crucial for overall health, disease prevention, weight management, mental well-being, energy levels, and various other aspects of our physical and mental health. These vertical infographic templates can be used to present the importance and advantages of maintaining a healthy and balanced diet. These are designed to educate and inspire individuals to make informed choices about their nutrition and overall well-being. Perfect for educational presentations, nutrition workshops, wellness programs, or health-related websites, these templates provide valuable information and visual aids to promote better nutrition choices.


20 slides
Pulsebeat Sales Proposal Presentation
Seal the deal with this compelling sales proposal template, crafted to showcase your offerings, customer value, and competitive edge with clarity. Including slides for sales objectives, process, pricing strategy, and performance metrics, it’s perfect for sales teams aiming to impress. Compatible with PowerPoint, Keynote, and Google Slides for effortless presentation.


7 slides
Health Infographic Presentation Template
A health infographic is a visual representation of information and data related to health. This template can be used to convey complex information about a variety of health topics, such as disease symptoms, risk factors, and preventive measures, in a simple and easily understandable manner. This Health infographic displays graphics, images, and charts to help illustrate the information and make it more engaging and accessible to your audience. This template can be used for various purposes, such as educating the public, promoting healthy habits, and informing healthcare professionals.


5 slides
Overcoming Strategic Business Challenges Presentation
Break down complex obstacles with this step-by-step "Overcoming Strategic Business Challenges" presentation. Featuring a stair-like 3D visual with figures symbolizing progress and setbacks, each slide is divided into four clear milestones. Ideal for showcasing pain points, strategic pivots, or recovery plans. Customize each step with your insights in PowerPoint, Keynote, or Google Slides.


7 slides
Butterfly Visualization Layout Presentation
Bring balance and clarity to your data storytelling with a sleek, symmetrical design that connects ideas seamlessly. This presentation is ideal for visualizing comparisons, workflows, or interconnected topics in a clean and engaging format. Fully customizable and compatible with PowerPoint, Keynote, and Google Slides.


8 slides
Professional Business Executive Summary Presentation
Make your insights stand tall with a bold, clean layout that feels like a data-driven story in motion. This executive summary slide is perfect for breaking down complex ideas into three clear steps, using sleek vertical bars to add visual rhythm. Compatible with PowerPoint, Keynote, and Google Slides for easy editing.


6 slides
Social Relationship Infographics
Revitalize your presentations on social dynamics with our Social Relationship infographic, seamlessly compatible with Powerpoint, Keynote, and Google Slides. This infographic is a perfect addition for sociologists, relationship coaches, and educators who aim to discuss the complexities and interconnectedness of social relationships. The infographic offers a visual breakdown of different social relationship types, the dynamics within those relationships, and the factors influencing social interactions. It's designed to help audiences understand the different layers and nuances that make up social connections, whether in personal networks, communities, or professional environments. Incorporating this infographic into your presentations will assist in illustrating how relationships are formed, maintained, and evolved. It serves as an educational tool that can lead to deeper discussions about social bonds, communication patterns, and relationship management. Utilize this infographic to provide a clear and impactful visual representation of the fundamental concepts in social relationship studies.


22 slides
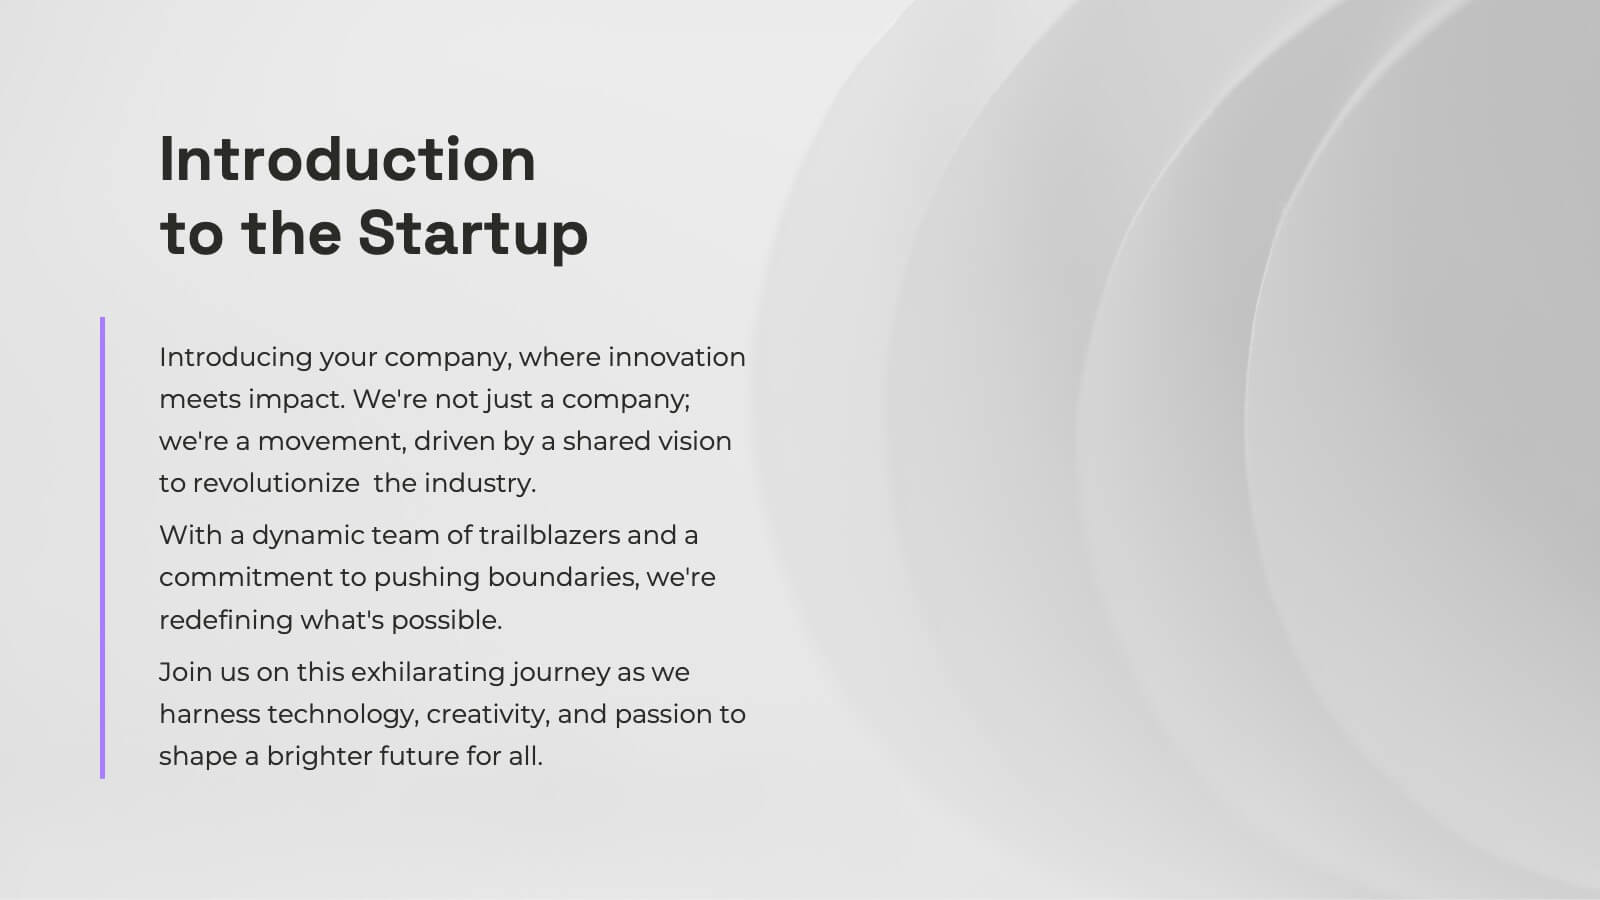
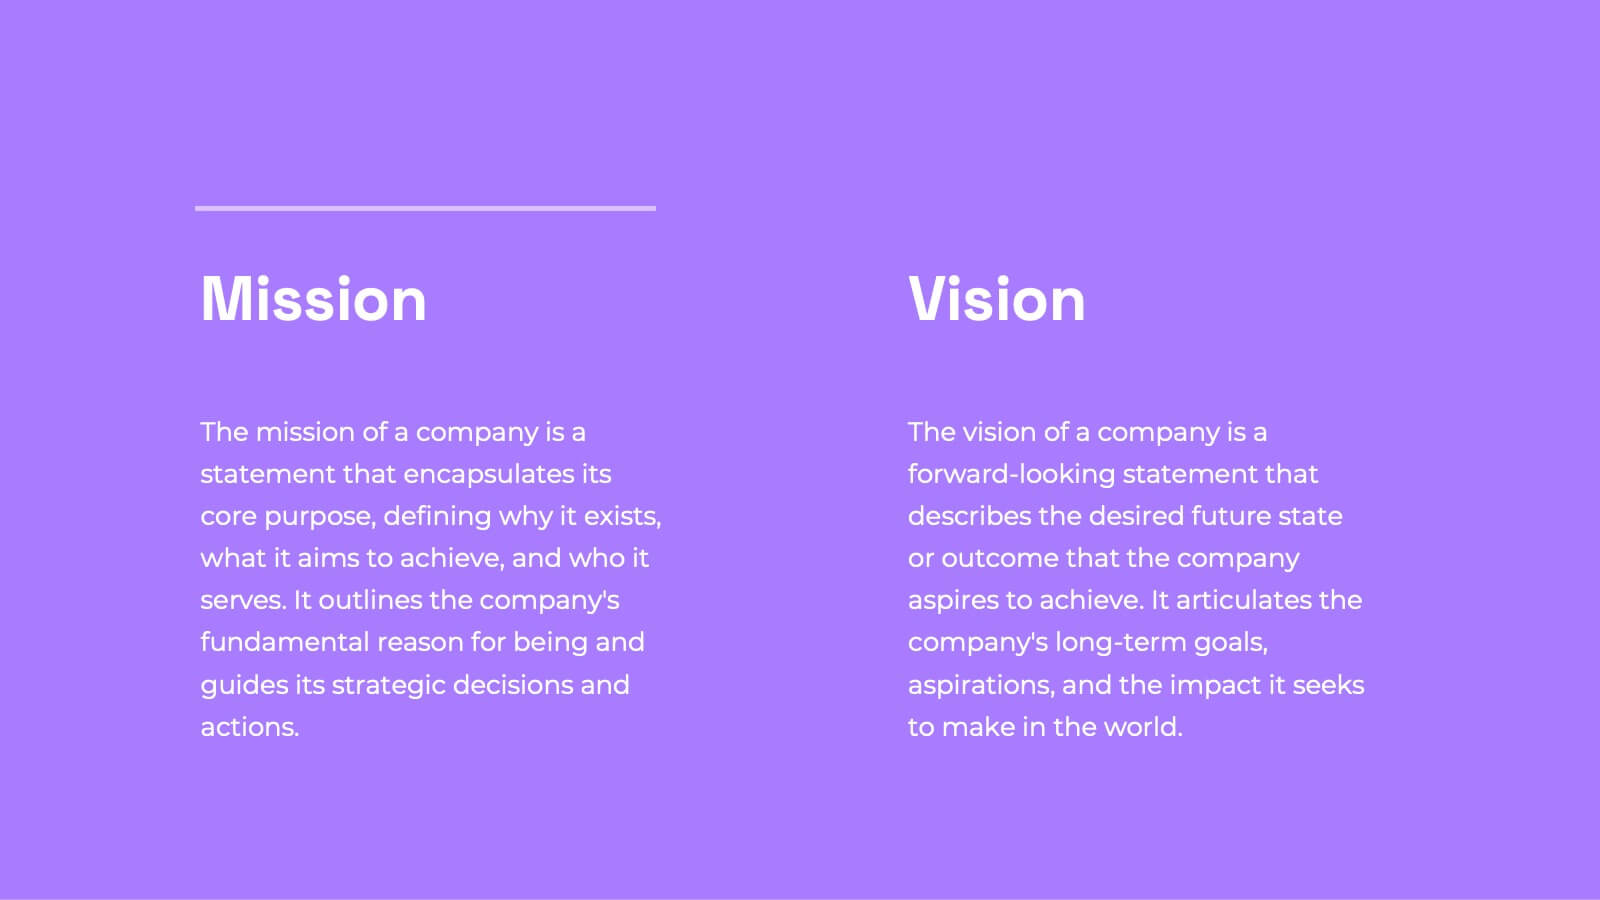
Nexus Startup Growth Plan Presentation
Jumpstart your business journey with this dynamic presentation template! Ideal for outlining your startup growth plan, it covers mission, vision, market analysis, and financial projections with sleek, professional slides. Capture investor interest and articulate your strategy effortlessly. Compatible with PowerPoint, Keynote, and Google Slides, ensuring seamless presentation across all platforms.