


Features
- 10 Unique Slides
- Fully editable and easy to edit in Microsoft Powerpoint, Keynote and Google Slides
- 16:9 widescreen layout
- Clean and professional designs
- Export to JPG, PDF or send by email


Do you have any questions?
Recommend


21 slides
Starforge Project Status Report Presentation
This Project Status Report Presentation template provides a professional and structured format to track progress, review performance metrics, and outline key achievements. Ideal for business updates, it covers agenda, financial summary, goals review, and next steps. Fully customizable and compatible with PowerPoint, Keynote, and Google Slides for effortless editing.


6 slides
Shopping Pricing Tables Infographic
Pricing tables are visual tools commonly used on websites, product pages, and marketing materials to showcase different pricing options for products or services. This infographic template displays different pricing plans or packages offered by a business or service provider. This provides a clear comparison of features, benefits, and costs, helping viewers make informed decisions about which option best suits their needs and budget. This infographic is designed to help customers quickly compare features, costs, and benefits of each plan, aiding in their decision-making process. Compatible with Powerpoint, Keynote, and Google Slides.


4 slides
IT Network Infrastructure Presentation
Optimize your IT infrastructure with this IT Network Infrastructure template. Designed with a cloud-based network architecture layout, this slide helps illustrate data flow, system components, and key IT connections in a structured format. Perfect for IT professionals, network engineers, and tech strategists, this fully customizable slide works seamlessly with PowerPoint, Keynote, and Google Slides.


5 slides
Employee Change Management Plan Presentation
Guide employees through transitions with clarity using this Employee Change Management Plan template. This step-by-step visual represents progress from initial stages (20%) to full implementation (100%), making it ideal for HR strategies, organizational development, and workforce transformation initiatives. Fully customizable—adjust colors, text, and data points to fit your business needs. Compatible with PowerPoint, Keynote, and Google Slides for seamless integration into your presentations.


6 slides
Statistical Data Overview Presentation
Transform raw numbers into a compelling visual story with a clean and structured layout that highlights key insights effortlessly. Ideal for showcasing progress, analytics, and results, this design helps simplify complex data for clear communication. Fully editable and compatible with PowerPoint, Keynote, and Google Slides for seamless customization.


4 slides
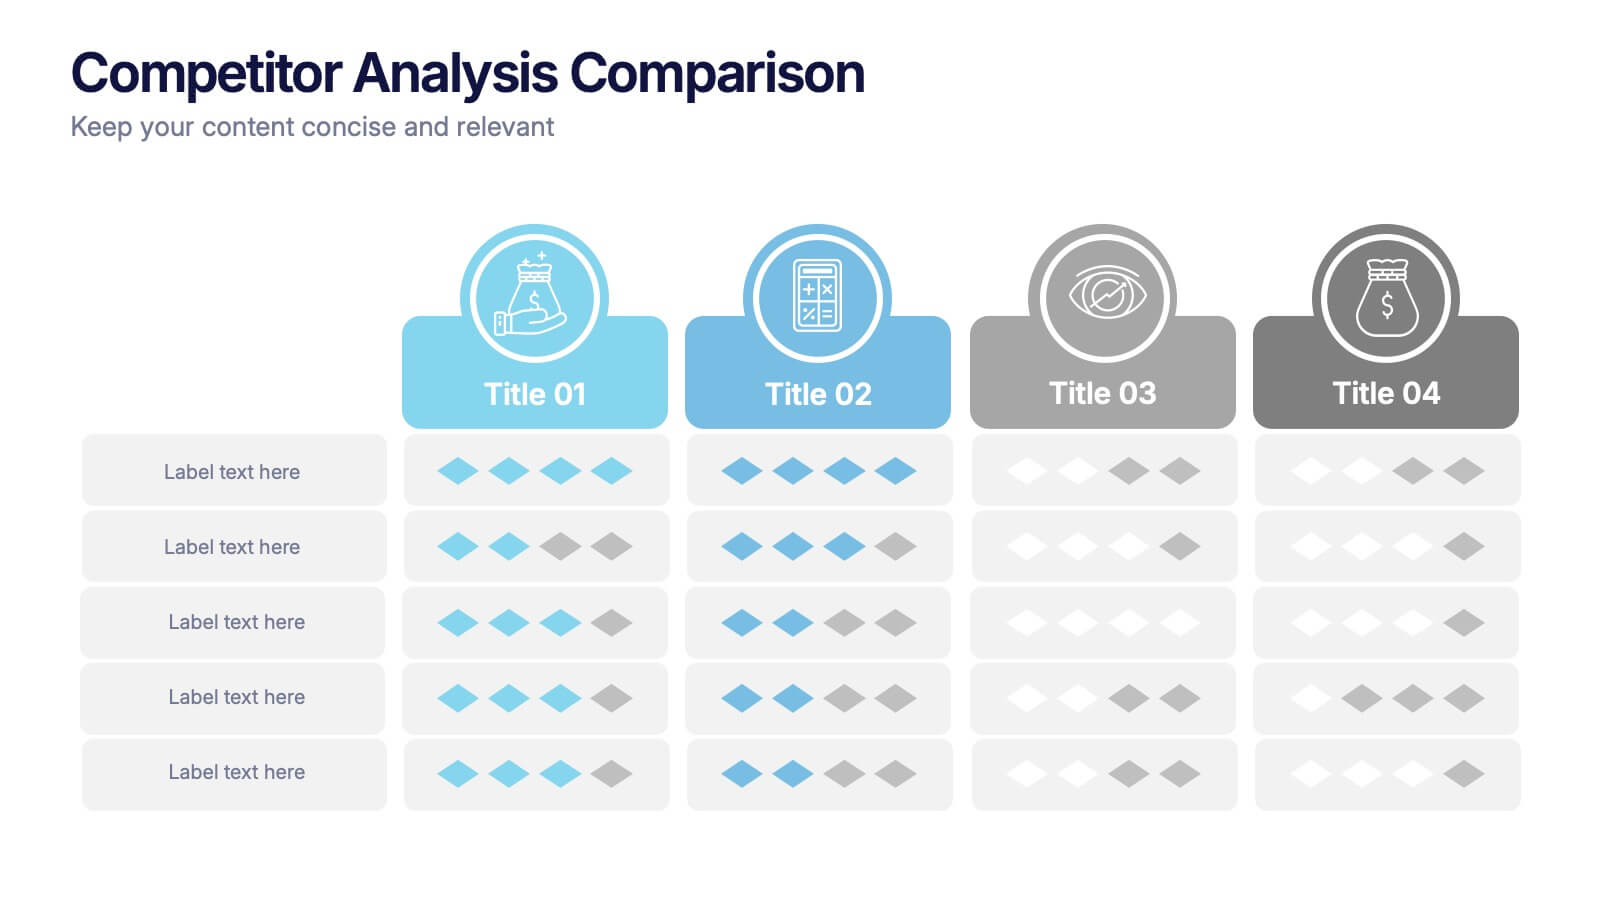
Competitor Analysis Comparison Presentation
Quickly evaluate strengths and weaknesses across your market landscape with this Competitor Analysis Comparison Presentation. Featuring clean tables, icons, and rating visuals, it's ideal for highlighting where your brand stands out. Fully editable in PowerPoint, Keynote, and Google Slides.


4 slides
Food Business Concept Pitch Presentation
Bring your culinary vision to life with the Food Business Concept Pitch Presentation. This unique avocado-shaped layout helps you outline up to four key ideas—from menu innovation to service strategy. Perfect for chefs, restaurateurs, or food startups. Fully editable in PowerPoint, Canva, and Google Slides for easy customization.


22 slides
Transmuton Creative Agency Pitch Deck Presentation
Showcase your agency’s creativity and expertise with this bold and modern pitch deck presentation. Covering key areas like campaign execution, strategy development, client success stories, and market analysis, this template helps you present a compelling vision. Fully customizable and compatible with PowerPoint, Keynote, and Google Slides for a seamless presentation experience.


26 slides
Corporate Social Responsibility (CSR) Presentation
Reinforce your commitment to positive impact with our Corporate Social Responsibility (CSR) presentation template, compatible with PowerPoint, Keynote, and Google Slides. This template is expertly crafted for businesses and organizations looking to present their CSR initiatives, environmental efforts, and community engagements. It features a professional yet inviting design with green accents to symbolize the commitment to sustainability. The template offers a variety of slide types to cover all aspects of your CSR strategy. Use 'process infographics' to outline your sustainable practices, 'mind map infographics' to explore the impact of your activities, and 'chart slides' to present your social and environmental achievements quantitatively. Our CSR template is not just for presentations; it's a statement of your organization's values and dedication to making a difference. Download it now to communicate your CSR goals and actions with clarity and inspire your stakeholders to join you in driving change for a better world.


6 slides
Bubble Mapping Strategy Presentation
Turn your ideas into a clear visual roadmap that captures every connection and concept in one glance. This professional presentation helps organize strategies, goals, and processes through an easy-to-follow bubble map layout. Fully customizable and compatible with PowerPoint, Keynote, and Google Slides for seamless editing and presentation.


7 slides
Team Member Overview Slide Presentation
Bring your team’s story to life with a clean, engaging layout that makes every role instantly clear. This presentation helps you introduce key members, outline responsibilities, and highlight individual strengths in a simple, structured way that’s easy for any audience to follow. Fully compatible with PowerPoint, Keynote, and Google Slides.


7 slides
Watercolor Infographic Presentation Template
A Watercolor Infographic is a type of visual representation that combines elements of traditional watercolor paintings with information and data. This template uses soft, flowing lines and splashes of color to create an eye-catching design that communicates information in a unique and creative way. This Watercolor infographic can be used to showcase statistics, trends, or other information in a visually appealing way, making them ideal for presentations, reports, and marketing materials. This template is perfect for teachers, students, or anyone who wants to make their information stand out.


6 slides
Community Network Infographic
A community network is a localized, often root-driven, communication infrastructure that connects individuals, organizations, and institutions within a specific geographical area or community. This Infographic template visually represents the connections, relationships, and interactions within a community, often focusing on its members, resources, and activities. This template is a powerful way to showcase the dynamics and vitality of a community. This highlights the central theme or purpose of the community at the center of the infographic. This is fully customizable and compatible with Powerpoint, Keynote, and Google Slides.


6 slides
Annual Corporation Report Infographics
Our Annual Corporation Report infographic is an optimal visual enhancement for presentations in Powerpoint, Keynote, and Google Slides, tailored for corporate executives, financial analysts, and stakeholders. This infographic is meticulously designed to present annual financial and operational data in a structured and easily interpretable manner. The infographic provides a visual summary of an organization's yearly performance, including financial figures, growth metrics, and key performance indicators (KPIs). Its layout is engineered to present complex data in a digestible format, facilitating quick comprehension and analysis of the company's annual achievements and areas for improvement. Incorporating this infographic into your annual report presentations will not only streamline the communication of your corporation's yearly outcomes but also enable your audience to better grasp the strategic insights derived from this data. Whether you're reviewing revenue streams, expenditure, or performance benchmarks, this infographic will serve as a powerful tool to convey your message with clarity and precision.


7 slides
E-Learning Solutions Infographic
Elevate the e-learning experience with our E-Learning infographic. Featuring a harmonious blend of serene purple and crisp white, this infographic encapsulates the transformative world of digital learning. Tailored for educators, e-learning consultants, and instructional designers, it vividly illustrates the nuances of online education. Incorporated within are ingenious graphics, relevant icons, and dedicated image placeholders, all set to anchor your content and enhance comprehension. Regardless of your preferred platform – PowerPoint, Keynote, or Google Slides – this template is your tool to effectively convey the dynamism of e-learning.


7 slides
Six Sigma Training Infographic
Six Sigma is a data-driven methodology and approach for eliminating defects and improving processes in any business. This is a bold, transformative tool designed to equip individuals and organizations with the prowess of Six Sigma methodology. This template is the roadmap to excellence, paving the way for achieving remarkable improvements and efficiency. Fully customizable and compatible with Powerpoint, Keynote, and Google Slides. Unleash the power of Six Sigma through our Six Sigma Training Infographic. Let this be your guide to mastering the art of perfection, driving transformative change, and marching boldly towards operational excellence.


6 slides
Children's Smile Rating Infographic
Smile Rating refers to a method of evaluating customer satisfaction or user experience by measuring the positive emotional response elicited, often in the form of a smile. This infographic template is a visually engaging way to showcase customer satisfaction or feedback using smiley faces to represent different levels of happiness or contentment. This type of infographic is commonly used in customer service, user experience, and feedback analysis. This can provide valuable insights into emotional engagement and satisfaction. This infographic is designed to focus on providing services or products that are intended to create a positive and enjoyable experience.