


Features
- 7 Unique slides
- Fully editable and easy to edit in Microsoft Powerpoint, Keynote and Google Slides
- 16:9 widescreen layout
- Clean and professional designs
- Export to JPG, PDF or send by email


Do you have any questions?
Recommend


6 slides
RACI Matrix Chart Infographic
The RACI matrix is a project management tool used to define roles and responsibilities for tasks and activities within a project. This infographic template is designed to clarify the roles and responsibilities of team members in a project or process. RACI stands for Responsible, Accountable, Consulted, and Informed, and the matrix helps define each team member's involvement in different tasks or activities. This includes a step-by-step guide on how to create a RACI matrix, including identifying tasks, defining roles, and assigning responsibilities. This will simplify your audience's understanding of the RACI matrix chart.


7 slides
Agile Methodology Strategy Infographic
Master the dynamics of Agile with our agile methodology infographic. Set against a crisp white foundation, the design cascades with the professionalism of blue, the urgency of red, the innovation of orange, and the growth of green. Equipped with methodical infographics, pertinent icons, and versatile image placeholders, this template provides a comprehensive depiction of the Agile process, from sprint planning to retrospectives. Tailored impeccably for Powerpoint, Keynote, or Google Slides. A must-have for project managers, scrum masters, product owners, or any Agile enthusiasts aiming to educate, implement, or iterate the Agile way.


7 slides
Prime Numbers Infographic Presentation
A numbers infographic is a visual representation of information using graphical elements such as charts, graphs, and diagrams. A well-crafted template is a powerful tool for conveying insights into your data. Numbers have the ability to transform your data into useful insights that can help you make an informed decision. This numbers infographics is made with different type of charts and diagrams, which will help you establish a relation between numbers and words. This fully editable template is designed to present numbers, data and statistics in a creative way unique to your brand.


7 slides
Project Status Summary Infographic
A Project Status Summary is an overview or report that provides key information about the progress, performance, and current state of a project. This infographic template is a visual tool designed to provide a quick and comprehensive overview of your project's progress, empowering you to track milestones, anticipate roadblocks, and ensure project success. This template is ideal for project management and communication, allowing stakeholders to quickly grasp the project's status without delving into detailed project documents. The goal of this Project Status is to present a snapshot of your project's progress in an easily understandable format.


12 slides
Startup Investor Pitch Deck Presentation
Craft a compelling pitch with this Startup Investor Pitch Deck template. Featuring a structured layout, it helps showcase your startup’s vision, market potential, and financial projections. Designed for clarity and engagement, this template ensures a persuasive investor presentation. Fully compatible with PowerPoint, Keynote, and Google Slides for seamless customization.


5 slides
Advances in Technology Infographics
Advances in Technology have transformed the world in a number of ways and have had a significant impact on society. These Infographic templates are dynamic and visually appealing tools for showcasing the latest advancements in technology across various fields. Whether you're discussing breakthroughs in electric cars, robotics, biotechnology, or any other cutting-edge technology, this template has you covered. With its modern and sleek design, this template captures the essence of technological innovation. It features a range of customizable design elements enabling you to present data-driven information in a visually engaging way.


8 slides
Startups Pitch Deck Presentation
Bring your idea to life with a bold, energetic layout designed to showcase vision, traction, and future potential. This presentation helps you communicate your business model, strategy, and key insights with clarity and confidence. Clean visuals and structured sections keep your message strong and compelling. Fully compatible with PowerPoint, Keynote, and Google Slides.


7 slides
Solutions to Problems Infographic
These slides are designed to outline and explore solutions to identified problems in a clear and effective manner. Each slide uses a clean layout with a consistent color theme that enhances readability and focus. They effectively combine text and graphical elements to showcase problem-solving strategies, making the slides ideal for business presentations or strategic meetings. The inclusion of icons and diagrams aids in visualizing the problem-solving process, and the structured design ensures that the information is presented in a logical sequence. This approach not only aids in communicating the solutions effectively but also engages the audience by making complex information easier to understand. These templates can be adapted for various industries and scenarios, where clear communication of problem-solving steps is crucial. They are especially useful for team discussions, stakeholder presentations, and strategic planning sessions.


6 slides
IT Architecture Enterprise Infographics
Gain insights into Enterprise IT Architecture with our customizable infographic template. This template is fully compatible with popular presentation software like PowerPoint, Keynote, and Google Slides, allowing you to easily customize it to illustrate and communicate various aspects of enterprise IT architecture. The Enterprise IT Architecture infographic template offers a visually engaging platform to explore and explain the architectural components, frameworks, and strategies used in large organizations. Whether you're an IT professional, business leader, or simply interested in enterprise technology, this template provides a user-friendly canvas to create informative presentations and educational materials. Enhance your knowledge of Enterprise IT Architecture with this SEO-optimized infographic template, thoughtfully designed for clarity and ease of use. Customize it to highlight key principles, architectural layers, integration strategies, and best practices, ensuring that your audience gains a comprehensive understanding of this critical field. Start crafting your personalized infographic today to delve into the world of Enterprise IT Architecture.


7 slides
Agile Circle Methodology Infographic Presentation
Agile Methodology is a flexible and adaptive approach to project management that values customer satisfaction, teamwork, and continuous improvement. Our Agile Methodology template is perfect for academic or work presentation projects. This template is super easy to use and works with Powerpoint, Keynote, and Google Slides. It has a minimal design with, bright colors that will keep your audience engaged. With this template, you can learn all about Agile Methodology in a way that is visually appealing. Use this template to see how you and your team work more efficiently and effectively.
4 slides
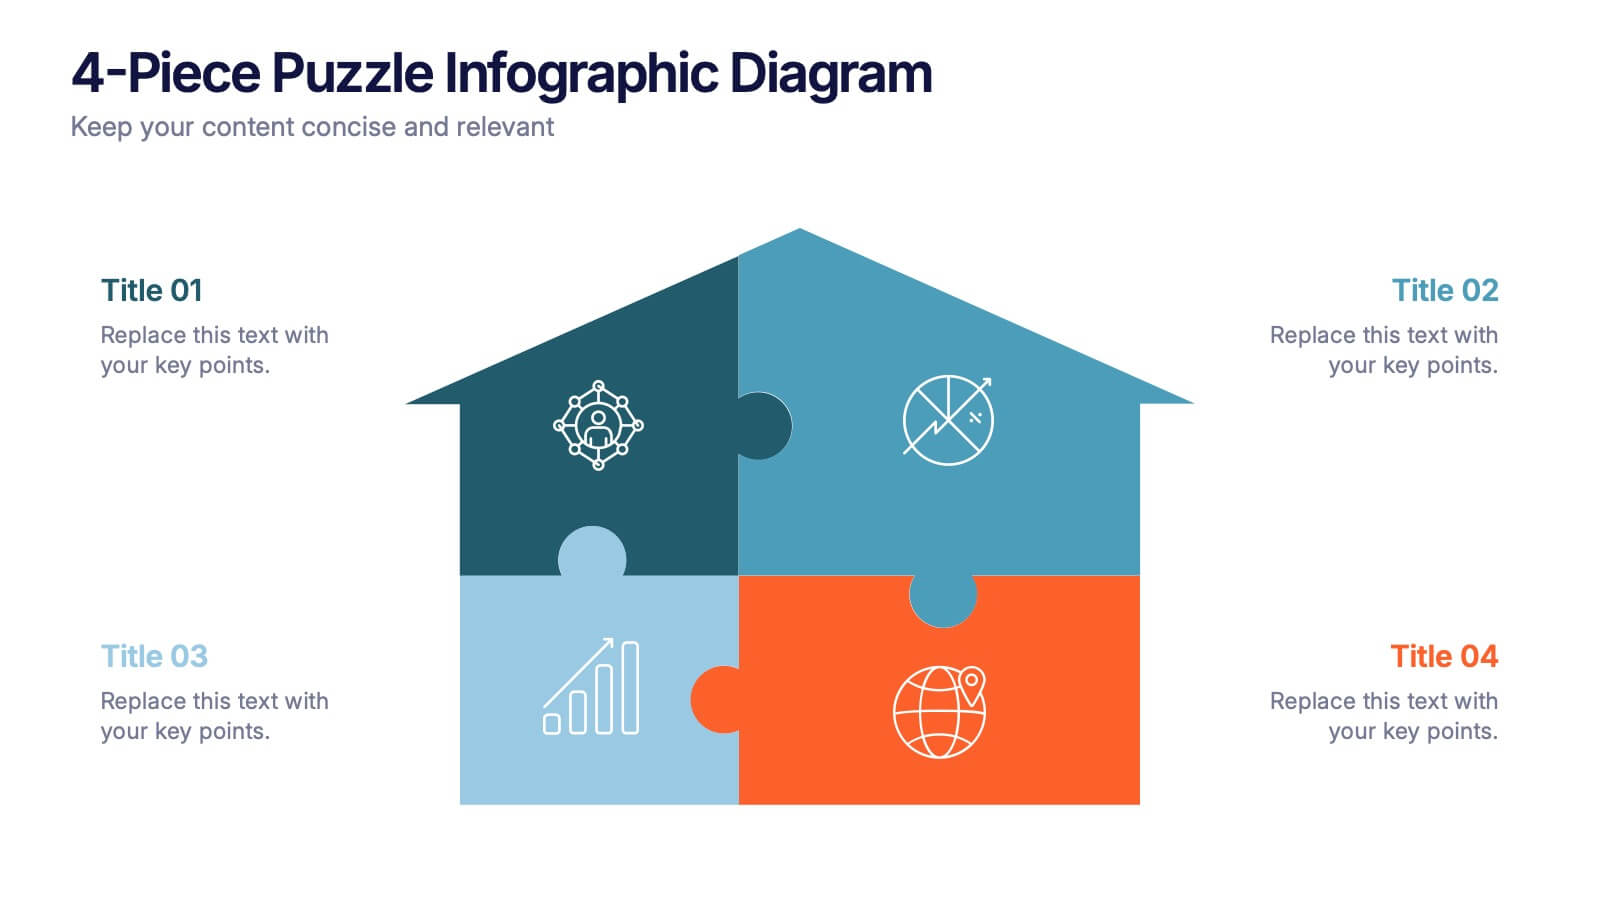
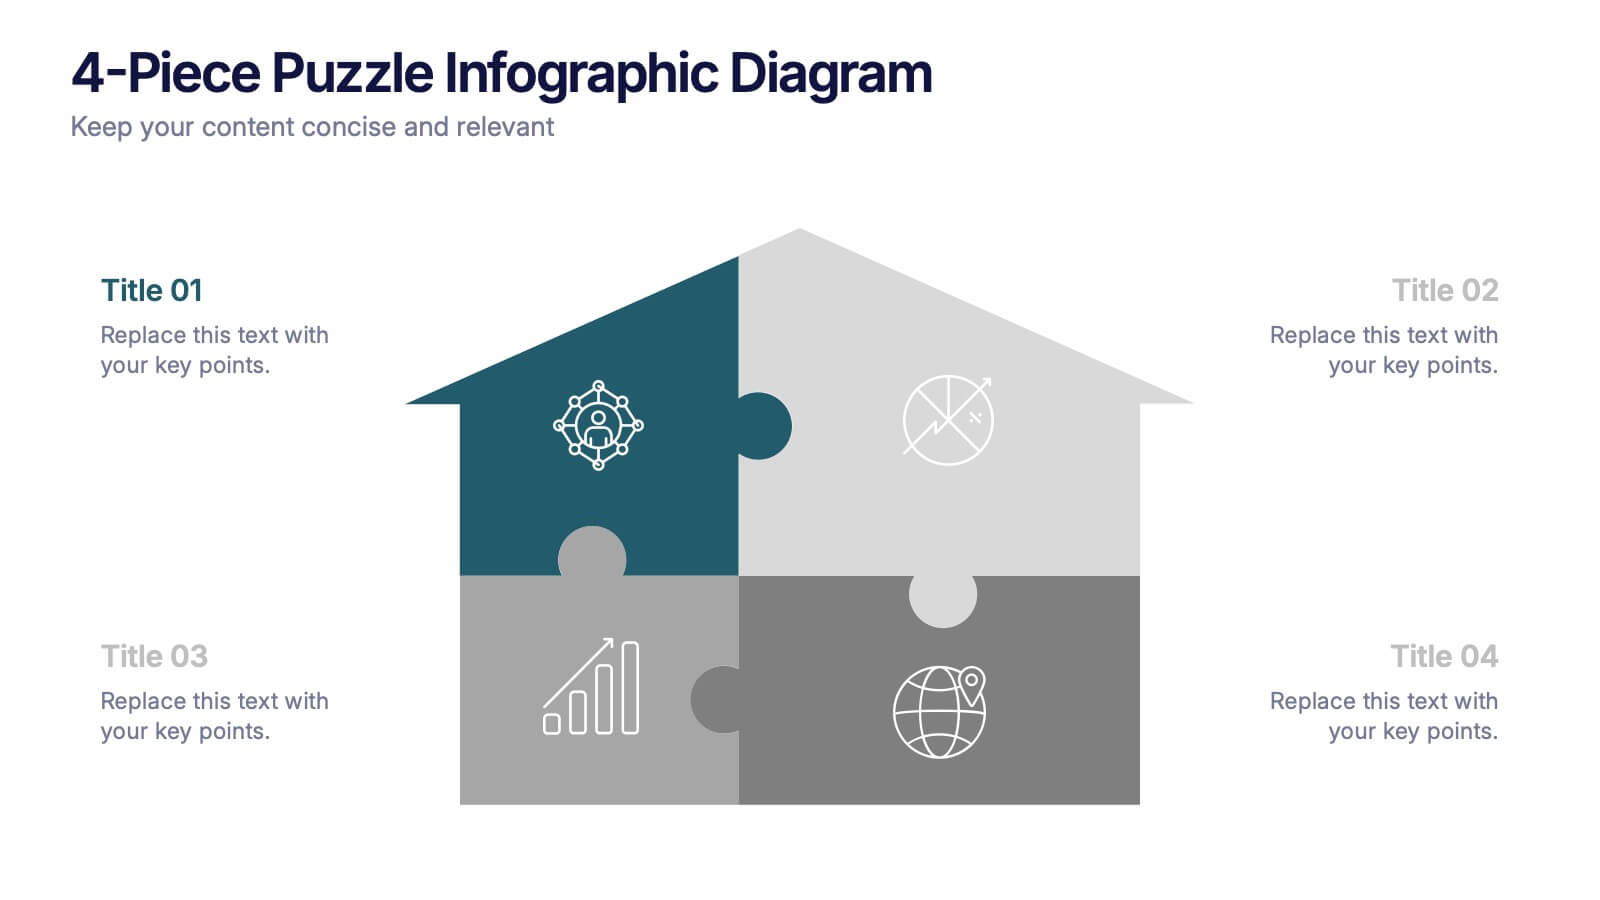
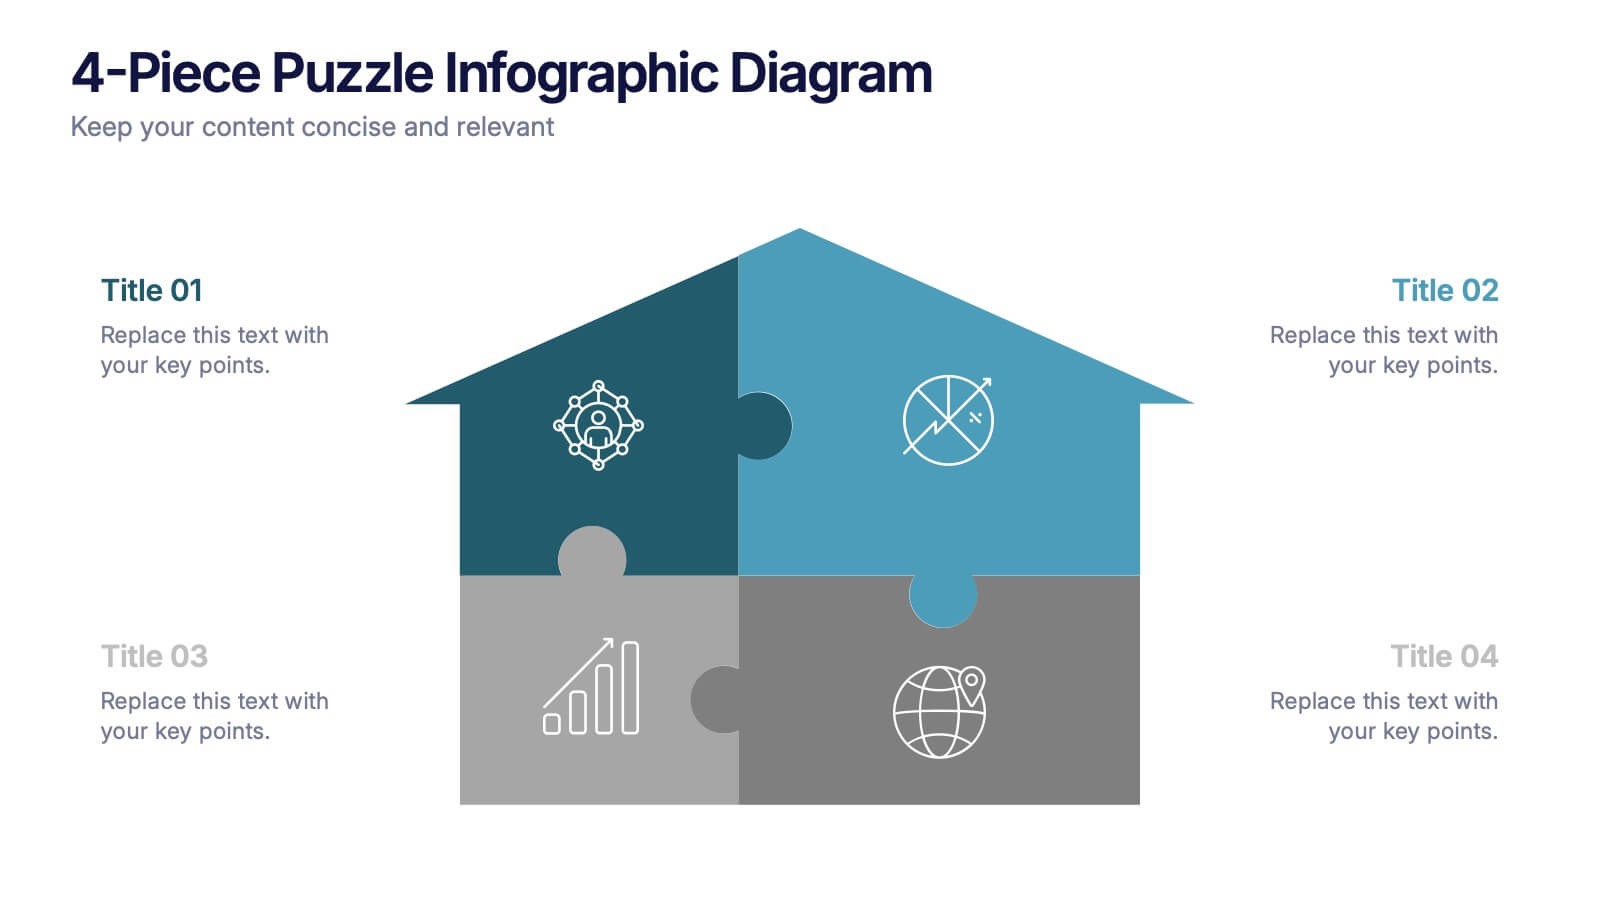
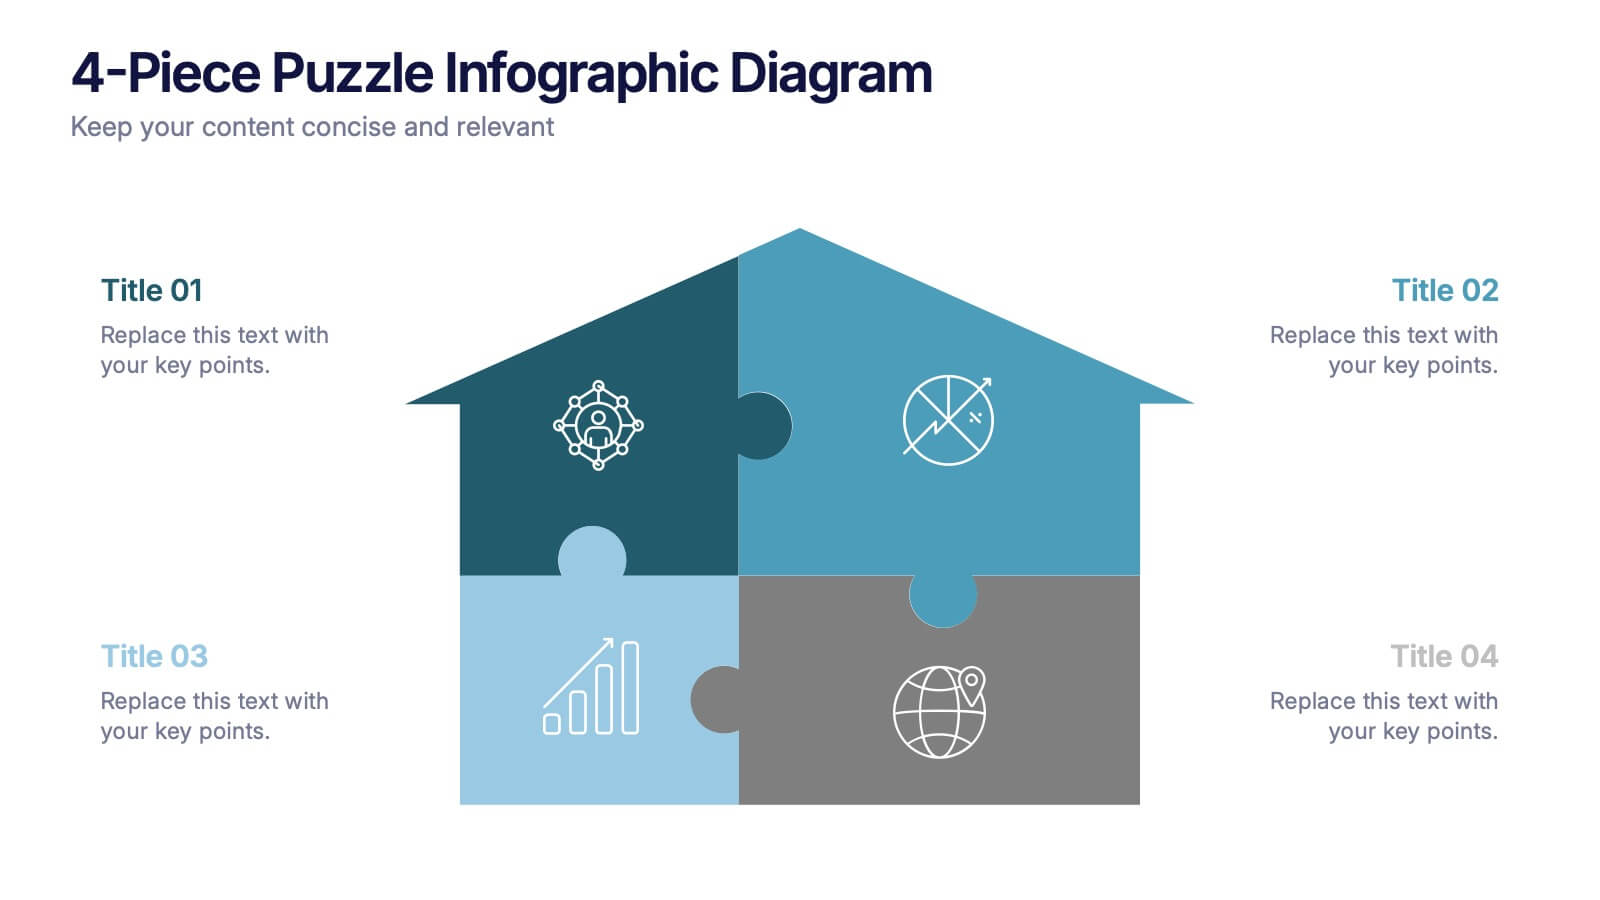
4-Piece Puzzle Infographic Diagram Presentation
Bring clarity and impact to your message with a visual layout that snaps big ideas together like a puzzle. This presentation helps you break complex concepts into four connected sections, making explanations easier and more engaging for any audience. Ideal for planning, insights, or strategy sessions. Fully compatible with PowerPoint, Keynote, and Google Slides.


12 slides
Compliance and Policy Management Presentation
Visualize your compliance ecosystem with the Compliance and Policy Management Presentation. Designed around a planetary orbit concept, this slide maps core policies at the center with surrounding regulations and enforcement layers. Each orbit can represent levels of governance, department roles, or regulatory zones—making it ideal for risk teams, auditors, and legal advisors. Fully customizable in PowerPoint, Keynote, and Google Slides for seamless use.


6 slides
Project Timeline and Weekly Schedule Presentation
Plan smarter with the Project Timeline and Weekly Schedule Presentation—a clear, structured template for tracking tasks week by week across multiple projects. Ideal for managers, teams, or freelancers needing a bird’s-eye view of workload distribution. Fully editable for PowerPoint, Keynote, and Google Slides.


6 slides
Business Performance Metric Presentation
Give your metrics a breath of fresh air with this modern, nature-inspired design. Perfect for presenting business KPIs, performance tracking, or growth data, this infographic layout uses vibrant pinwheel visuals to guide the viewer through key stats and insights. Fully compatible with PowerPoint, Keynote, and Google Slides for easy editing.


3 slides
Sustainabilitiy Management Plan Framework Presentation
Turn your sustainability goals into a clear, actionable plan with this dynamic presentation design. Ideal for showcasing environmental strategies, performance metrics, and corporate responsibility initiatives, it combines clarity with visual balance to engage audiences. Fully editable and compatible with PowerPoint, Keynote, and Google Slides for seamless customization and delivery.


6 slides
Connection and Relationship Strategy Presentation
Present your workflow or relationship journey with clarity using the Connection and Relationship Strategy Presentation. This linear hexagon path is ideal for visualizing sequences, strategies, or stages in professional relationships. Fully customizable for PowerPoint, Keynote, and Google Slides—perfect for consultants, marketers, or project managers.


6 slides
Market Sizing with TAM SAM SOM Strategy Presentation
Clearly define your market opportunity using the Market Sizing with TAM SAM SOM Strategy Presentation. This template breaks down Total Addressable Market, Serviceable Available Market, and Serviceable Obtainable Market with a visual bullseye format that’s intuitive and persuasive. Easily editable in PowerPoint, Keynote, and Google Slides.