


Features
- 5 Unique slides
- Fully editable and easy to edit in Microsoft Powerpoint, Keynote and Google Slides
- 16:9 widescreen layout
- Clean and professional designs
- Export to JPG, PDF or send by email


Do you have any questions?
Recommend


27 slides
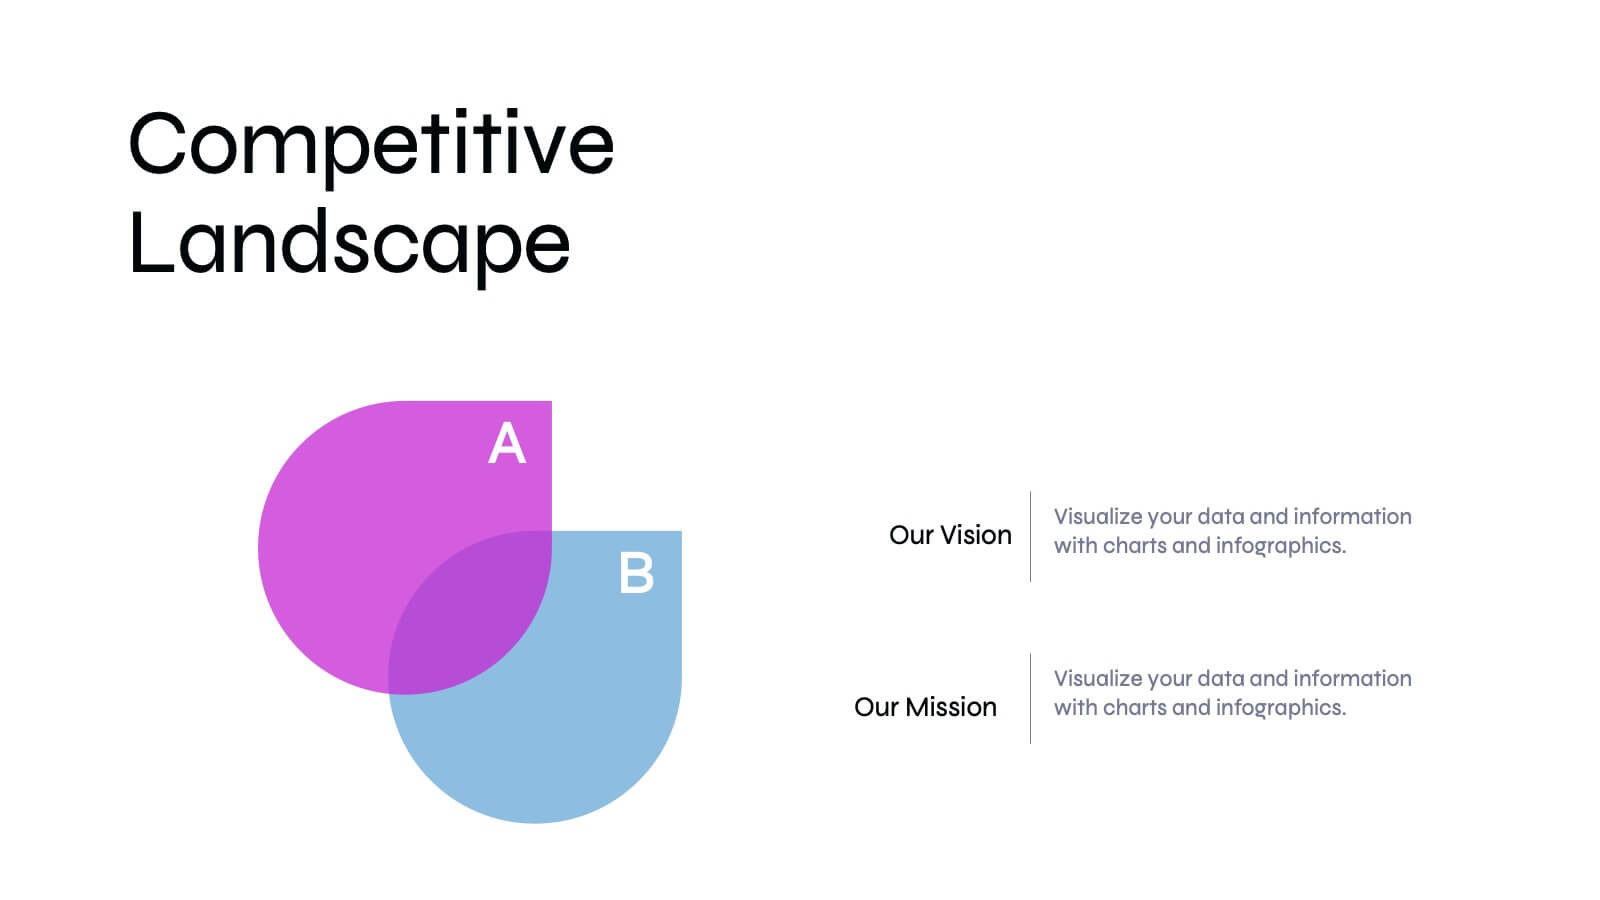
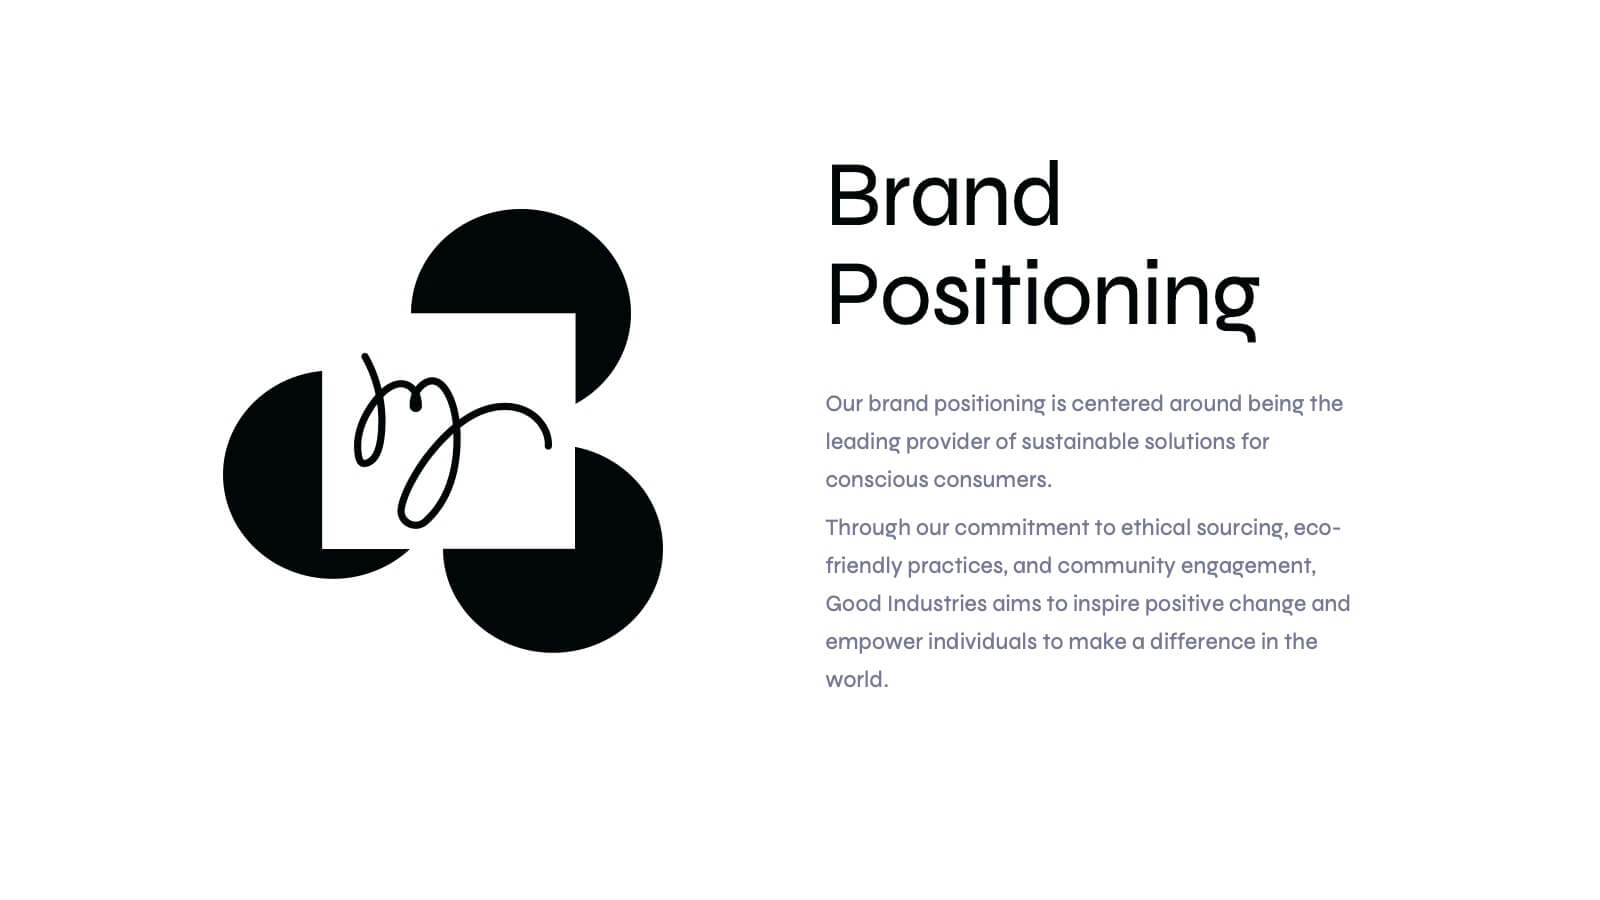
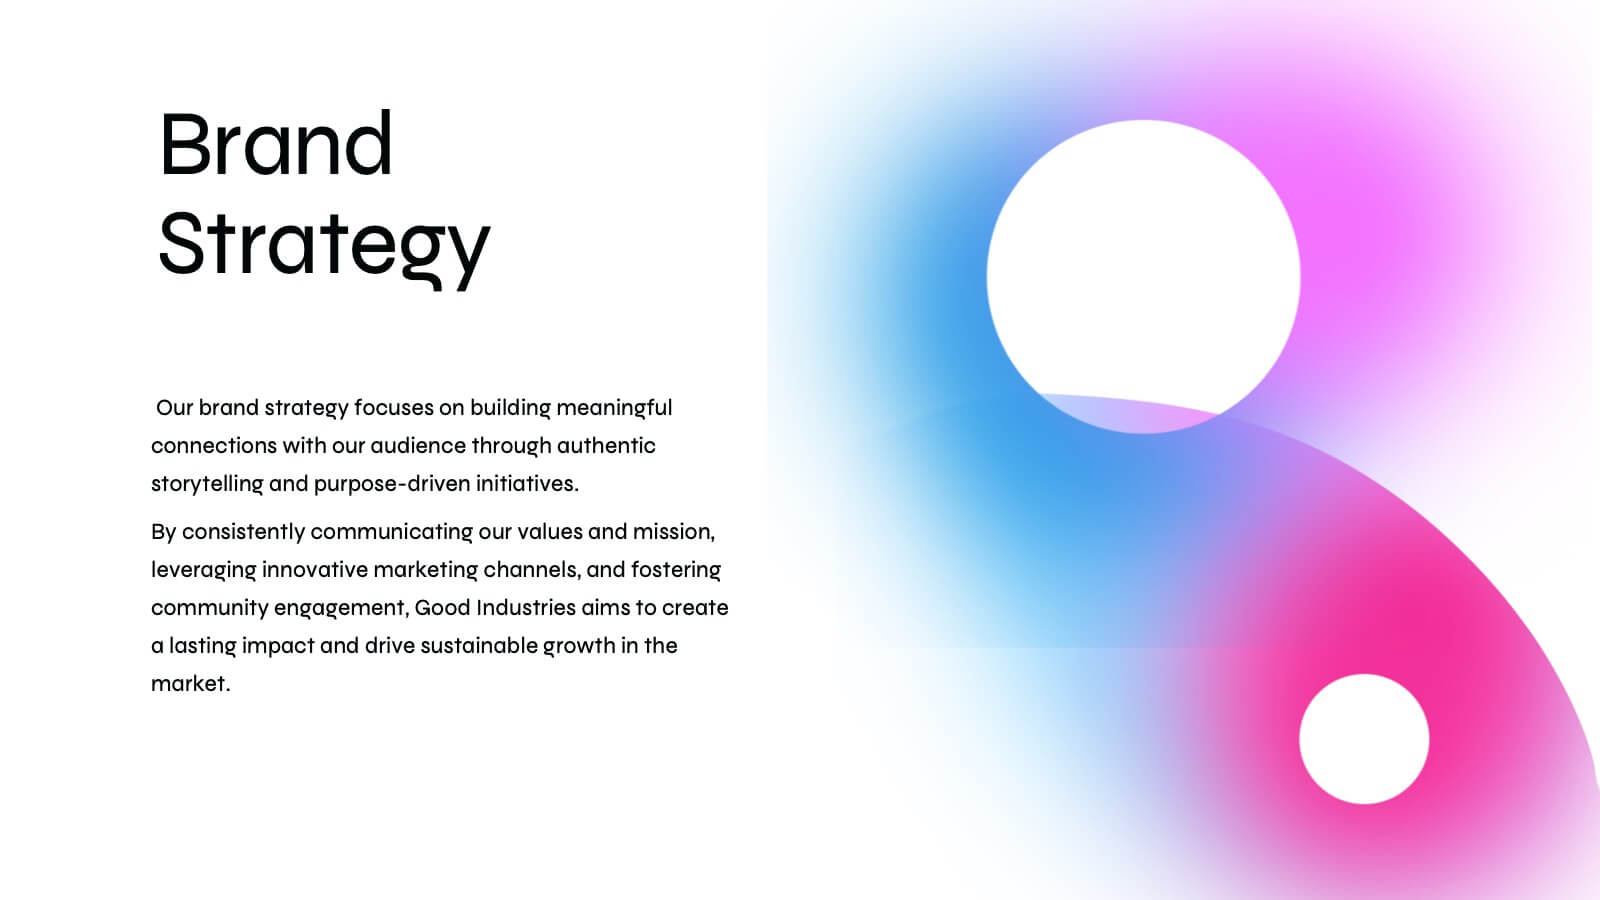
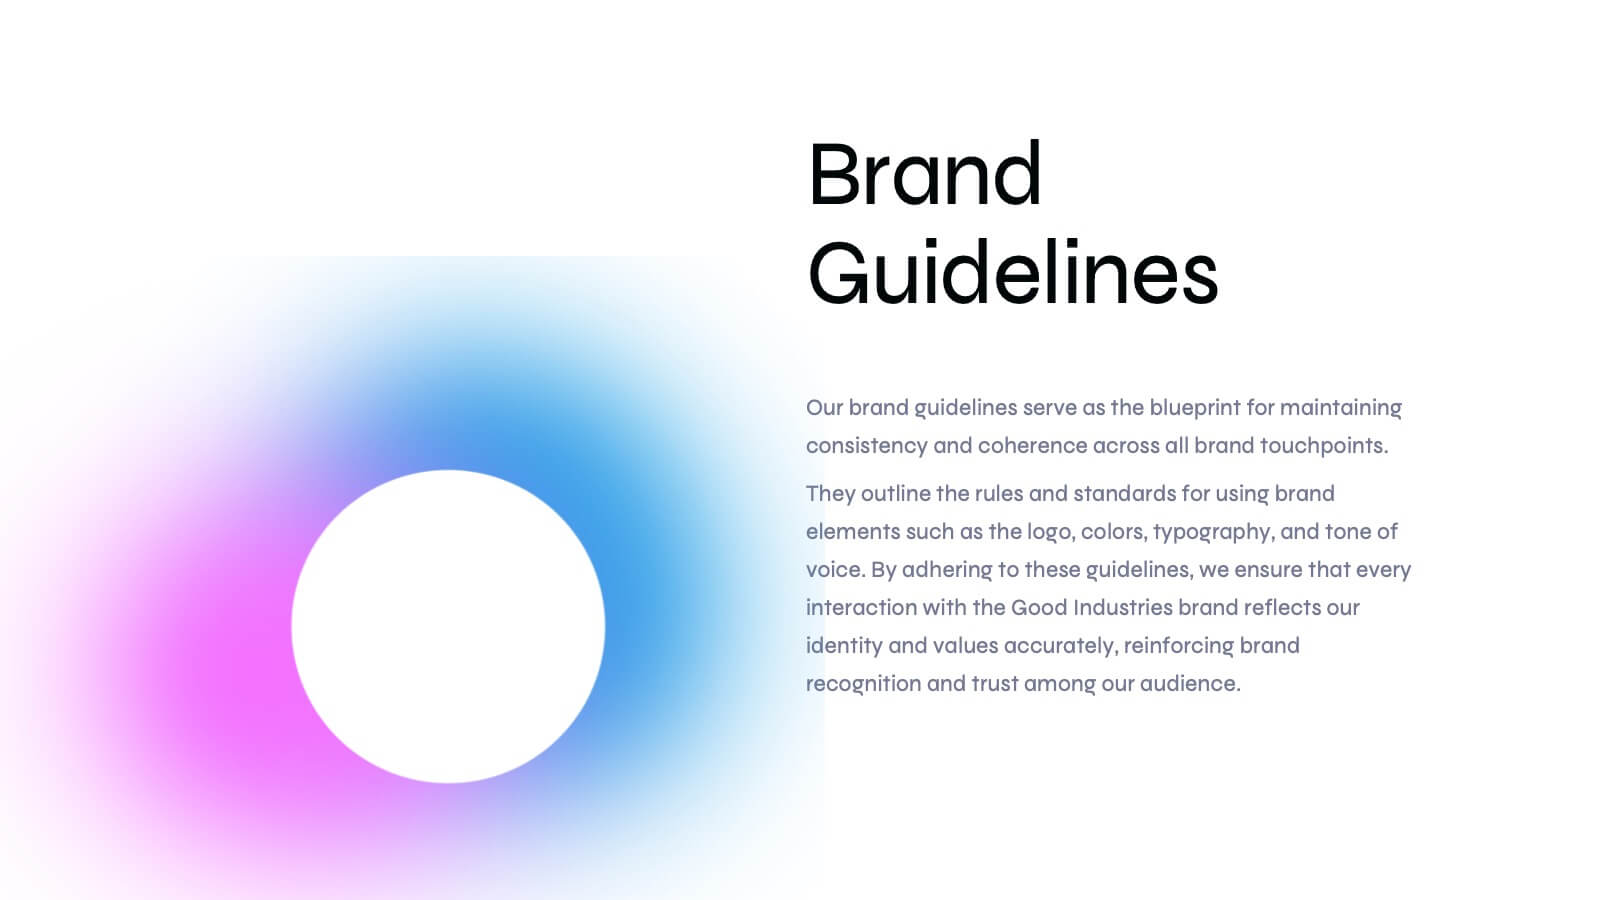
Basilisk Brand Guidelines Proposal Presentation
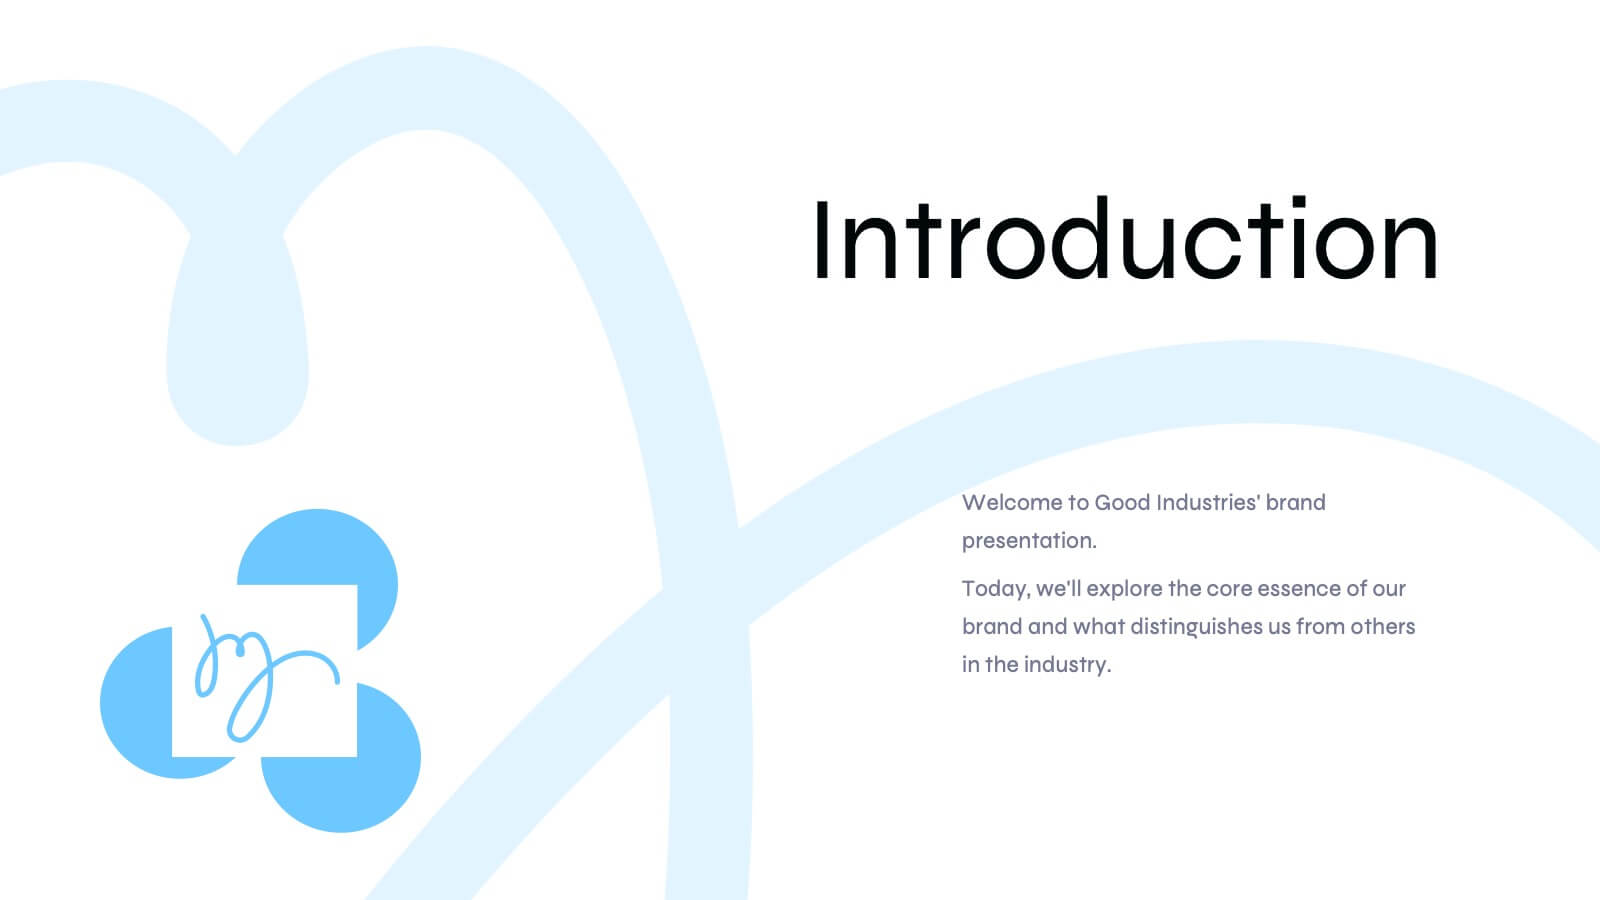
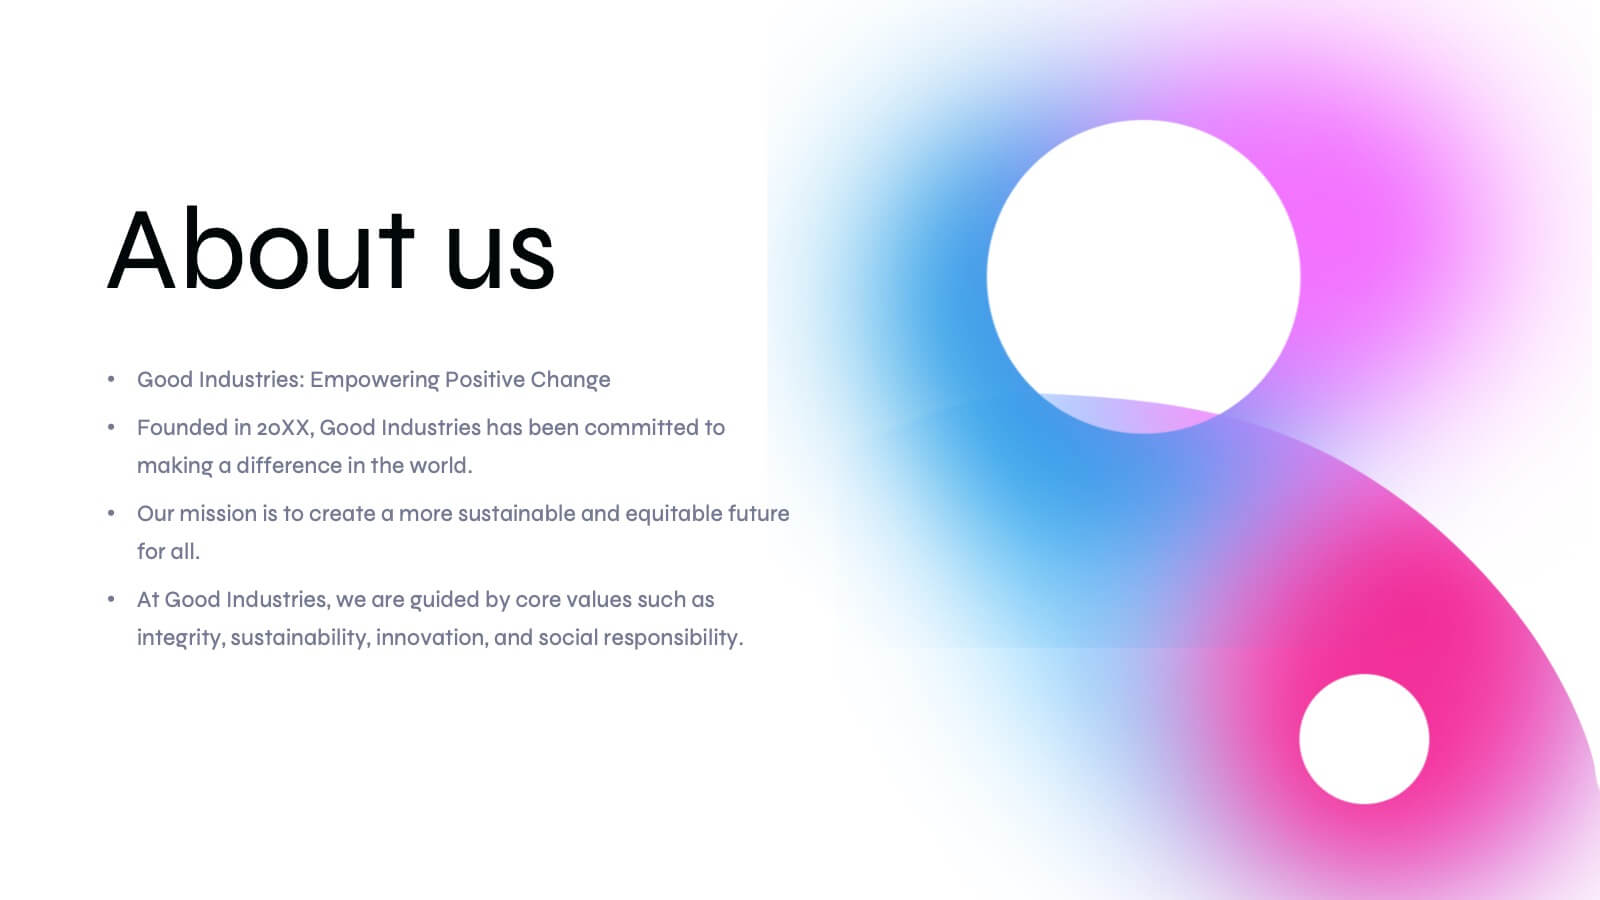
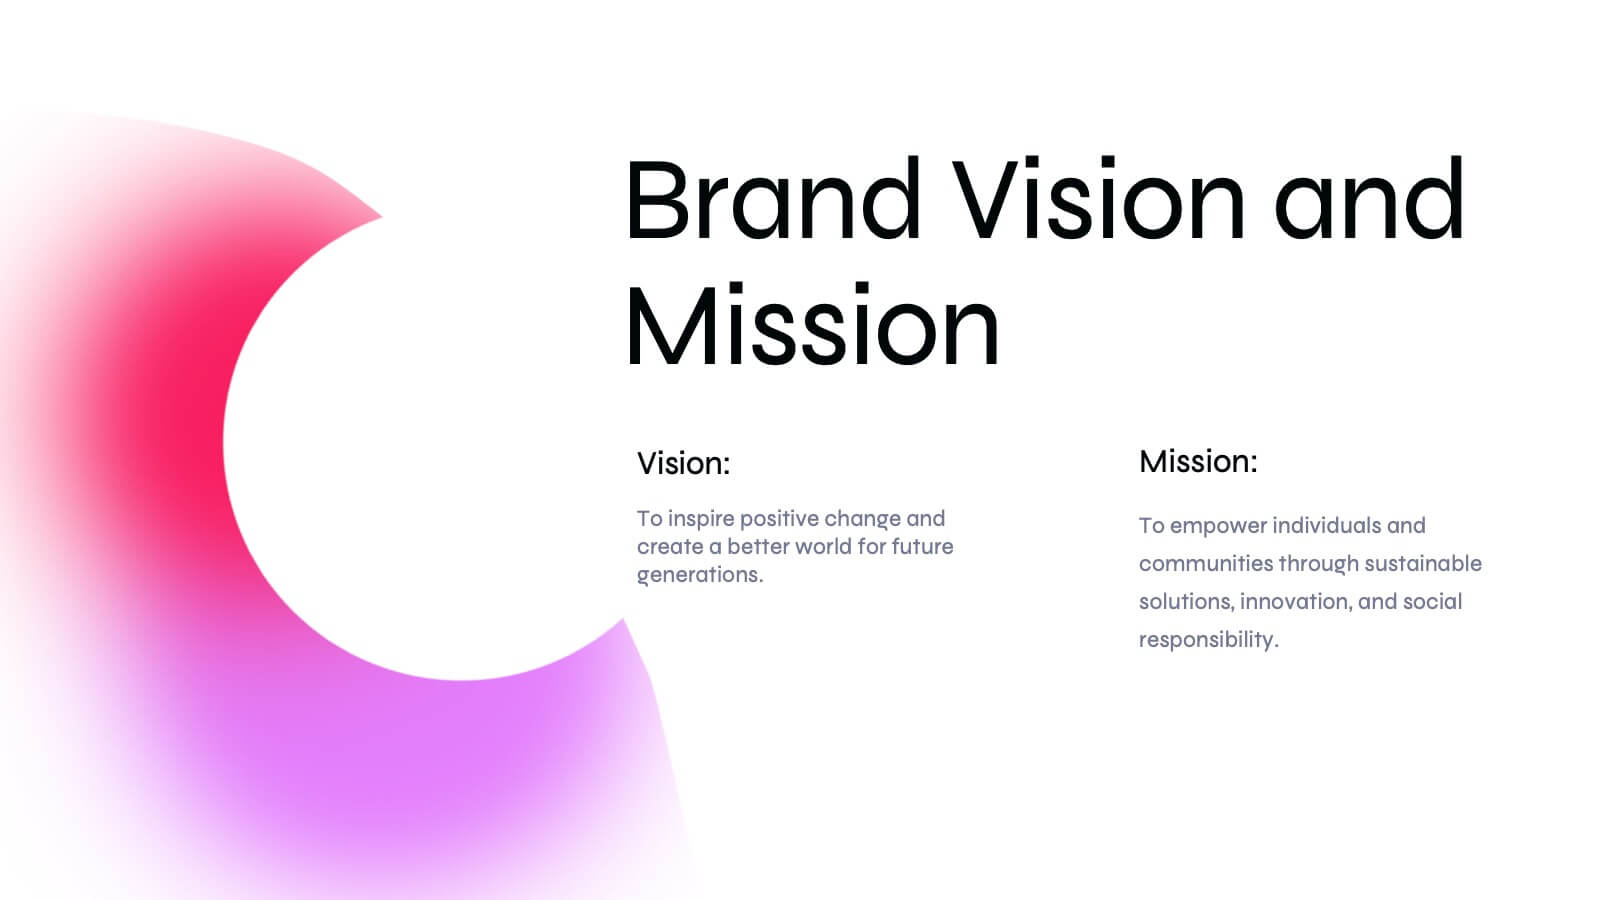
Present your brand strategy effectively with this modern brand guidelines proposal template! It includes sections for brand vision, values, identity, and market analysis. Fully customizable and compatible with PowerPoint, Keynote, and Google Slides, it’s perfect for showcasing your brand's identity and ensuring consistency across all platforms.


4 slides
Device Mockup Display Slide Presentation
Showcase your digital products with this device mockup slide. Ideal for highlighting landing pages, dashboards, or app interfaces, the layout includes clean typography and vibrant shapes for visual balance. Fully editable in PowerPoint, Keynote, and Google Slides—customize text, colors, and images to fit your tech brand or presentation style.


22 slides
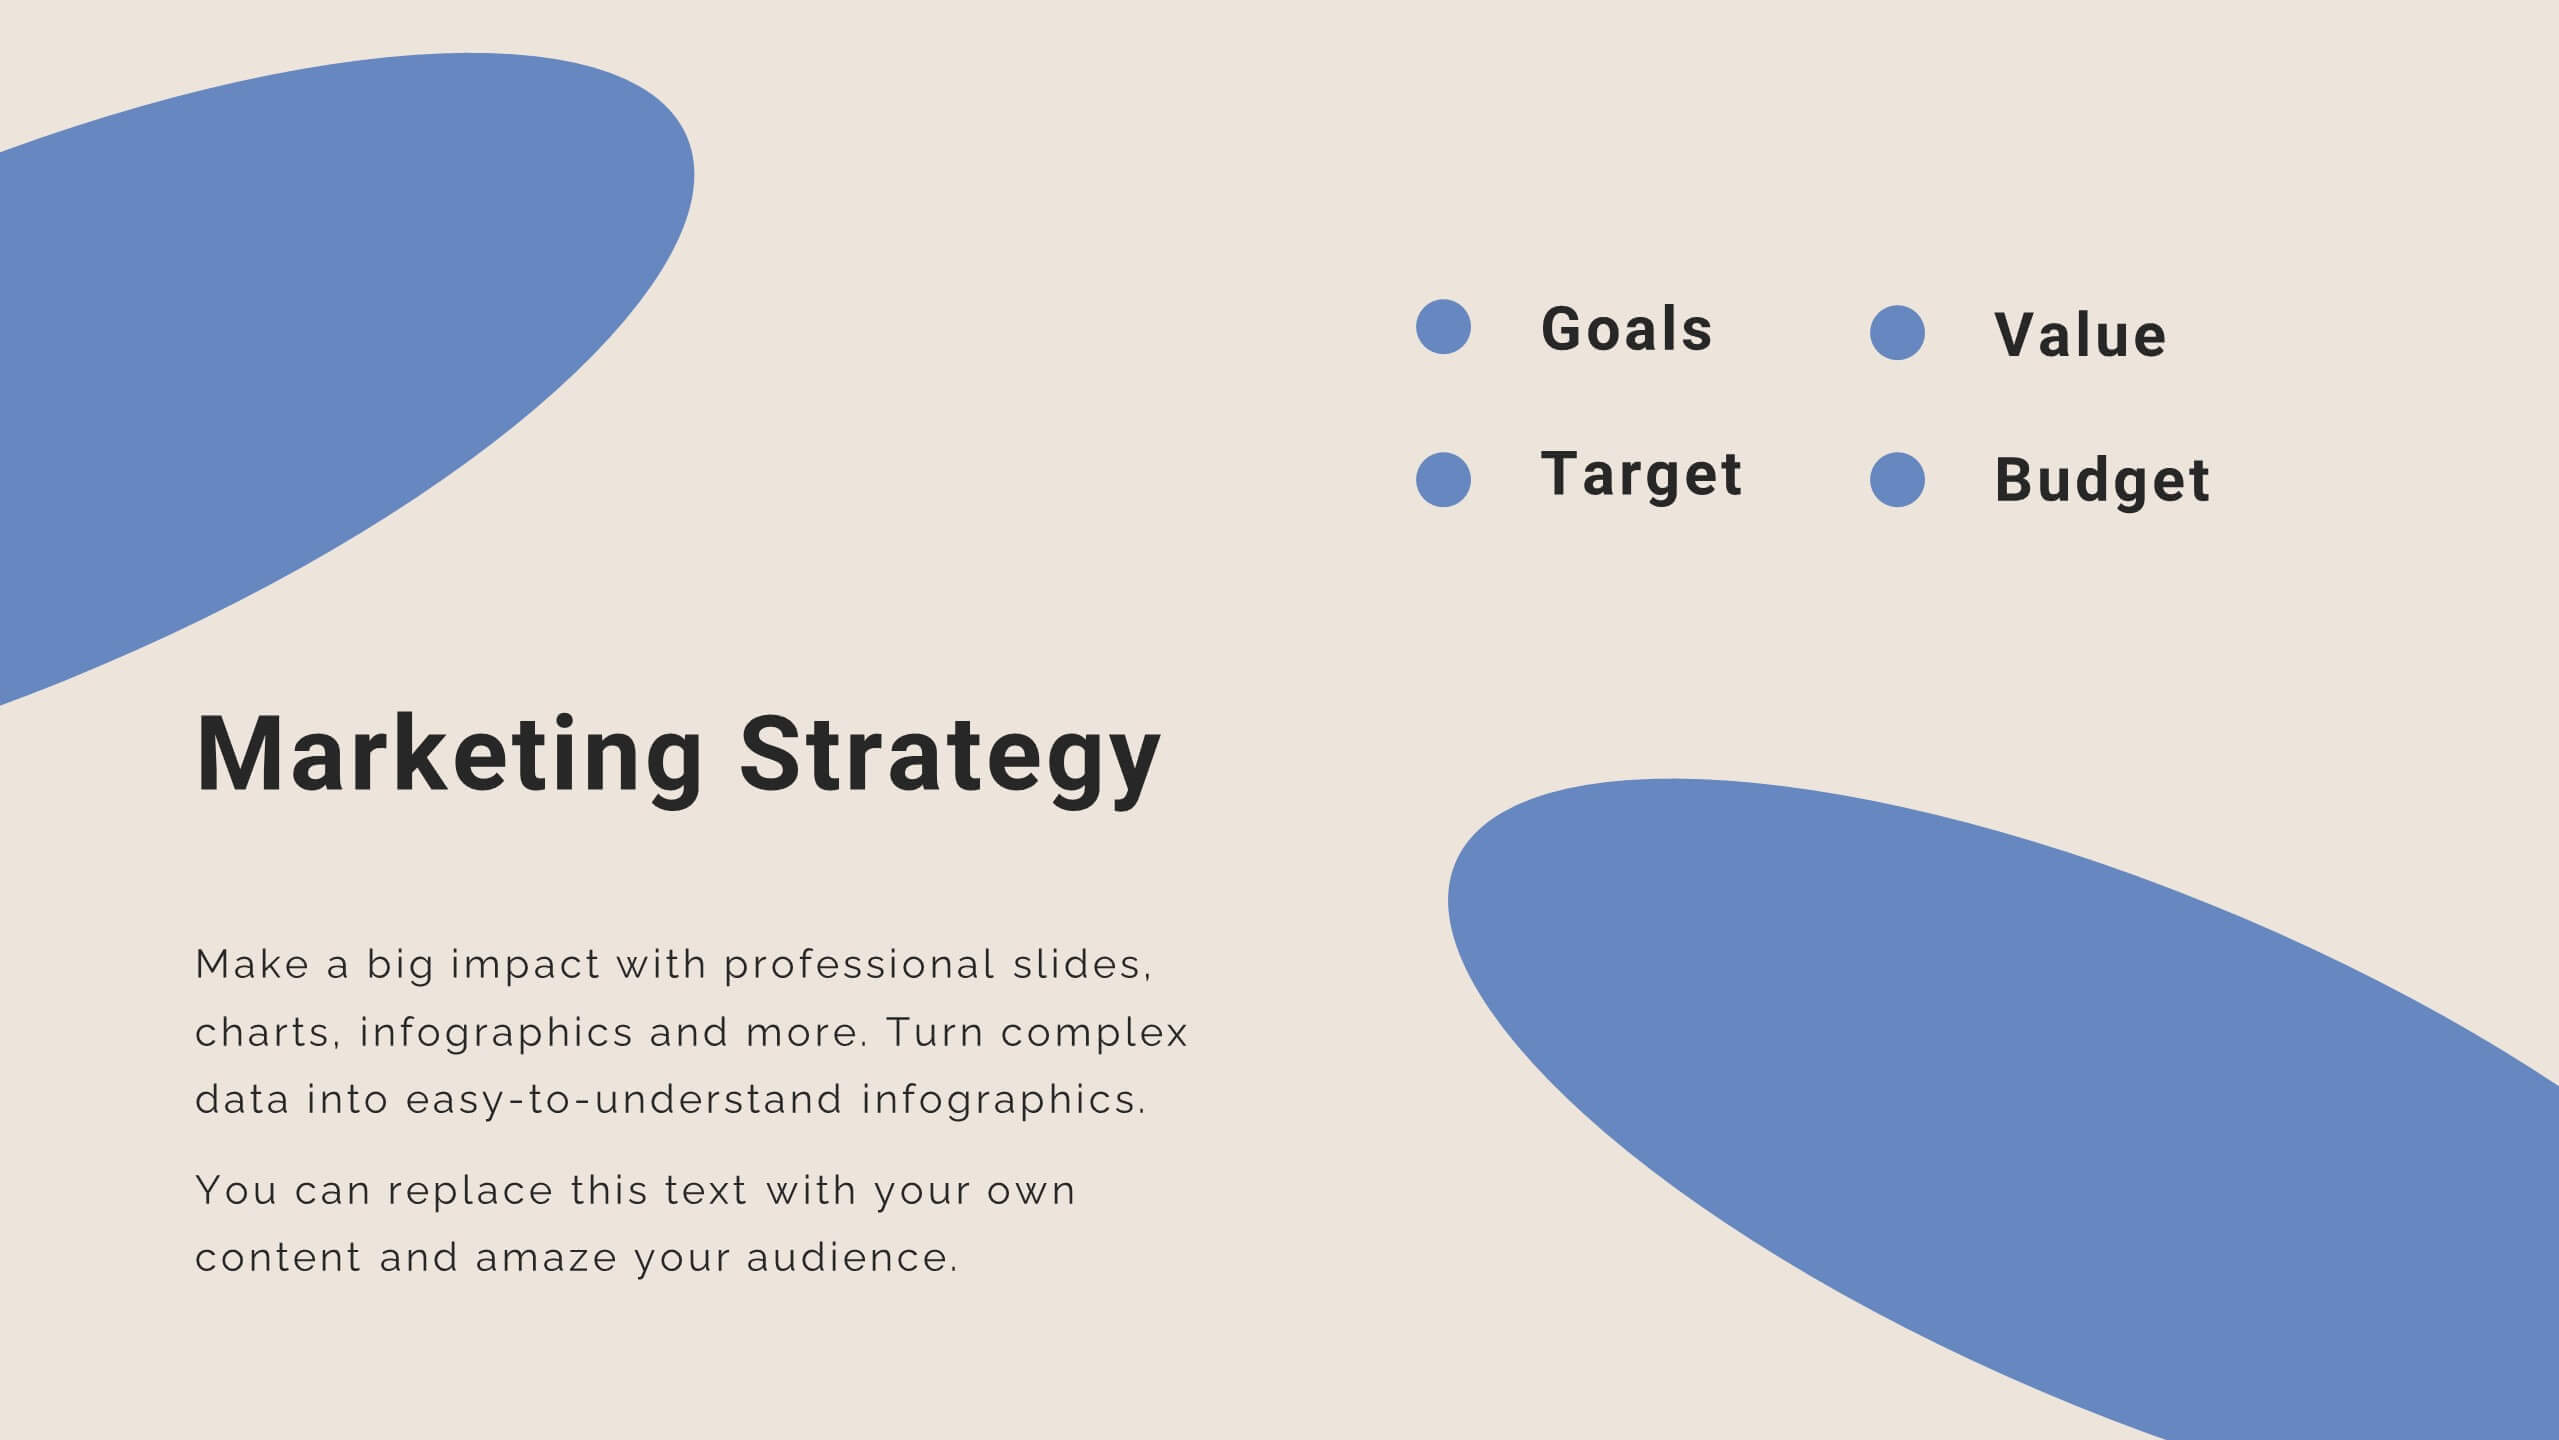
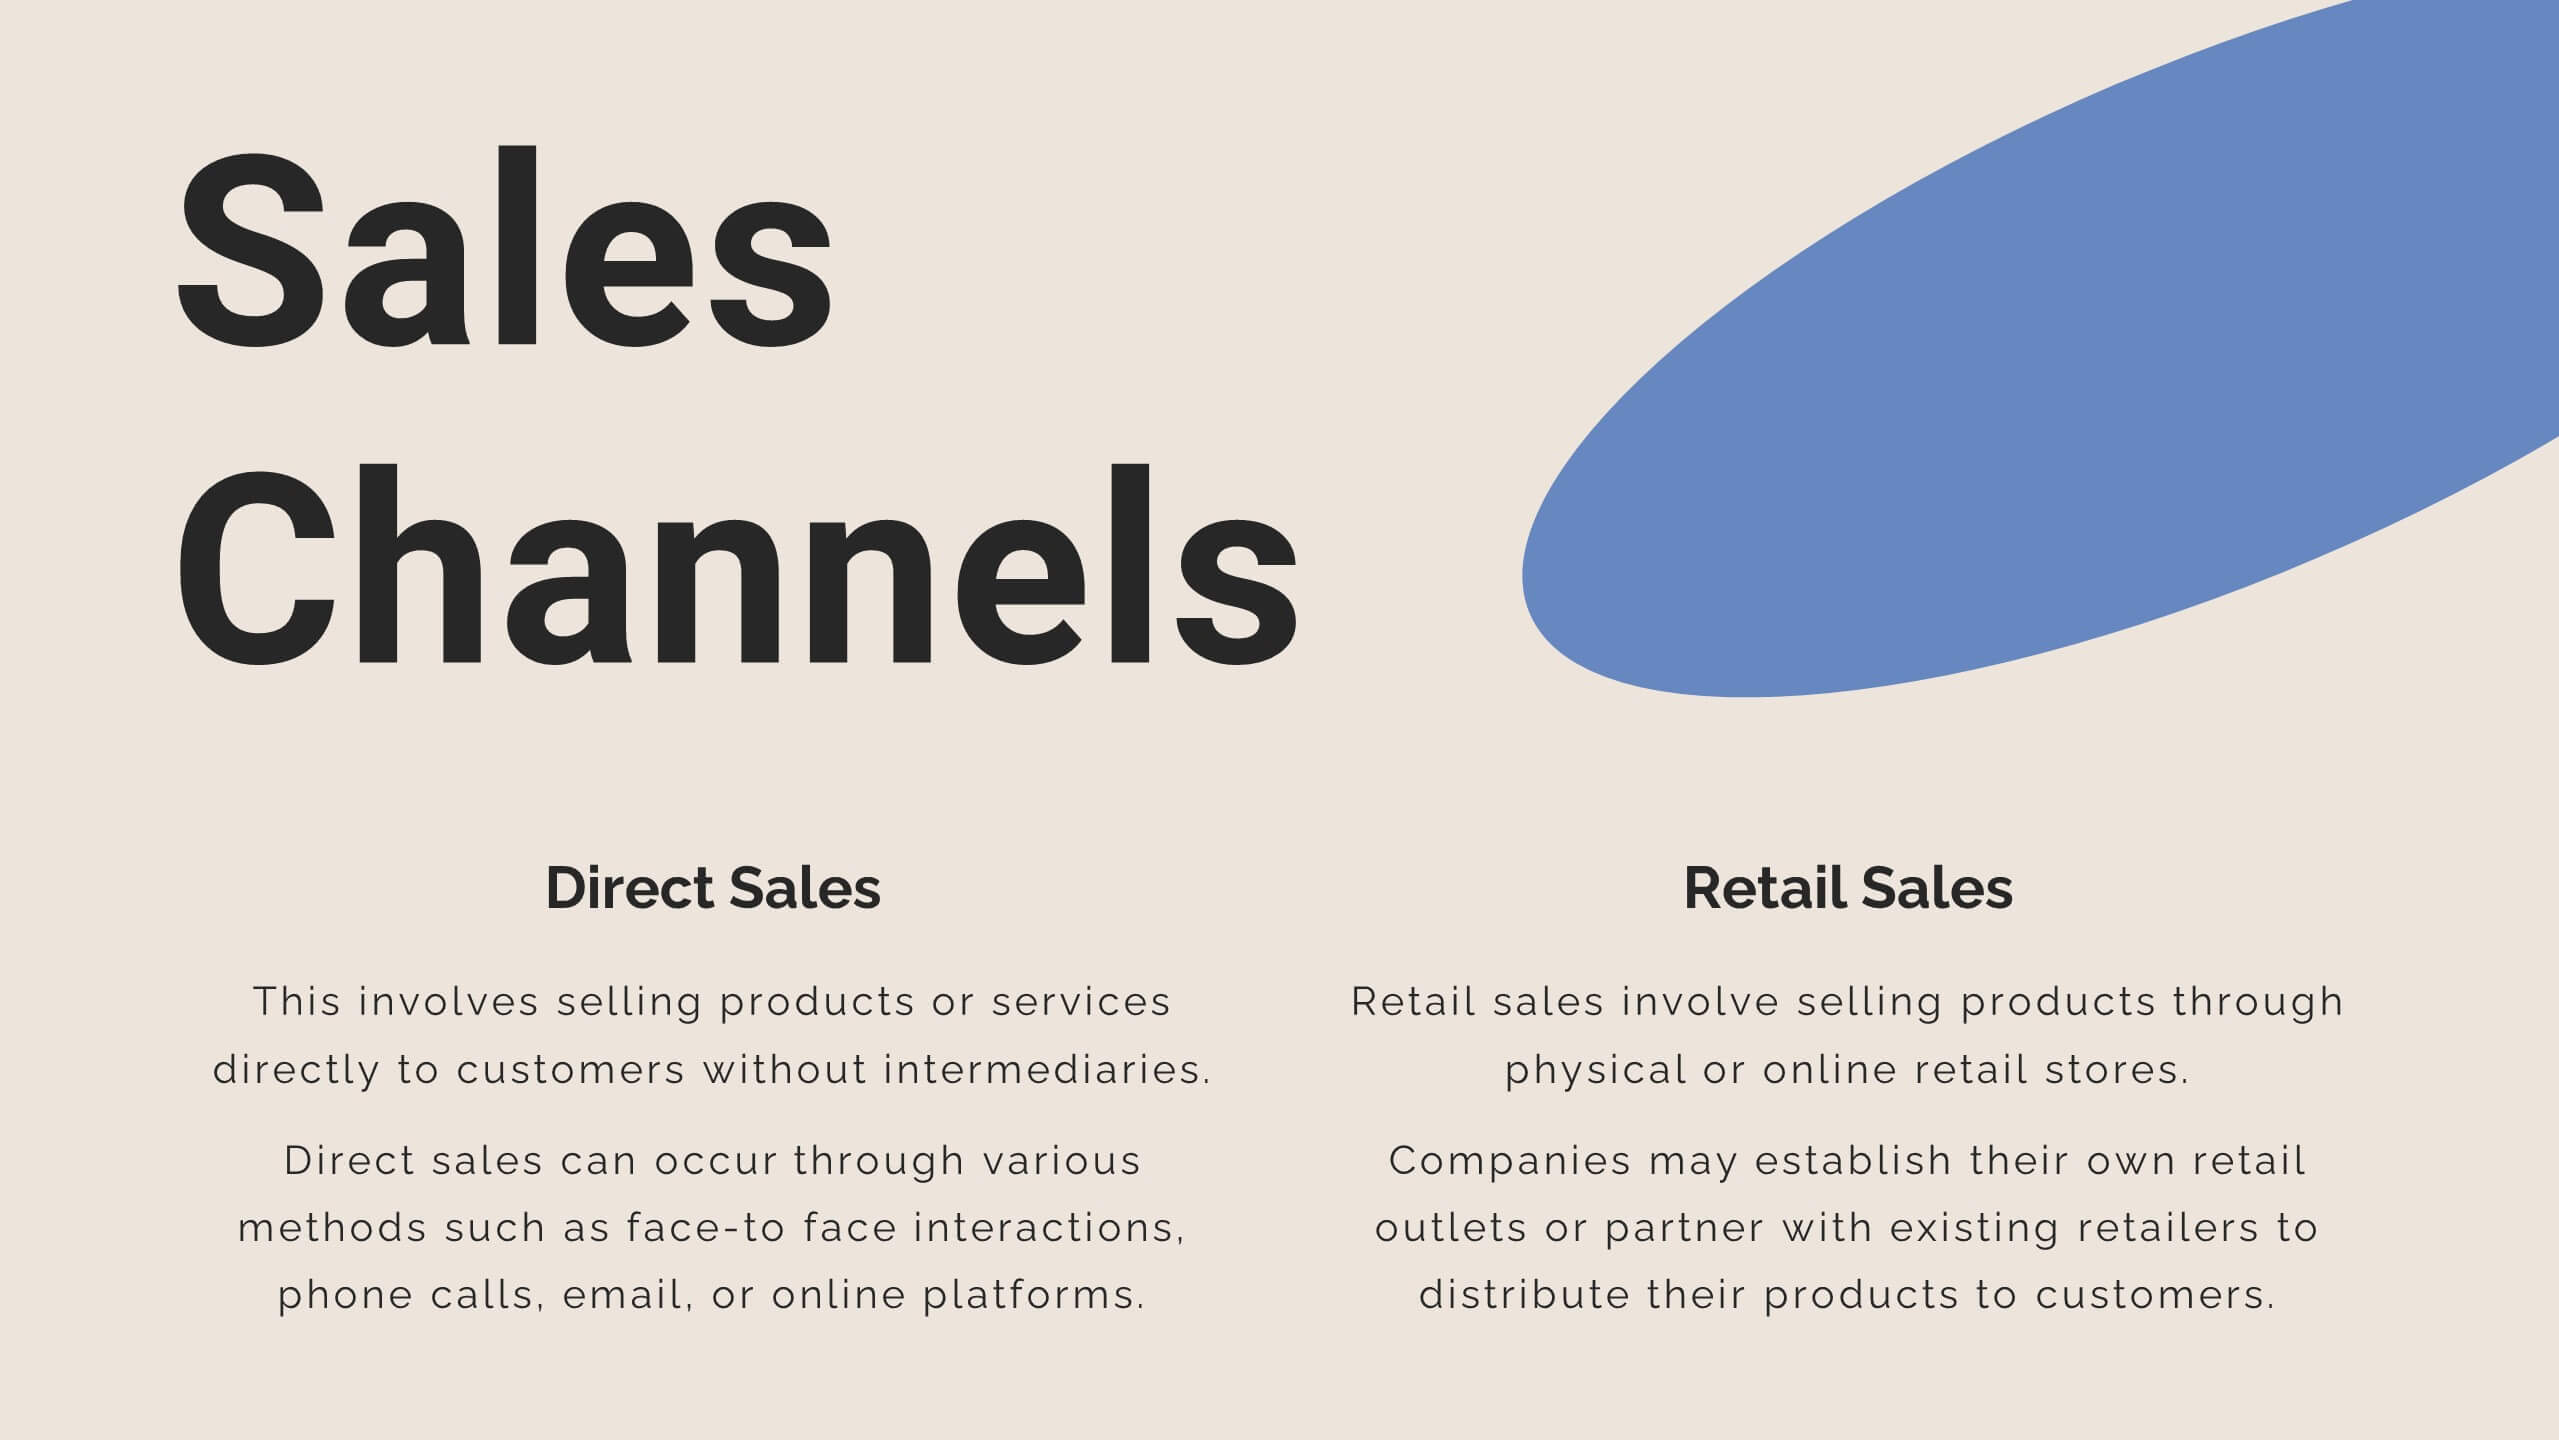
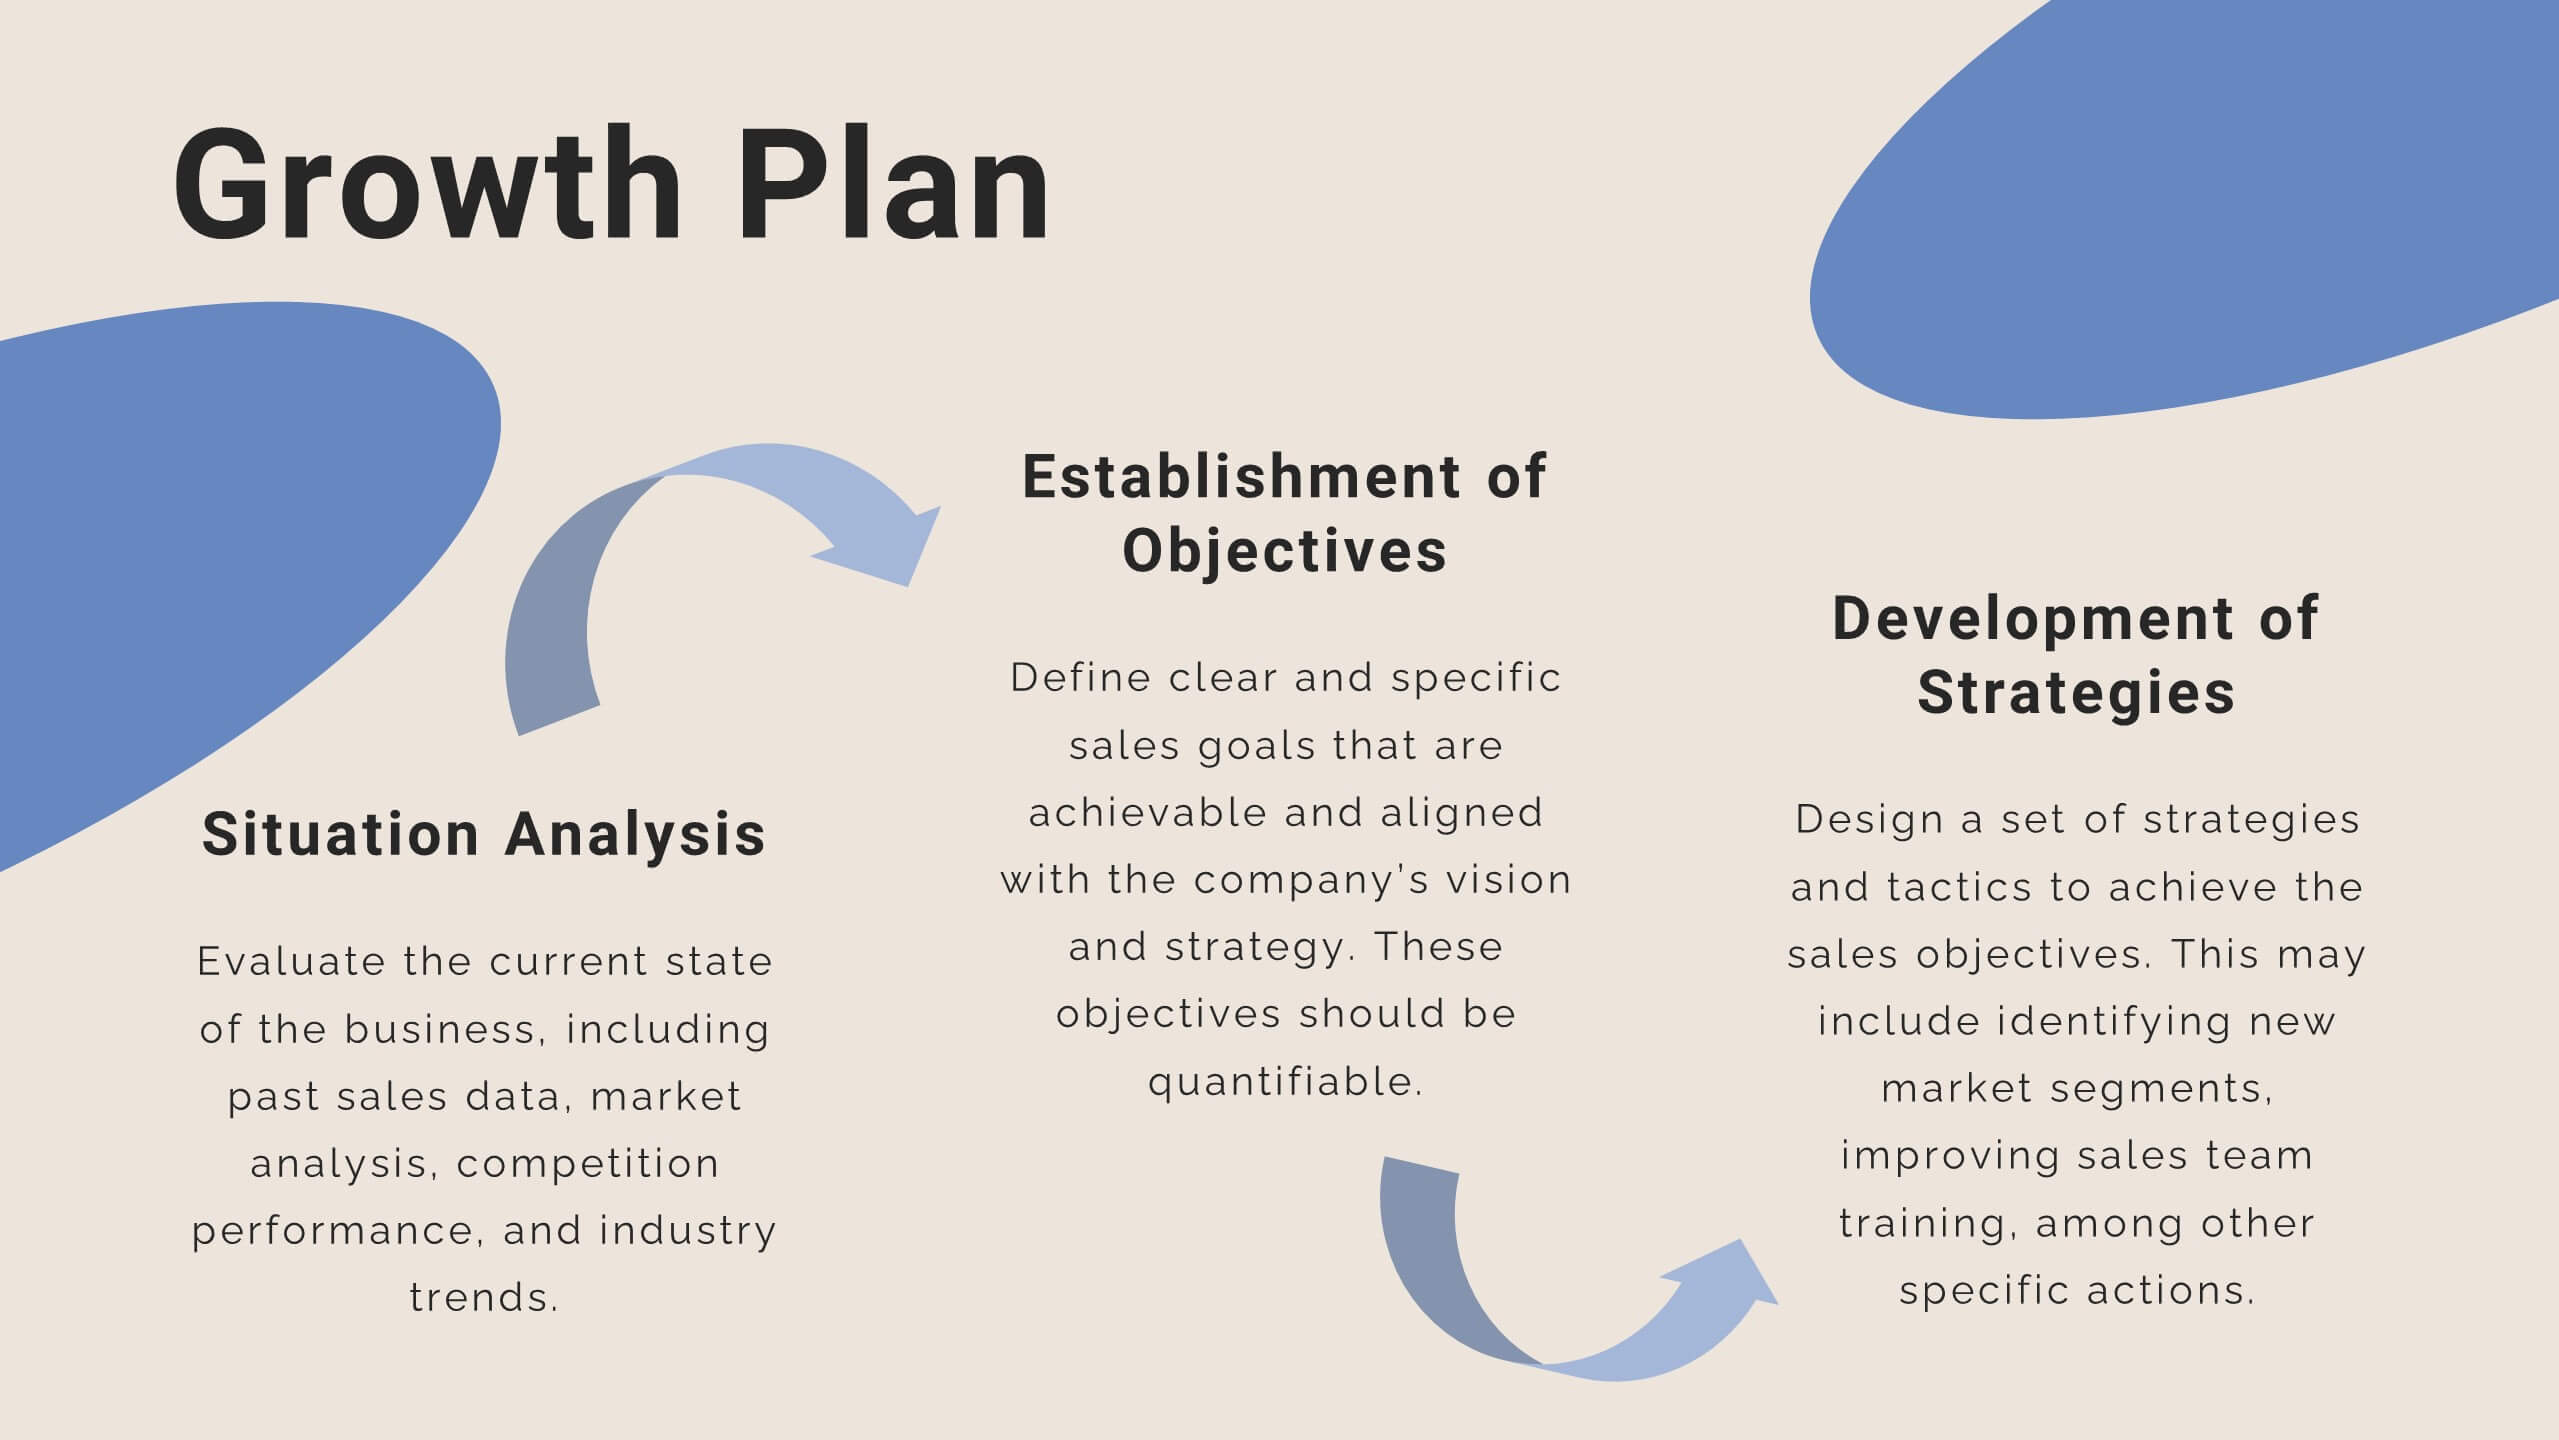
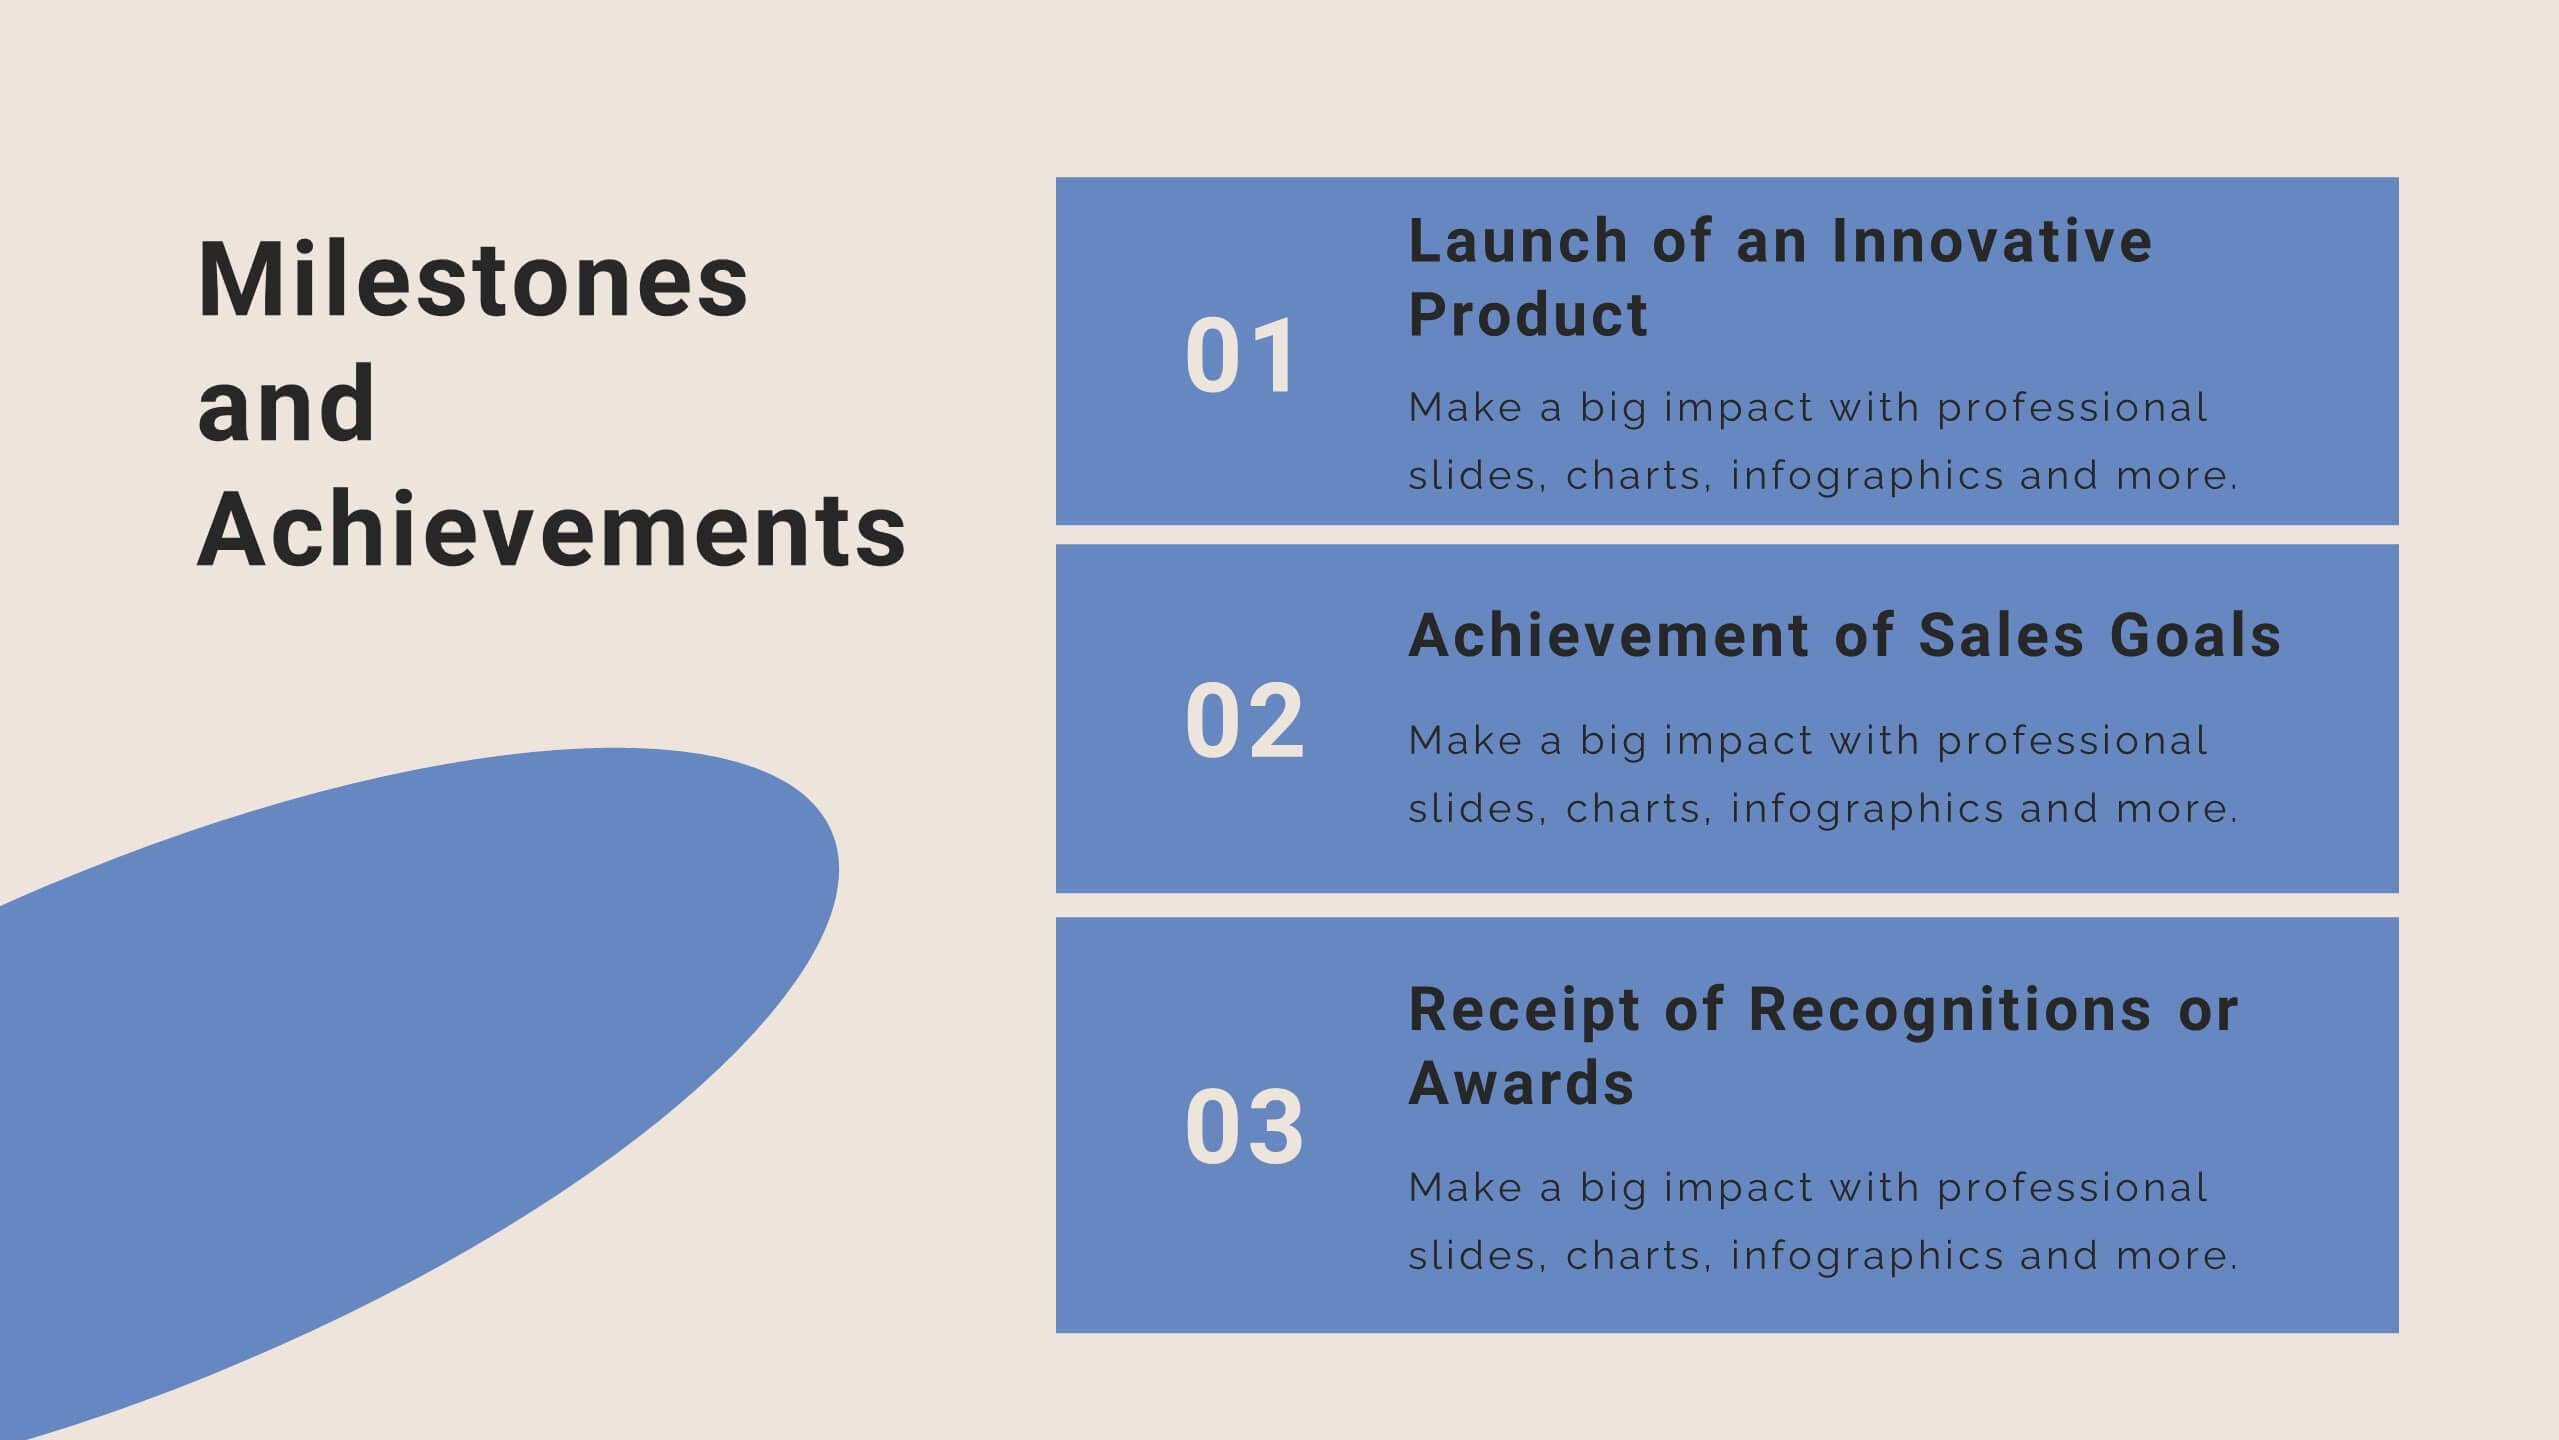
Mystic Startup Strategy Presentation
Launch your startup with confidence using this comprehensive funding proposal template! Perfect for showcasing your mission, vision, and business model to potential investors. Highlight your unique value proposition and growth plan with style. Compatible with PowerPoint, Keynote, and Google Slides, this template ensures your pitch stands out and secures the funding you need.


5 slides
Timeline Road Infographics
Timelines are important tools for organizing and presenting information chronologically. This timeline infographic is designed to help ensure that all your tasks are completed on time, and that the project stays on track. This is perfect for identifying potential issues that may arise during a project, so that they can be addressed before they become major problems. This template consists of a road or a horizontal line, with markers or milestones placed at specific intervals. Each marker represents a significant event or achievement, and is accompanied by a short description, date or time frame.


6 slides
5-Step SEO Marketing Funnel Presentation
Ignite your marketing story with a bold, flowing visual that makes every step feel purposeful and easy to follow. This presentation breaks down each stage of the SEO funnel, helping you explain strategy, performance, and conversion paths with clarity. Fully compatible with PowerPoint, Keynote, and Google Slides.


7 slides
Objective Infographic Presentation Template
Our Objective Infographic template is designed to visually highlight the key points of a business plan and help you get your message across. With this template's simple layout and bold illustration, you can convey the most important parts of your plan in a way that is straightforward and compelling. This infographic template has been created to help you illustrate the key goal of your project. A clear and attractive infographic, this eye-catching template can be used to create interesting informative content. This will captivate your audience and keep them interested in what you have to say.


10 slides
Customer Demographic Breakdown Presentation
Give your insights a bold, modern look with a clear visual layout that turns customer data into an easy-to-follow story. This presentation helps you explain key demographic patterns, highlight audience behavior, and support smarter decisions with clean, structured visuals. Fully editable and compatible with PowerPoint, Keynote, and Google Slides.


6 slides
4 Stage Roadmap Template
Navigate your projects with clarity using our "4 Stage Roadmap Template." This engaging presentation template offers a unique, pathway-like design to outline the progression of any project through four distinct stages. Each step is visually differentiated, making it easy to follow and understand the sequence and dependencies of tasks. Perfect for project managers and teams, this template ensures your strategic milestones are visually aligned and easy to communicate. Compatible with PowerPoint, Keynote, and Google Slides, it's an essential tool for effective project visualization and management.


5 slides
Eco-Friendly Business Strategy Slides Presentation
Inspire sustainable growth with a clean, modern presentation built for eco-conscious businesses. Perfect for outlining green initiatives, corporate responsibility goals, or environmental strategies, it helps you communicate ideas with clarity and impact. Fully editable and compatible with PowerPoint, Keynote, and Google Slides for a seamless, professional presentation experience.


4 slides
Clean Business Table Slide Design Presentation
Present your data with clarity using this Clean Business Table Slide Design presentation. Ideal for service comparisons, feature checklists, or role responsibilities, this layout uses simple icons and crisp tables for quick scanning. Professional and modern, it's perfect for client presentations or internal reports. Compatible with PowerPoint, Canva, and Google Slides.


6 slides
2-Option Comparison Chart Presentation
Make your decision-making story pop with a clean, energetic layout that clearly contrasts two paths side by side. This presentation helps you compare options, outline pros and cons, and guide audiences toward confident choices with sharp visual structure. Fully compatible with PowerPoint, Keynote, and Google Slides.


7 slides
Scope Management and Planning Presentation
Ensure clear project scope definition with the Scope Management and Planning Presentation. This structured template highlights key elements of project scope, responsibilities, and deliverables using an intuitive layout. Ideal for project managers, business analysts, and teams aligning project goals. Fully editable and compatible with PowerPoint, Keynote, and Google Slides.


4 slides
Corporate Finance and Expense Review Presentation
Visualize your company's financial structure with this Corporate Finance and Expense Review Presentation. Featuring a wallet-themed layout with three editable icons and text blocks, this slide helps you clearly present income sources, expenses, and budget allocations. Fully customizable in Canva, PowerPoint, and Google Slides.


26 slides
Maki Presentation Template
Japanese cuisine is known all around the world, there is so much to try including all the different types of sushi. Maki is a 26 slide template made to help you market your services and products. The clean, simplistic design makes it easy for you to display your content in any modernized way. Maki is designed to showcase your packages, pricing and more. Help your customers feel comfortable purchasing your service or product using this template. Present your message clearly and effectively with this presentation. You can customize the design, photos, background and fonts to make it your own.


5 slides
Artificial Intelligence Tools Infographics
Artificial Intelligence has advanced rapidly in recent years, leading to the development of various tools and technologies that leverage AI algorithms and techniques. These vertical infographics highlight various tools and technologies used in the field of AI. This template provides an engaging way to showcase different AI tools and their functionalities. This features a sleek and contemporary design that captures attention. The combination of vibrant colors, high-quality icons, and visuals adds a modern touch to the infographics. The template offers multiple slides that provide an overview of AI and its technologies.


7 slides
Breast Cancer Stages Infographic
The Breast Cancer Stages infographic template is designed to educate and inform about the different stages of breast cancer in a visually engaging and clear manner. The template, compatible with PowerPoint, Google Slides, and Keynote, features a variety of diagram styles such as percentage charts, stage progressions, and anatomical illustrations. It uses a soft color palette of pinks and whites, which is sympathetic to the subject matter. Each slide is carefully constructed to convey essential information about the stages of breast cancer, recommended screenings, and treatment methods. This template is an excellent resource for healthcare professionals, and advocacy groups looking to raise awareness and provide education on breast cancer.


4 slides
Healthcare Impact on Breast Cancer Day Presentation
Educate and inspire with the Healthcare Impact on Breast Cancer Day Presentation. This thoughtfully designed layout uses meaningful visuals to highlight data, awareness efforts, and key messages around breast cancer healthcare. Ideal for awareness campaigns, health reports, or nonprofit presentations. Fully editable in PowerPoint, Google Slides, Keynote, and Canva.