


Features
- 5 Unique slides
- Fully editable and easy to edit in Microsoft Powerpoint, Keynote and Google Slides
- 16:9 widescreen layout
- Clean and professional designs
- Export to JPG, PDF or send by email


Do you have any questions?
Recommend


10 slides
Risk Management in Insurance
Visualize your insurance risk strategies with this engaging umbrella-themed presentation. Designed to illustrate layered risk coverage or multi-step assessments, this slide set is ideal for analysts, agents, or consultants. Each section is clearly numbered and color-coded for easy understanding. Fully editable in PowerPoint, Keynote, and Google Slides.


6 slides
360-Degree Feedback System Overview
Clearly communicate your evaluation process with the 360-Degree Feedback System Overview Presentation. Featuring a circular layout with six editable segments, this template helps visualize feedback from peers, subordinates, managers, and more. Ideal for HR reviews, performance evaluations, and leadership development programs. Fully customizable in PowerPoint, Keynote, or Google Slides.


5 slides
Annual Business Roadmap Timeline Presentation
Kick off your planning journey with a clean, modern visual timeline that makes every milestone easy to follow. This presentation helps outline yearly goals, track progress, and communicate strategic priorities with clarity and flow. Perfect for business planning and reporting. Fully compatible with PowerPoint, Keynote, and Google Slides.


26 slides
Green Business Initiatives Presentation
Lead the charge in sustainability with our Green Business Initiatives presentation template. This eco-friendly template, fully compatible with PowerPoint, Keynote, and Google Slides, is designed for forward-thinking professionals committed to environmental stewardship. Showcase your company's dedication to sustainability with slides that highlight green policies, sustainable practices, and the long-term benefits of eco-conscious operations. The template's customizable elements allow you to present your environmental initiatives with clarity and impact, ensuring your message resonates with your audience. Whether you're a green startup or an established corporation, our template is SEO-optimized to help you spread the word about your commitment to the planet. Engage stakeholders and encourage industry-wide change with a presentation that underscores the value of green business strategies.


7 slides
Milestones Credit Card Infographic Presentation
A Milestones Infographic is a visual representation of significant events, accomplishments, or achievements in a project, business, or individual's life. This template include timelines, graphs, diagrams, and other visual elements to help convey important information. You can use this infographic to cover many different topics, including project management, business growth, personal achievements, or company history. This template is useful for businesses or individuals who want to showcase their accomplishments, highlight important dates or events, or just share progress updates.


6 slides
Venn Diagram
A Venn diagram is a visual representation of the relationships between different sets or groups. This infographic template consists of overlapping circles, each representing a specific set, and the overlapping parts indicates the elements that belong to multiple sets. Use this infographic to illustrate the relationships between different sets of data or concepts. The main components of the infographic are the circles or ellipses that represent the sets being compared. The size and position of the circles can be adjusted to reflect the data accurately. This infographic is fully customizable and compatible with Powerpoint, Keynote, and Google Slides.


20 slides
Spartan Content Marketing Pitch Deck Presentation
The Spartan Marketing Pitch Deck is designed to captivate and impress with its bold, modern layout and striking black-and-white color scheme. Perfect for delivering powerful marketing strategies, this template covers all essential aspects from industry overview to consumer behavior analysis. It seamlessly guides you through emerging technologies, content marketing trends, and mobile marketing insights. The deck emphasizes personalization trends, influencer marketing, and the latest eCommerce developments, ensuring your pitch resonates with cutting-edge strategies. Whether discussing SEO and SEM trends or diving into customer experience and brand storytelling, this template delivers your message with clarity and impact. Conclude with a strong call to action, ensuring your audience is engaged and ready to take the next step. Fully compatible with PowerPoint, Keynote, and Google Slides, the Spartan Marketing Pitch Deck is an excellent choice for professionals aiming to deliver a memorable and persuasive presentation.


4 slides
Big Data Analytics Business
Simplify data complexity with this layered stack diagram designed for big data workflows and insights. Ideal for IT professionals, analytics teams, and consultants, it visually represents data input, processing, and output stages. Fully editable in PowerPoint, Keynote, and Google Slides for flexible customization.


19 slides
Zenith Sales Proposal Presentation
Get ready to blow your clients away with this electrifying sales proposal template! Packed with sections on project scope, bold objectives, timelines, and jaw-dropping pricing, it’s designed to make a powerful impact. The sleek, cutting-edge design ensures you’ll leave a lasting impression. Fully compatible with PowerPoint, Keynote, and Google Slides!


2 slides
Meeting and Business Planning Services Illustrations
Take your planning game to the next level with our meeting and business planning services illustrations pack! This illustrations pack is perfect for companies that need a way to visualize their ideas quickly and easily. Fully compatible with Powerpoint, Keynote, and Google Slides. Boost your productivity and make your meetings more exciting—download the meeting and business planning services illustrations pack today!


5 slides
Business Choices and Outcomes Analysis Presentation
Visually connect key business options with their potential results using the Business Choices and Outcomes Analysis slide. Featuring a clean puzzle-style layout, this template is perfect for illustrating decision pathways, pros and cons, or strategy alternatives. Ideal for consultants, managers, and analysts. Easily customizable in PowerPoint, Keynote, and Google Slides.


30 slides
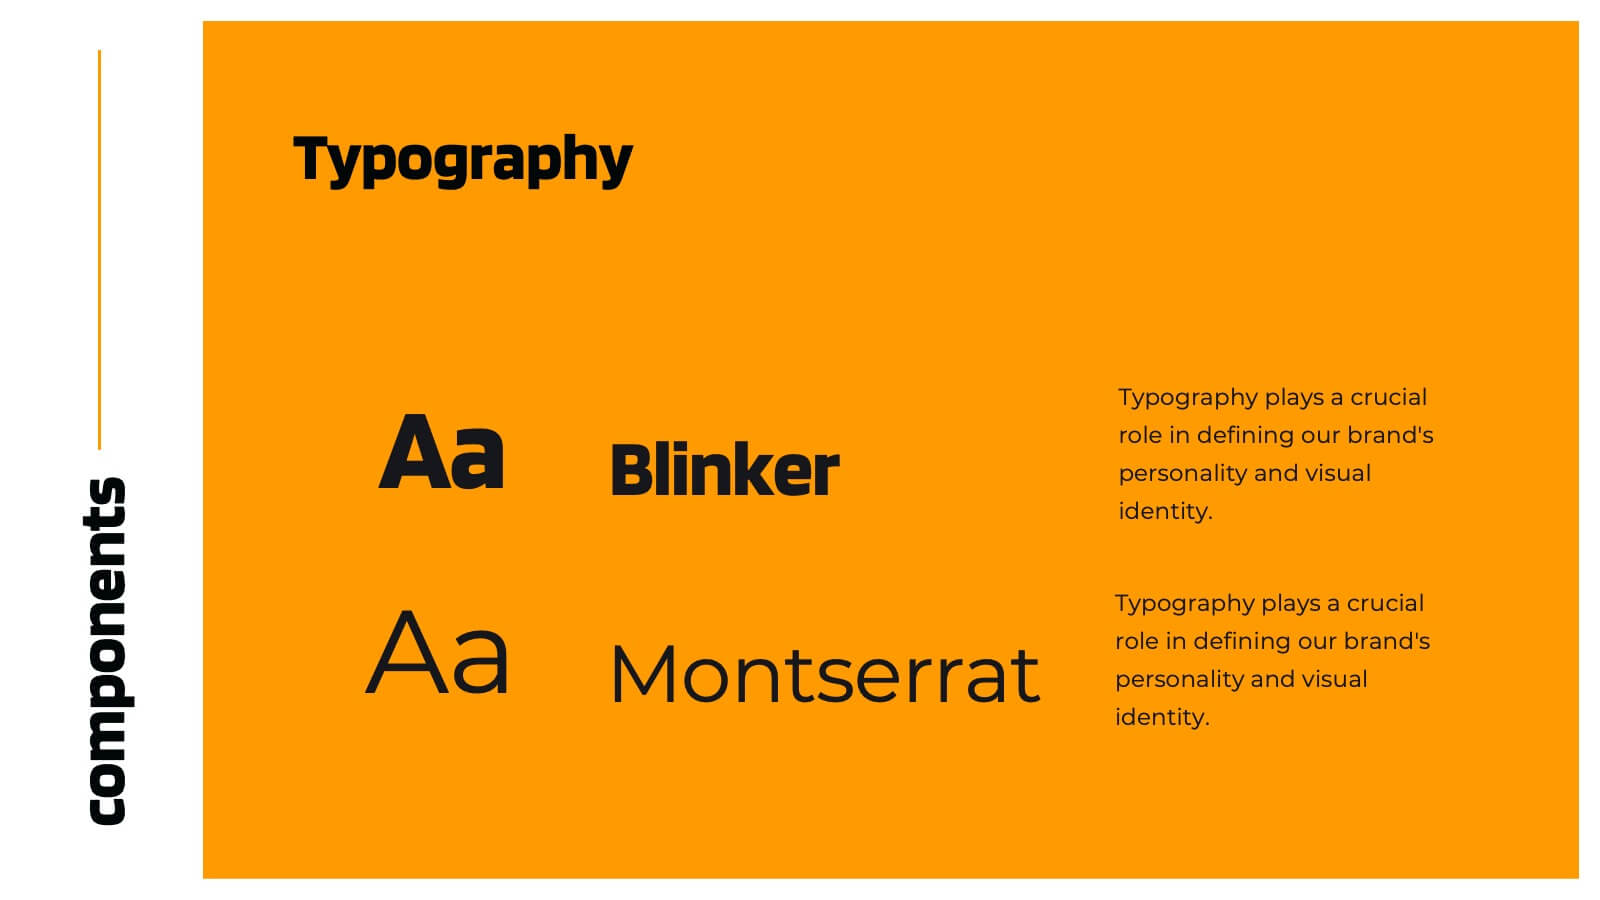
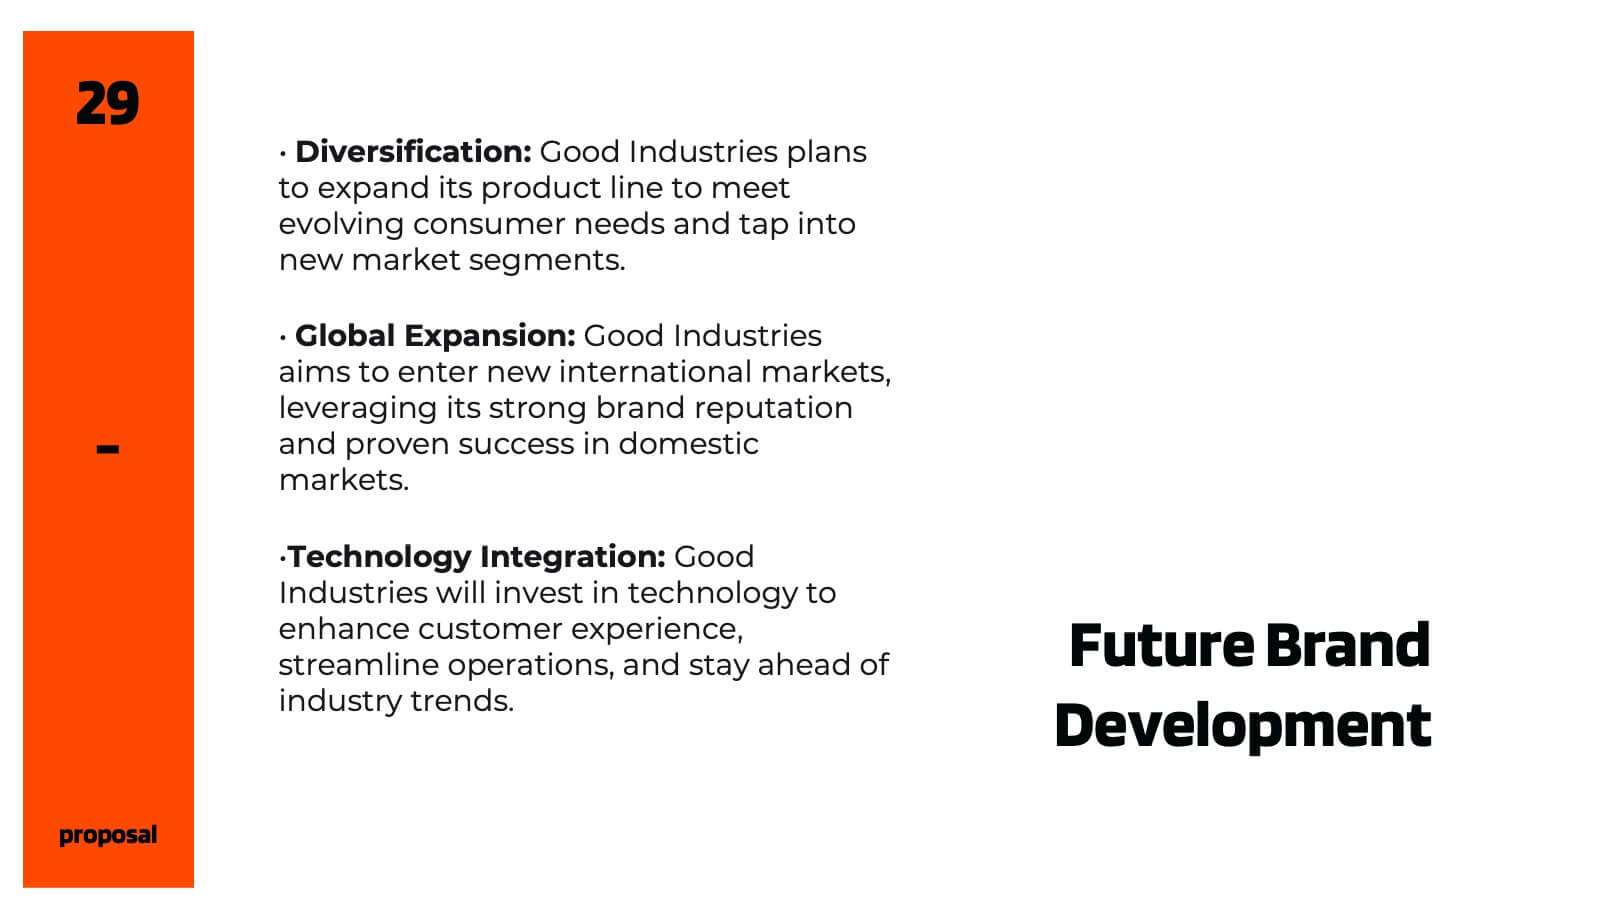
Chromalight Brand Guidelines Proposal Presentation
Elevate your brand's story with this visually engaging presentation template that embodies modern, professional aesthetics. From mission and vision statements to brand identity and market positioning, each slide is crafted to showcase your brand's core essence. Ideal for brand strategists and marketers, this template is compatible with PowerPoint, Keynote, and Google Slides.


5 slides
Workforce Structure and Unity Overview Presentation
Present your team's hierarchy and alignment clearly with the Workforce Structure and Unity Overview Presentation. This slide layout is ideal for illustrating reporting relationships, department groupings, or organizational tiers in a clean and visual format. Great for onboarding, team updates, or internal planning meetings. Fully editable in PowerPoint, Keynote, Canva, and Google Slides.


2 slides
Small Business Success Illustrations
Get your business on the right track with our small business success illustrations pack! These illustrations will help you with your next business presentation and make it more engaging and catchy. Fully compatible with Powerpoint, Keynote, and Google Slides. You can use these in your website, blog or social media posts. Turn your vision into a reality—download the small business success illustrations pack today!


5 slides
Environmental and Social Sustainability Presentation
Explore the synergy of environmental protection and social responsibility with our Environmental and Social Sustainability Presentation template. This visual aid is a compelling tool for discussing key strategies in balancing ecological and social impacts, providing a roadmap for sustainable business practices. Ideal for engaging audiences in discussions about conservation and community engagement, the template is fully compatible with PowerPoint, Keynote, and Google Slides, ensuring a smooth presentation experience in any setting.


5 slides
Financial Market Trends and Forecast Presentation
Visualize economic shifts and data insights with this upward growth line infographic. Ideal for presenting financial forecasts, investment strategies, and market milestones, this layout features a stylized arrow path with icons, letter markers, and space for detailed annotations. Fully editable and compatible with PowerPoint, Keynote, and Google Slides.


5 slides
Fundraising for Nonprofits Infographics
Elevate your fundraising efforts with our fundraising for nonprofits infographics template. Cast in the trustworthy shades of blue and red, this collection is a boon for nonprofit organizations, charity events coordinators, and social activists. It's designed to articulate critical fundraising information, campaign progress, and financial goals in a format that's as compelling as it is clear. Compatible with Powerpoint, Keynote, and Google Slides. The creative and informative style, replete with pertinent graphics, icons, and image placeholders, ensures your message resonates profoundly, encouraging more engagement and generosity towards your noble causes.