


Features
- 21 Unique Slides
- Fully editable and easy to edit in Microsoft Powerpoint, Keynote and Google Slides
- 16:9 widescreen layout
- Clean and professional designs
- Export to JPG, PDF or send by email


Do you have any questions?
Recommend


6 slides
Student Success and Learning Programs Presentation
Showcase your academic initiatives with the Student Success and Learning Programs Presentation. Ideal for school boards, educators, or program leaders, this slide lets you highlight six key focus areas around student achievement. Fully editable in PowerPoint, Keynote, Google Slides, and Canva—making it easy to tailor to your curriculum goals.


21 slides
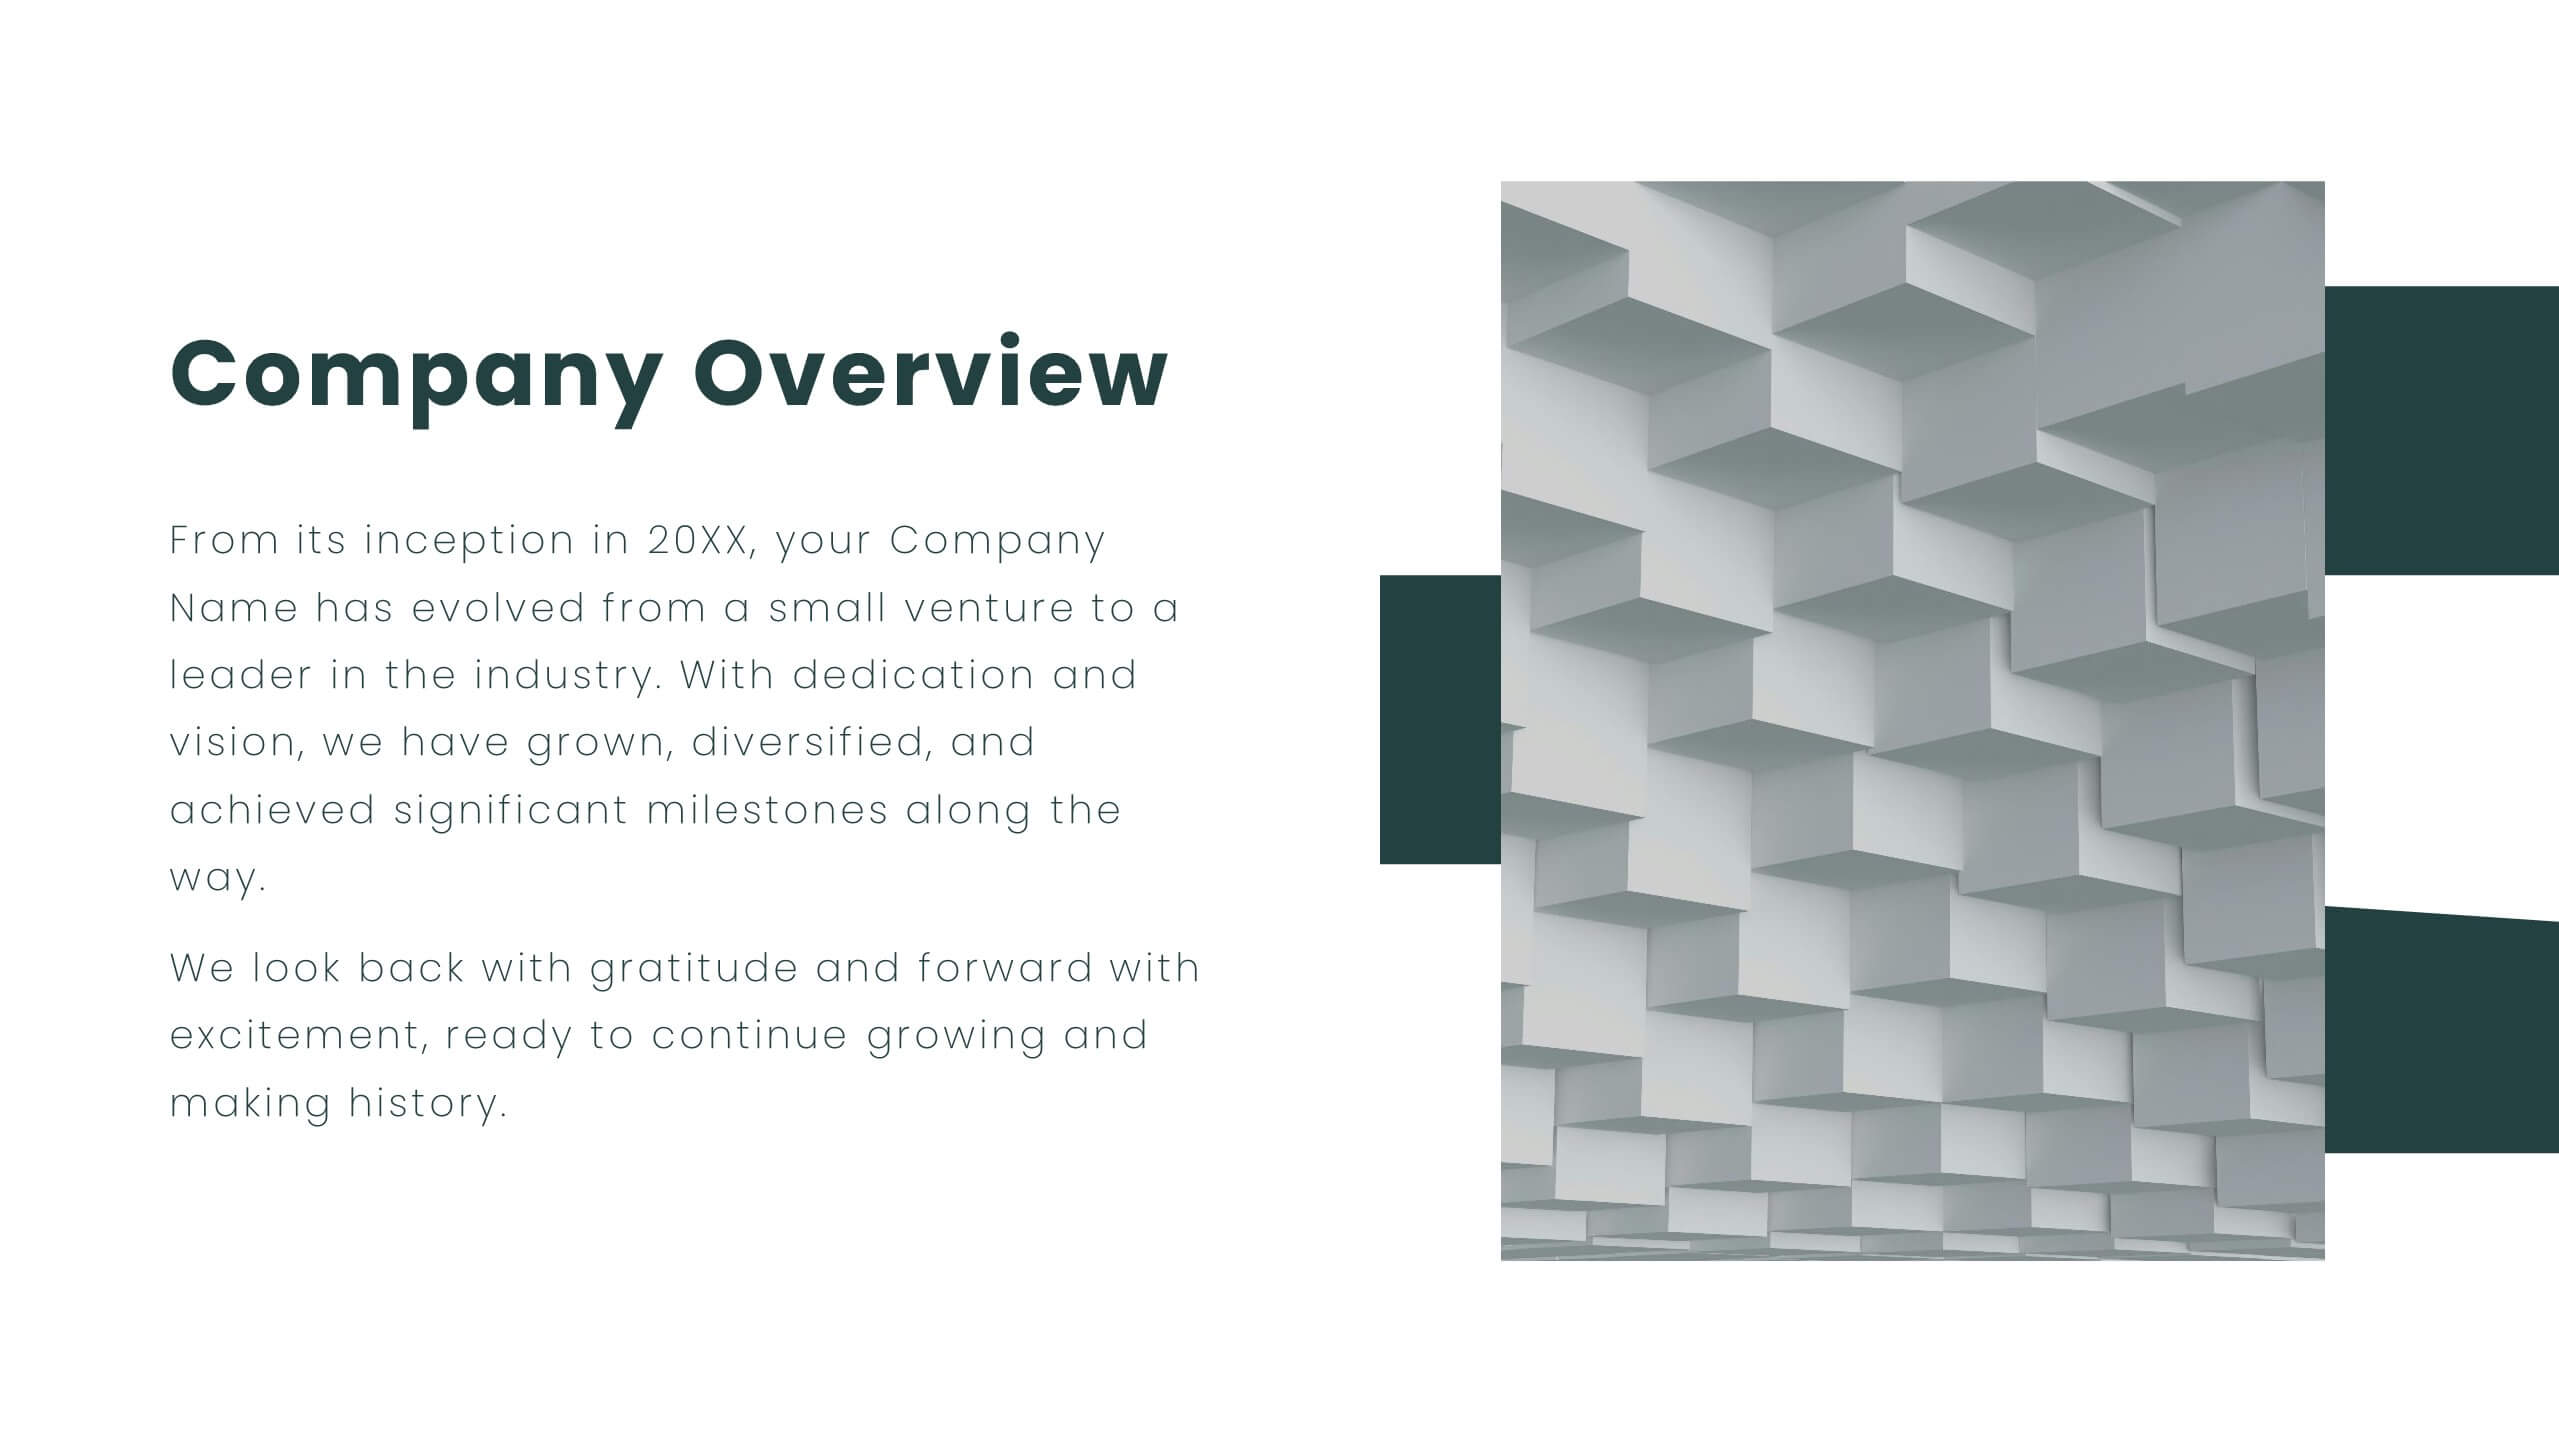
Company Overview Presentation
Deliver a comprehensive company overview with this Company Overview presentation template. It includes structured slides covering the introduction, history, mission, team, market presence, and competitive landscape. Ideal for engaging stakeholders, this template also features sections on financial highlights and corporate social responsibility. Compatible with PowerPoint, Keynote, and Google Slides, it's perfect for detailed corporate presentations.


22 slides
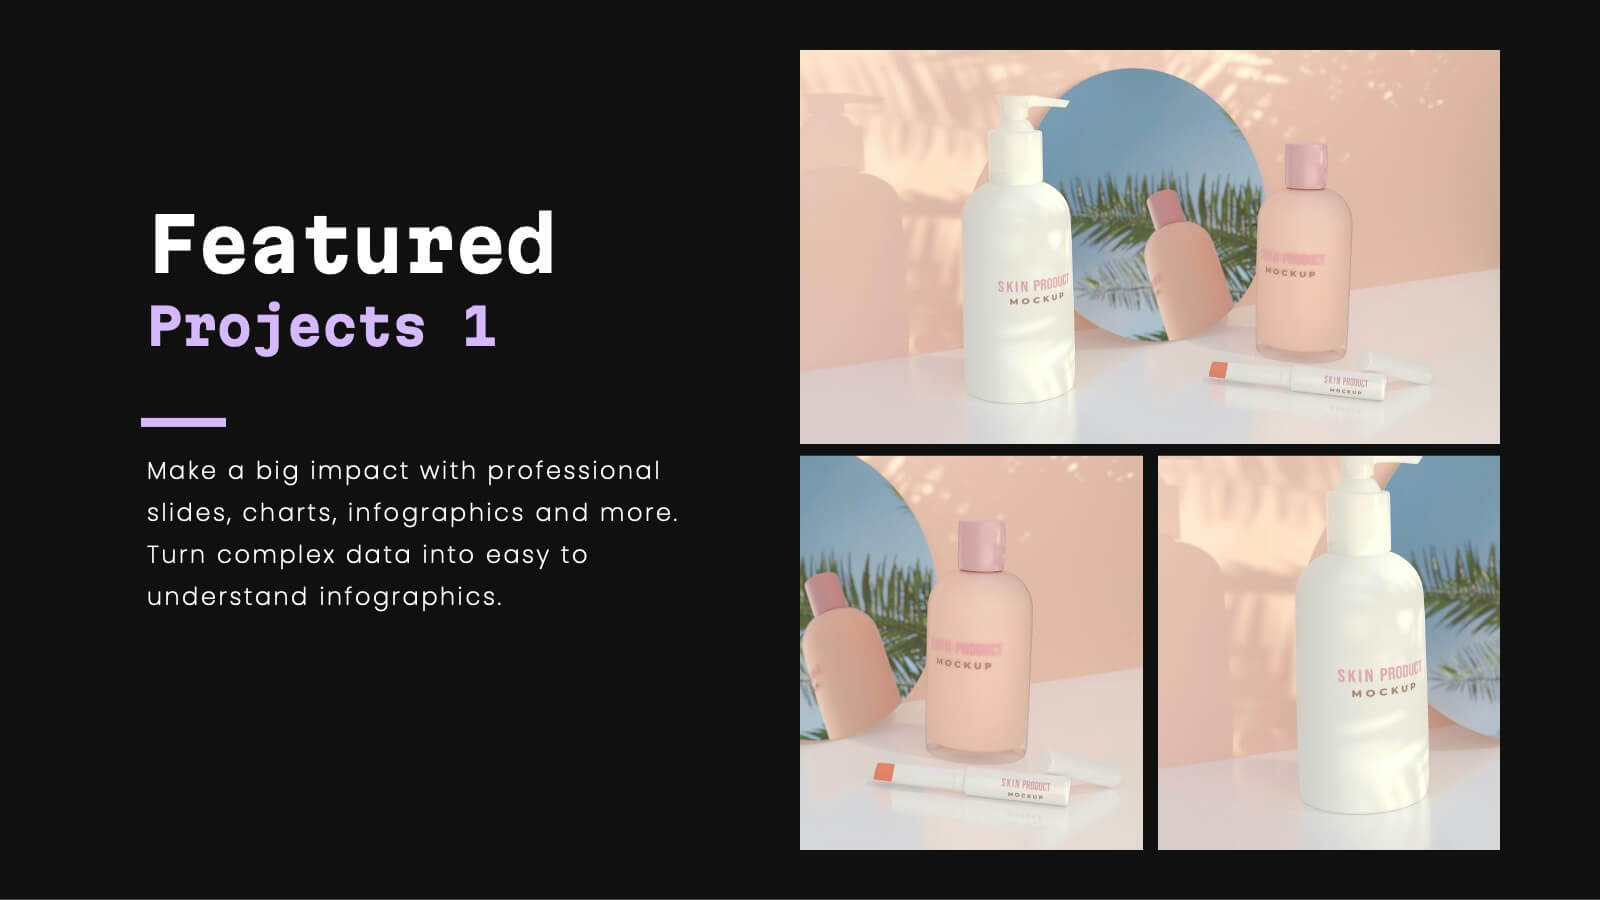
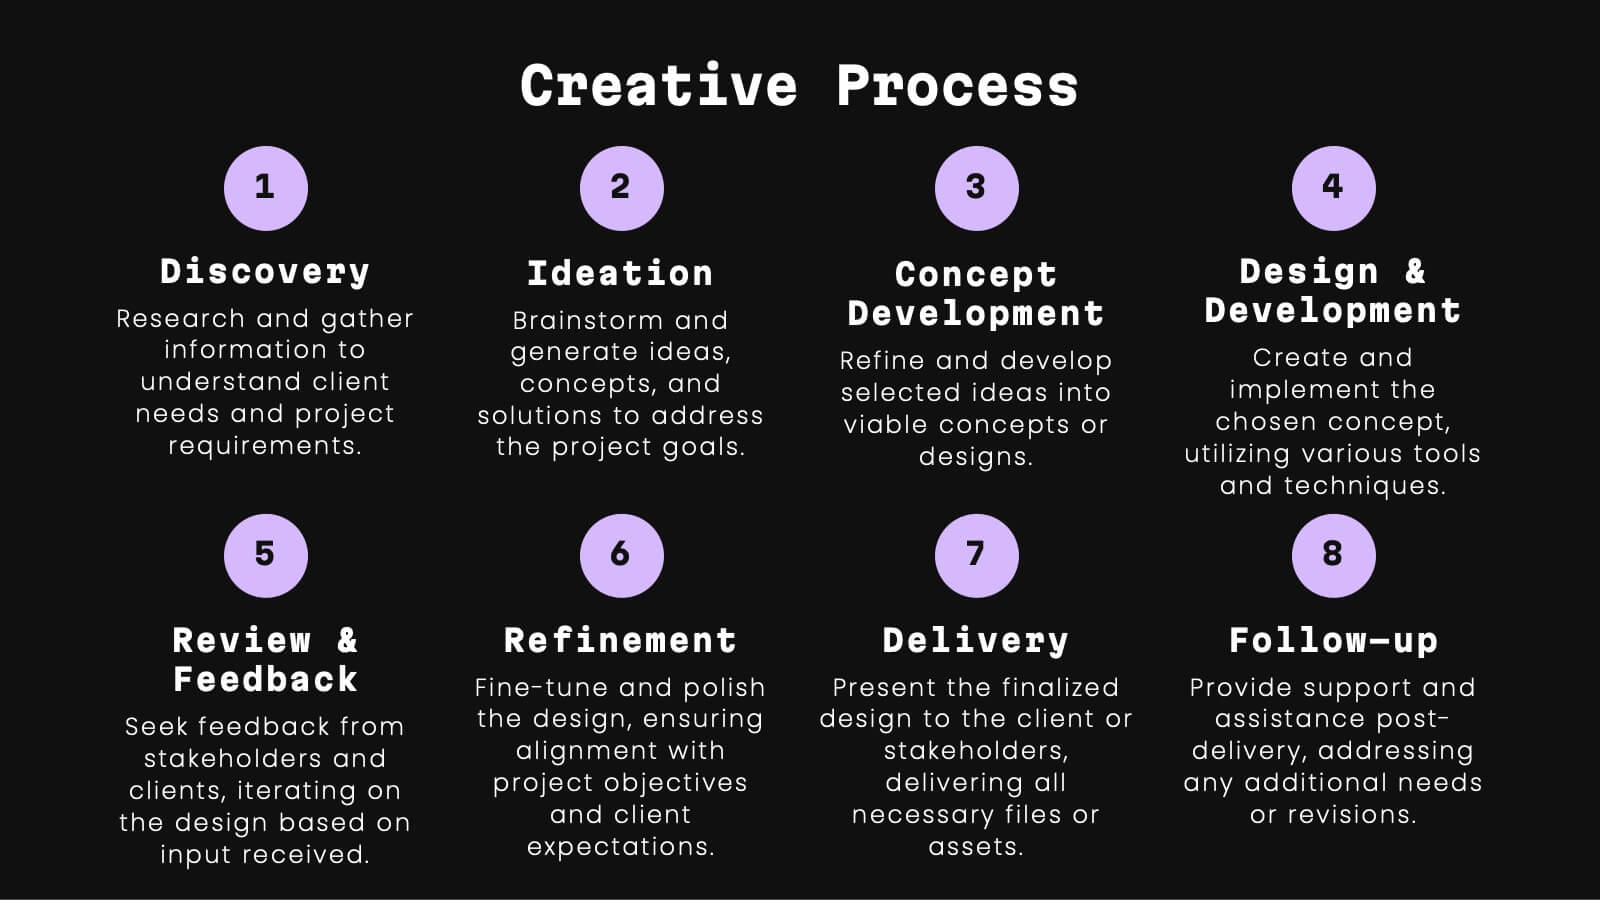
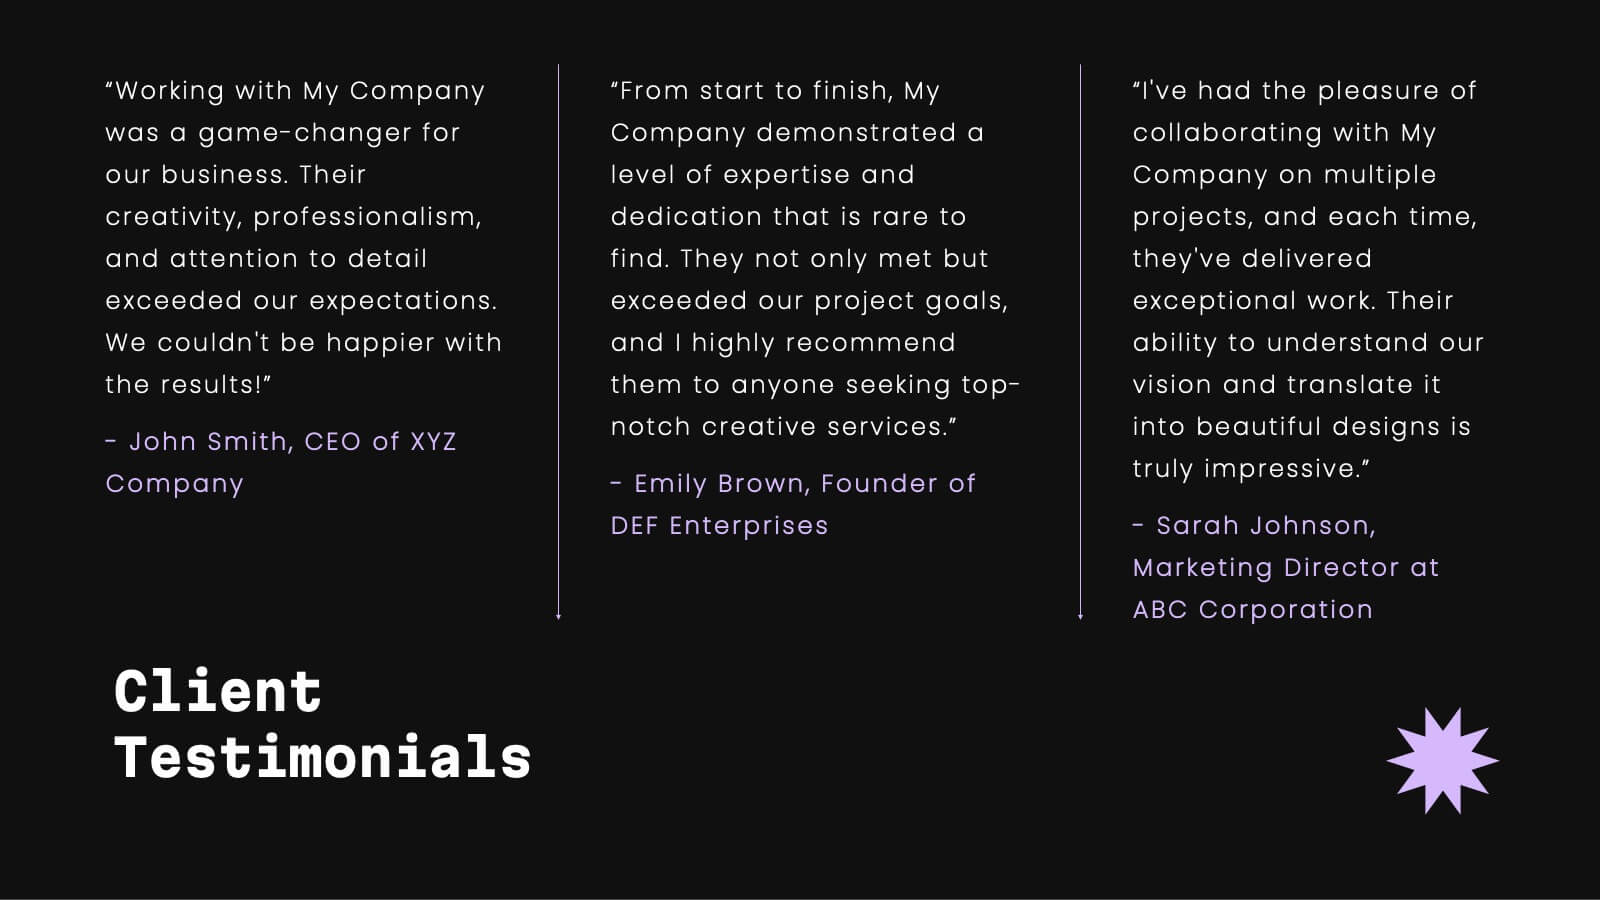
Celeste Professional Portfolio Showcase Presentation
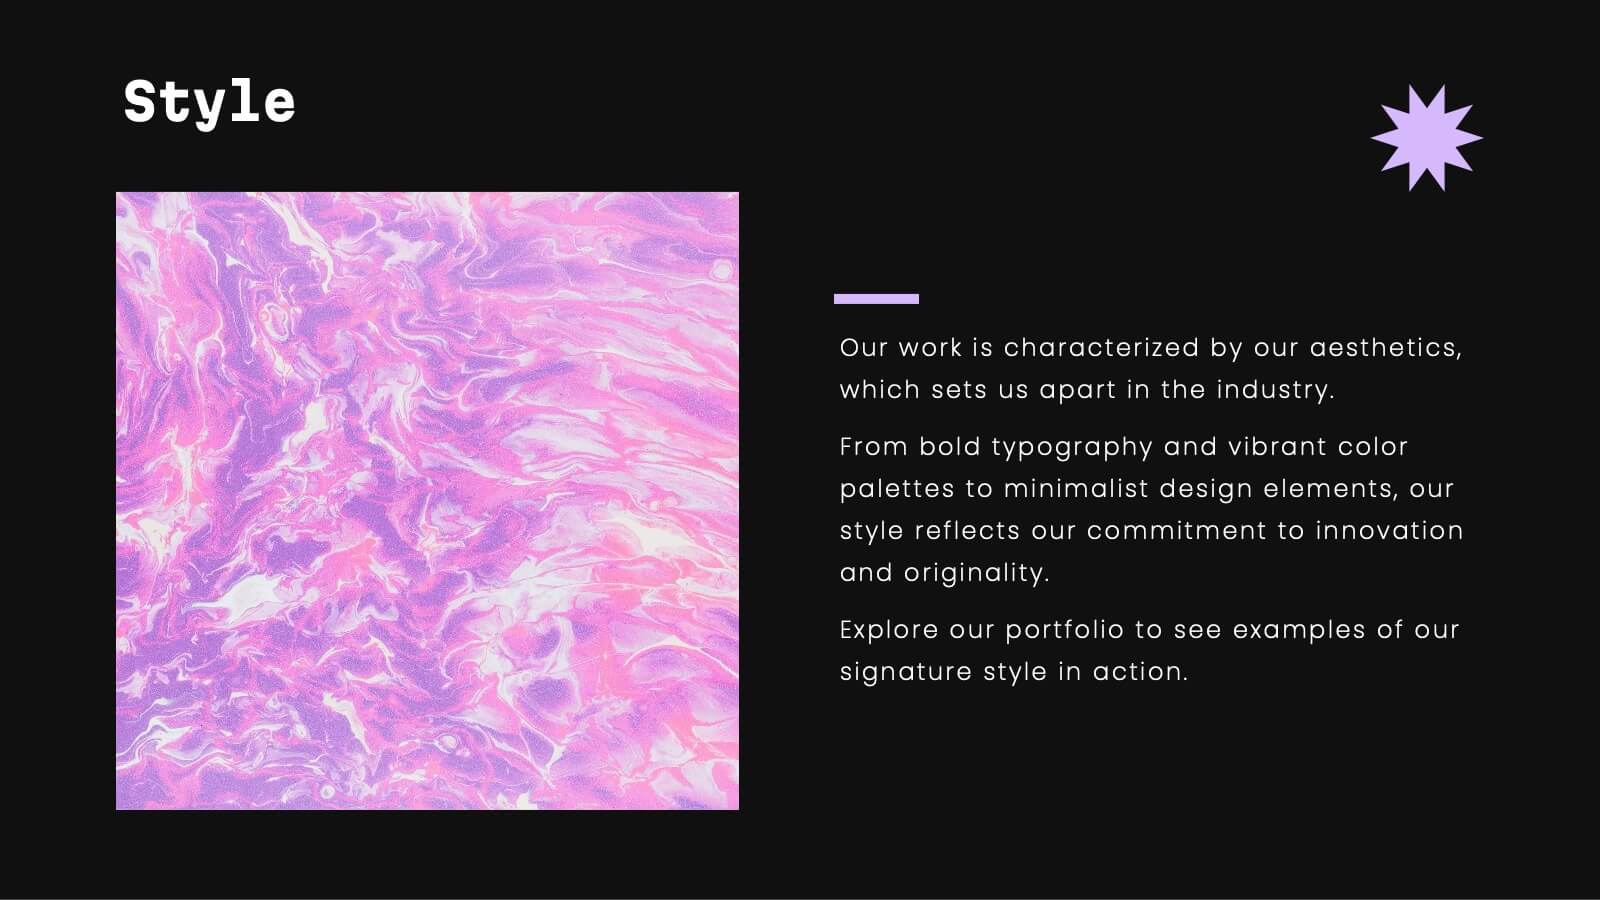
Impress with style using this sophisticated portfolio presentation template. Perfect for showcasing featured projects, creative processes, and client testimonials, this template enhances the visual appeal of your work. Its modern, dark-themed design ensures your content stands out, making a lasting impression. Compatible with PowerPoint, Keynote, and Google Slides, it's versatile for any platform.


26 slides
Wedding Planner Company Profile Presentation
A wedding planner company is a specialized service provider that assists couples in planning, organizing, and coordinating their wedding day. This beautiful template is tailored for wedding planning companies looking to showcase their services and expertise. With this presentation, wedding planners can present their company's unique offerings, experience, and past successful events in an engaging and elegant manner. This presentation features an elegant and romantic design that reflects the essence of weddings. It incorporates soft colors, floral patterns, and beautiful imagery to create a sophisticated and enchanting atmosphere.


6 slides
Business Strategy Pyramid Presentation
Outline your strategic priorities with clarity using the Business Strategy Pyramid Presentation. This template features a five-step 3D pyramid that highlights key business goals, initiatives, or stages. Each layer includes icons and numbered sections for easy interpretation. Ideal for strategy meetings, executive briefings, and growth plans. Fully editable in PowerPoint, Keynote, and Google Slides.


4 slides
Construction Project Planning
Streamline your workflow and improve clarity with this vibrant project planning wheel designed for construction professionals. This slide helps visualize key phases—such as planning, team coordination, and logistics—using color-coded segments and editable icons. Perfect for architects, contractors, and project managers. Fully customizable in PowerPoint, Keynote, and Google Slides.


8 slides
Corporate Office Scenes Illustrations Presentation
Bring workplace communication to life with this slide featuring an illustrated office meeting scene and a four-point list layout. Each segment is color-coded with accompanying icons, making it ideal for presenting corporate strategies, team roles, or process workflows. Designed for clarity and visual appeal, this slide is perfect for business reports, training decks, or client briefings. Easily customizable in PowerPoint, Keynote, and Google Slides.


4 slides
Key Business Statistics Presentation
Transform raw numbers into a compelling visual story with a clean and structured layout that highlights key insights effortlessly. Ideal for showcasing progress, analytics, and results, this design helps simplify complex data for clear communication. Fully editable and compatible with PowerPoint, Keynote, and Google Slides for seamless customization.


5 slides
Statistical Insights for Business Growth Presentation
Showcase key business statistics with impact using this radial chart-style presentation slide. Ideal for visualizing growth percentages, progress tracking, or survey results, this design helps break down five distinct insights with matching callouts. Perfect for analytics reports, performance dashboards, and stakeholder updates. Fully customizable in PowerPoint, Keynote, and Google Slides.


20 slides
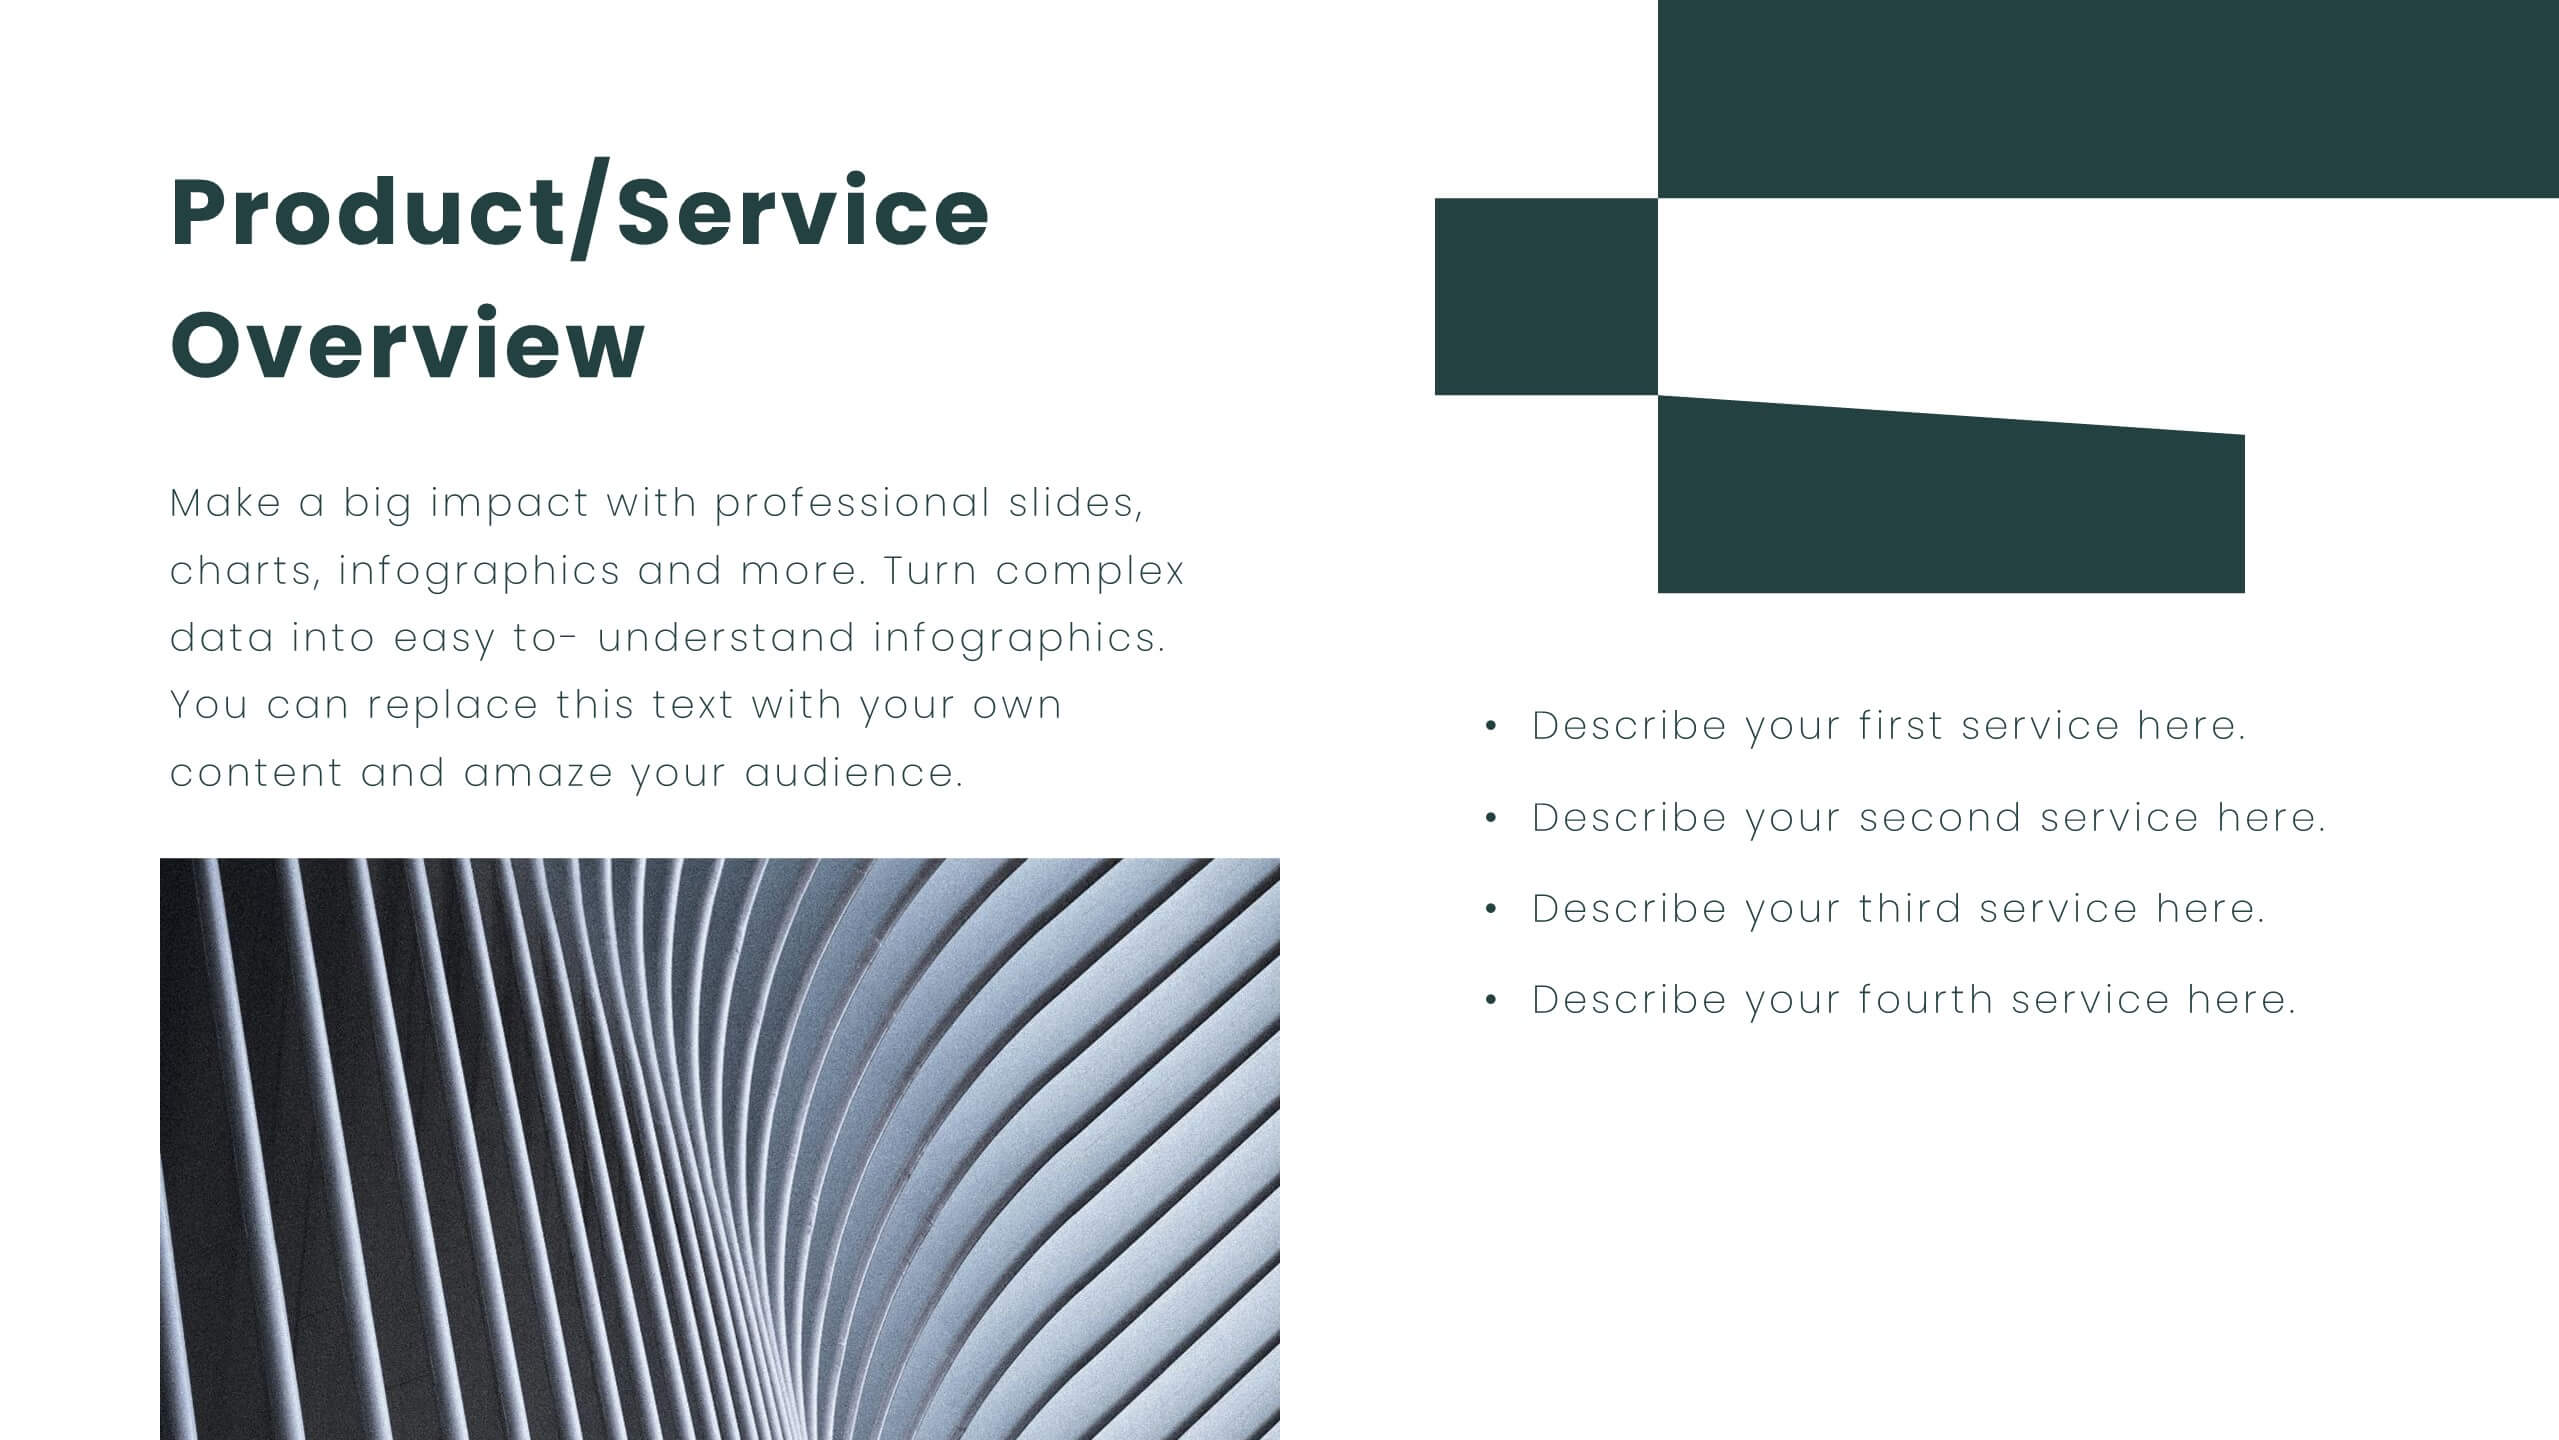
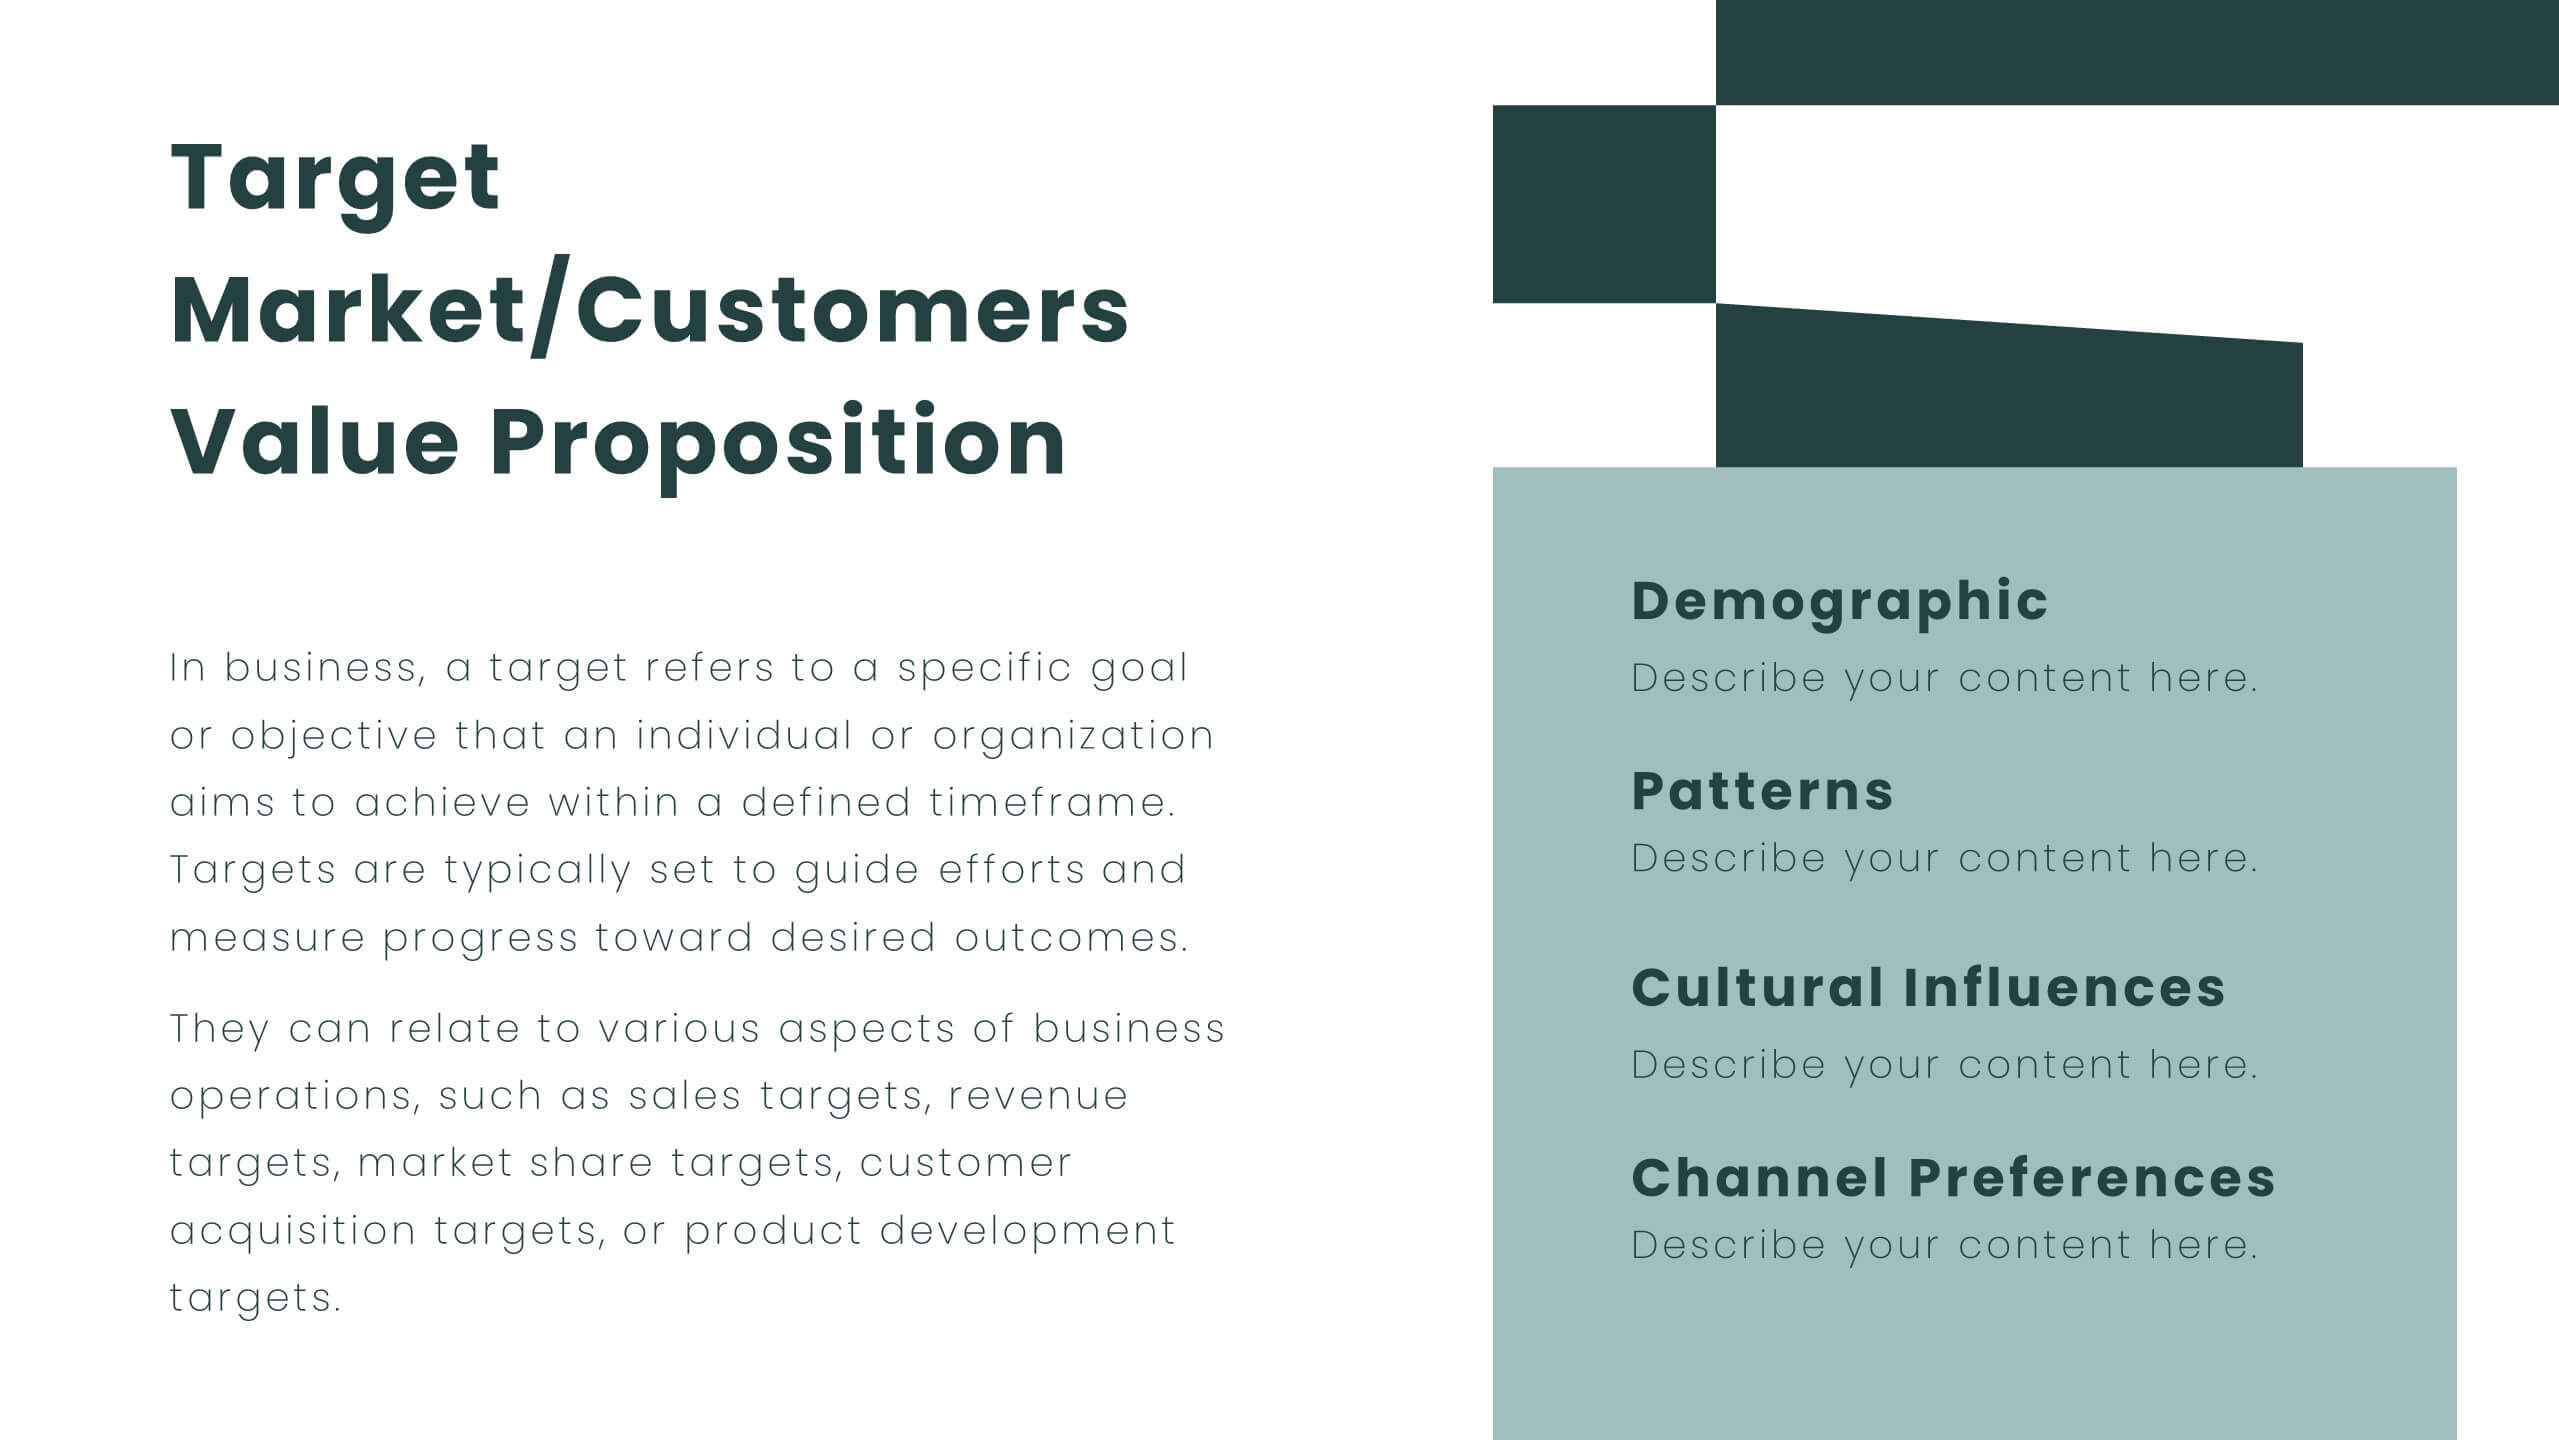
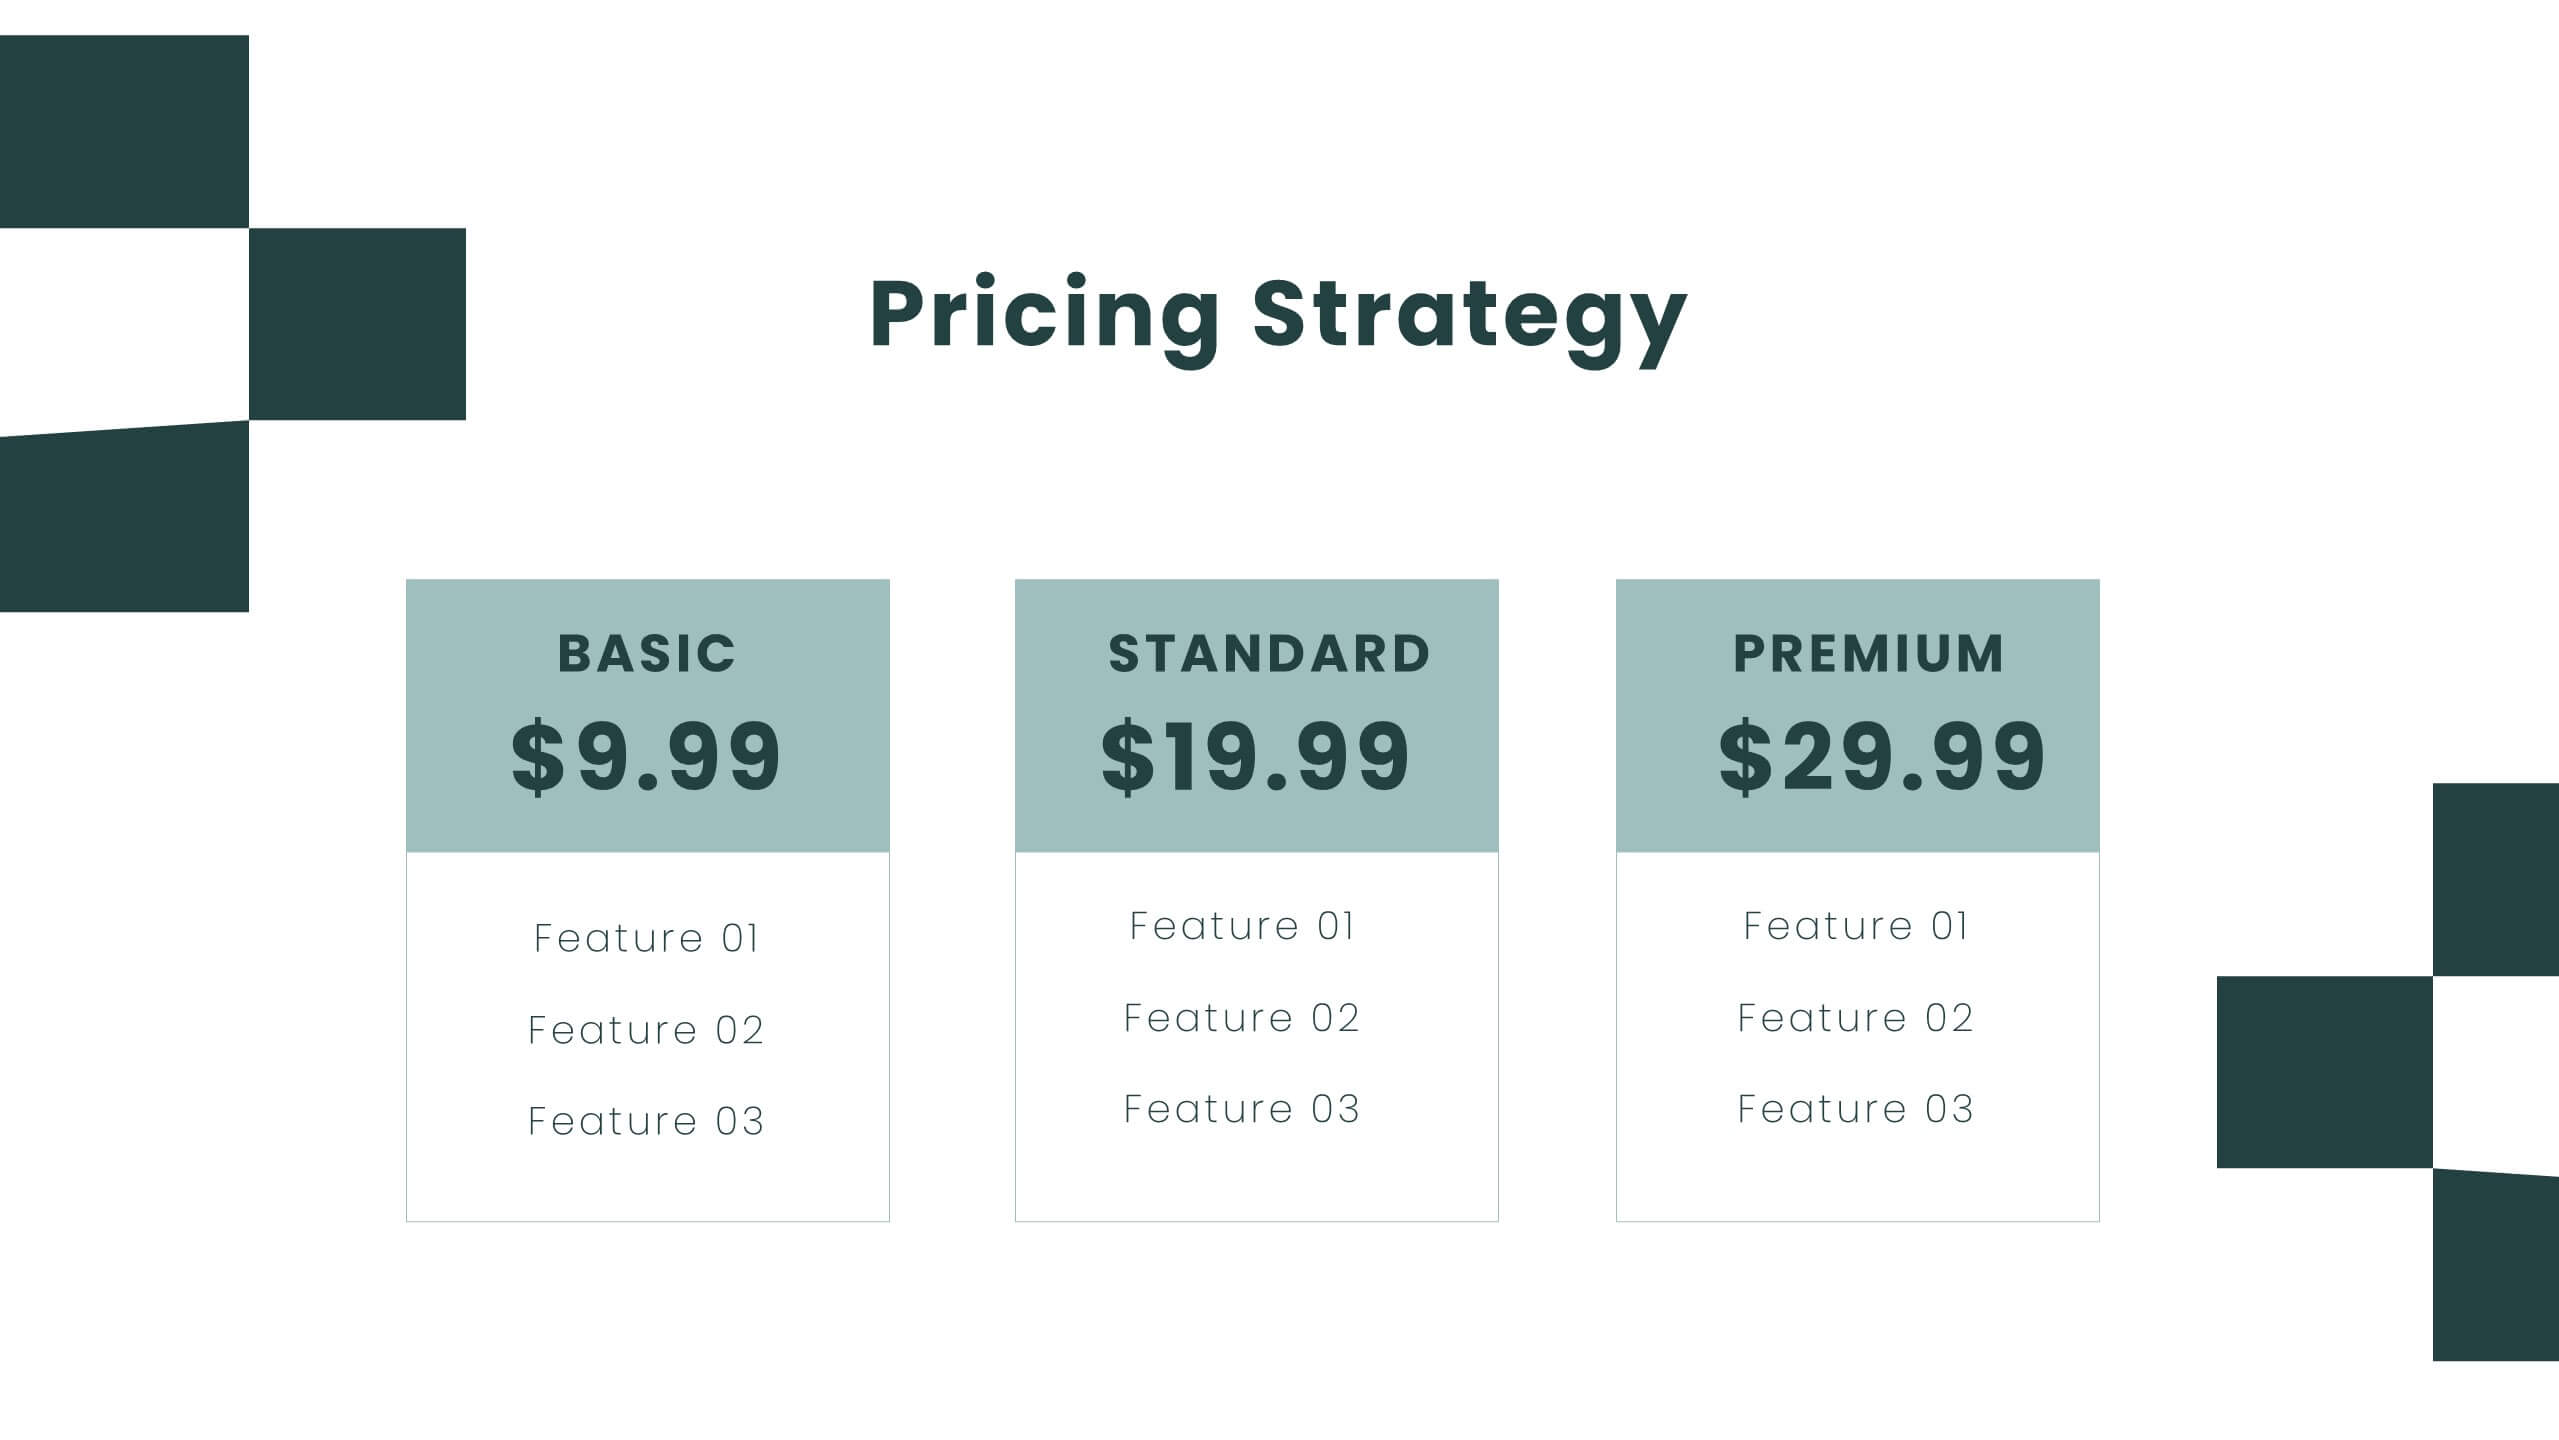
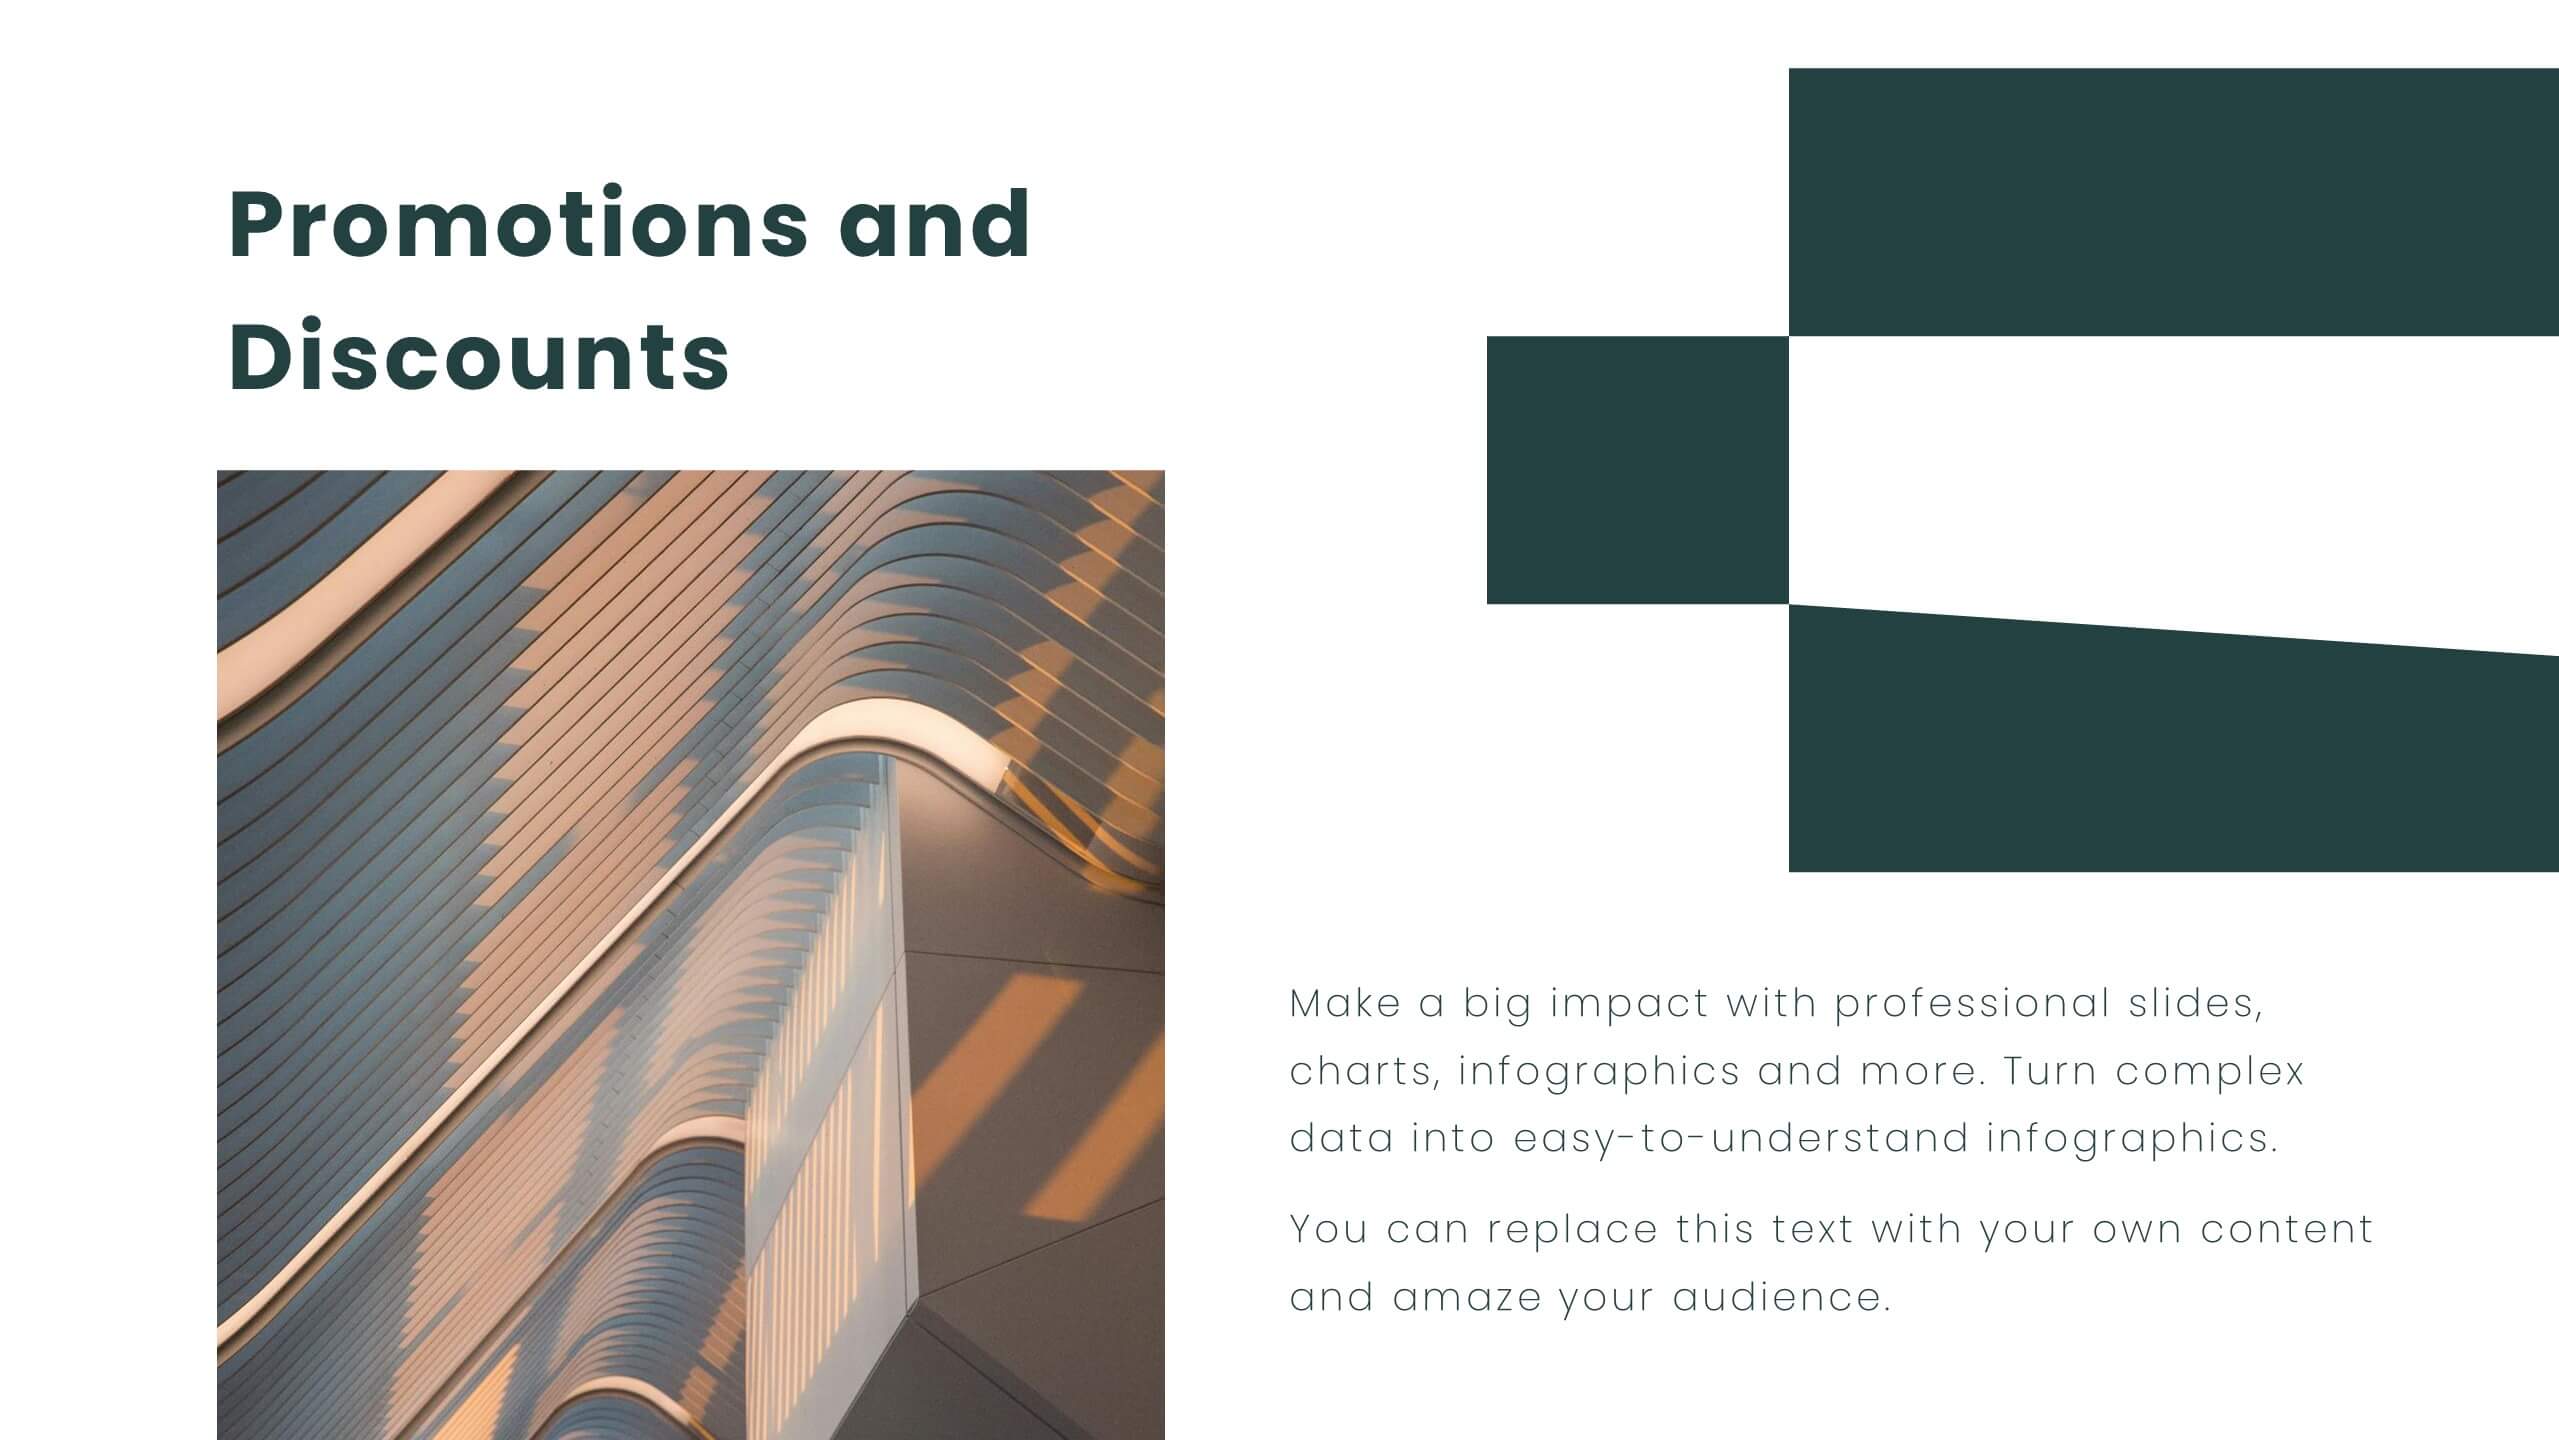
Radiant Sales Proposal Presentation
Elevate your pitch with this polished sales proposal template! Perfect for presenting company overviews, product/service details, and pricing strategies, it includes slides for competitive analysis and customer testimonials. Impress your audience with clear visuals and structured content. Compatible with PowerPoint, Keynote, and Google Slides for seamless presentations on any platform.


8 slides
Team Performance and Sports Analysis Presentation
Highlight team rankings and sports metrics with the Team Performance and Sports Analysis template. Featuring a dynamic race track-inspired layout with numbered positions, icons, and vivid color coding, it’s ideal for comparing performance. Fully customizable in Canva, PowerPoint, and Google Slides to match your sport, brand colors, and presentation goals.


26 slides
Digital Art Tools and Techniques Presentation
Unleash your creativity with this vibrant presentation on digital art tools and techniques. Covering essential topics like graphic design software, digital brushes, layering methods, and creative workflows, this template helps artists and designers enhance their skills. Fully customizable and compatible with PowerPoint, Keynote, and Google Slides for a seamless and visually stunning presentation experience.


4 slides
Performance Gap Analysis Diagram Presentation
Bridge the gap between current and desired performance with this strategic diagram. Featuring a split-path layout and central bridge graphic, this template helps visualize obstacles, goals, and solutions. Ideal for strategy teams, consultants, and analysts. Fully editable in PowerPoint, Keynote, and Google Slides—clear, impactful, and easy to customize.


10 slides
Post-Pandemic Business Strategy Presentation
Help your team adapt to the new normal with this sleek and professional slide layout. Featuring a sanitizer bottle graphic as a central metaphor, the design visually supports your content on strategic recovery, operational safety, or workflow changes. Includes four editable text sections, each with modern icons. Ideal for HR, leadership updates, or business continuity plans. Compatible with PowerPoint, Keynote, and Google Slides.


23 slides
Ethelin Digital Strategy Presentation
The digital strategy presentation template is designed to showcase your company's goals, market analysis, and strategic initiatives. Featuring slides for SWOT analysis, performance metrics, and action plans, it’s perfect for business planning and stakeholder engagement. Fully customizable and compatible with PowerPoint, Keynote, and Google Slides.


5 slides
Lean Six Sigma Business Strategy
Present your continuous improvement plan with this visually compelling Lean Six Sigma pyramid slide. Each layer represents a key phase—Define, Measure, Analyze, Improve, and Control—making it ideal for team training, process mapping, or performance reviews. Fully editable in PowerPoint, Keynote, and Google Slides.


5 slides
Water Sustainability & Resource Use Presentation
Visualize environmental impact with this unique cloud-and-rainfall diagram layout. Ideal for presenting five key points related to sustainability, resource management, or water usage. Each droplet icon guides attention across your content clearly. Fully editable and compatible with PowerPoint, Keynote, and Google Slides for effortless customization and impactful storytelling.