


Features
- 8 Unique slides
- Fully editable and easy to edit in Microsoft Powerpoint, Keynote and Google Slides
- 16:9 widescreen layout
- Clean and professional designs
- Export to JPG, PDF or send by email


Do you have any questions?
Recommend


8 slides
Quarterly Sales Report Presentation
Streamline your quarterly sales review with our "Quarterly Sales Report Presentation" template. This infographic is expertly designed to display sales data across various categories, using a series of shopping cart icons that represent different products or services. Each cart is labeled with a title and associated with a percentage, clearly illustrating sales performance metrics. The color-coded elements help distinguish between different data points, making complex information easily digestible. Ideal for sales managers and teams, this template aids in analyzing trends, identifying growth opportunities, and planning future sales strategies. Compatible with PowerPoint, Keynote, and Google Slides, it's a vital tool for effective sales presentations.


6 slides
Project Scope and Expansion Scale Presentation
Display growth areas and operational coverage with this segmented radial chart. Ideal for showcasing project reach, departmental impact, or phase distributions, each section includes editable icons and labels. Perfect for strategy updates, expansion pitches, or status reporting. Fully customizable in PowerPoint, Keynote, and Google Slides for professional presentations.


6 slides
IT Infrastructure and Services Management Presentation
Visualize key operations clearly with the IT Infrastructure and Services Management Presentation. This slide features a circular diagram paired with five editable content blocks—perfect for mapping infrastructure elements like networks, servers, and tools. The icon-ring design adds clarity and structure to complex workflows. Fully compatible with PowerPoint, Keynote, and Google Slides.


20 slides
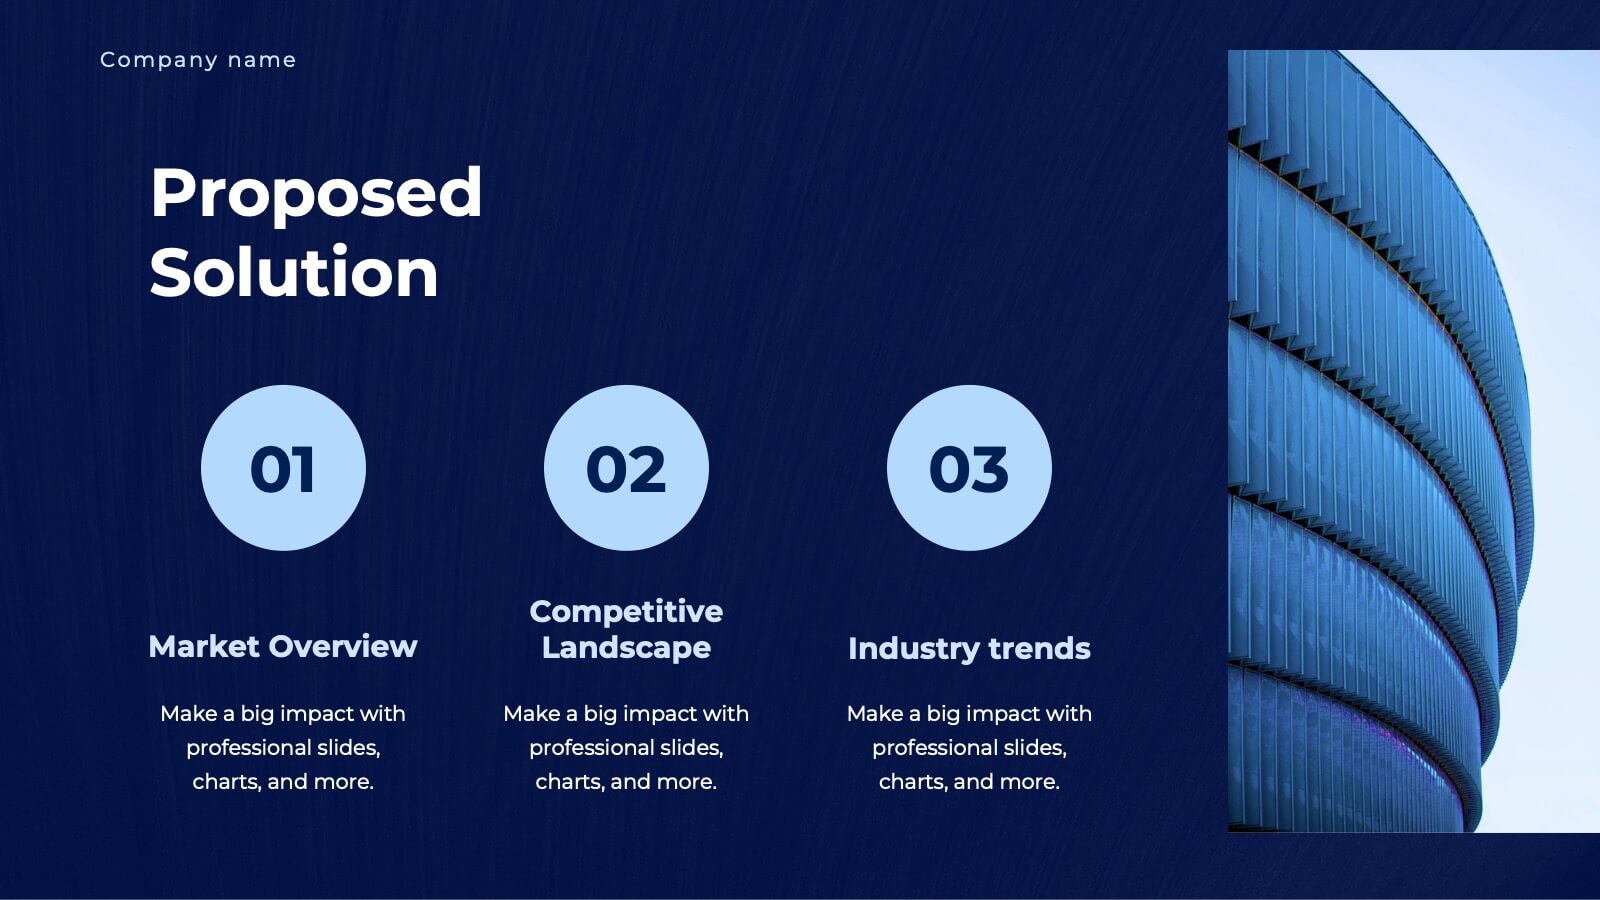
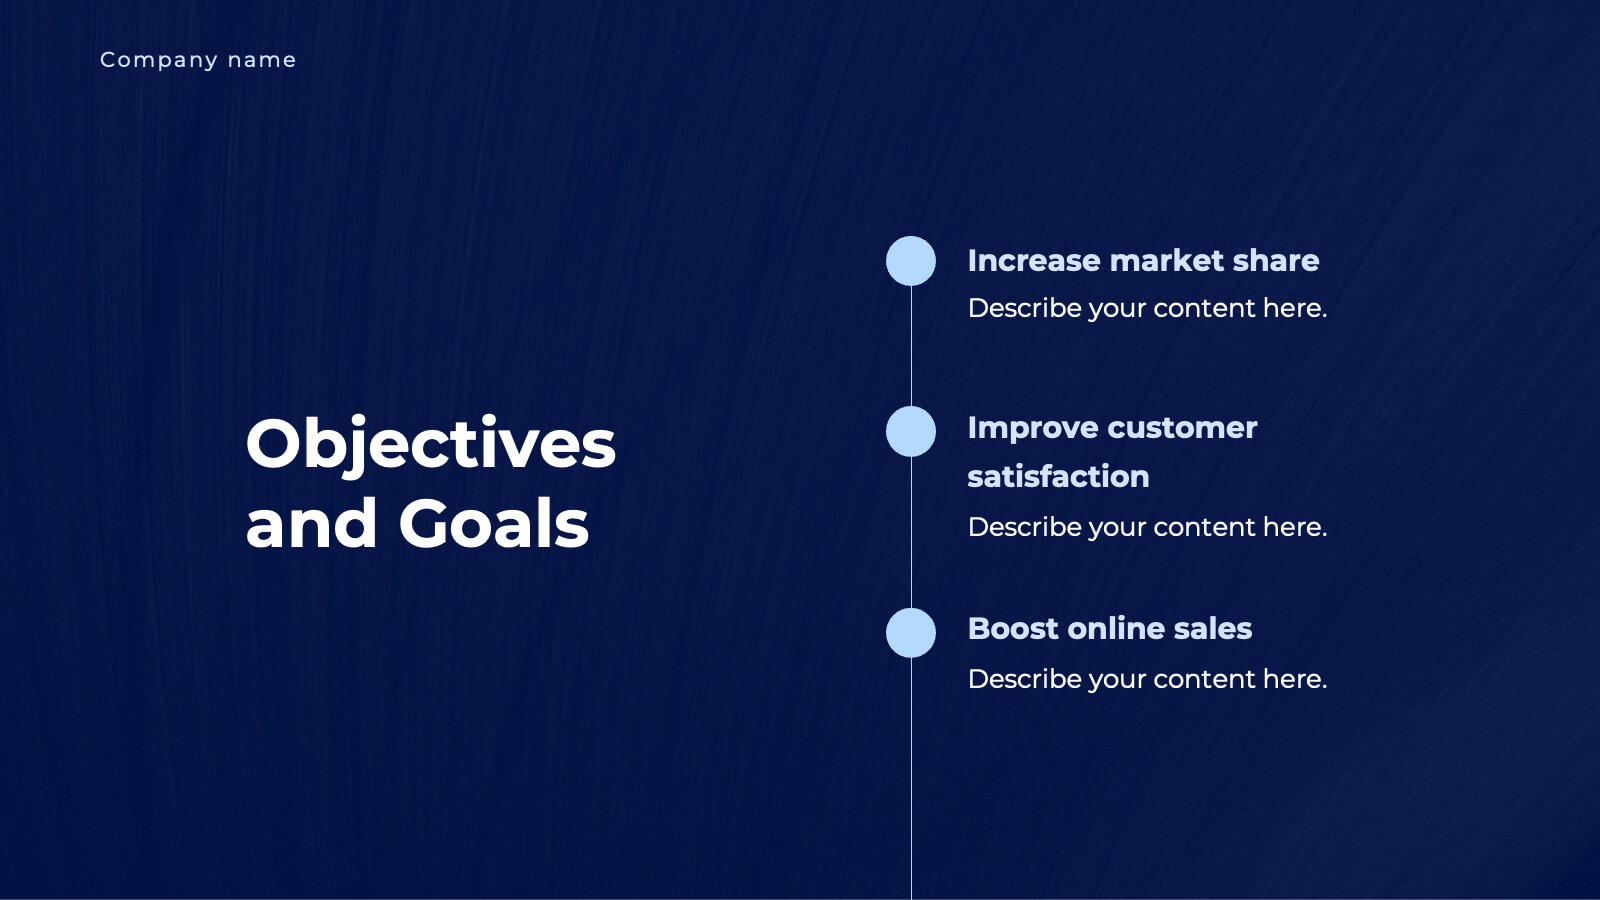
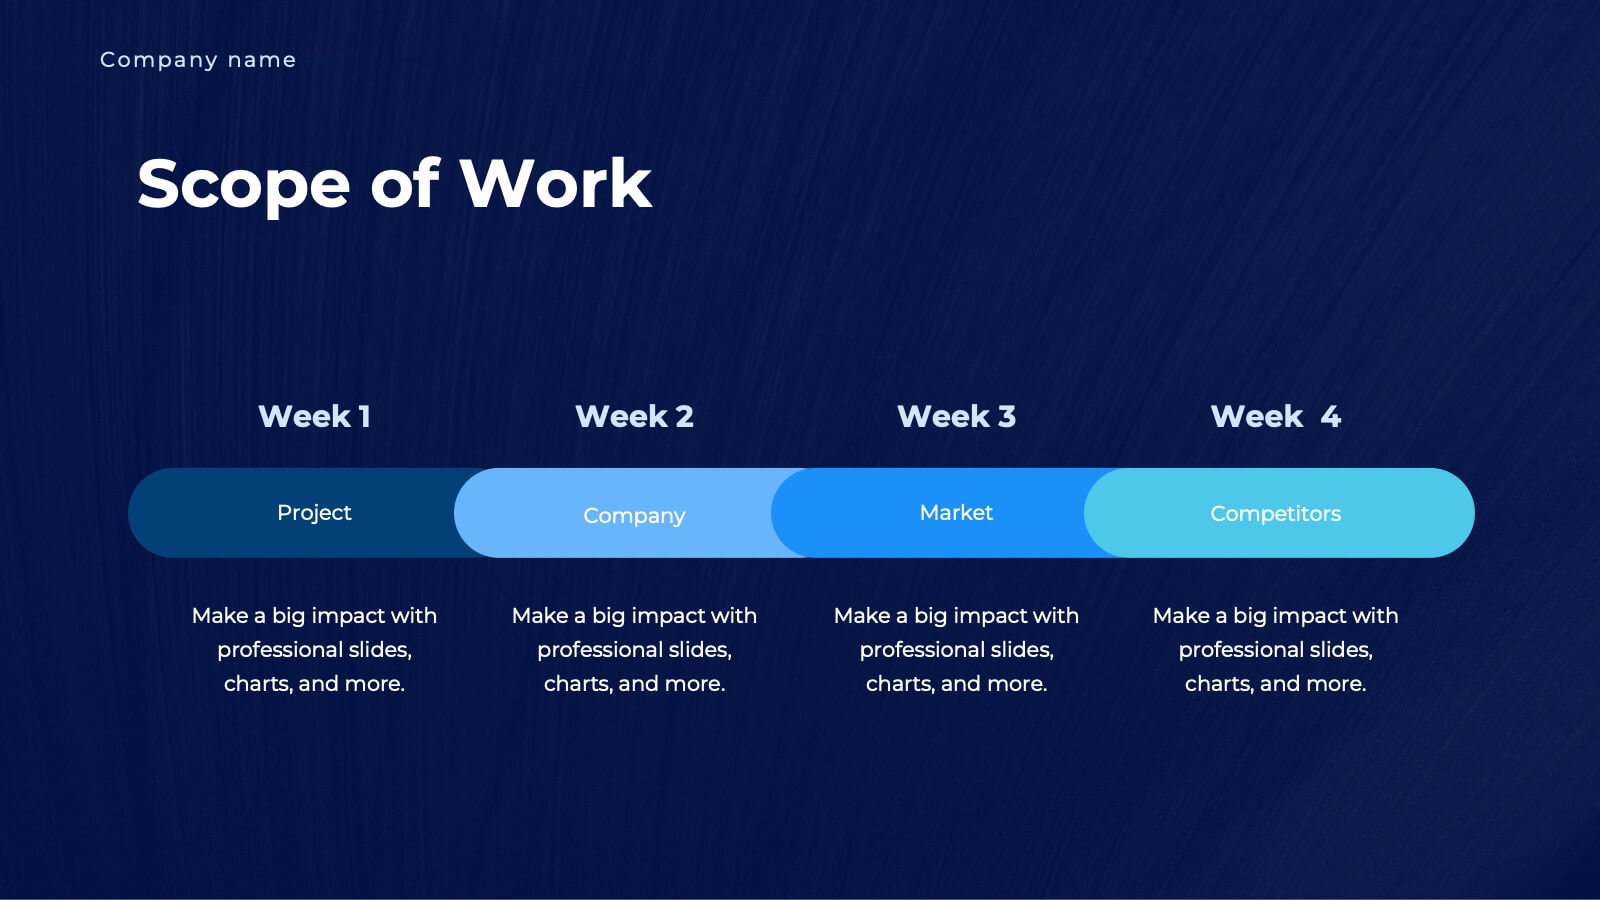
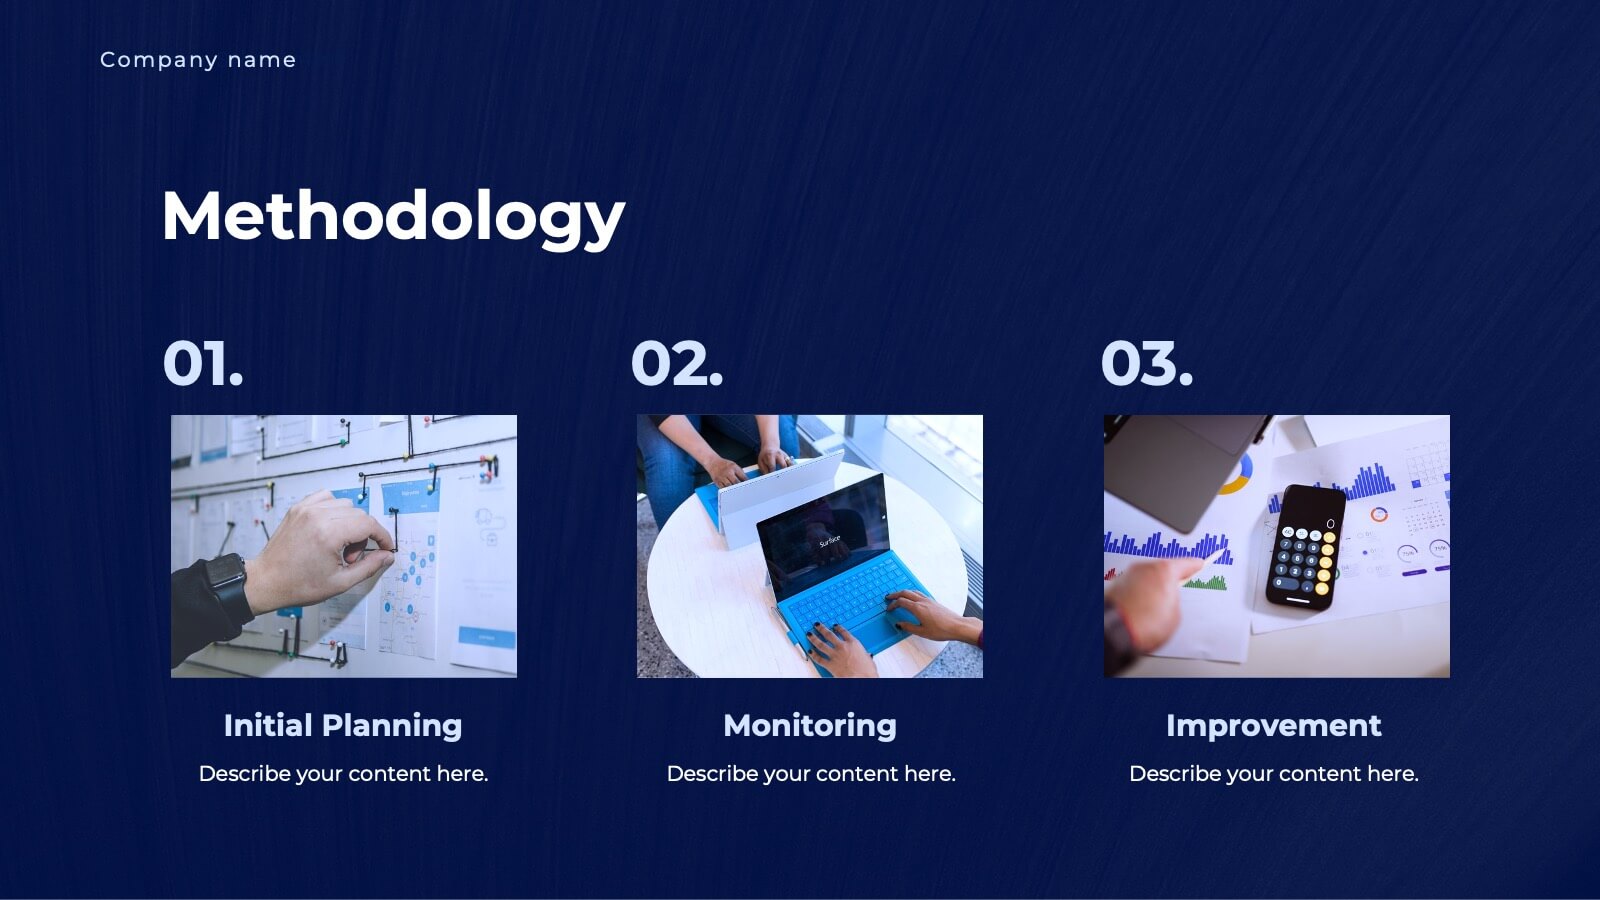
Unity Business Proposal Presentation
Take your business proposals to the next level with this elegant and comprehensive template! Perfect for presenting company overviews, project summaries, and detailed solutions. Ideal for business professionals looking to impress clients and stakeholders. Compatible with PowerPoint, Keynote, and Google Slides, this template ensures your proposals are impactful and professional.


26 slides
Wilten Presentation Template
This template is a design foundation, and has been built with modern esthetic principles. The shapes are organic and earthy, with image place holders to allow customization. Designed for companies that have a strong connection to nature and the aesthetic, who wants to go beyond just being organic. Wilten template allows you to save time while getting the best result possible. A great clean modern template for creative agencies, business or branding deck. Enhance your presentations with this minimalistic design and impress your audience with smart ideas.


5 slides
Team Roles and Collaboration Flow Presentation
Visualize how your team works together using the Team Roles and Collaboration Flow Presentation. This slide layout is designed to showcase key roles, responsibilities, and communication paths across sequential stages. Ideal for project managers, HR professionals, and team leads who need to define workflows clearly. Fully customizable in PowerPoint, Keynote, Canva, and Google Slides.


7 slides
Marketing Strategy Wheel Infographic
Our Marketing Strategy Wheel Infographic is an invaluable asset for marketers, strategists, and business leaders. This visual tool is designed to outline the multi-faceted approach required for a successful marketing strategy, incorporating various elements that contribute to a comprehensive marketing plan. The infographic displays sections like market analysis, goal setting, budget allocation, and action plans in a circular layout, symbolizing the interconnected nature of marketing efforts. By presenting these components, the infographic serves as a guide for developing a balanced and effective marketing strategy. You can tailor this infographic to include specific tactics, channels, and metrics relevant to your organization, making it a versatile tool for internal strategy sessions, client presentations, or marketing education. This SEO-optimized graphic is crafted to communicate complex marketing plans in an accessible and engaging manner. Use our Marketing Strategy Wheel Infographic to visually communicate your marketing plan's structure and components, ensuring a holistic approach to reaching your business objectives.


26 slides
Tempo Brand Identity Presentation
Introduce and elevate your brand with this versatile presentation template designed to reflect your company's vision and values. Perfect for businesses looking to showcase their brand strategy, components, and touchpoints with clarity and professionalism. This presentation features thoughtfully designed slides covering brand identity components, visual guidelines, target audience insights, and future development plans. Use dedicated sections to outline your unique selling proposition, positioning, and strategy. With its clean layout and attention to detail, it's ideal for presenting a cohesive and impactful brand narrative. Compatible with PowerPoint, Google Slides, and Keynote, this template is fully customizable. Edit colors, text, and images to align with your brand aesthetics and messaging. Deliver your presentation with confidence, ensuring your audience is inspired by a polished and professional brand identity.


10 slides
Africa Market Potential and Growth Map Presentation
Unlock business opportunities with the Africa Market Potential and Growth Map template, designed to showcase market analysis and growth trends across different African regions. It features a map highlighting specific countries coupled with adjustable data bars reflecting market potential percentages. This template is ideal for presentations focusing on market trends, investment opportunities, and growth forecasts in Africa.


5 slides
Investor-Ready Business Pitch Plan Presentation
Make your business roadmap stand out with this dynamic visual journey, perfect for impressing investors from the first slide. This infographic-style pitch deck helps clearly outline your business strategy across five milestones, using vibrant colors and icons for easy comprehension. Fully compatible with PowerPoint, Keynote, and Google Slides.


5 slides
Marketing Concepts Infographics
Marketing Concepts refer to the various strategies and philosophies that guide the marketing efforts of businesses and organizations. Our marketing concept infographics are visual representations of the different marketing concepts and strategies that businesses use to promote their products or services. These infographics can cover a wide range of marketing topics, including target audience, product positioning, branding, advertising, and video marketing. The purpose of these infographics is to provide a easy-to-understand overview of key marketing concepts that businesses can use to drive sales and increase brand awareness.


5 slides
User-Centered Design with Empathy Map Presentation
Improve User Insights with the Empathy Map for User-Centered Design! This User-Centered Design with Empathy Map template provides a structured approach to understanding user behaviors, motivations, and needs. Designed with clear quadrant sections, this template helps teams map out key insights for UX research, customer journey mapping, and product development. Ideal for designers, marketers, and strategists, this fully editable slide deck works seamlessly with PowerPoint, Keynote, and Google Slides for a hassle-free customization experience.


15 slides
Business Journal Infographic
A Business Journal Infographic is a visual representation of data, information, or concepts related to business topics that typically follow the style and format often found in business journals or publications. This infographic is designed to present complex information quickly and clearly. The purpose of this is to convey information in a visually engaging and easily digestible format, making it easier for readers to grasp complex business concepts or data. With this template transform your business narrative into a captivating visual story that not only informs but inspires readers to delve into the world of entrepreneurship.


2 slides
Digital Mockup Screens for Apps Presentation
Showcase your app in action with the Digital Mockup Screens for Apps Presentation. This bold and modern slide layout centers your mobile UI on colorful abstract shapes, drawing attention to your product. Ideal for startup demos, app features, or UI/UX portfolios. Fully editable in PowerPoint, Keynote, Canva, and Google Slides.


26 slides
Azahar Presentation Template
Azahar is a perfect modern template with a clean and professional feel. This theme can help your business connect with clients through an easy to understand template. Azahar was designed by professionals to help businesses connect with their audience. It has a modern, chic aesthetic and very detailed look. The colors are fresh which help keep the look clean and easy to read. The theme comes packed with features to target your audience and get your message across. Charts, timelines and easy to edit text, this template is perfect for businesses seeking to make an impression on their audience.


6 slides
DMAIC Six Sigma Framework Presentation
Dive into process perfection with our DMAIC Six Sigma Framework template! This visually appealing guide breaks down each phase—Define, Measure, Analyze, Improve, and Control—making it easier to streamline operations and enhance quality. Fully compatible with PowerPoint, Keynote, and Google Slides, it's designed for professionals dedicated to operational excellence and continuous improvement.


4 slides
Creative Thinking and Brain Functions Presentation
Illuminate cognitive processes with the Creative Thinking and Brain Functions Presentation. Featuring a clean mind map-style layout with illustrated heads and title blocks, this slide is ideal for showcasing mental models, decision paths, or concept relationships. Fully editable in PowerPoint, Canva, and Google Slides for effortless customization.