


Features
- 5 Unique slides
- Fully editable and easy to edit in Microsoft Powerpoint, Keynote and Google Slides
- 16:9 widescreen layout
- Clean and professional designs
- Export to JPG, PDF or send by email


Do you have any questions?
Recommend


6 slides
Business Tree Diagram Layout Presentation
Bring your ideas to life with a dynamic visual flow that connects every stage of your business strategy. Perfect for mapping growth, processes, or team structures, this clean and modern layout keeps your data clear and engaging. Fully compatible with PowerPoint, Keynote, and Google Slides for effortless customization.


5 slides
Porter's Five Forces Competitive Analysis Presentation
Illustrate market dynamics and industry competitiveness using Porter’s Five Forces. This template covers New Entrants, Buyer Power, Supplier Power, Substitutes, and Customer Power in a clean, letter-coded format. Fully editable in PowerPoint, Keynote, and Google Slides, it's perfect for strategic analysis and investor presentations. Clear, structured, and easy to customize.


5 slides
Online Advertising and SEO Marketing Presentation
Elevate your digital marketing strategy with this engaging infographic template! Designed for clarity, it simplifies online advertising and SEO concepts, covering key metrics, trends, and strategies. Perfect for teams, clients, or stakeholders, it’s fully customizable and compatible with PowerPoint, Keynote, and Google Slides for seamless presentations that captivate and inform.


4 slides
Lead Nurturing Funnel Breakdown Presentation
Guide leads through every stage with the Lead Nurturing Funnel Breakdown Presentation. This slide visualizes the customer journey from awareness to conversion, helping you present marketing automation, CRM strategies, or content funnels. Fully customizable in PowerPoint, Google Slides, and Canva for seamless integration.


6 slides
Asia Colonization Map Infographics
Discover the versatility of our Asia Colonization Map infographic template, a powerful tool for visualizing the historical impact of colonization across the diverse continent of Asia. This template is fully compatible with popular presentation software like PowerPoint, Keynote, and Google Slides, enabling effortless customization to suit your specific needs. The Asia Colonization Map infographic template offers a robust foundation for illustrating colonization timelines, colonial powers, and regions affected by colonization throughout Asia's rich history. Whether you're a historian, educator, or simply intrigued by Asia's colonial past, this template provides a user-friendly platform to create engaging presentations and informative materials. Impress your audience with this SEO-optimized Asia Colonization Map infographic template, expertly designed for clarity and ease of use. Tailor it to showcase the historical narratives, impact, and legacies of colonization in Asia, making it a valuable asset for your projects and presentations. Start crafting your personalized infographic today!


7 slides
Stakeholder Strategy Infographic
Empower your organization's approach to its stakeholders with our stakeholder strategy infographic. Colored in a mix of vibrant orange, crisp white, and bold red, this infographic not only informs but also captures attention. Ideal for business strategists, project managers, and team leaders, it visually dissects the intricate layers of stakeholder engagement and strategy. Its design includes specialized graphics, tailored icons, and strategic image placeholders to guide your storytelling. Whether you're presenting in PowerPoint, Keynote, or Google Slides, this template is your key to a well-orchestrated stakeholder communication.


6 slides
Future Trends in Tech Presentation
Forecast innovation with clarity using this Future Trends in Tech Presentation. Designed with a modern silhouette head and brain visualization, this slide emphasizes key trend comparisons using icon-labeled callouts and bold percentage highlights. Ideal for tech forecasting, AI adoption, or market prediction topics. Fully editable in PowerPoint, Keynote, and Google Slides—available in both light and dark modes.


23 slides
Dragonveil Product Launch Pitch Deck Presentation
The Product Launch Pitch Deck Presentation Template features 23 fully customizable slides designed to outline key aspects such as market opportunity, revenue model, and sales strategy. Ideal for startups and businesses launching new products, it ensures a compelling pitch. Compatible with PowerPoint, Keynote, and Google Slides.


5 slides
Business Success Case Study Presentation
Showcase impactful results with the Business Success Case Study Presentation template. This structured layout highlights key milestones, challenges, and solutions in a visually engaging format, making it perfect for demonstrating business achievements and growth strategies. Fully editable and compatible with PowerPoint, Keynote, and Google Slides, it’s ideal for case studies, reports, and business reviews.


10 slides
Product Development Empathy Mapping Presentation
Enhance Product Development with Empathy Mapping! This Product Development Empathy Mapping template provides a structured framework to visualize user insights, emotions, and needs. Featuring a quadrant-based layout, it allows product managers, UX designers, and business strategists to analyze user experiences and make informed decisions. Fully customizable in PowerPoint, Keynote, and Google Slides, this template ensures a professional and engaging approach to customer-centric design.


10 slides
Project Responsibility Chart Presentation
Streamline your project management with our Project Responsibility Chart template. Designed to clarify roles and tasks across your team, this color-coded chart ensures transparency and efficiency. Ideal for project leads to assign duties clearly and effectively. The template supports PowerPoint, Keynote, and Google Slides, making it versatile for any team environment.


6 slides
Canvas Breakdown for Startup Strategy Presentation
Break down your startup strategy with this streamlined canvas layout. Designed for clarity and flow, this slide presents six core components in a visually engaging format. Ideal for early-stage founders, innovation teams, and pitch decks, it simplifies complex business models into clear, actionable sections for strategic alignment and storytelling.


7 slides
Innovation Strategy Infographic Presentation
An Innovation Infographic presents information related to innovation, including why it is important, and how it can be managed in different contexts. Innovation is the process of developing new ideas and products that create value and drive progress. This template is designed to help you effectively communicate the importance of innovation and provide tips and strategies for managing it. This template includes seven customizable layouts and charts, and allows you to include your own images. The template also includes editable text boxes and bullet points to present your information.


5 slides
Climate Change Awareness Presentation
Deliver impactful environmental messages with this thermometer-style infographic layout. Ideal for visualizing temperature rise, emissions levels, or awareness metrics, each slide segment represents a stage of climate impact. Perfect for educators, NGOs, sustainability experts, or policy presentations. Fully customizable in PowerPoint, Keynote, and Google Slides.


22 slides
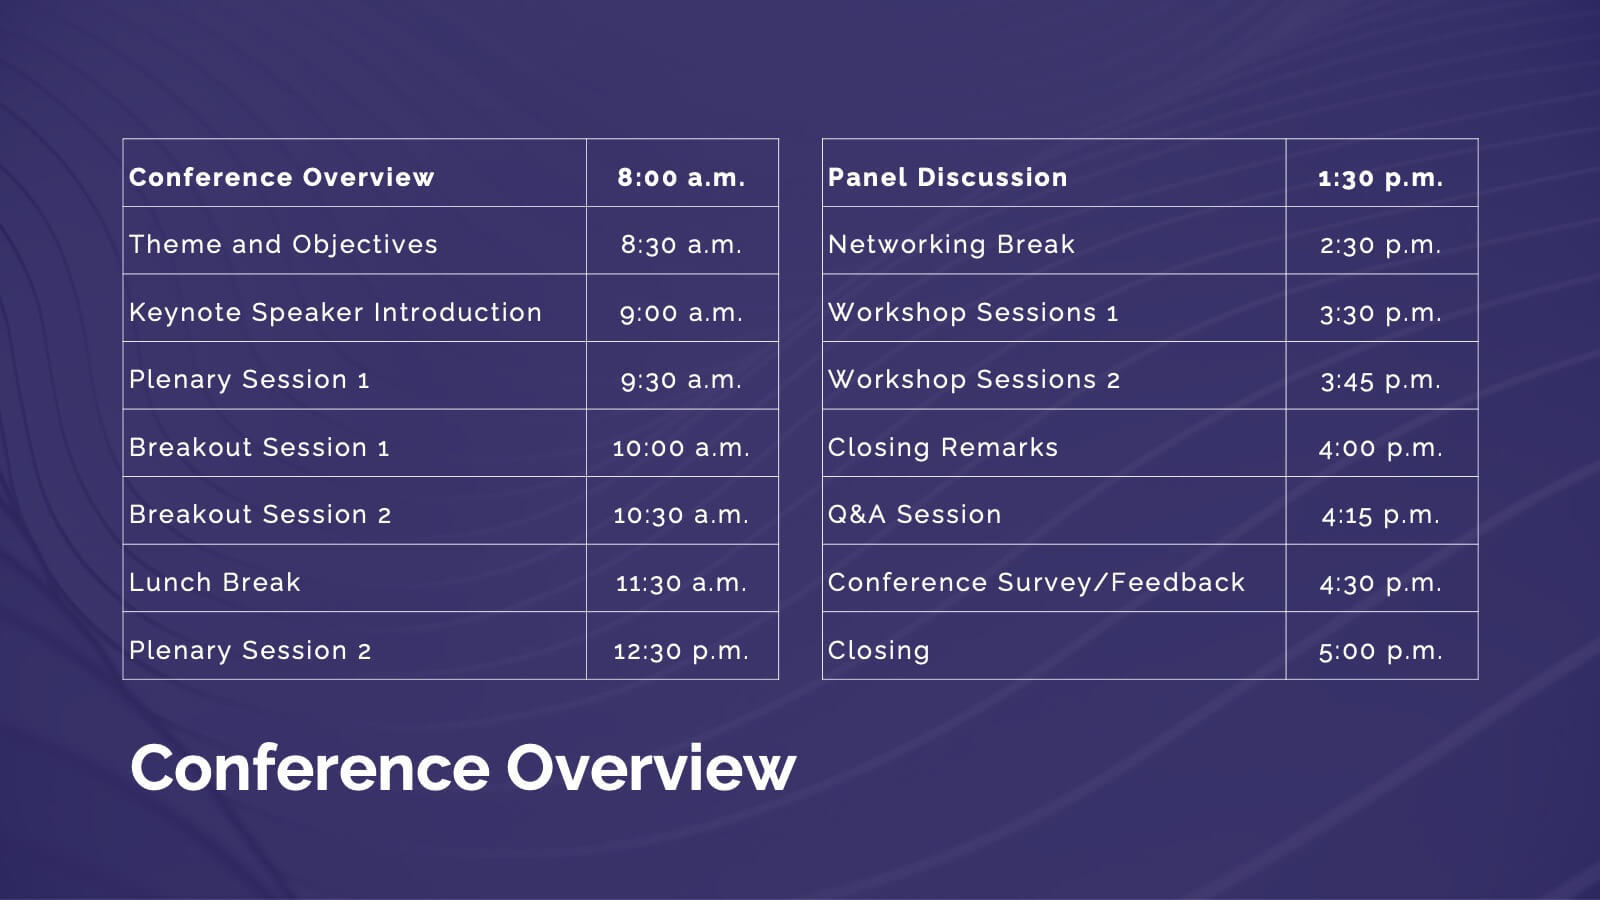
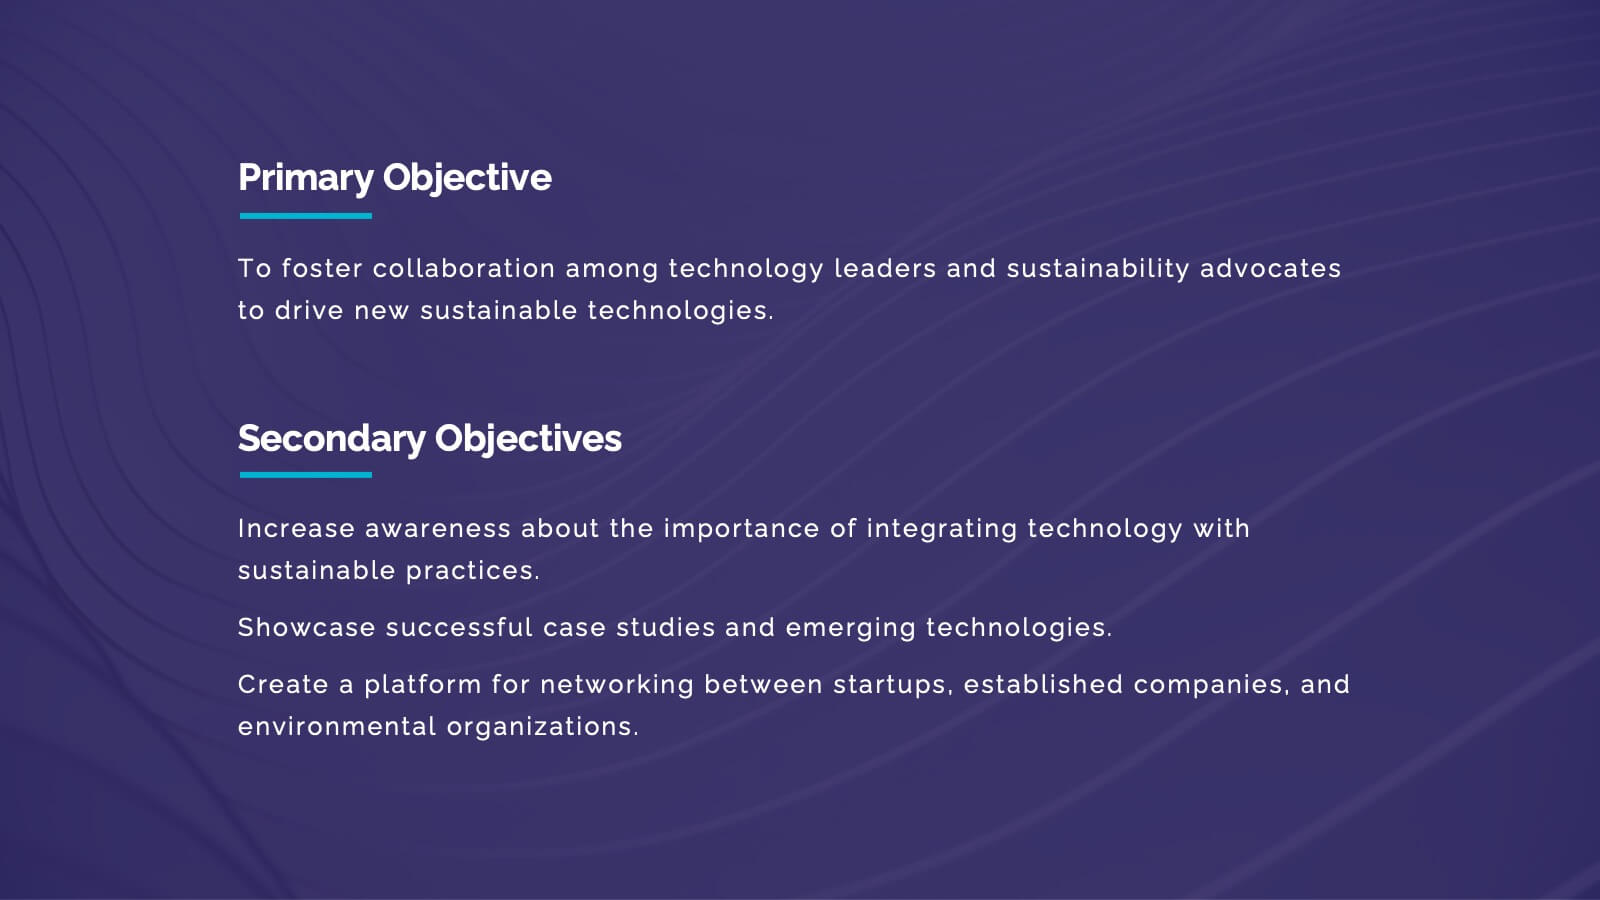
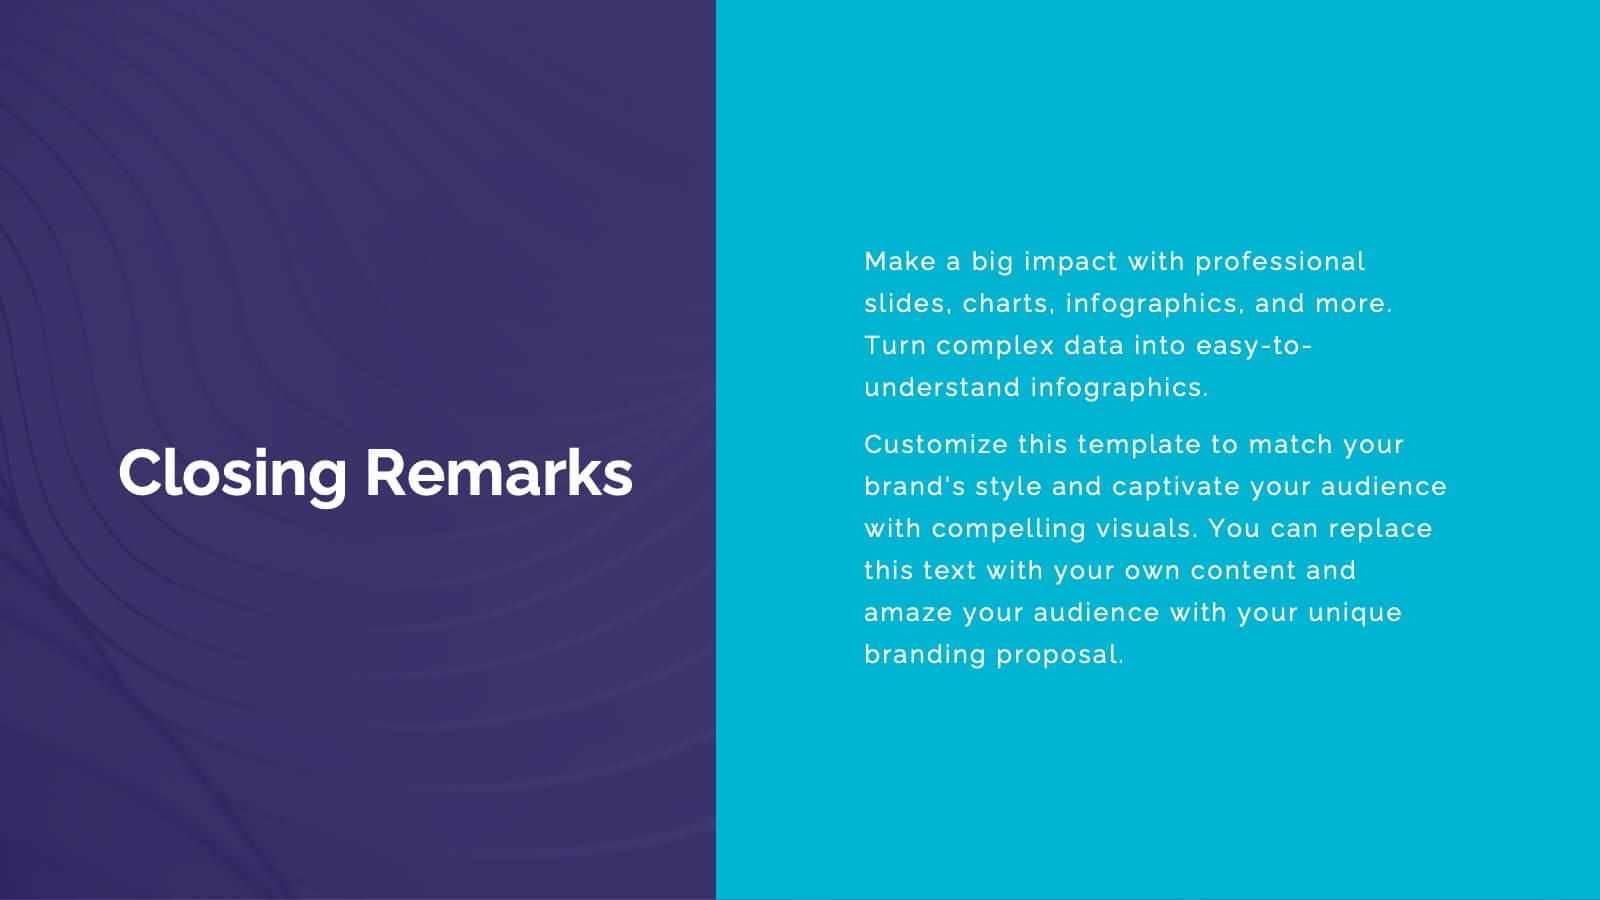
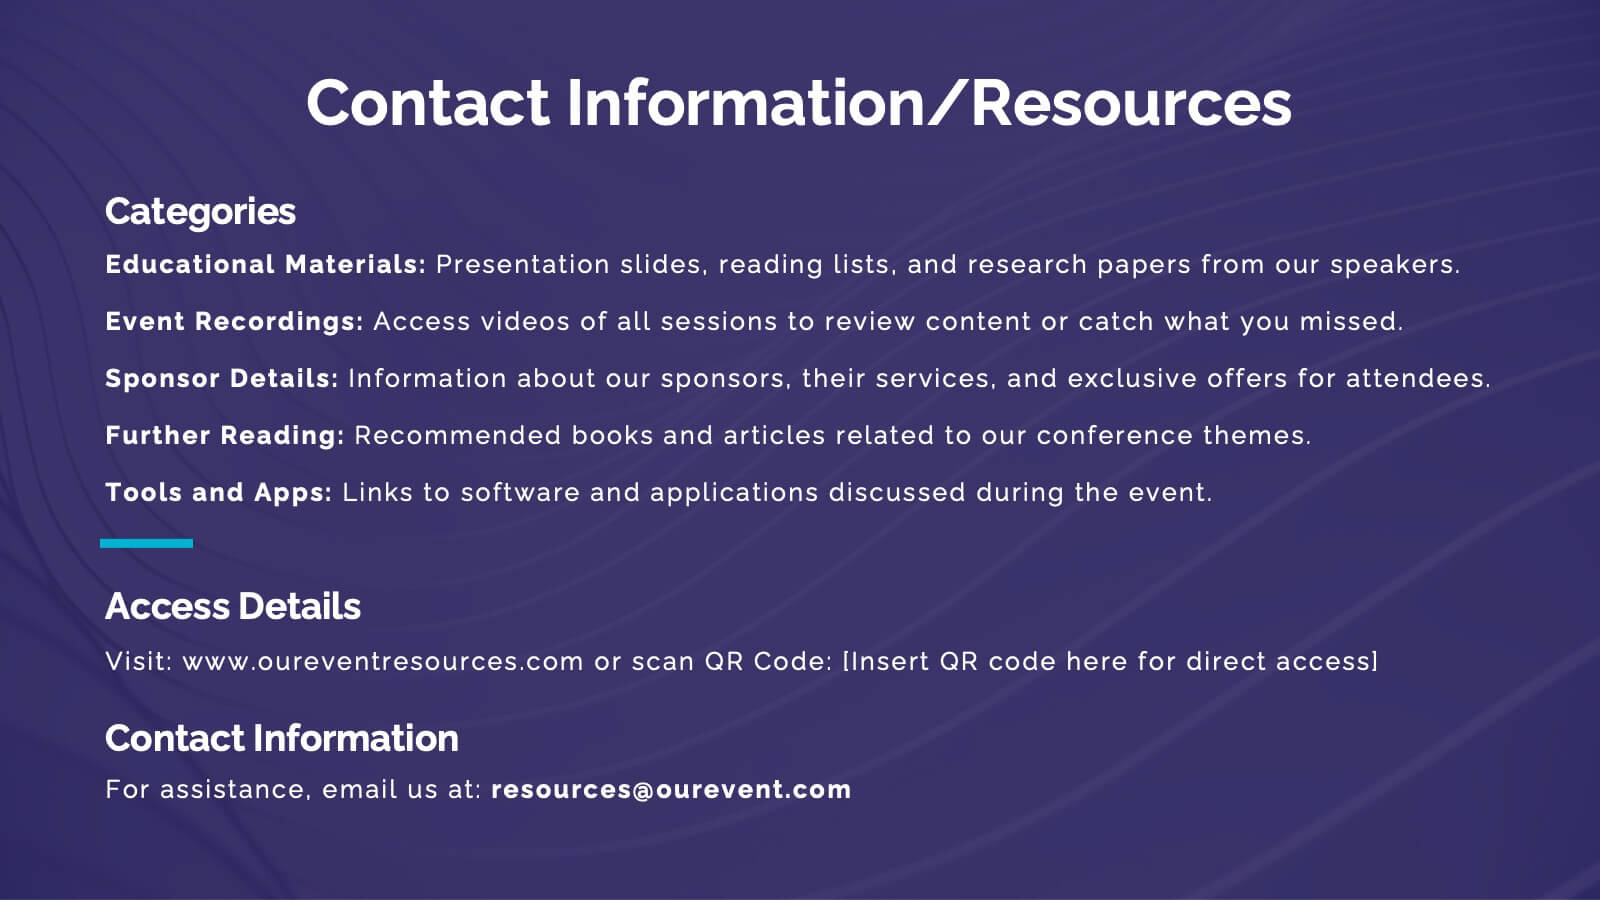
Nimbus Business Development Proposal Presentation
Boost your business presentations with this vibrant, professional template designed for business development proposals. Perfect for detailing conference overviews, themes, objectives, and keynotes, it features a clean and engaging layout. Highlight critical sessions and networking opportunities to captivate your audience. Compatible with PowerPoint, Keynote, and Google Slides, it ensures seamless presentations on any platform.


8 slides
Business Challenge & Solution Presentation
Address complex issues with clarity using this business challenges and solutions presentation. Featuring a chess knight visual, it helps outline problems and corresponding strategies. Ideal for strategic planning, risk management, and executive briefings. Fully customizable in PowerPoint, Keynote, and Google Slides to fit your corporate or consulting presentation needs.


26 slides
Beginner's Guide to Investing Presentation
This presentation template is a fantastic starting point for anyone looking to dive into the world of investing. Designed with clarity and accessibility in mind, it caters specifically to beginners eager to understand the fundamentals of investment strategies and options. The template introduces users to the basics of stocks, bonds, and other investment vehicles, using easy-to-understand language and clear, informative visuals. The content is laid out in a logical sequence, beginning with basic concepts and gradually progressing to more complex investment ideas and strategies. Slides are enriched with diagrams, charts, and comparison tables that break down financial data and trends in a digestible format. Key investment terms are explained through engaging infographics that make learning both interactive and effective. To ensure a broad usability range, the template is fully compatible with popular presentation platforms such as PowerPoint, Google Slides, and Keynote. This compatibility allows users to easily adapt and present the information across different devices and settings, making it an invaluable tool for personal education or group training sessions in various learning environments.