


Features
- 6 Unique slides
- Fully editable and easy to edit in Microsoft Powerpoint, Keynote and Google Slides
- 16:9 widescreen layout
- Clean and professional designs
- Export to JPG, PDF or send by email


Do you have any questions?
Recommend


6 slides
Restaurant Branding Food Presentation
Bring your ideas to life with a presentation that feels fresh, playful, and full of personality. This layout helps you showcase food branding concepts, menu themes, and visual identity elements in a clear, engaging flow that’s easy for audiences to follow. Fully compatible with PowerPoint, Keynote, and Google Slides.


6 slides
United States Coronavirus Map
A United States Coronavirus Map is a graphical representation that displays the spread of the coronavirus (COVID-19) across the United States. This infographic template may use different colors, shades, or symbols to indicate the severity of COVID-19 cases in different areas. Darker colors may represent higher case numbers, while lighter colors may represent lower case numbers. These maps are valuable tools to track the progression of the virus, identify hotspots, and make informed decisions related to public health. This can also help raise awareness about the importance of preventive measures and promote data-driven strategies to control the spread.


5 slides
Annual Overview Report Template Presentation
Bring your yearly achievements to life with this sleek and structured layout designed for clarity and impact. Ideal for summarizing company performance, milestones, and future goals, it organizes data into easy-to-follow visuals. Fully editable and compatible with PowerPoint, Keynote, and Google Slides for a smooth presentation experience.


6 slides
Project Gantt Chart Presentation
This Project Gantt Chart Presentation helps visualize your project timeline with clarity. Featuring six tasks, weekly progress bars, and colorful icons, it’s ideal for tracking milestones. Fully customizable and easy to edit, this slide works seamlessly in PowerPoint, Keynote, and Google Slides for organized, professional project management presentations.


7 slides
North America Language Map Infographic
Embark on a visual odyssey across the vast terrains of North America with our expertly crafted map infographic. Painted in the expansive blue, the lush green, the vibrant yellow, and the warm orange, our template captures the essence of North America's diverse geographies and cultures. Adorned with accurate infographics, distinct icons, and region-specific image placeholders, it provides a panoramic view of the continent's multifaceted landscape. Flawlessly tailored for Powerpoint, Keynote, or Google Slides. An indispensable tool for educators, travelers, geographers, or businesses targeting the North American market. Navigate with purpose; let every slide be a step into North America's captivating expanse.


12 slides
Sales Metrics Dashboard Presentation
Unlock a sharper view of your sales story with a clean, data-driven layout that highlights performance trends at a glance. This presentation organizes KPIs, charts, and progress indicators into an easy-to-follow dashboard that supports smarter decision-making. Fully compatible with PowerPoint, Keynote, and Google Slides.


4 slides
Blockchain and Cryptocurrency Market Analysis Presentation
Present complex blockchain structures and crypto market layers with clarity using the Blockchain and Cryptocurrency Market Analysis presentation template. Featuring a stacked cylinder diagram with four interactive data points, this layout is ideal for breaking down transaction flows, network layers, or decentralized finance (DeFi) ecosystems. Each title block offers space for concise key insights. Best suited for blockchain consultants, fintech startups, and crypto analysts. Fully compatible with PowerPoint, Keynote, and Google Slides.


6 slides
Geometric Patterns Infographics
Step into the fascinating realm of geometric patterns! This infographic invites you to explore the captivating world of shapes and symmetries. From the mesmerizing allure of intricate designs to the mathematical precision behind each pattern, we'll reveal the secrets that make geometric patterns a timeless art form. Delve into the core principles of geometric patterns. Gain insights into the geometry behind these intricate designs, from basic shapes like circles and squares to more complex constructions. Uncover the history and cultural significance of these patterns, from ancient civilizations to contemporary art and design. With this captivating infographic, compatible with PowerPoint, Keynote, and Google Slides, sharing your enthusiasm for geometric patterns has never been easier. Empower yourself with the knowledge to appreciate and create these mesmerizing designs. Dive into the world of geometric patterns and embark on a journey of artistic exploration and appreciation.


5 slides
Monthly Sales Report Infographics
A monthly sales report is a document that provides an overview of a company's sales performance during a specific month. These infographic templates are perfect for sales managers, business owners, or analysts who want to present monthly sales performance and trends to stakeholders, team members, or clients. This is an effective tool for presenting sales data in a visually engaging and comprehensive way. With these templates, you can create professional and impactful sales reports that effectively convey the story behind the numbers. Compatible with Powerpoint, Keynote, and Google Slides.


6 slides
Modern Agriculture Trends Presentation
Bring innovation to the forefront with this visually engaging presentation design. Perfect for highlighting sustainability practices, agri-tech developments, and market evolution, it helps communicate key insights with clarity and style. Fully customizable and compatible with PowerPoint, Keynote, and Google Slides for a polished, professional presentation experience.


6 slides
Cause-and-Effect Chain Using Fishbone Diagram Presentation
Break down complex issues step by step with the Cause-and-Effect Chain Using Fishbone Diagram Presentation. Ideal for project managers, analysts, or educators, this template helps you visually map out relationships between causes and outcomes. Fully editable in Canva, PowerPoint, and Google Slides for seamless integration into your workflow.


6 slides
5G Technology Rollout and Future Vision Presentation
From 1G to 5G, tell the story of progress with this visually engaging infographic slide. Perfect for showcasing mobile network evolution, telecom innovation, or digital transformation strategies, each stage is clearly marked for simple, informative storytelling. Fully compatible with PowerPoint, Keynote, and Google Slides for easy editing and seamless presentation.


26 slides
Flowers Bold Company Profile Presentation
Step into the enchanting garden of happy flowers, where petals dance and colors sing. Our template, awash in sunlit shades of pink, yellow, orange, and blue, encapsulates the very essence of floral joy. Bursting with vibrant graphics, whimsical icons, and cheerful image placeholders, it's a bouquet of design brilliance. Crafted to perfection for Powerpoint, Keynote, or Google Slides. A delightful pick for florists, garden enthusiasts, event planners, or anyone looking to infuse their presentation with a touch of nature's merriment. Blossom your ideas; let your presentations bloom with happiness.


21 slides
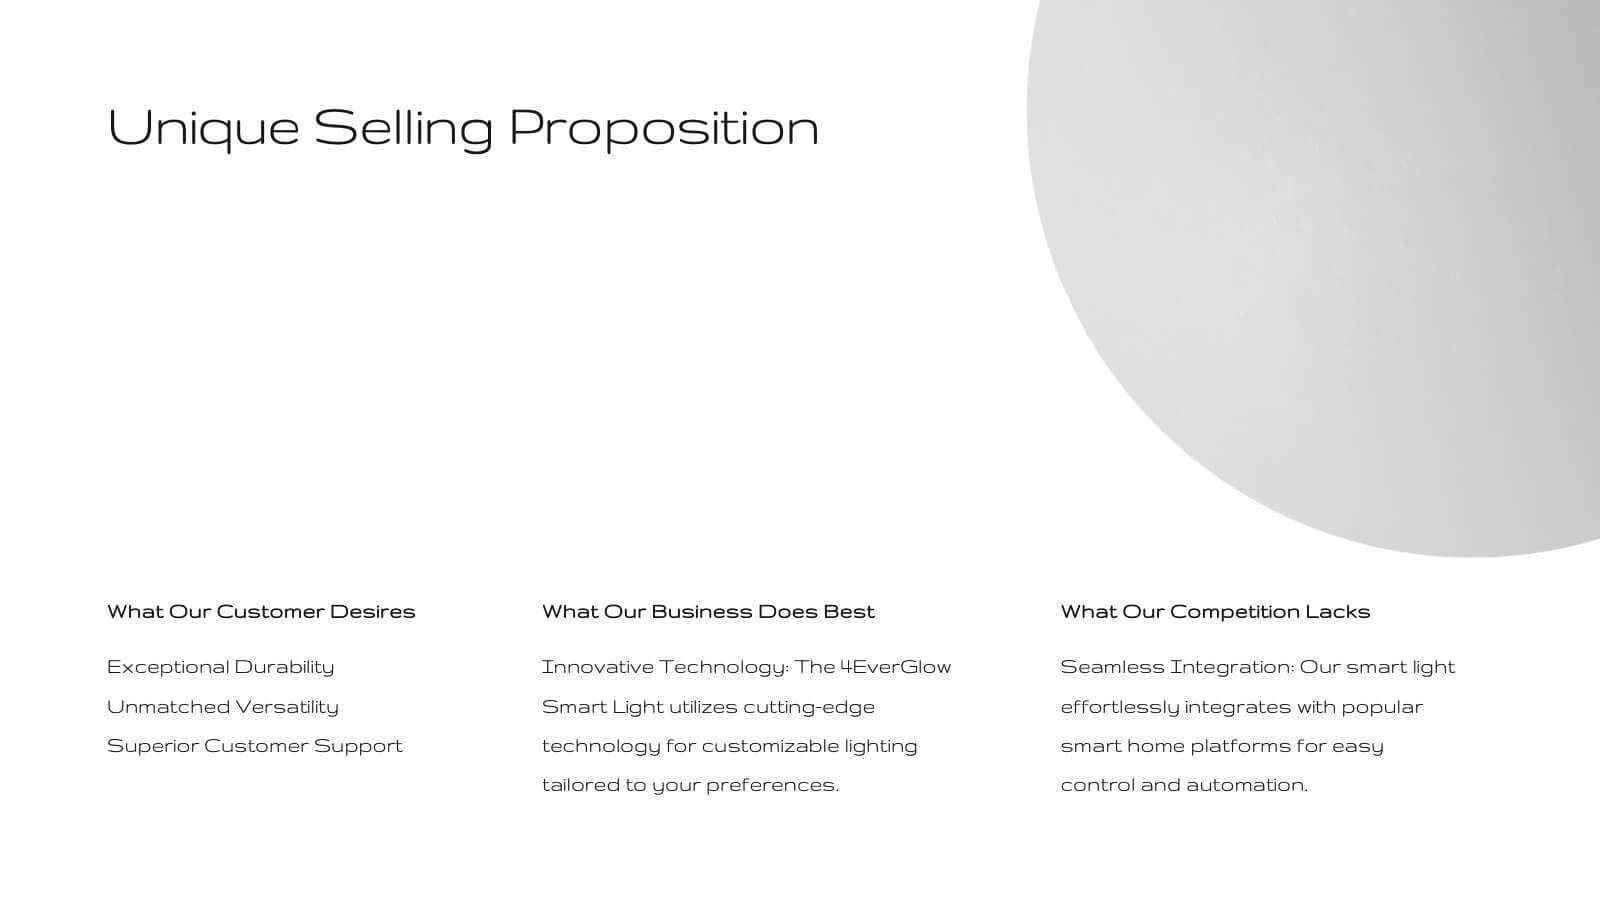
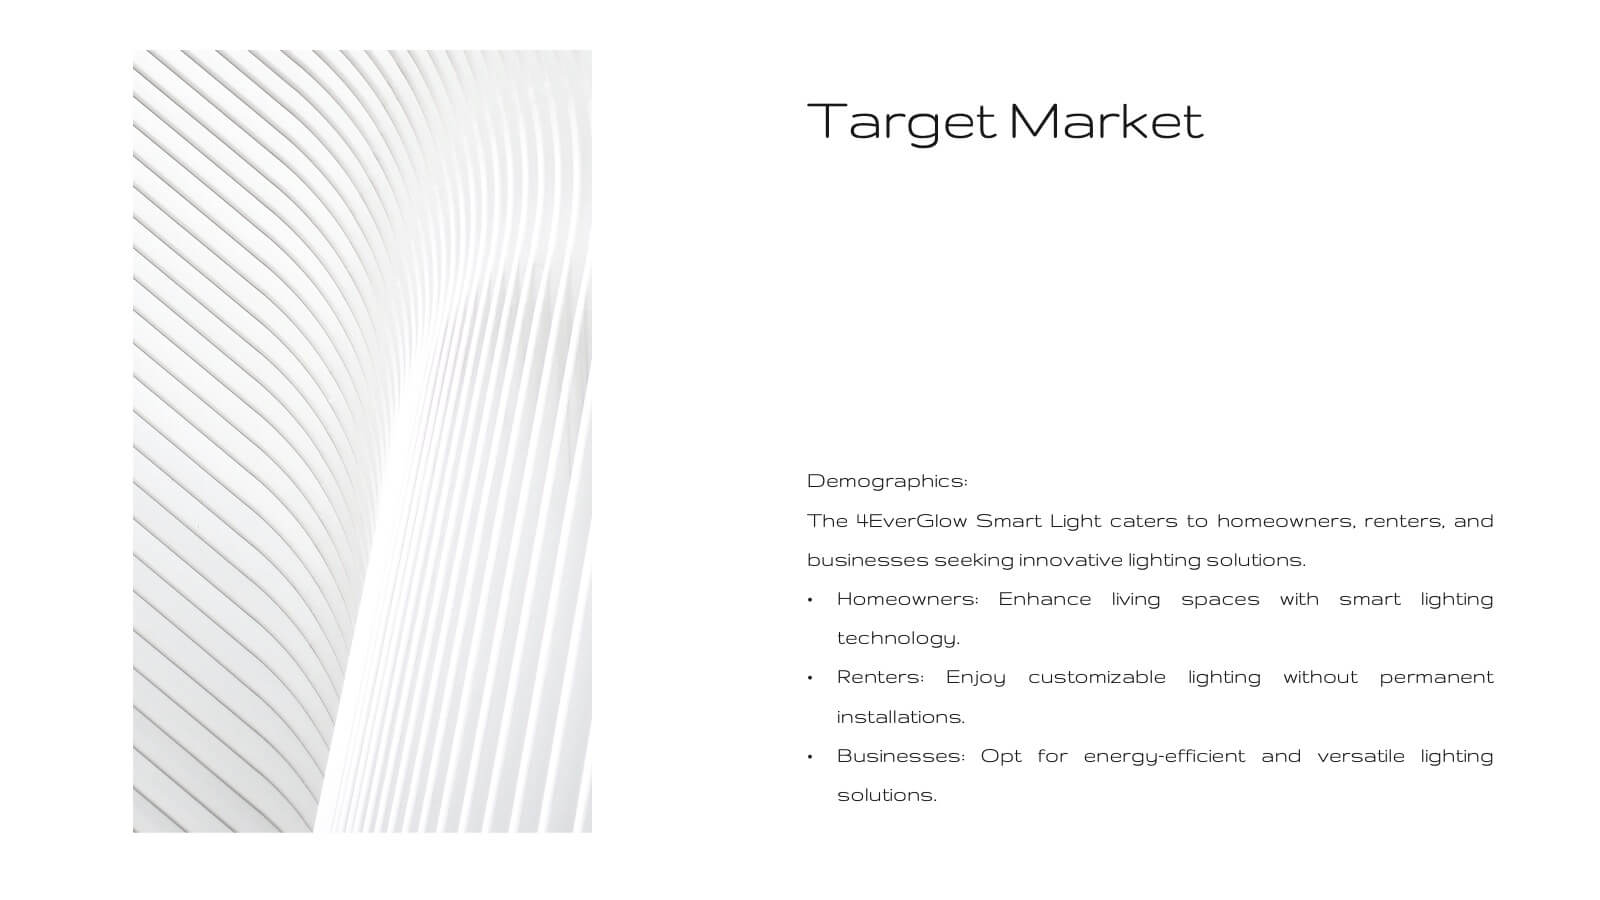
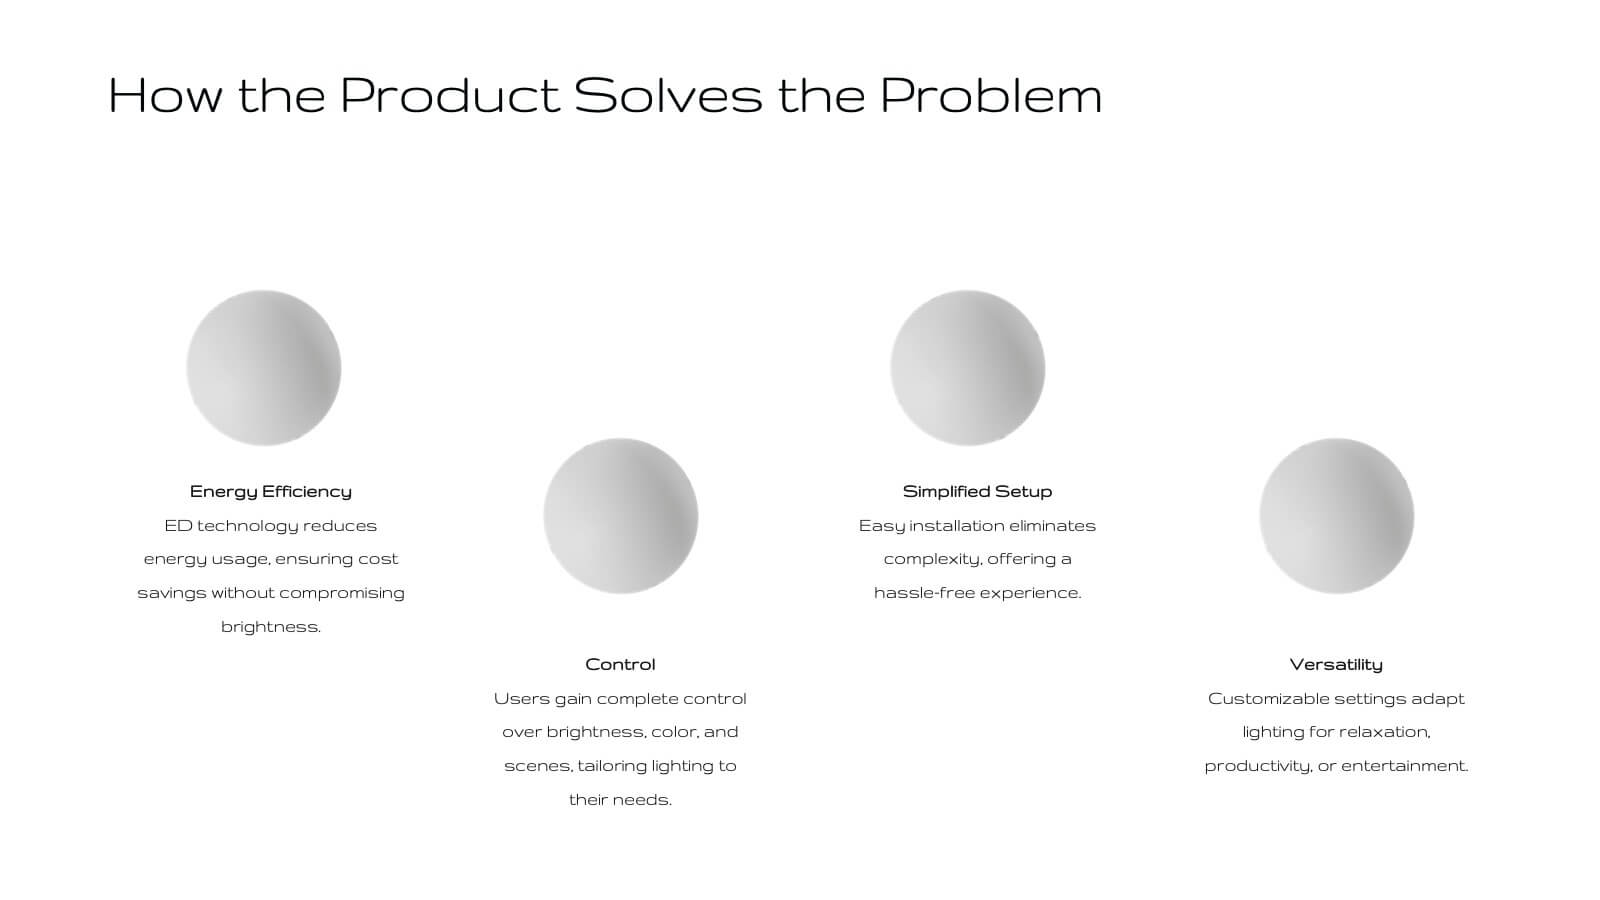
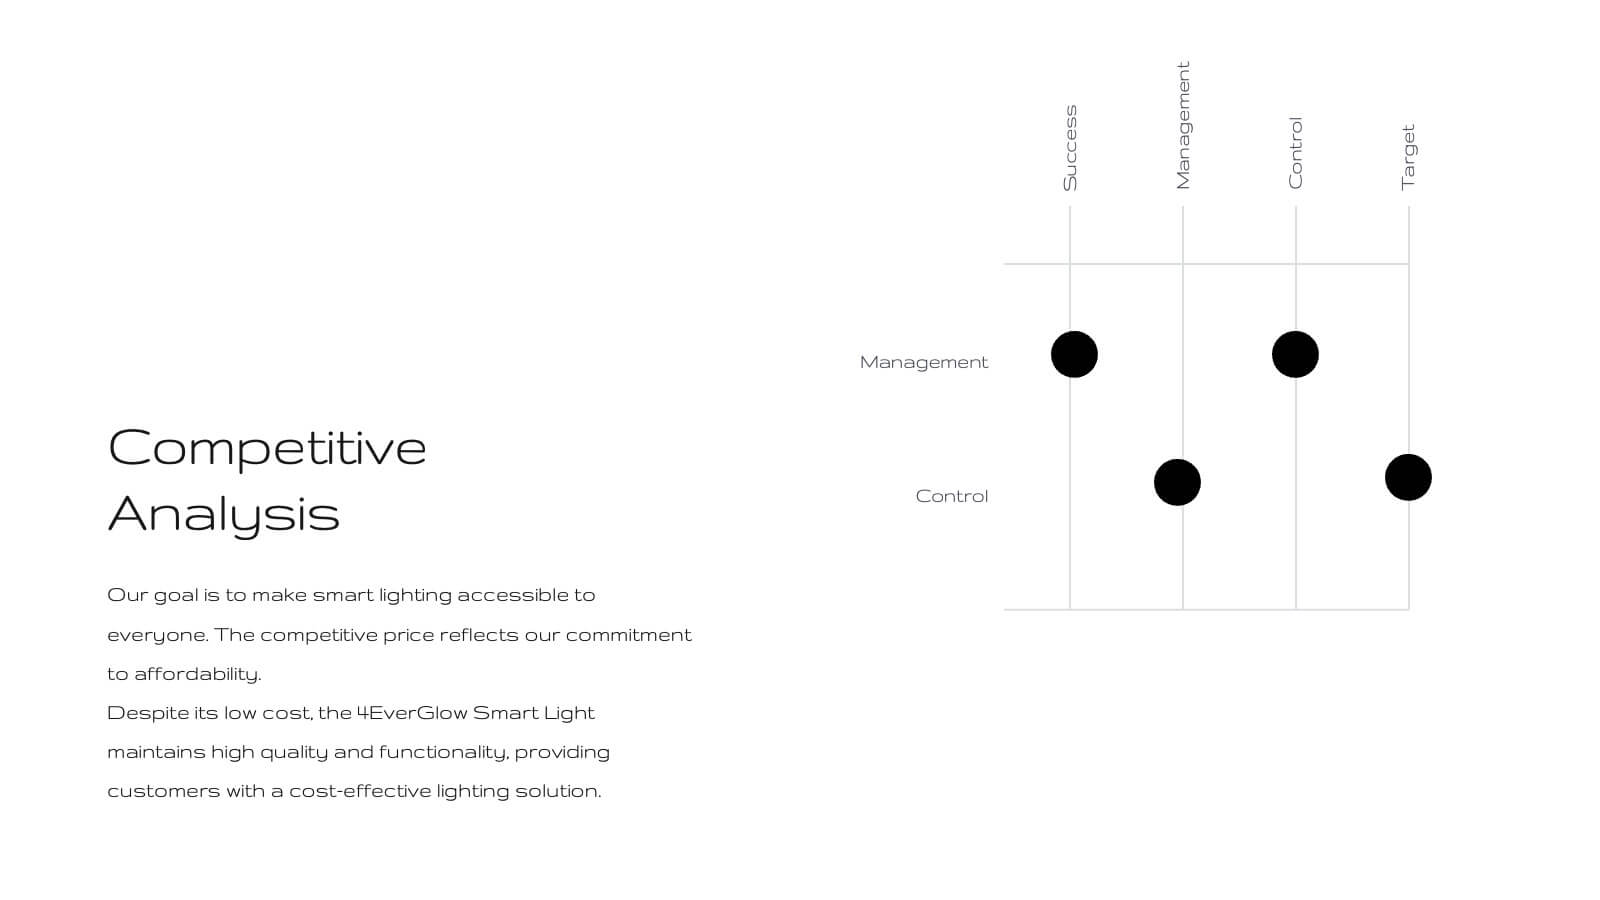
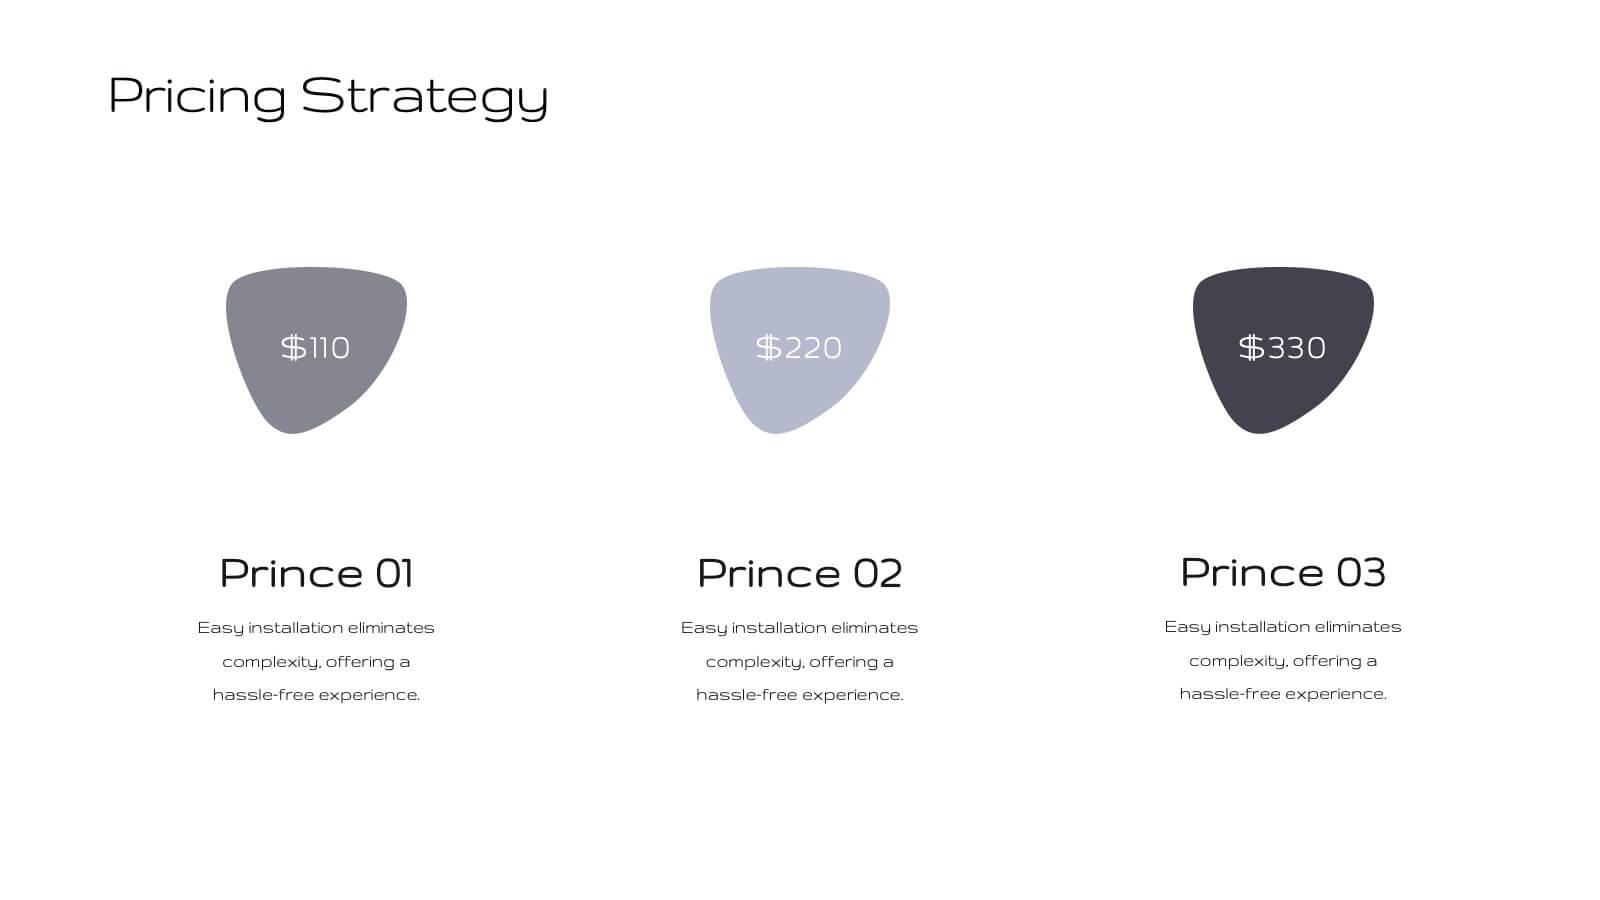
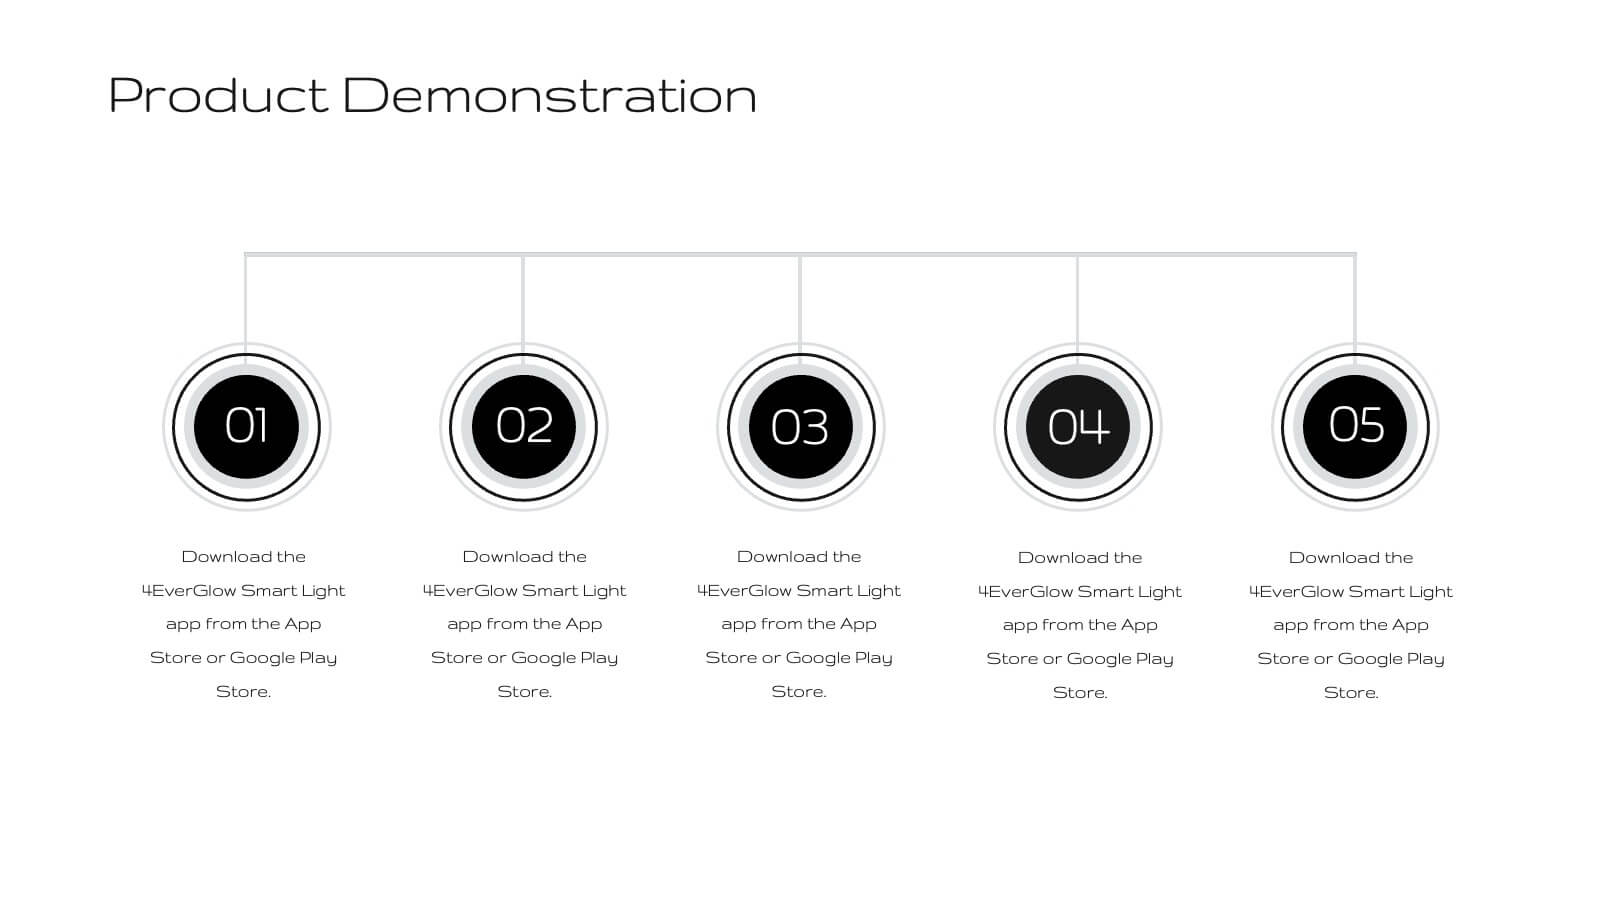
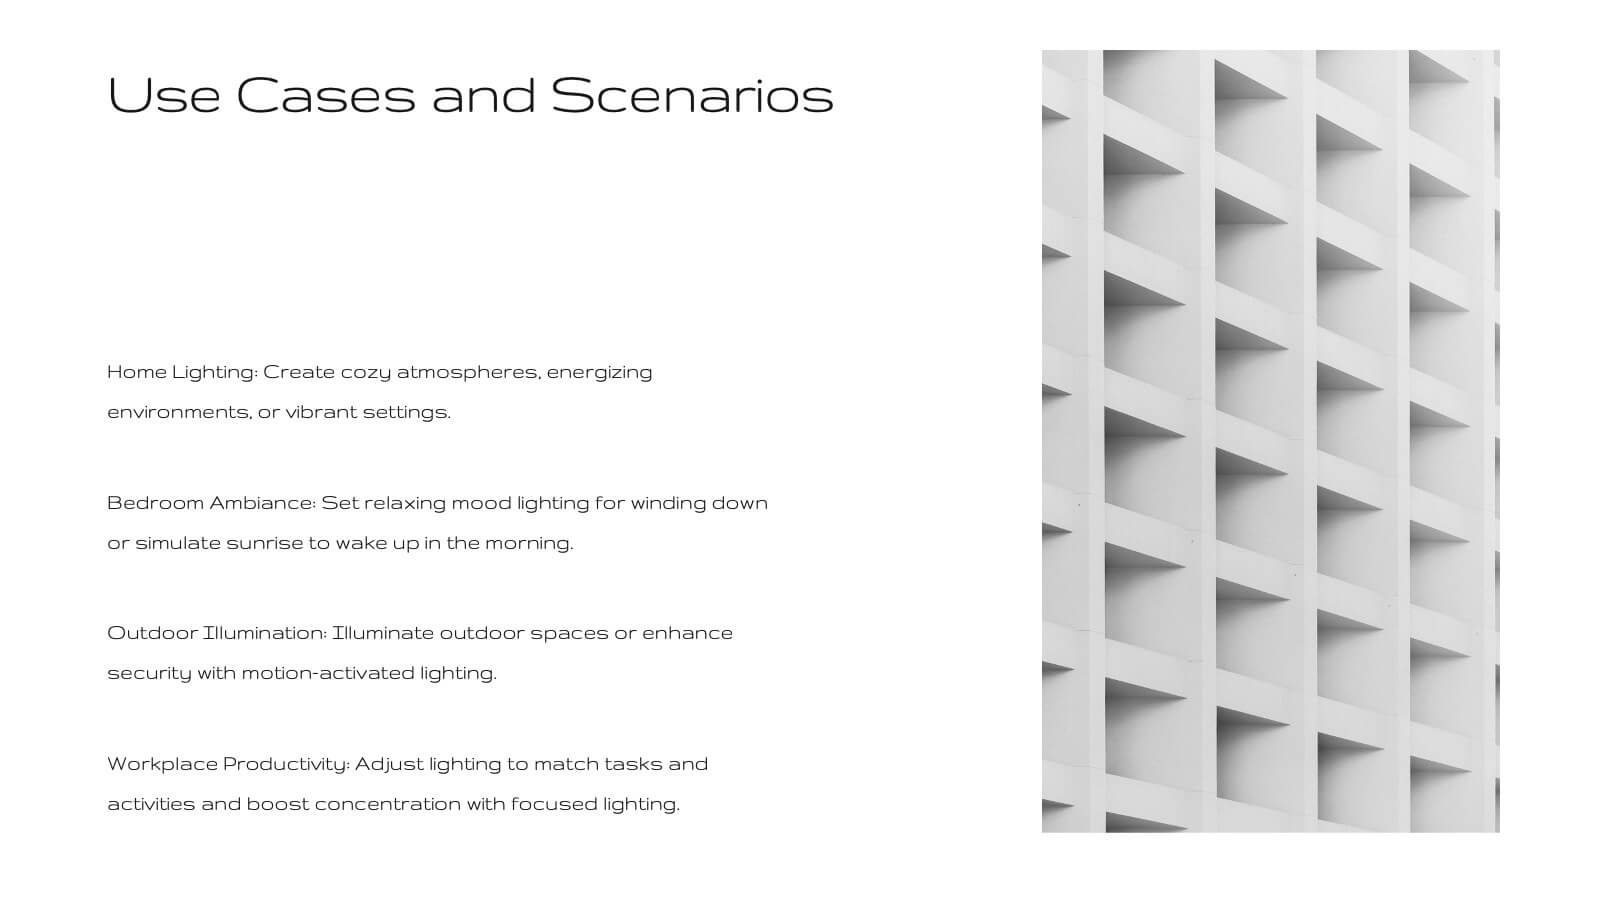
Fortuna Product Development Plan Presentation
Unveil your product's potential with this elegant, minimalist presentation template. Perfect for detailing product development, features, and market strategies, it features a clean design that emphasizes clarity and professionalism. Highlight key aspects like customer pain points, competitive analysis, and pricing strategies to captivate your audience. Compatible with PowerPoint, Keynote, and Google Slides, it ensures seamless presentations on any platform.


4 slides
UX Empathy Map Design Presentation
Spark deeper user understanding with a layout that turns thoughts, feelings, and behaviors into clear visual insights. This presentation helps teams explore customer motivation and improve product decisions through a simple, structured empathy-mapping framework. Fully compatible with PowerPoint, Keynote, and Google Slides.


10 slides
Revenue Growth Strategies and Metrics Presentation
Highlight your key success drivers with the Revenue Growth Strategies and Metrics Presentation. This upward arrow-based layout is perfect for showcasing growth phases, financial KPIs, or strategic revenue initiatives. Clean, professional, and fully editable in PowerPoint, Keynote, and Google Slides—ideal for business reviews, sales pitches, and quarterly updates.


7 slides
6-Part Hexagon Layout Presentation
Give your ideas a geometric edge with a clean, balanced design that brings structure to complex information. This presentation visually organizes six key elements in a connected, circular layout—perfect for processes, strategies, or frameworks. Fully customizable and compatible with PowerPoint, Keynote, and Google Slides for professional presentations.