


Features
- 21 Unique Slides
- Fully editable and easy to edit in Microsoft Powerpoint, Keynote and Google Slides
- 16:9 widescreen layout
- Clean and professional designs
- Export to JPG, PDF or send by email


Do you have any questions?
Recommend


5 slides
Health Awareness Campaign Presentation
Bright and uplifting, this slide brings awareness to important health causes through a clean ribbon-focused layout that’s easy to read and visually engaging. It helps present key messages, statistics, or campaign steps clearly while keeping the design calm and supportive. Fully compatible with PowerPoint, Keynote, and Google Slides.


8 slides
Business Revenue and Profit Analysis Presentation
Analyze and visualize Business Revenue and Profit trends effectively with this modern and data-driven slide template. Featuring a dual-chart layout with reseller performance trends and purchase breakdowns, this slide is ideal for financial reports, sales presentations, and strategic business meetings. Fully customizable, you can edit the text, colors, and data to fit your specific needs. Compatible with PowerPoint, Keynote, and Google Slides for easy editing and seamless integration.


6 slides
Business Security Compliance Presentation
Visualize your security framework with this clear and modern infographic layout. This slide is ideal for presenting compliance steps, risk assessments, or regulatory requirements, featuring a shield-centered hub with 5 editable sections. Customize easily in PowerPoint, Keynote, or Google Slides.


5 slides
Business Annual Report Summary Presentation
Clear, Concise, and Impactful! The Business Annual Report Summary Presentation template helps you present key performance indicators, financial metrics, and company growth in a professional and visually engaging way. Fully customizable and compatible with PowerPoint, Keynote, and Google Slides, it’s ideal for executives and analysts aiming for a compelling data-driven presentation.


10 slides
Adapting to Business Transformation Presentation
Guide your audience through change with this dynamic, step-by-step layout tailored for showcasing transformation journeys. The slide features a curved flow design with five customizable stages, perfect for visualizing digital shifts, organizational restructuring, or innovation roadmaps. Best for corporate strategists, consultants, and change managers. Fully editable in PowerPoint, Keynote, and Google Slides.


20 slides
Novelix Graphic Design Project Plan Presentation
Elevate your design projects with this modern and stylish presentation template. Covering key areas such as concept development, design elements, prototypes, and project timelines, it provides a structured approach to presenting creative work. Perfect for designers and agencies alike. Compatible with PowerPoint, Keynote, and Google Slides for effortless customization.


5 slides
Industry Analysis Porter's 5 Forces
Analyze market dynamics with this clean, circular infographic focused on Porter’s Five Forces. Visually break down buyer power, supplier influence, new entrants, substitutes, and competitive rivalry for a clear strategic overview. Ideal for consultants, marketers, and business analysts. Fully editable in PowerPoint, Keynote, and Google Slides.


21 slides
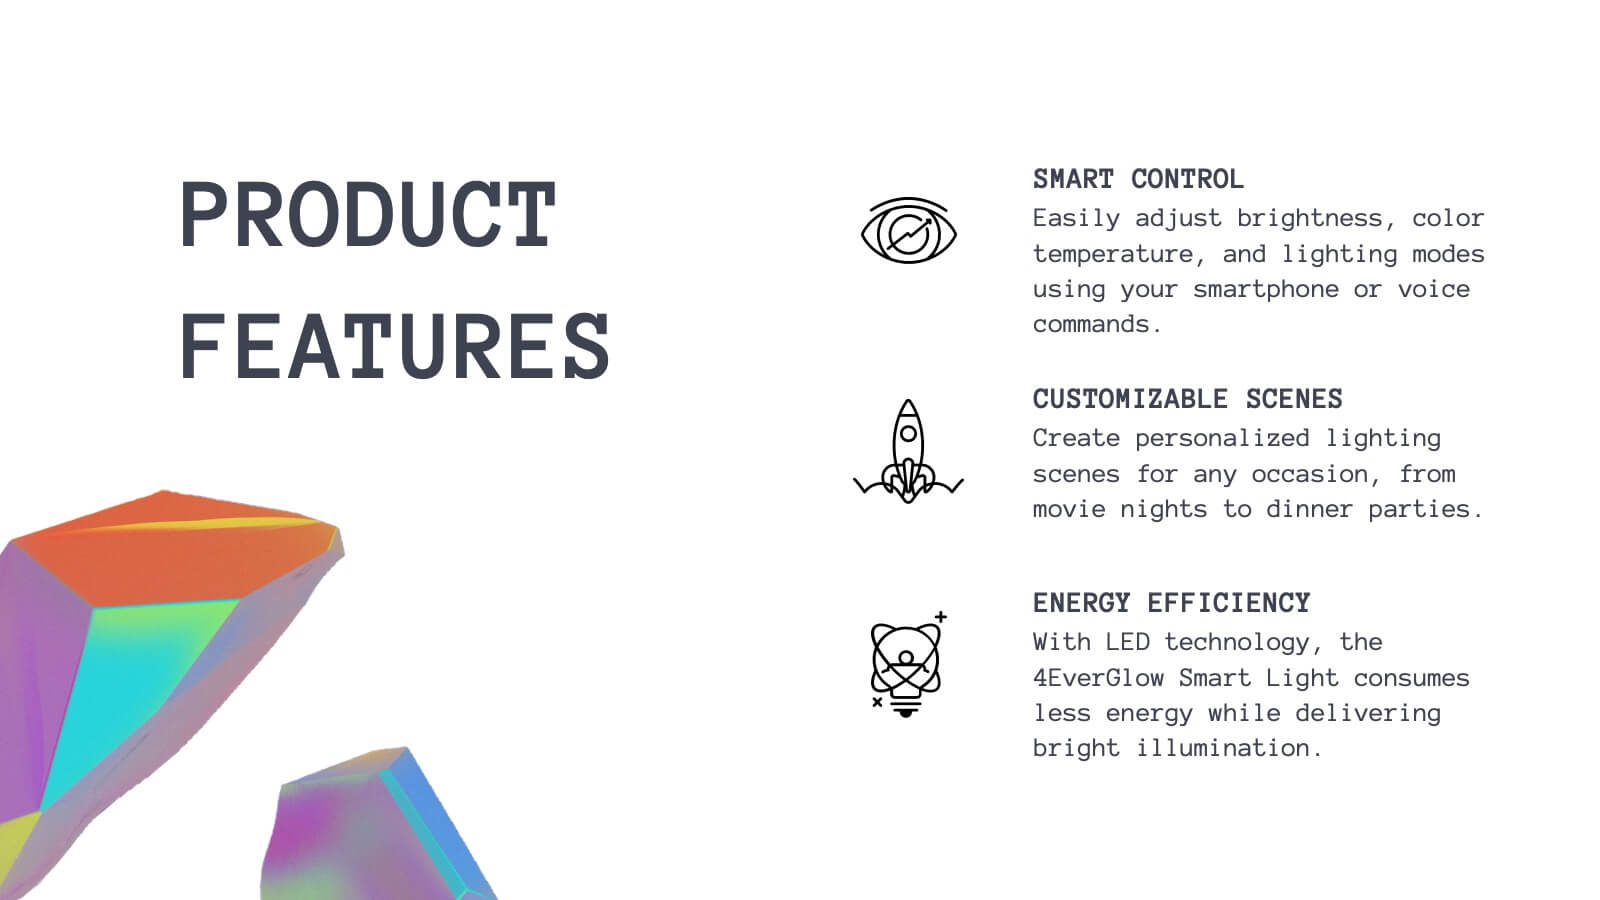
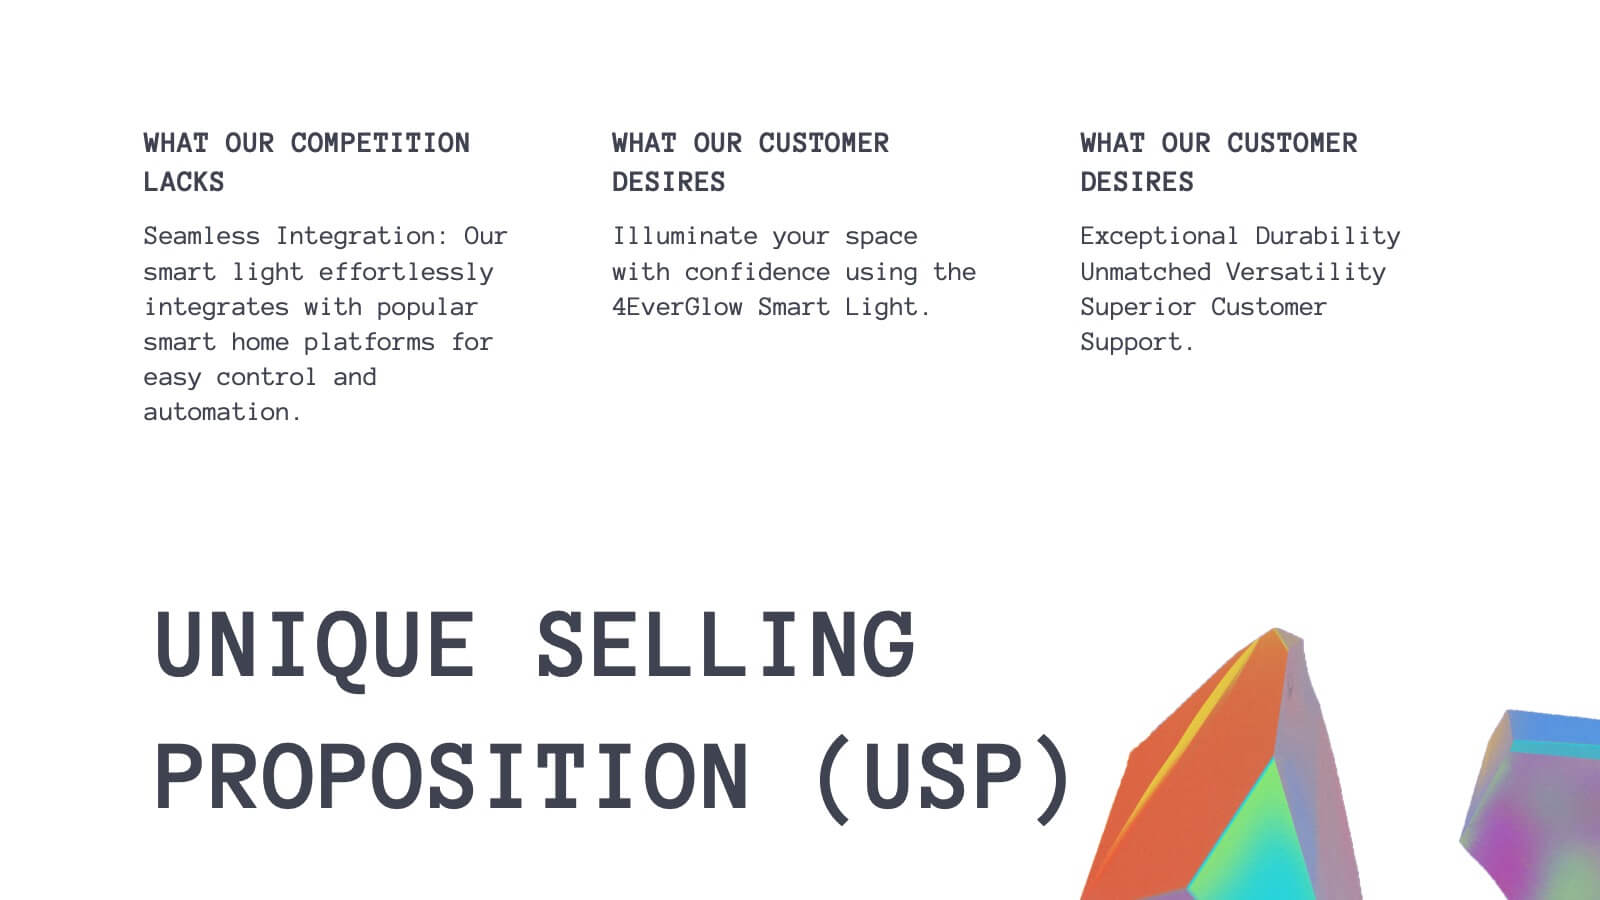
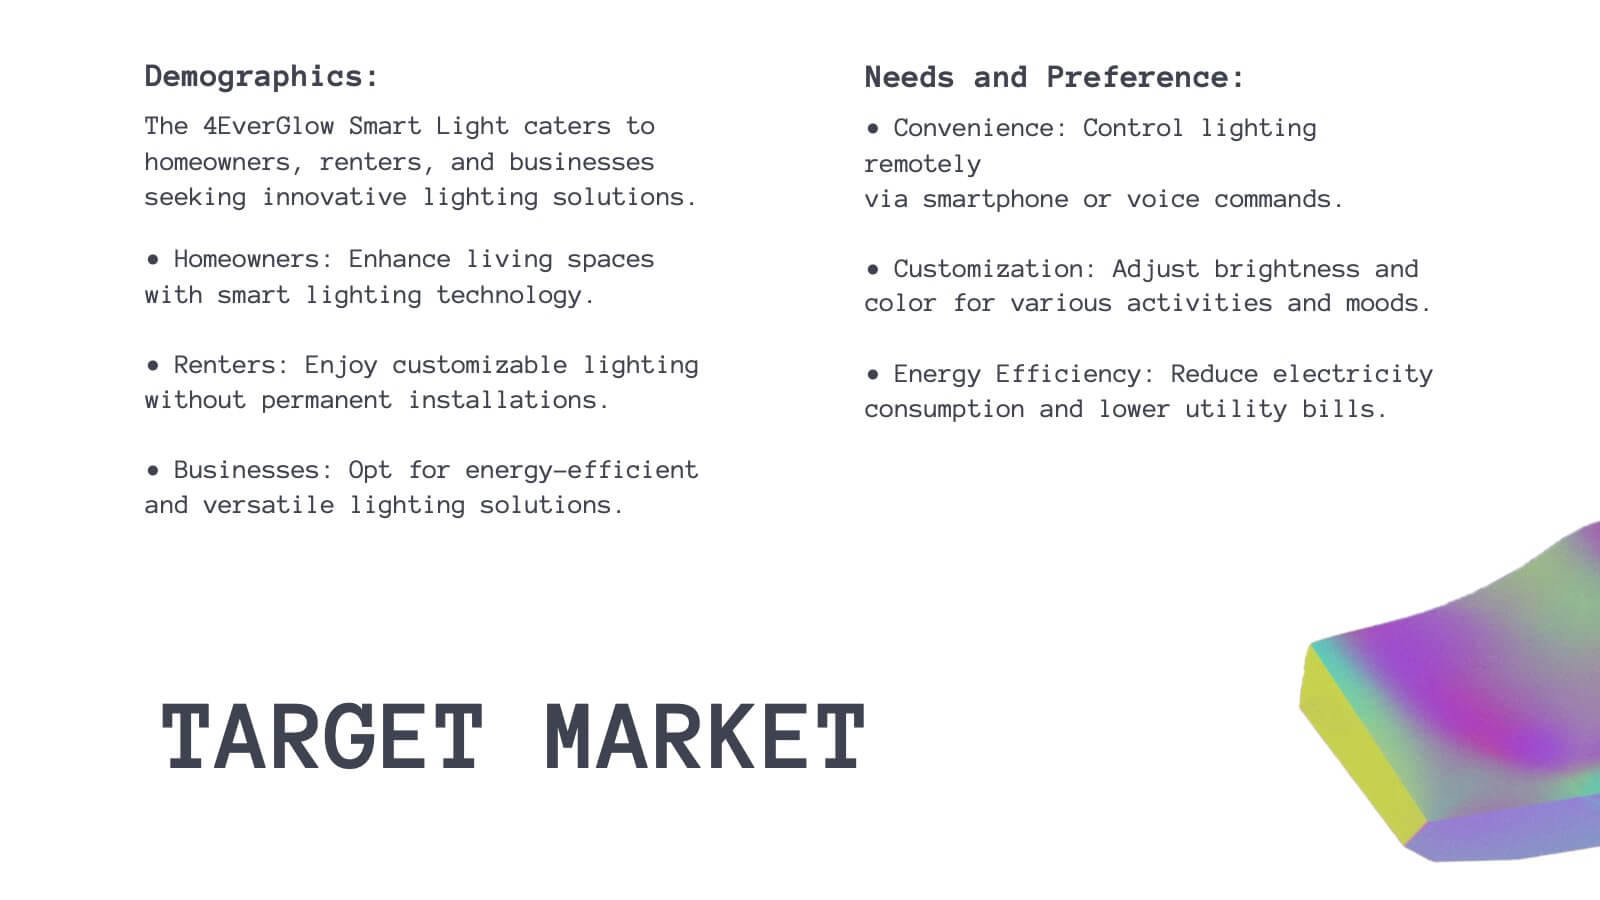
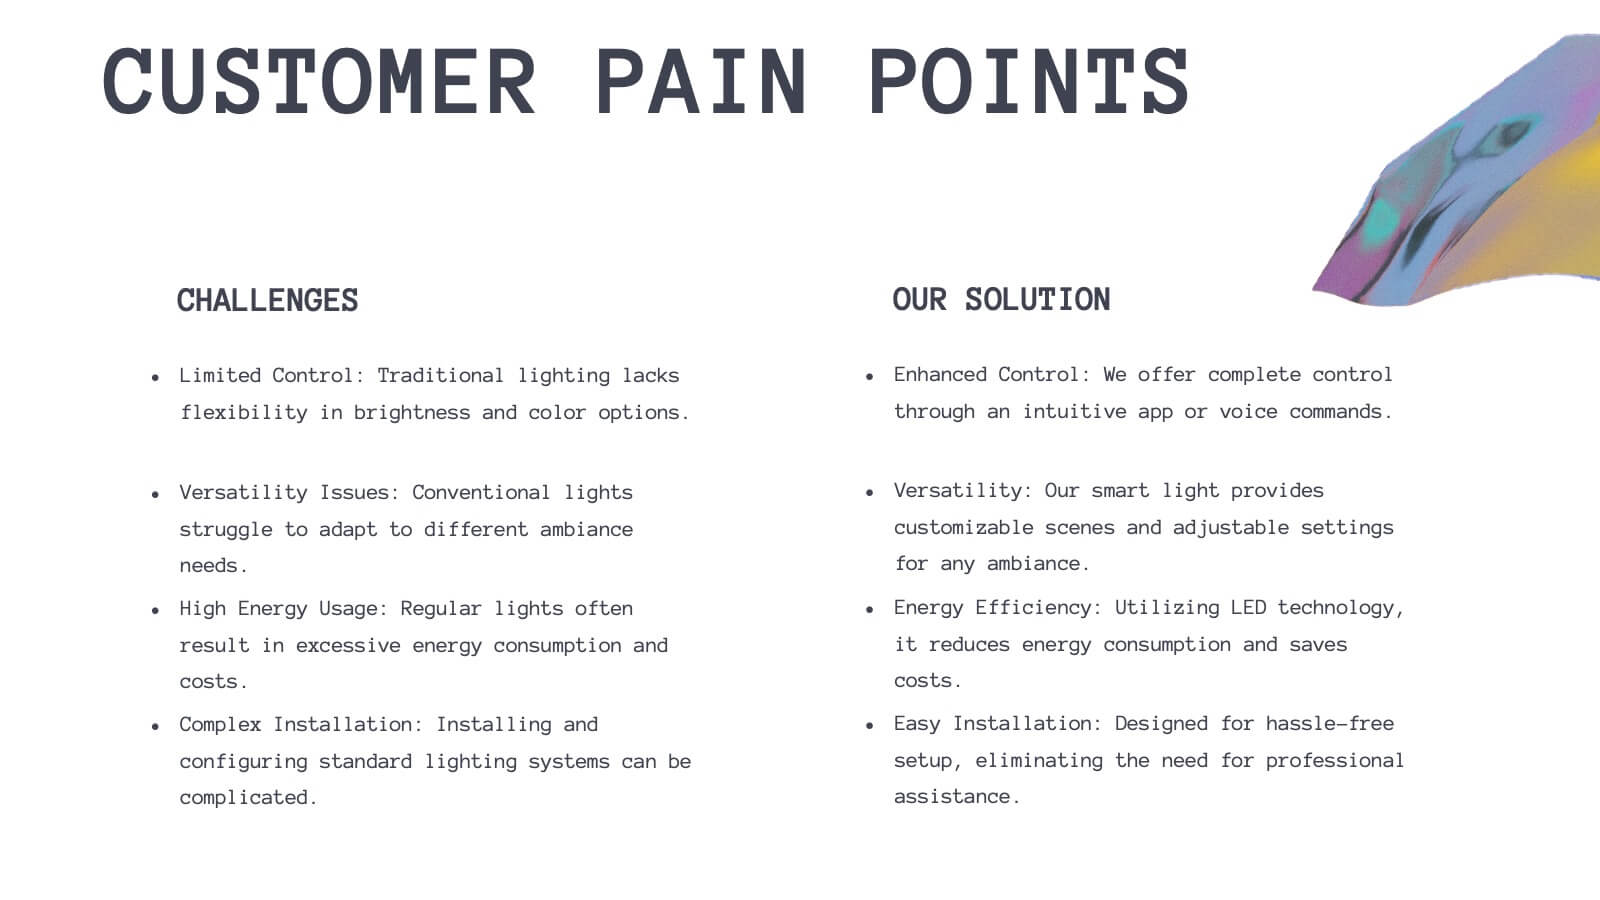
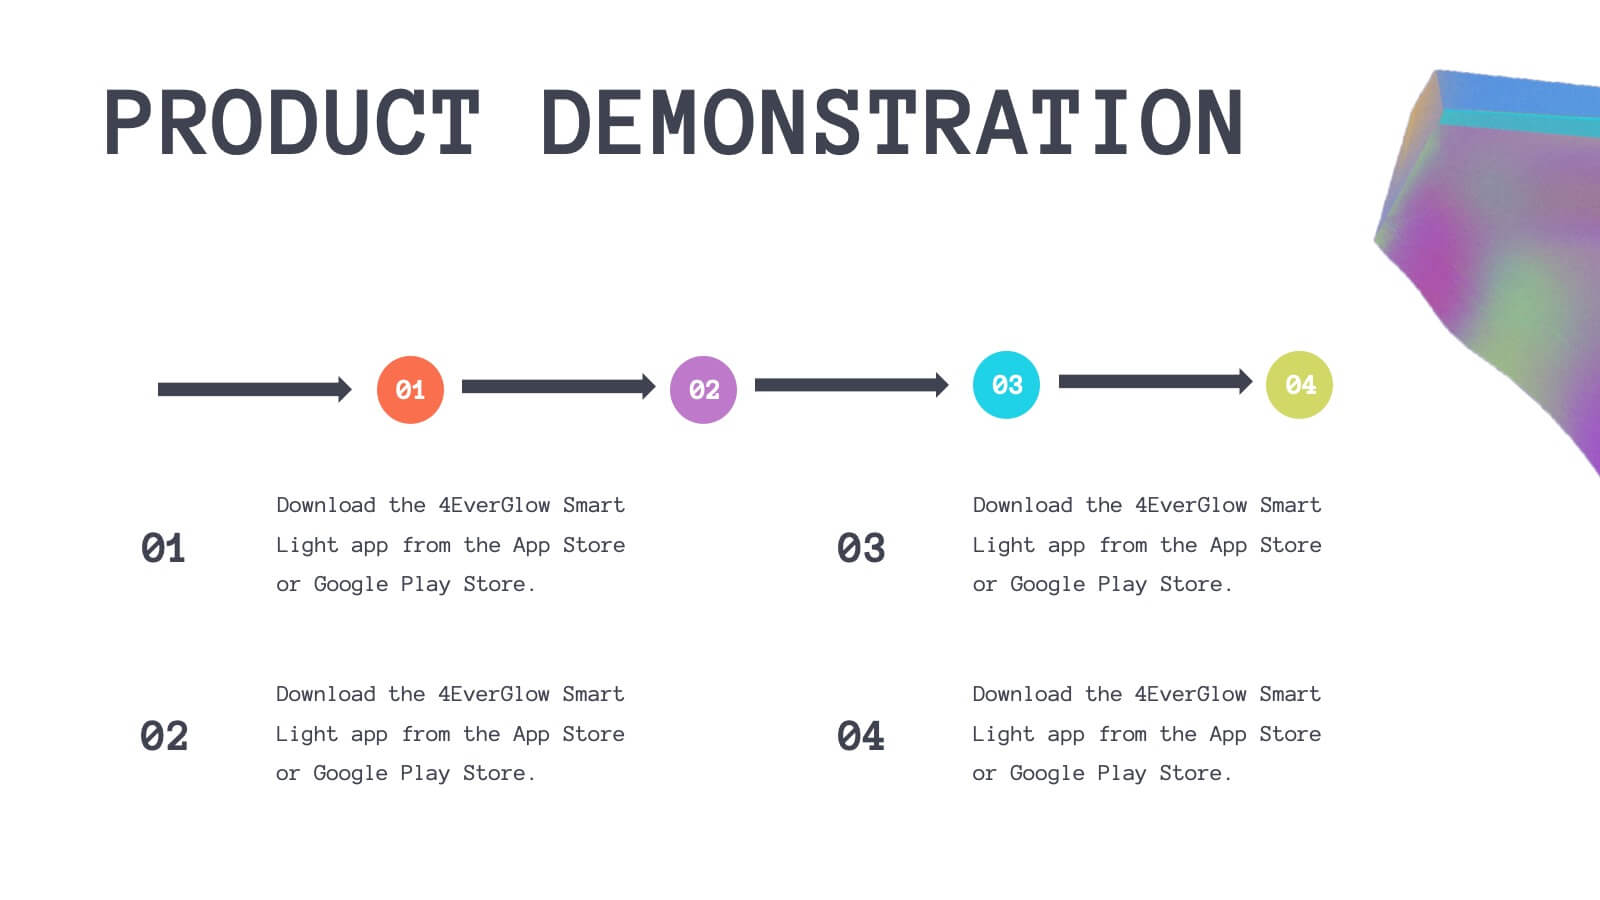
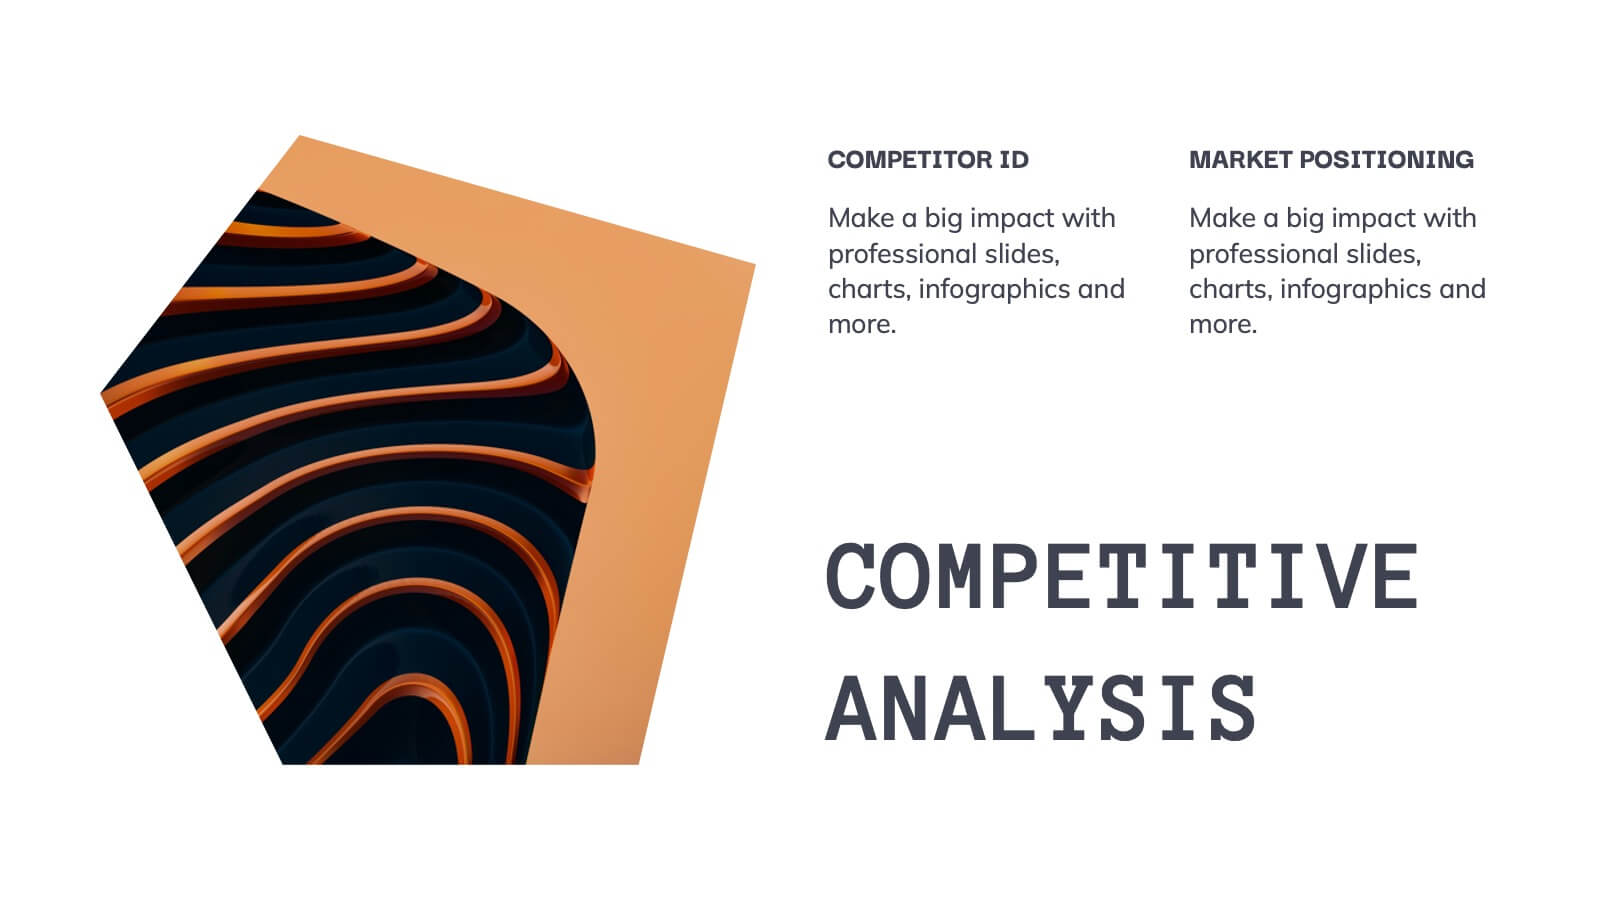
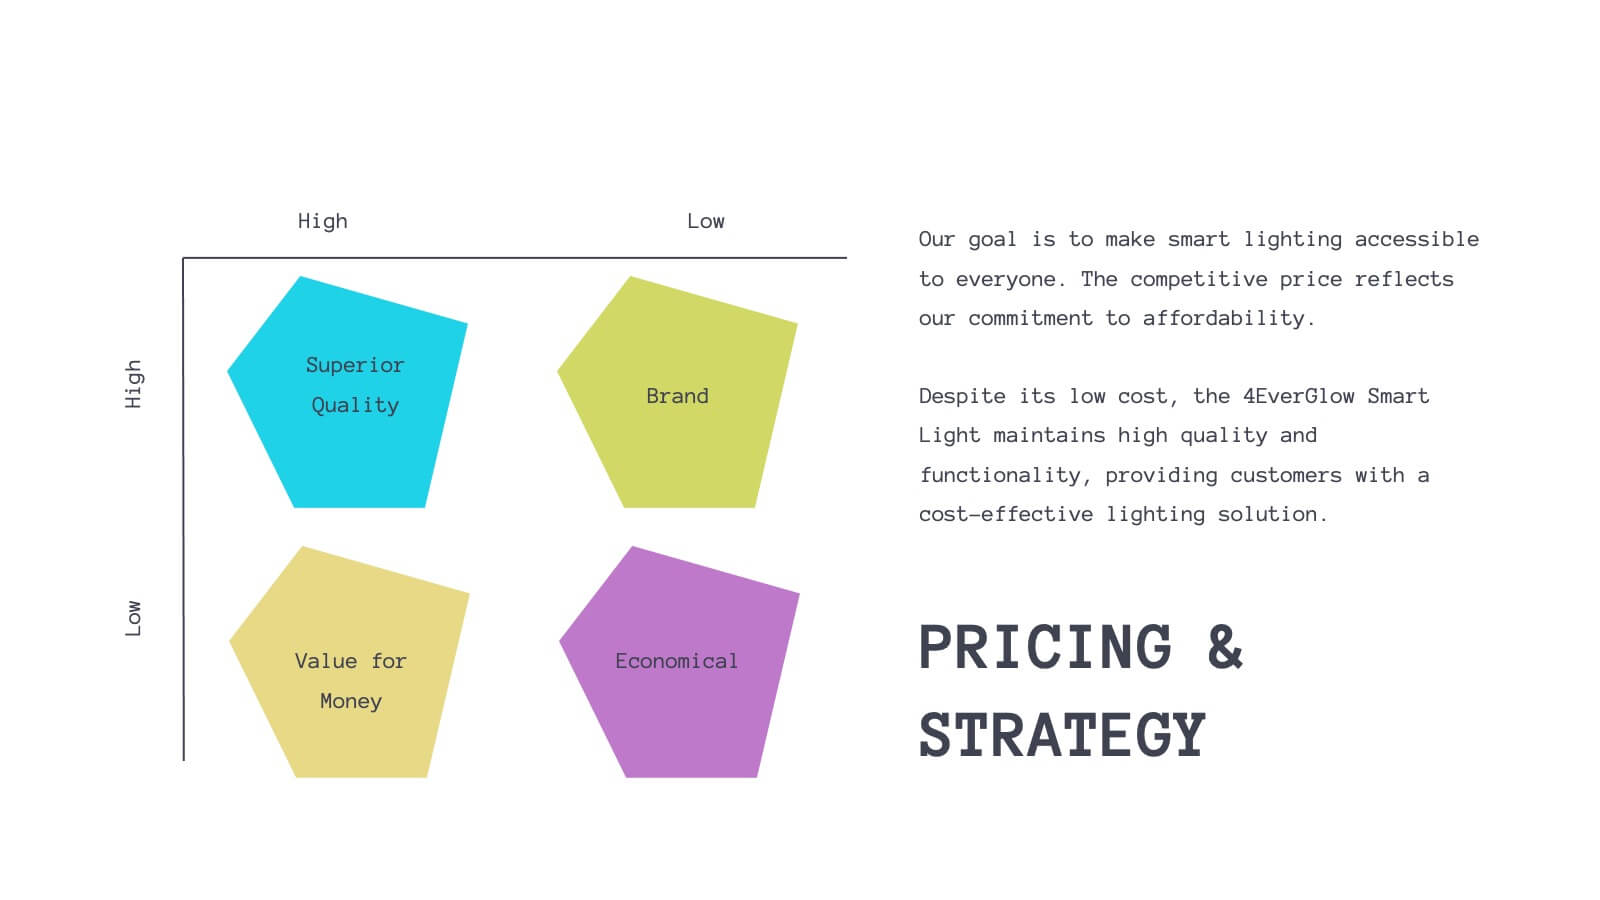
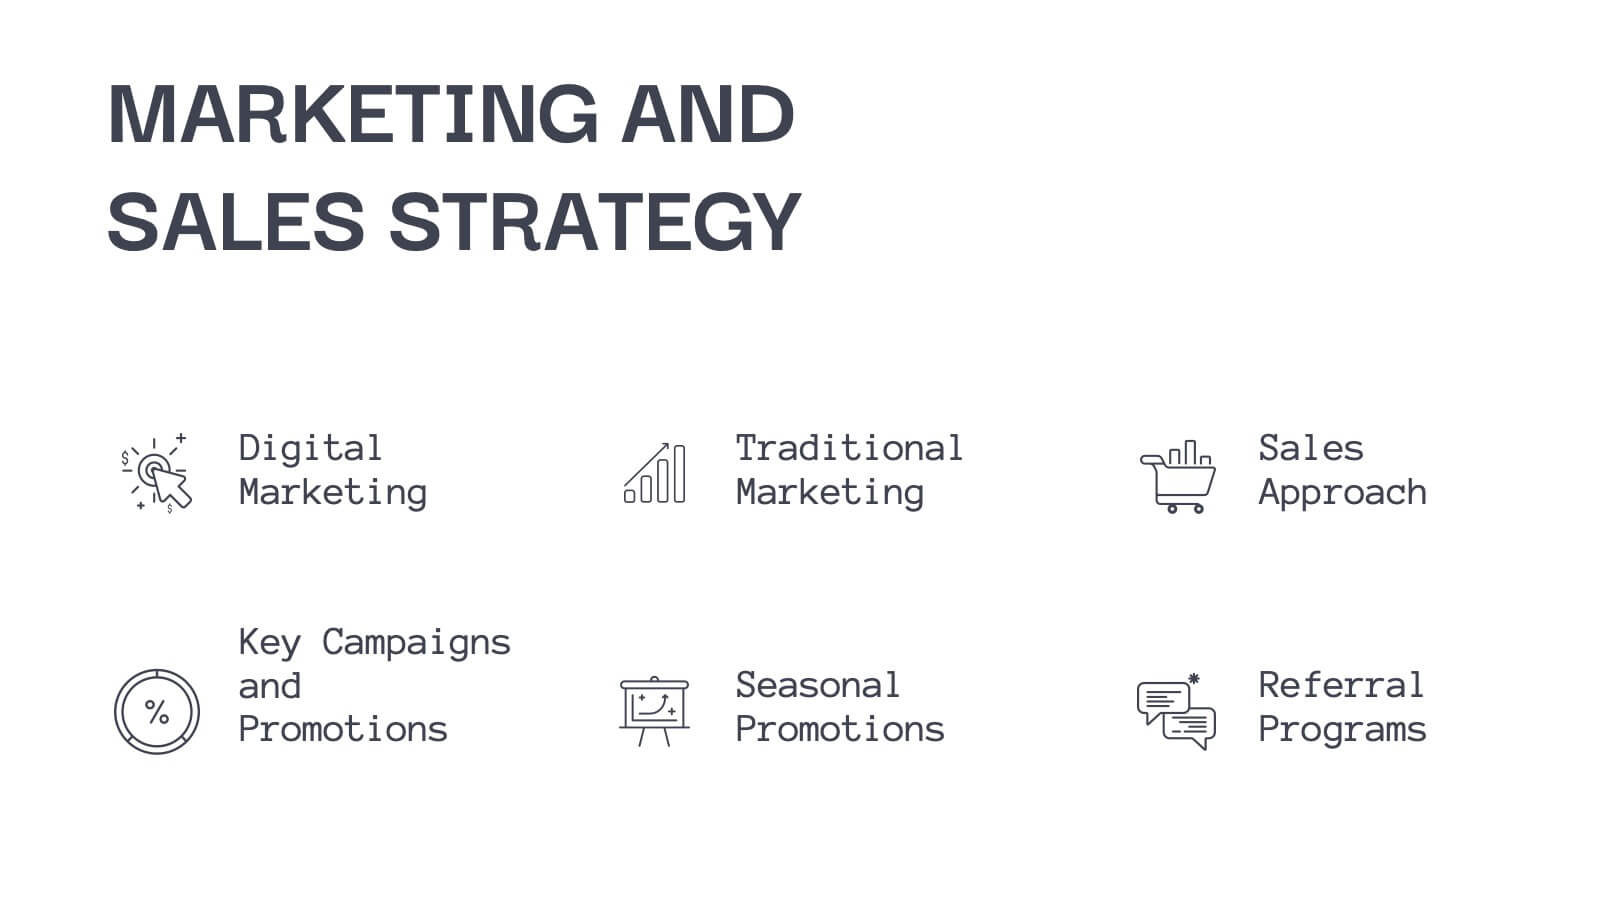
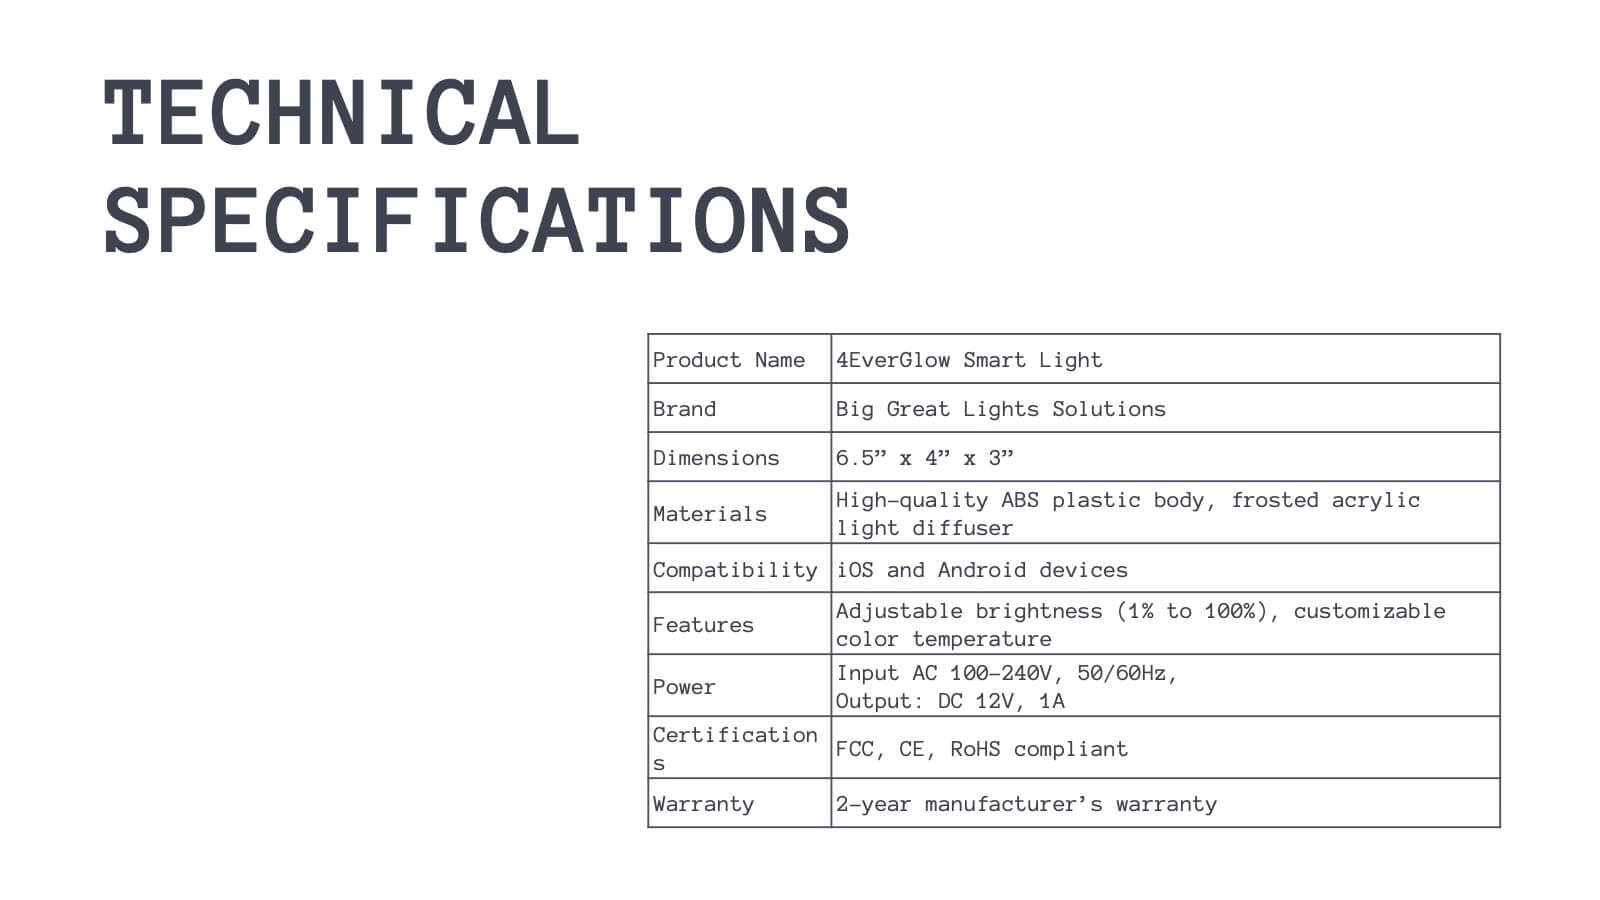
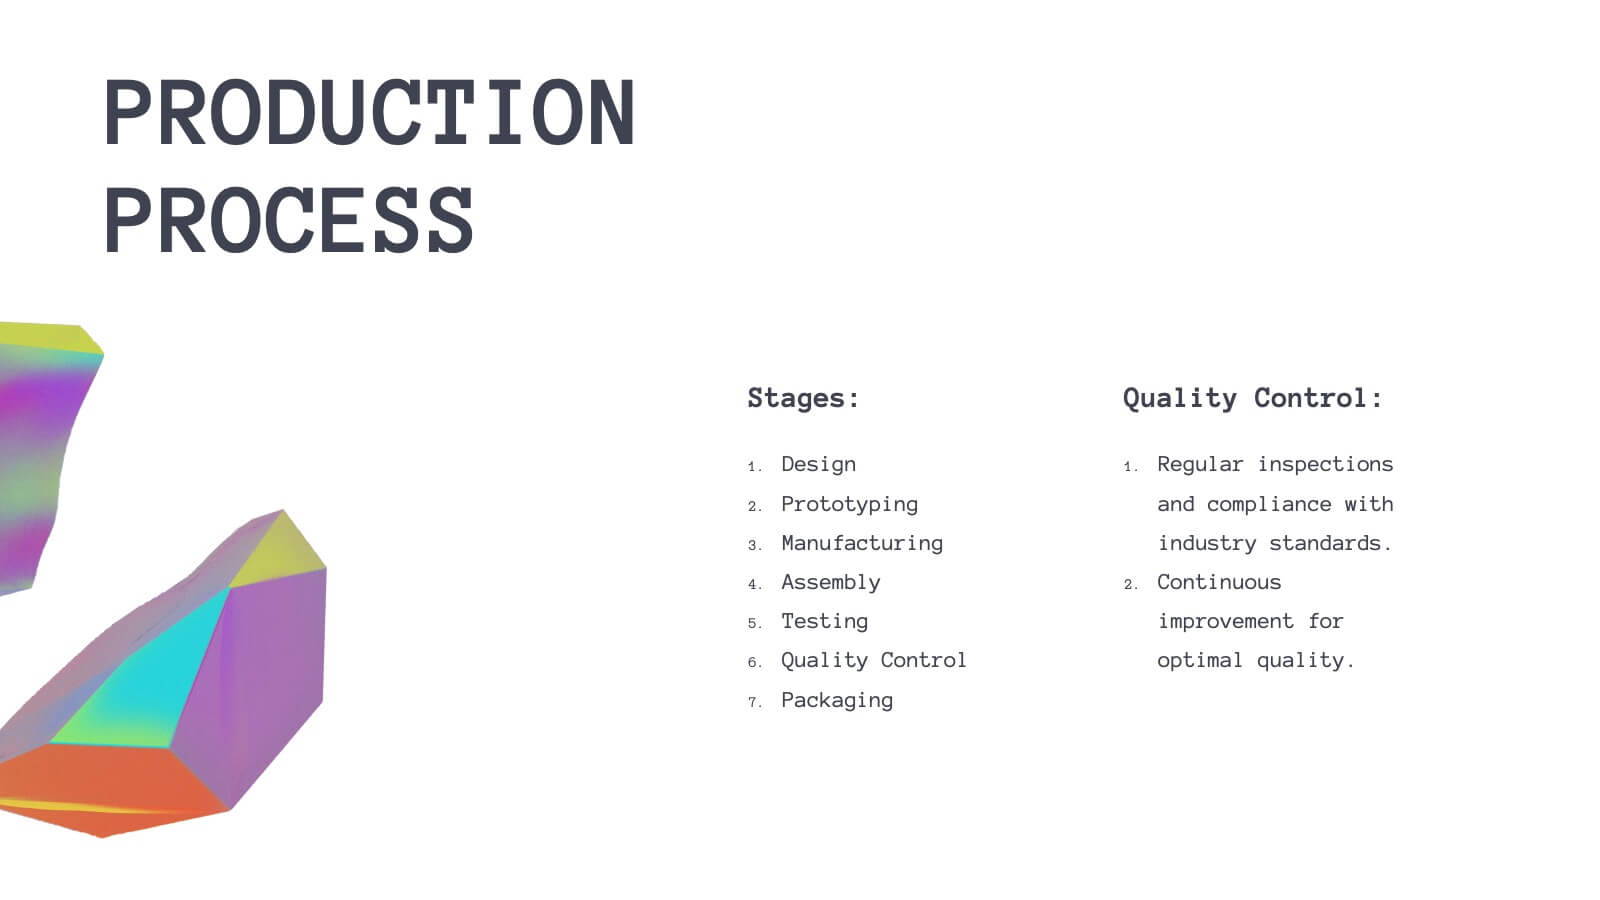
Aetherion New Product Proposal Presentation
This Product Presentation Template is designed to effectively showcase your product's features, target market, and competitive advantages. It includes sections for customer pain points, pricing strategy, technical specifications, and marketing plans. Fully customizable for PowerPoint, Keynote, and Google Slides, it's perfect for product launches and investor pitches.


6 slides
USA Market Reach Heatmap Presentation
Showcase your geographic impact with this USA Market Reach Heatmap template. Ideal for visualizing regional data, customer density, or sales performance. Features pinpoint markers, editable callouts, and a clean U.S. map layout. Fully customizable in PowerPoint, Keynote, and Google Slides—perfect for marketing, sales, or expansion strategy presentations.


21 slides
Fahrenheit Scientific Research Presentation
Present your findings with clarity using this scientific research presentation template. Designed for researchers, it includes sections for objectives, methodology, data analysis, results, and recommendations. Perfect for academic and professional use, this template ensures a polished, organized presentation and is fully compatible with PowerPoint, Keynote, and Google Slides.


4 slides
Financial Overview Slide Presentation
Kick off your presentation with a clean, modern visual that makes financial insights easy to grasp at a glance. This slide helps you summarize key metrics, compare performance areas, and highlight important business trends in a simple, structured layout. Fully compatible with PowerPoint, Keynote, and Google Slides.


13 slides
Organizational Company Profile Presentation
Elevate your business overview with this straightforward Company Profile template. The opening slide announces the essence of your business, preparing the audience for a journey through your organizational landscape. Structured to highlight the key areas of your business, the template includes an 'About Us' section, laying out your mission and vision. Learn about the dedicated team behind the success with the 'Meet Our Team' slide, providing a personal touch to your corporate identity. Set clear, achievable goals with a slide dedicated to outlining your short-term and long-term objectives. Engage your audience with a 'Business Facts' slide that provides tangible insights into your company's performance. Finally, the 'Contact Us' slide offers a clear invitation for further dialogue, fostering potential partnerships. Ideal for those searching for a comprehensive yet accessible company presentation, this template is designed to convey your business strengths and opportunities effectively.


6 slides
Weekly Task Schedule Presentation
Stay on top of your week with this clean and efficient layout designed to organize daily priorities and action plans. Perfect for tracking goals, meetings, or team deliverables, it keeps productivity front and center. Fully customizable and compatible with PowerPoint, Keynote, and Google Slides for easy professional presentation use.


21 slides
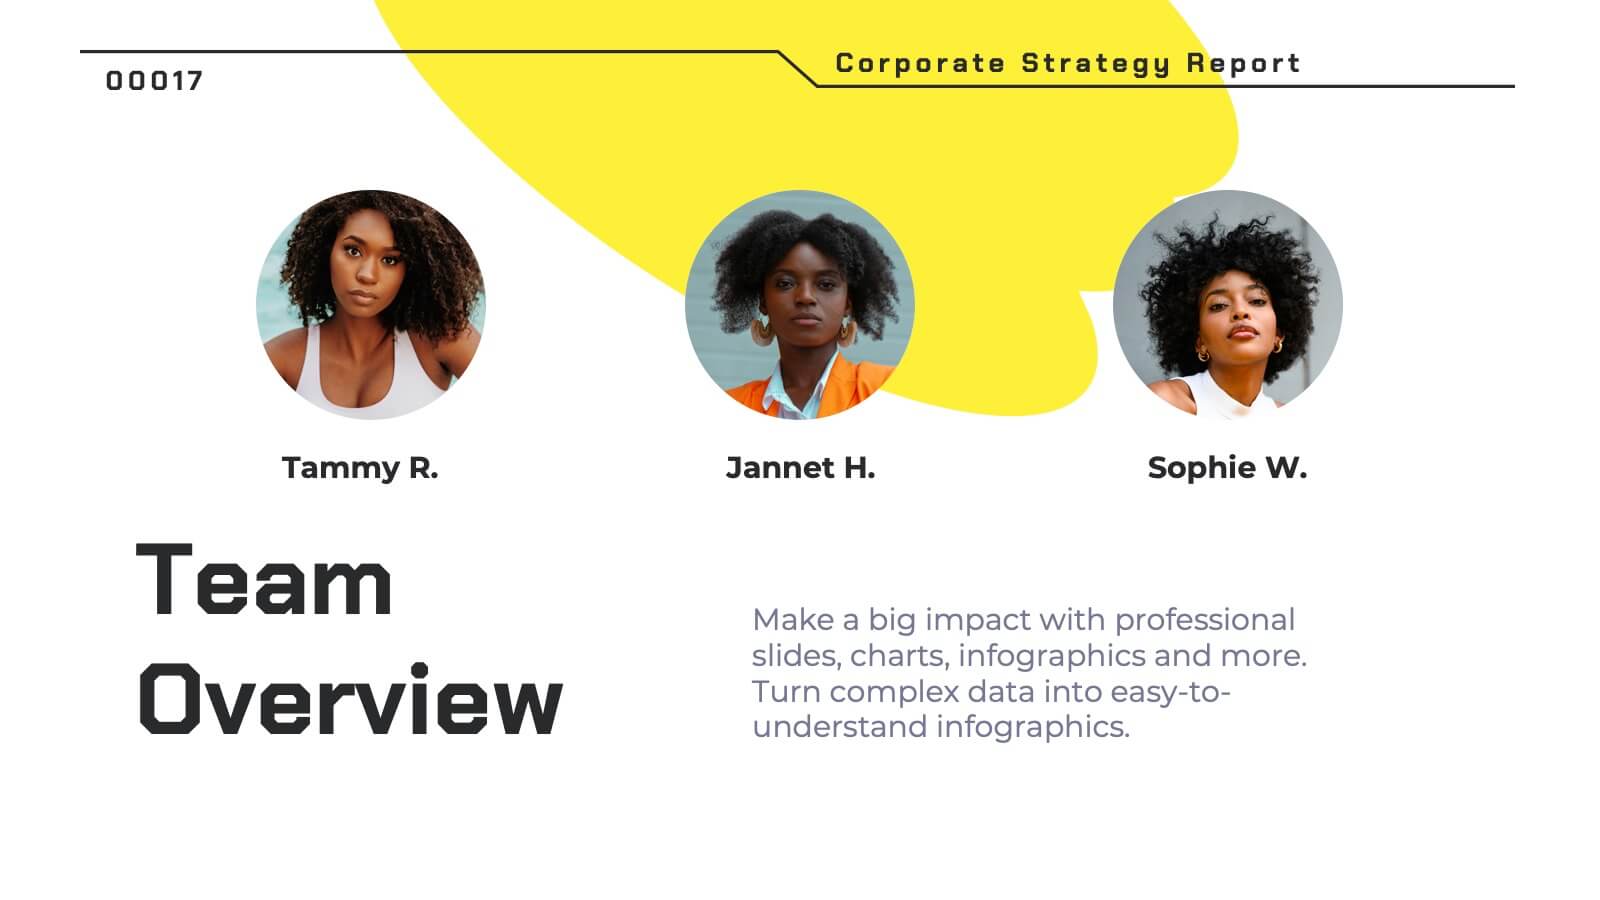
Pyronova Corporate Strategy Report Presentation
This professional corporate strategy template includes slides for market opportunity, SWOT analysis, objectives, marketing plan, revenue model, and competitive analysis. Designed for impactful presentations, it highlights financial performance, investment opportunities, and operational plans. Fully customizable in PowerPoint, Keynote, and Google Slides to suit diverse business needs.


4 slides
AIDA Marketing Funnel Slide Presentation
Capture attention from the very first slide with a bold, structured layout that turns each stage of your message into a clear, engaging flow. This presentation helps simplify complex decision paths and guide viewers through each step with ease. Fully editable and compatible with PowerPoint, Keynote, and Google Slides.


6 slides
Central Idea Spider Layout Presentation
Bring your big idea to life with a sleek, organized layout that keeps every supporting point perfectly connected. This presentation is ideal for mapping strategies, goals, or project concepts in a clear, visual way. Fully customizable and compatible with PowerPoint, Keynote, and Google Slides for effortless editing.


6 slides
Strategic Wheel Diagram Presentation
Capture attention instantly with this bold and modern visual design built for strategic presentations. Ideal for mapping key processes, illustrating interconnected goals, or showcasing business strategies, it organizes ideas in a circular, easy-to-follow layout. Fully customizable and compatible with PowerPoint, Keynote, and Google Slides for seamless editing and presentation.