


Features
- 6 Unique slides
- Fully editable and easy to edit in Microsoft Powerpoint, Keynote and Google Slides
- 16:9 widescreen layout
- Clean and professional designs
- Export to JPG, PDF or send by email


Do you have any questions?
Recommend


21 slides
Drift Agile Project Plan Presentation
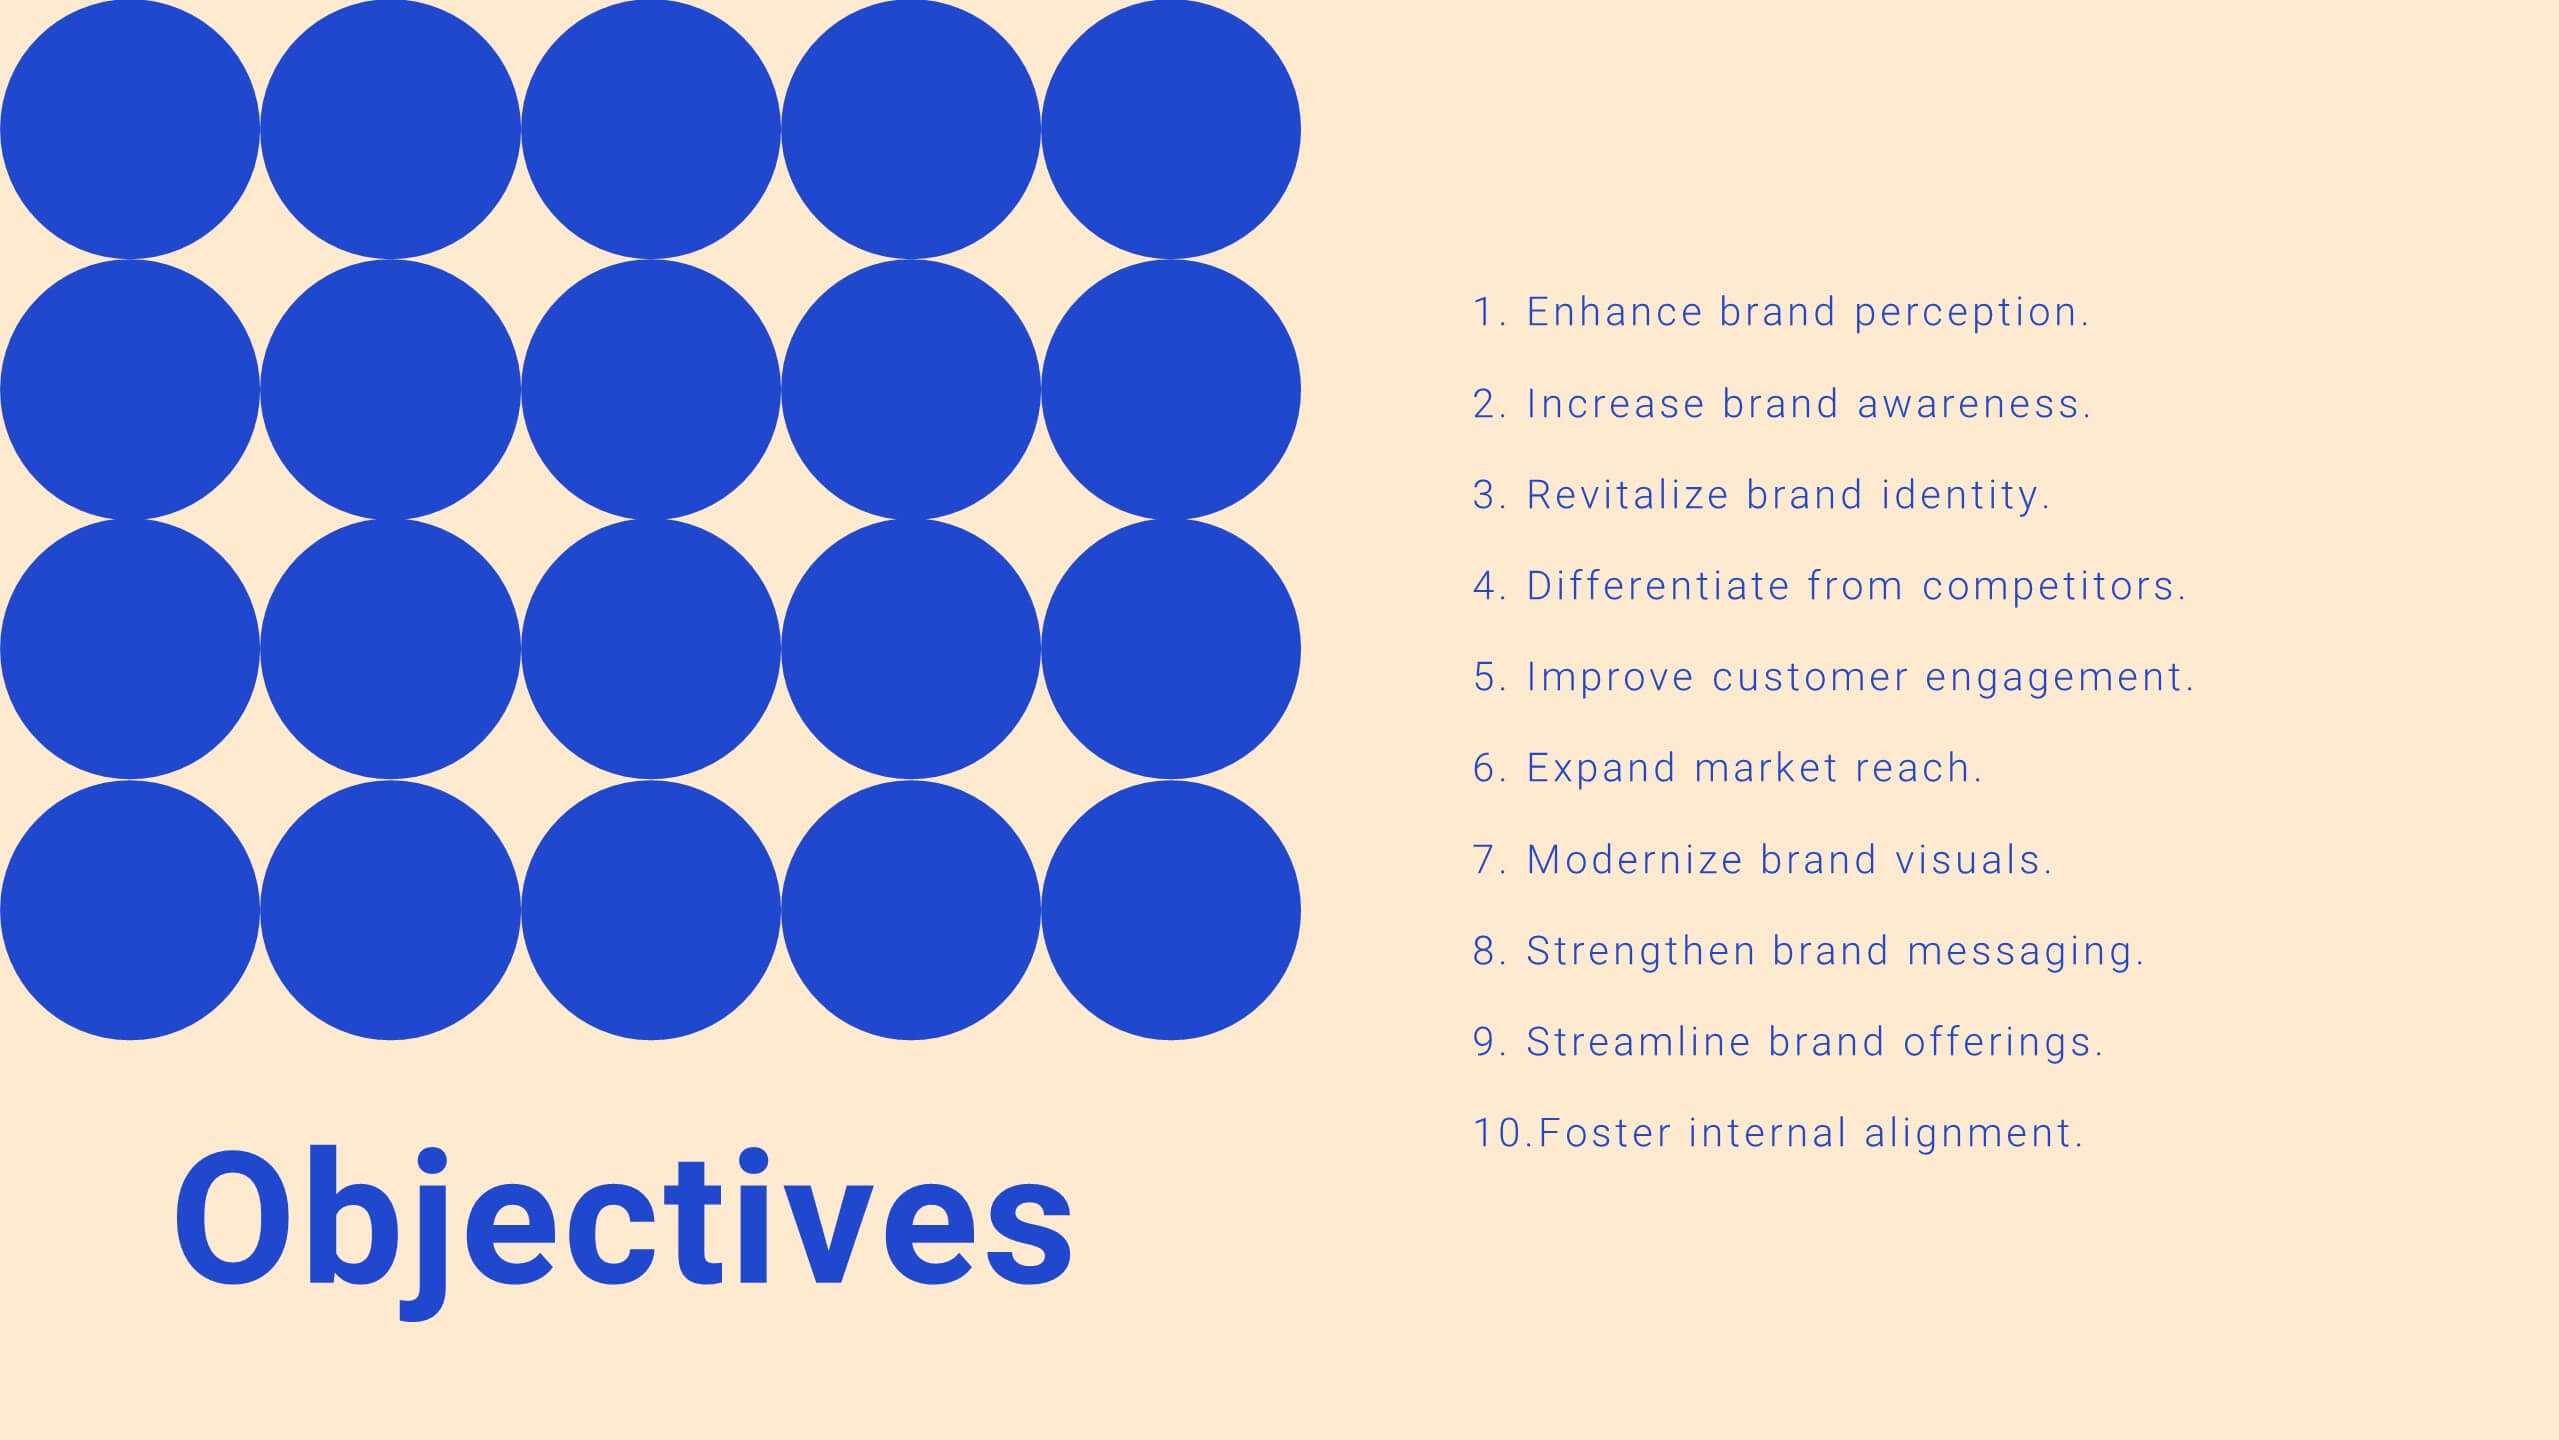
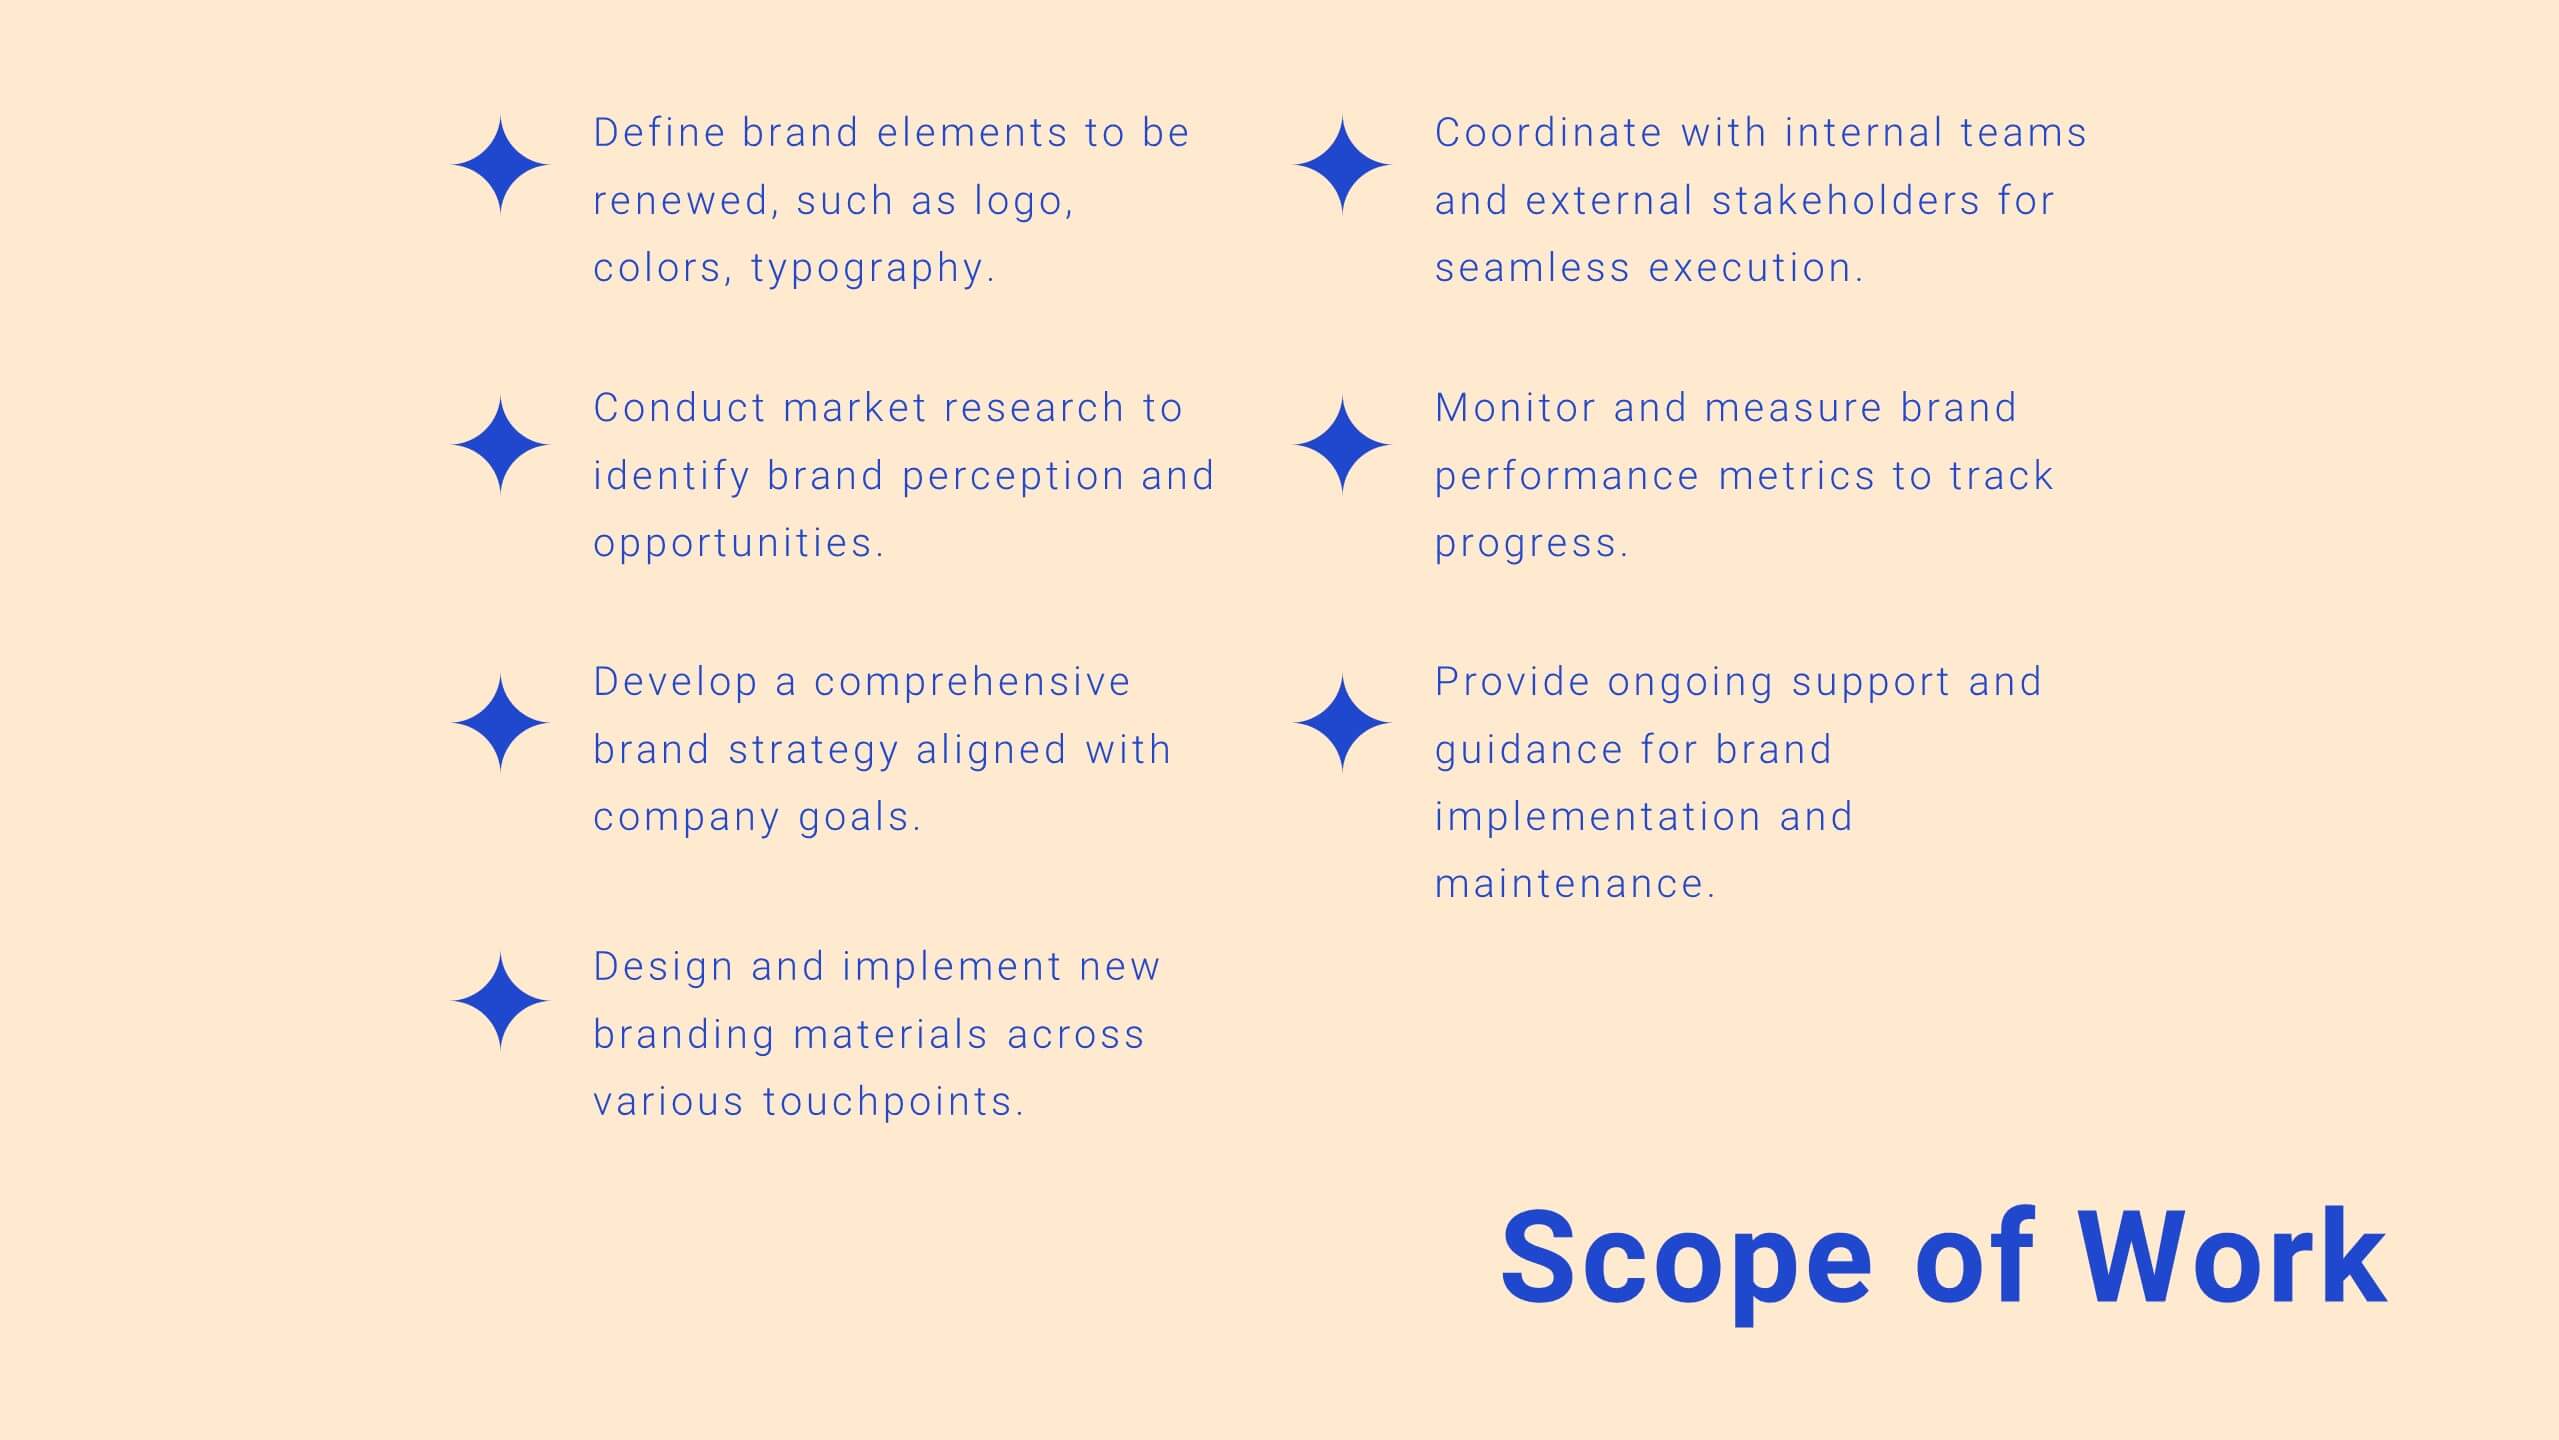
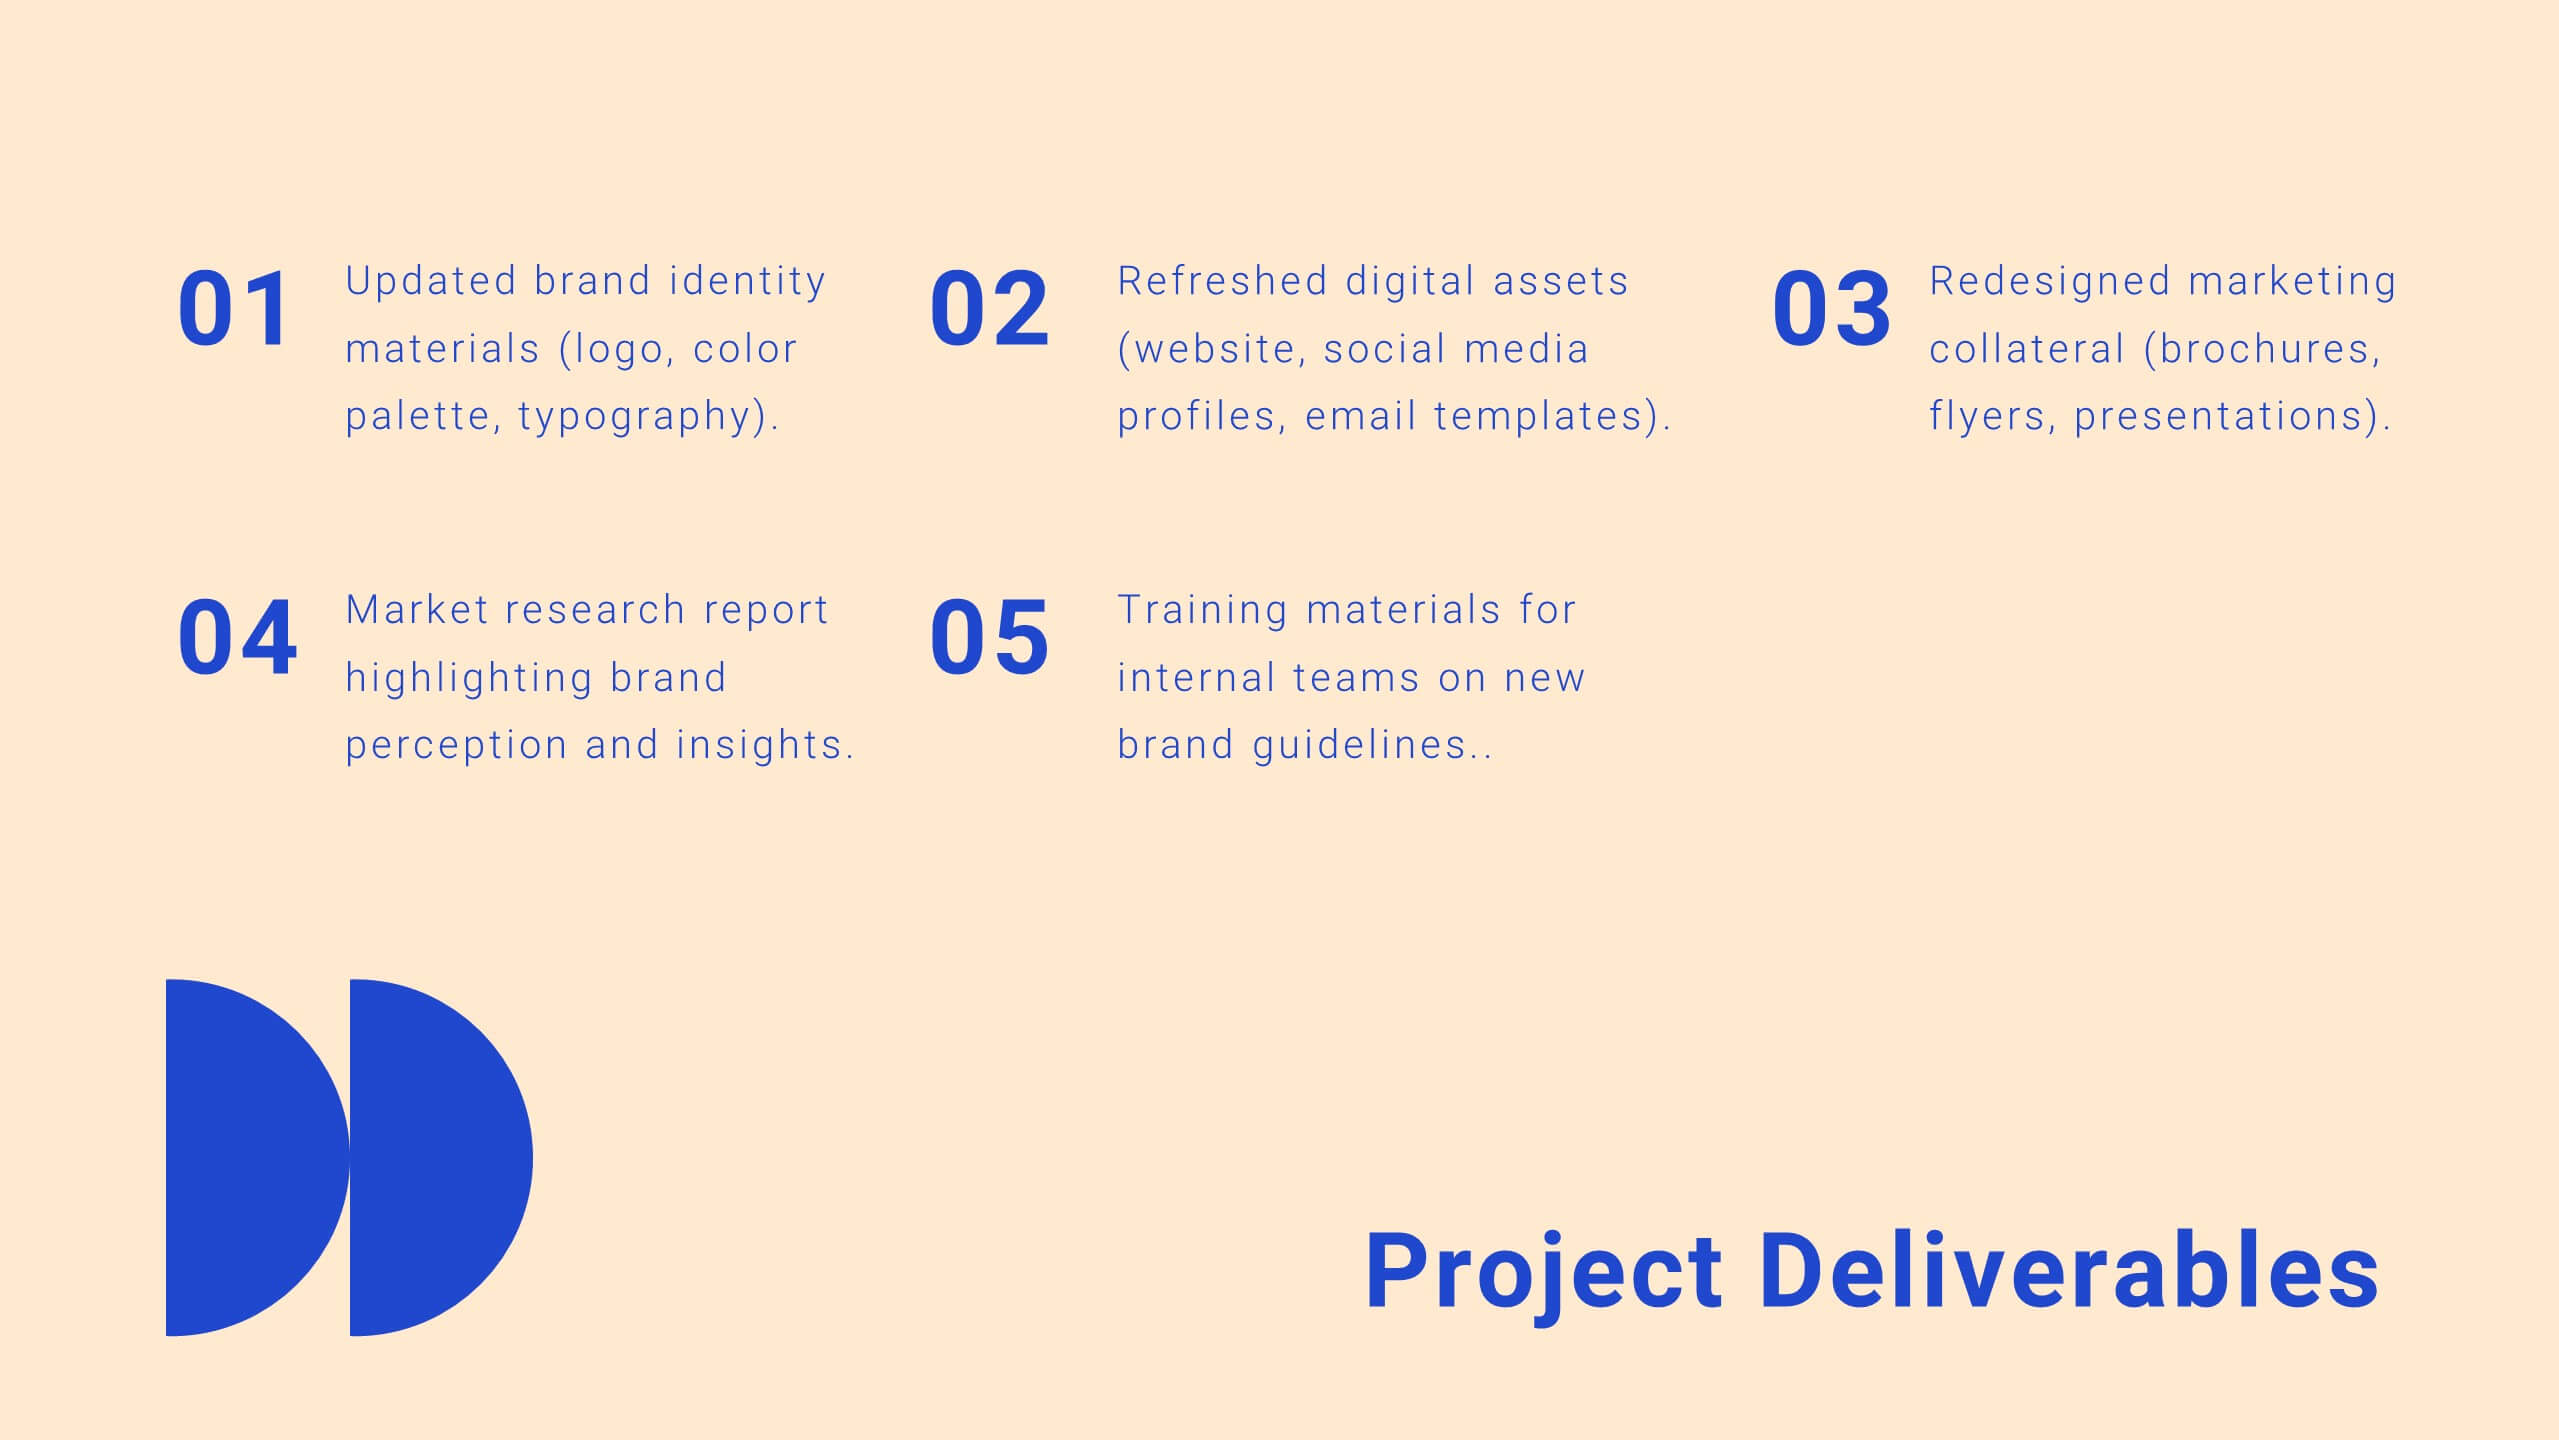
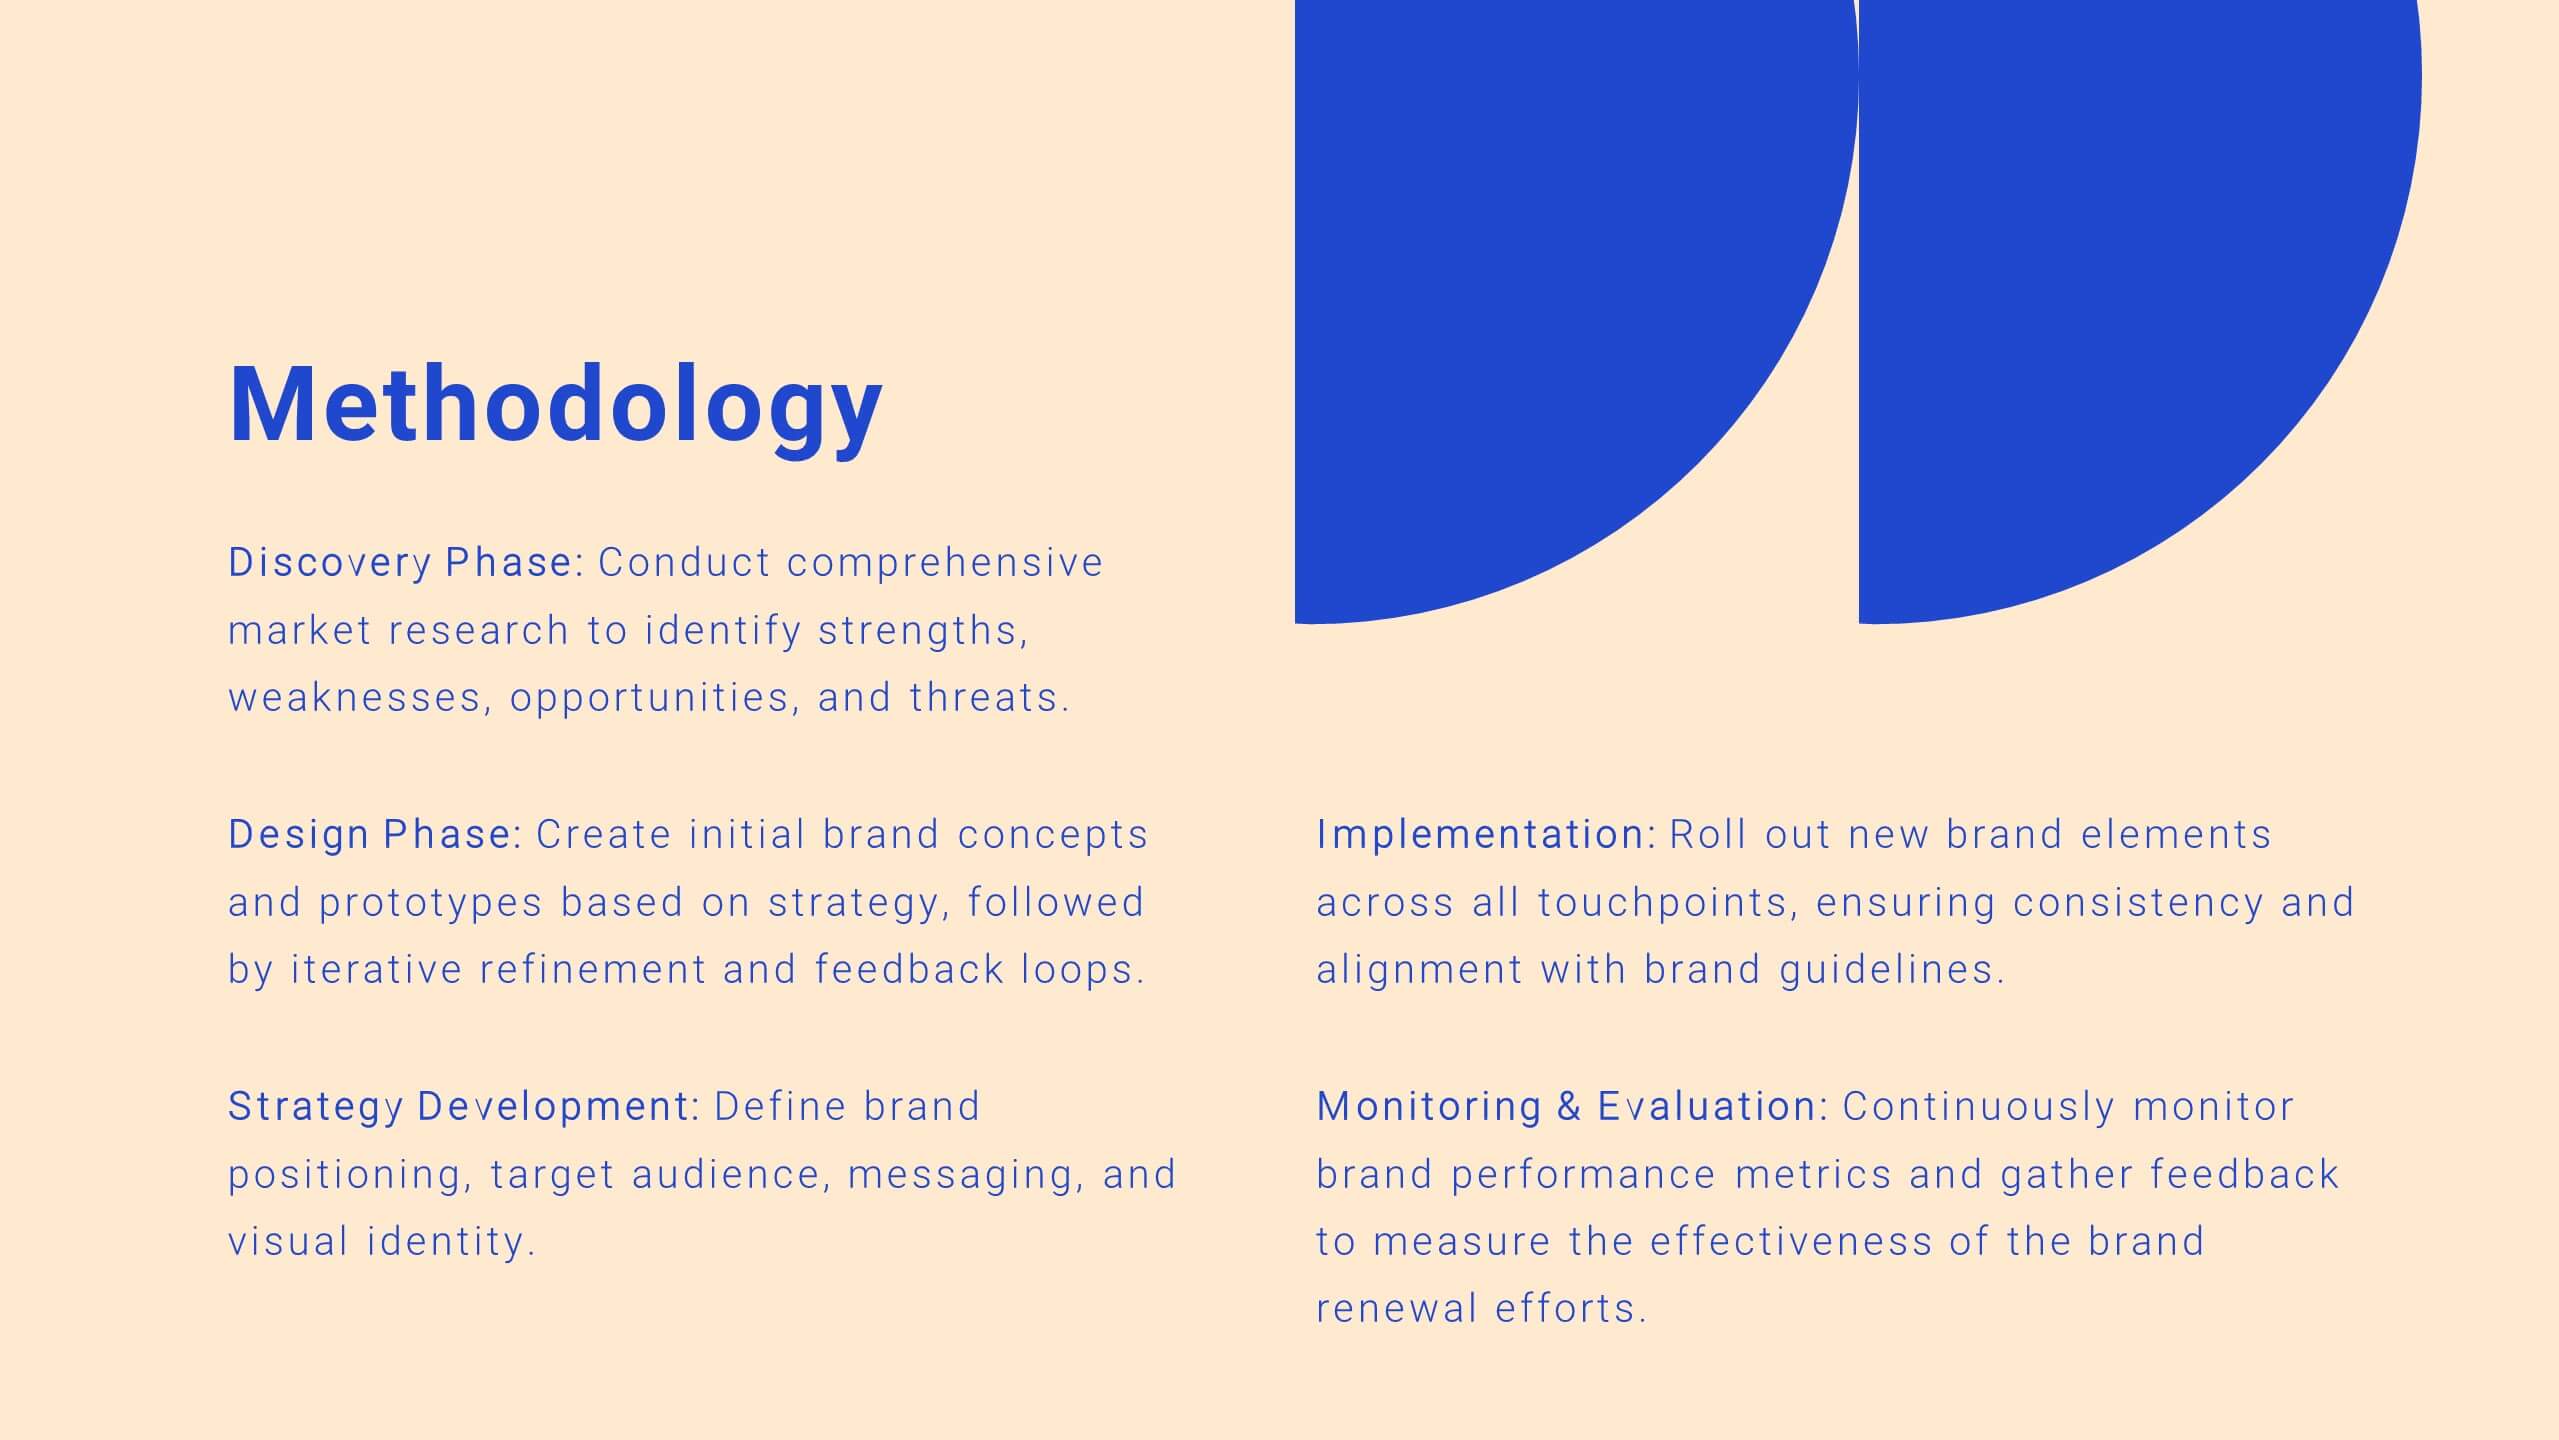
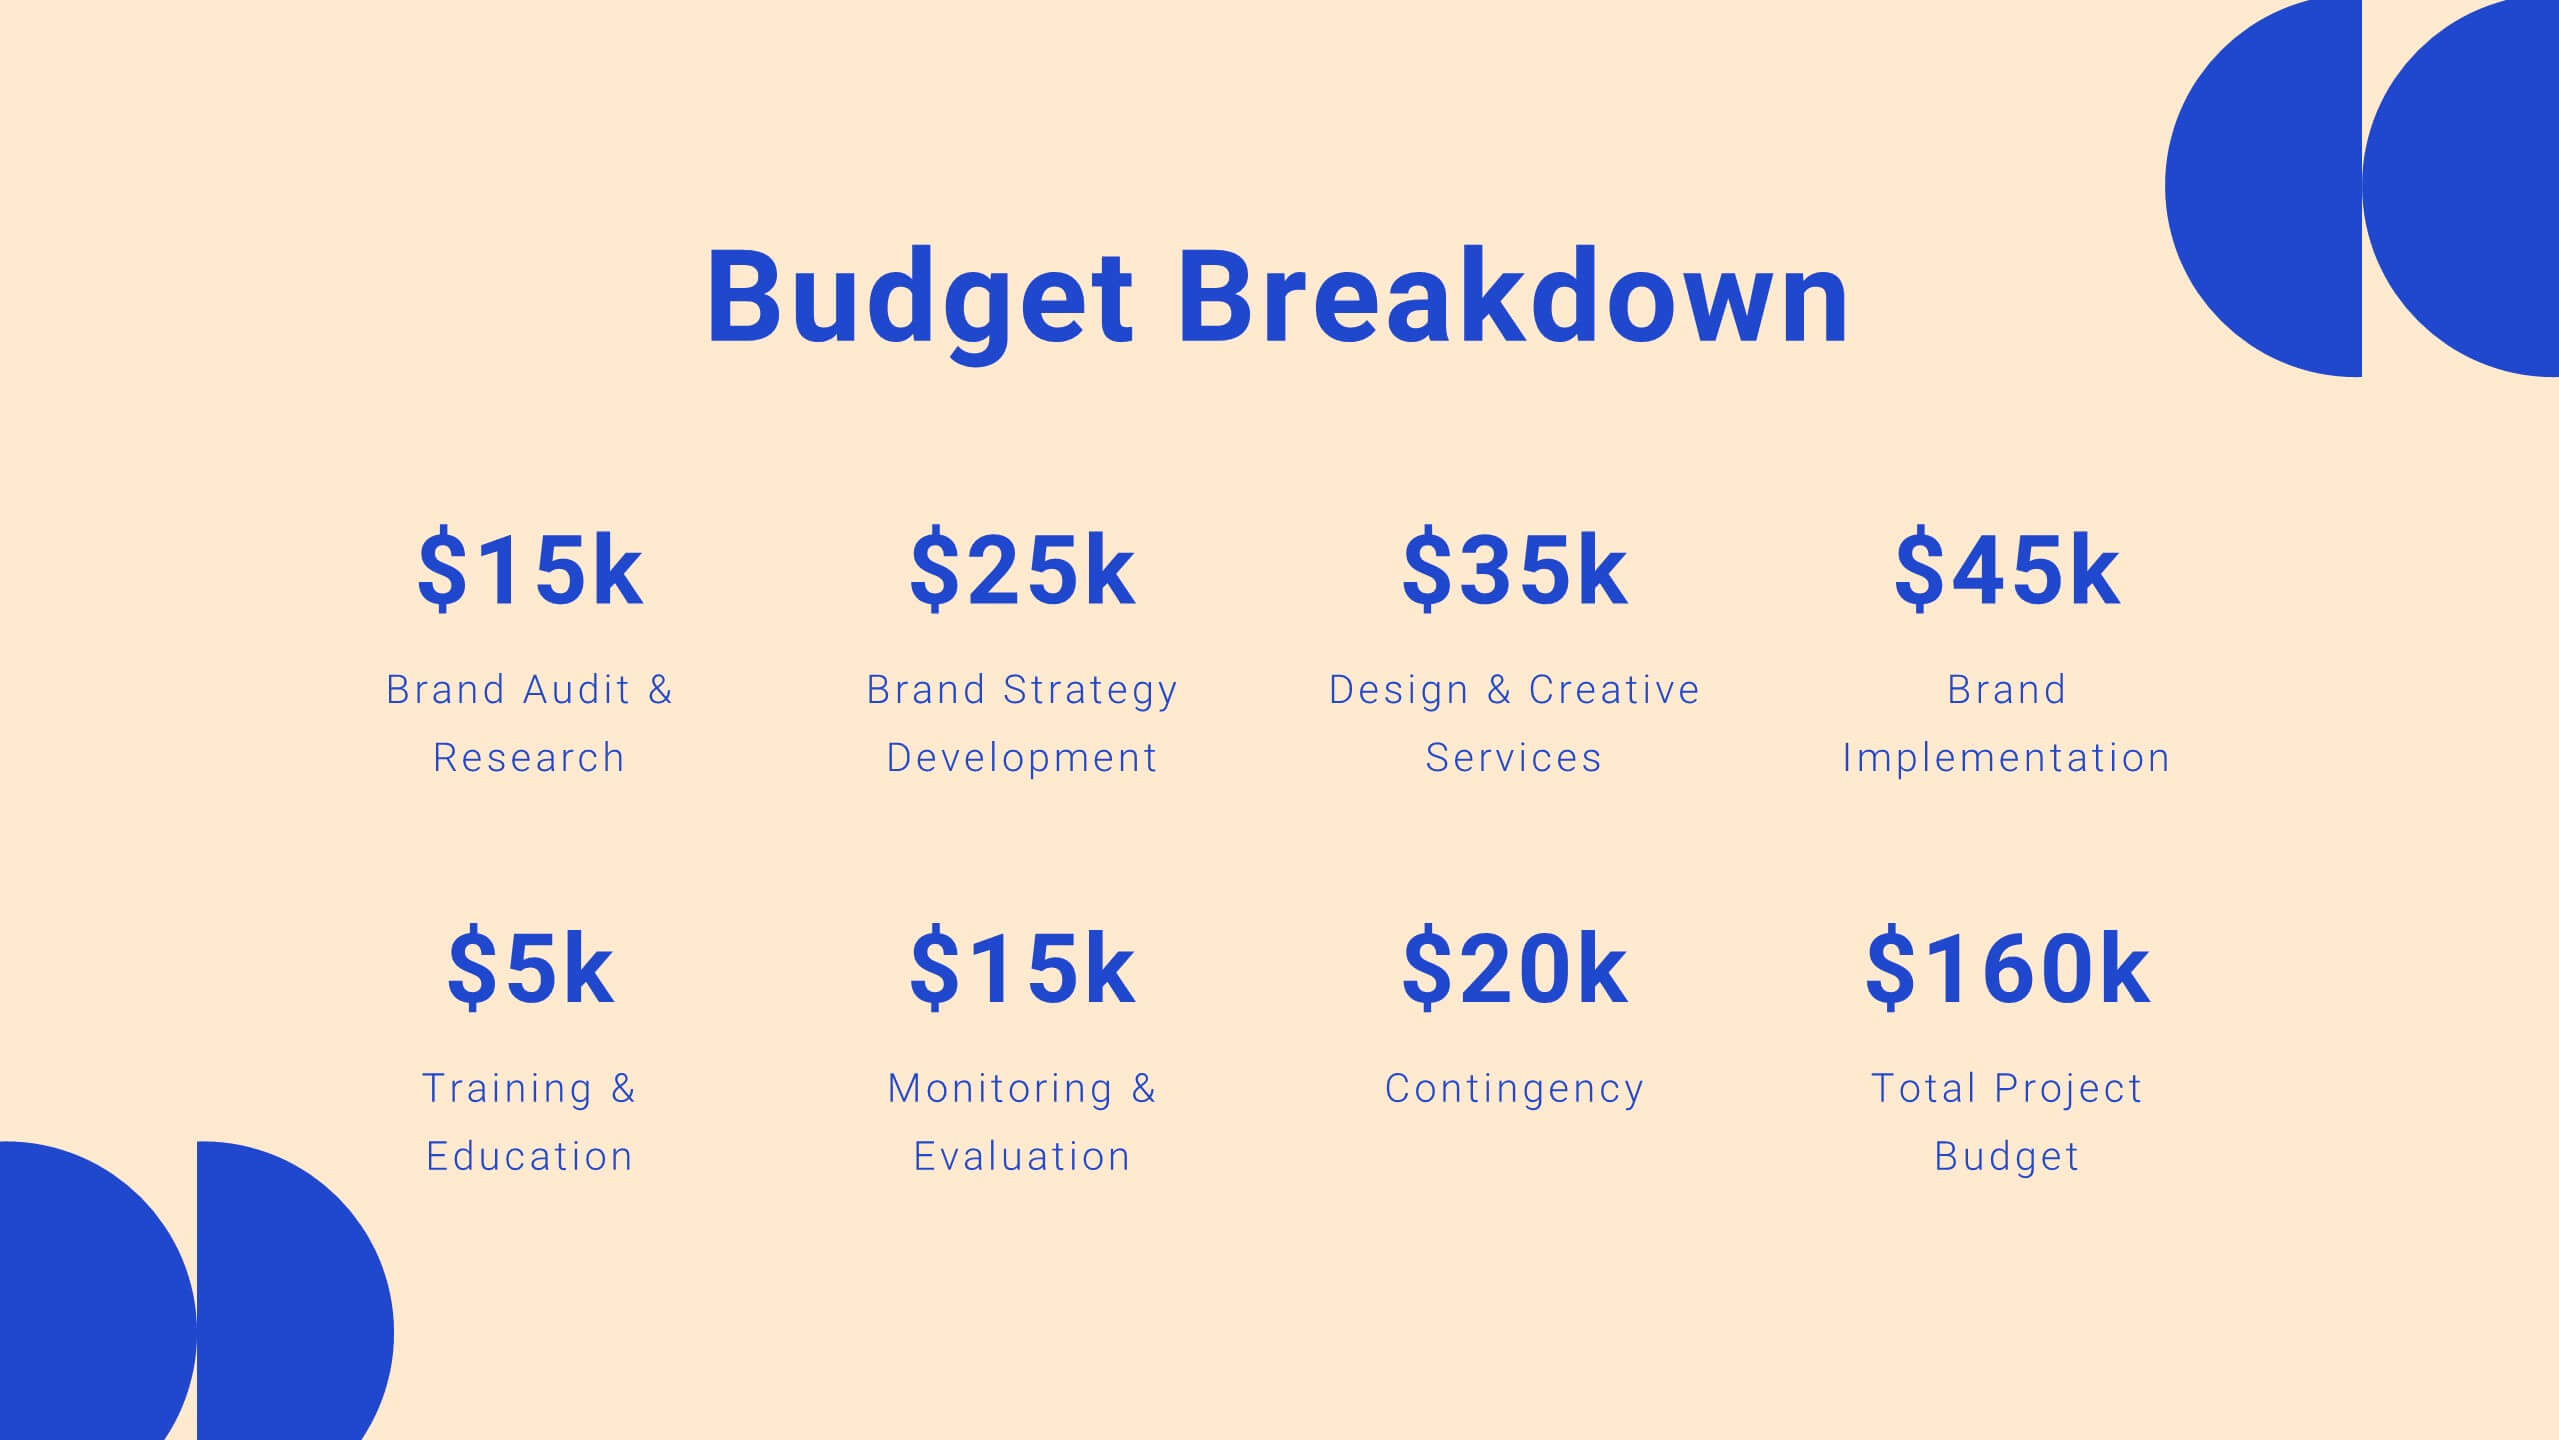
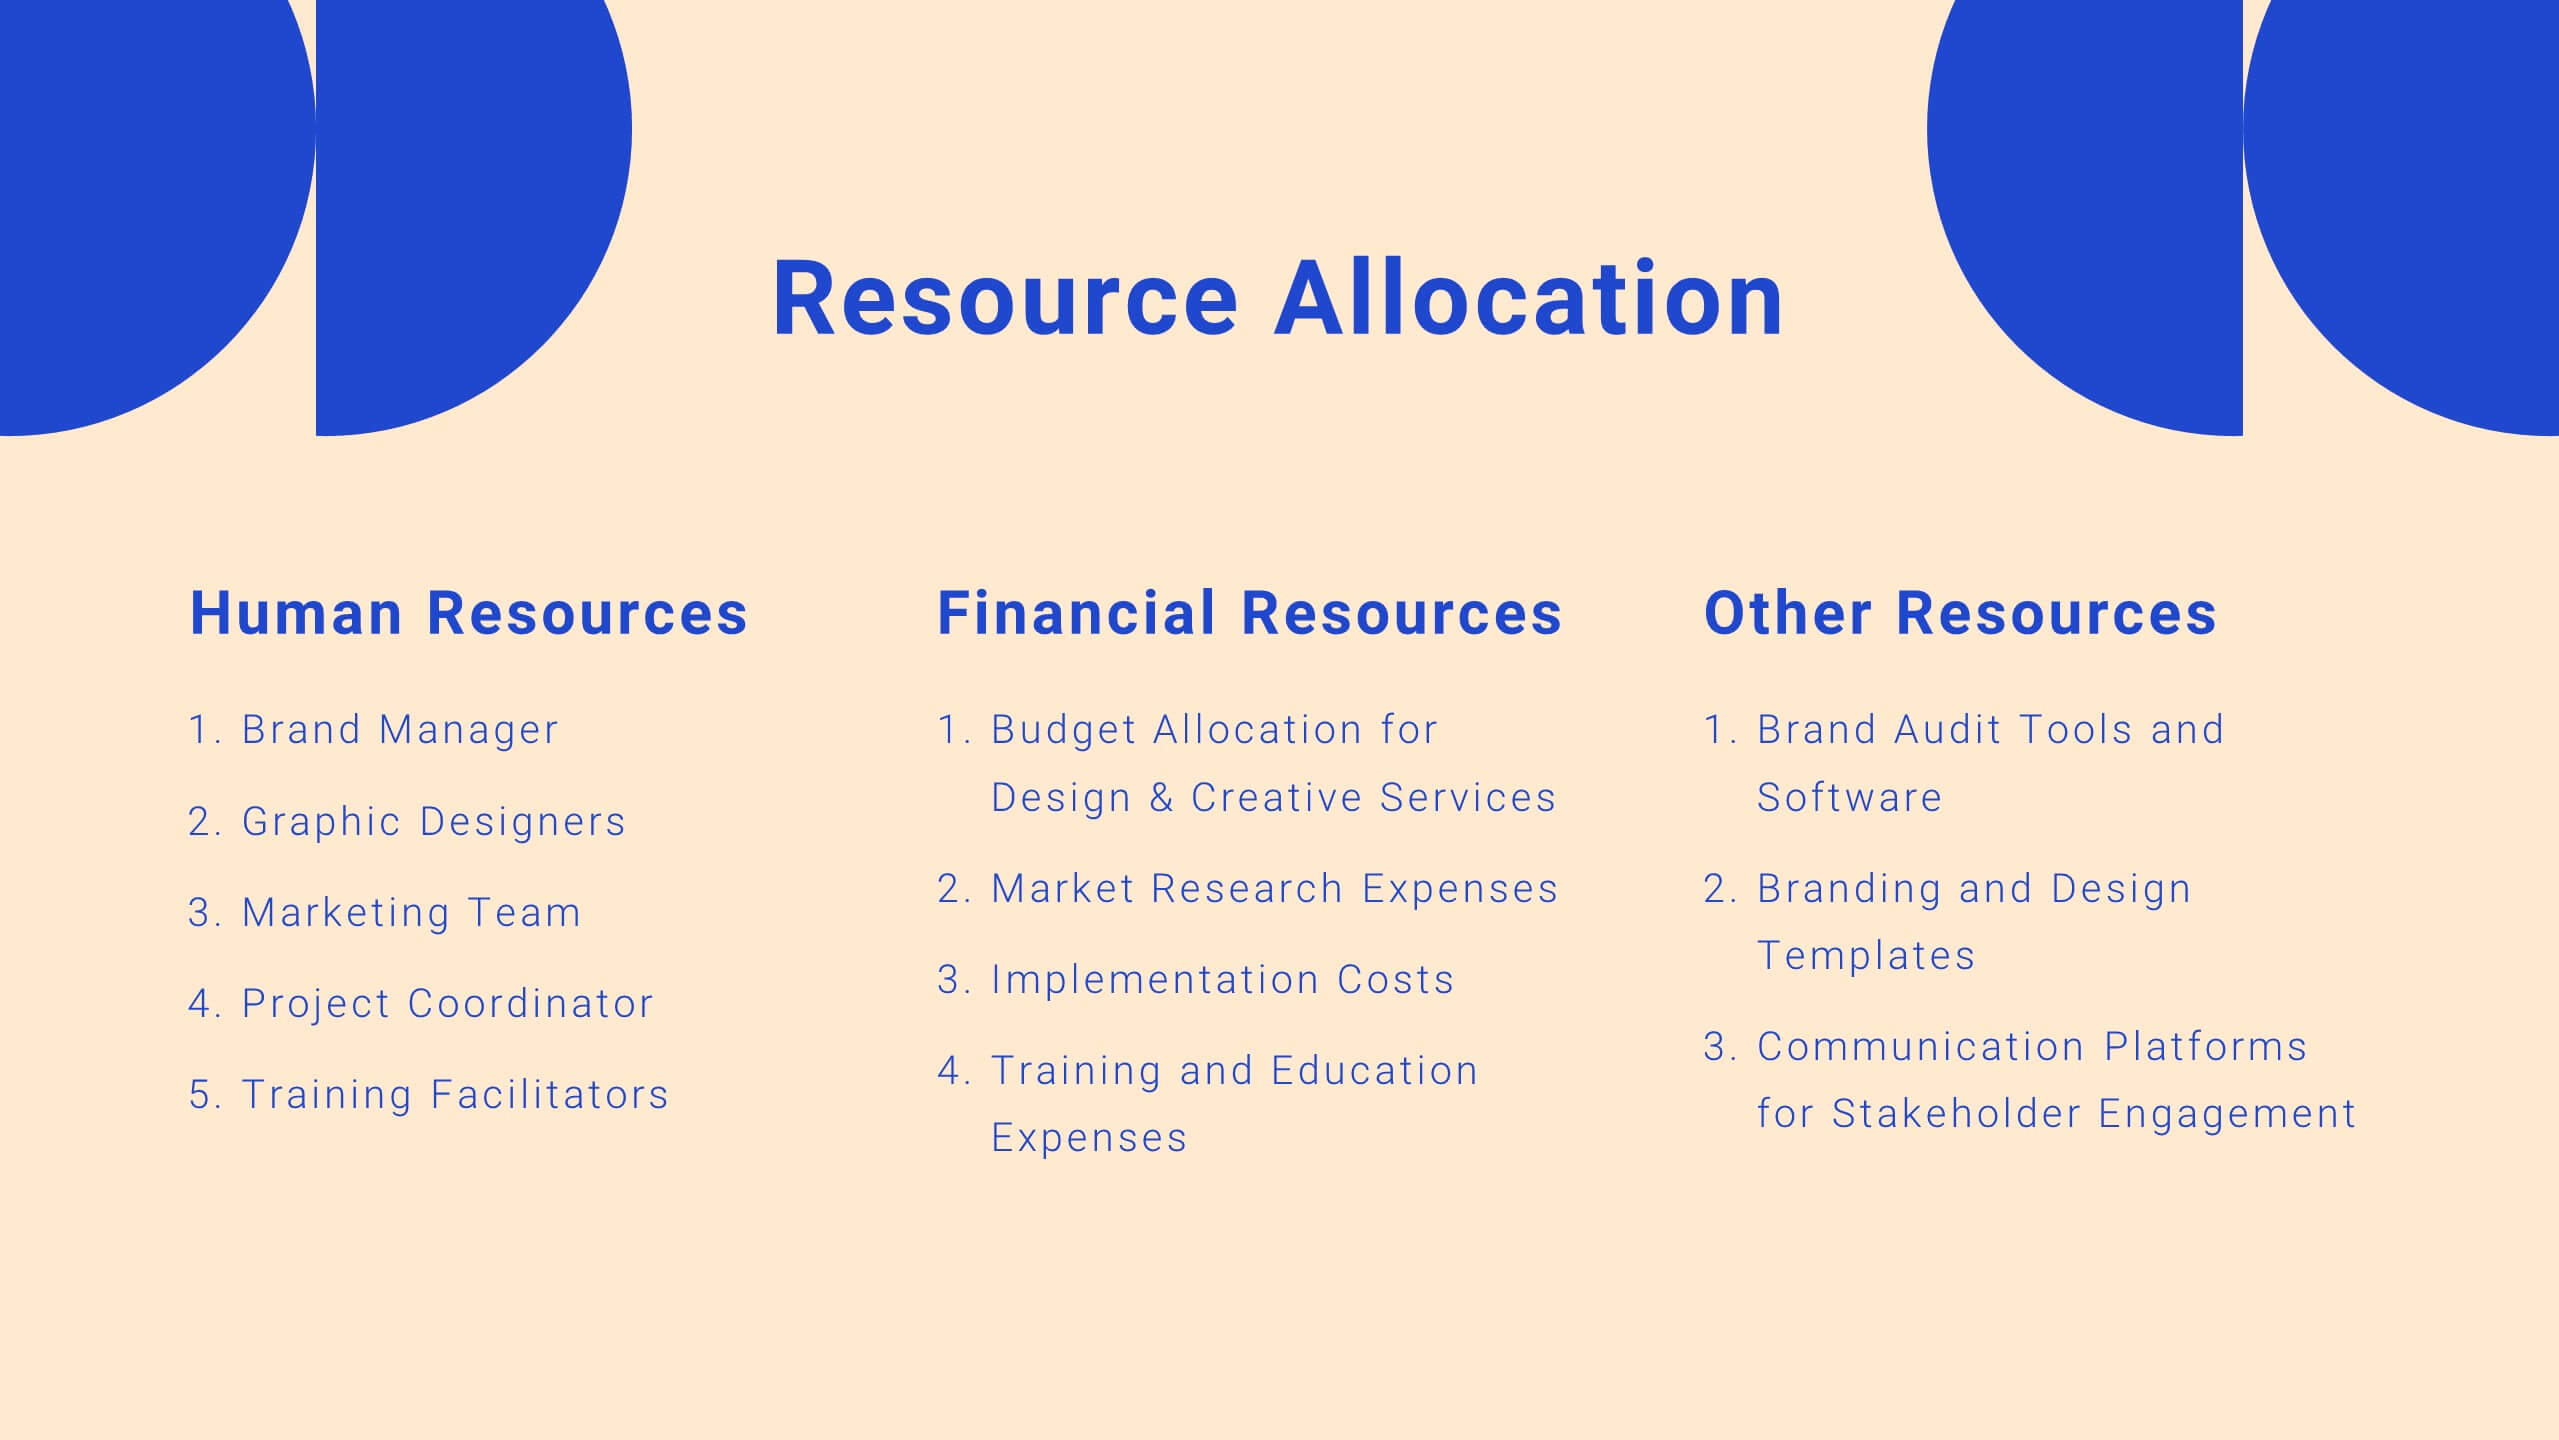
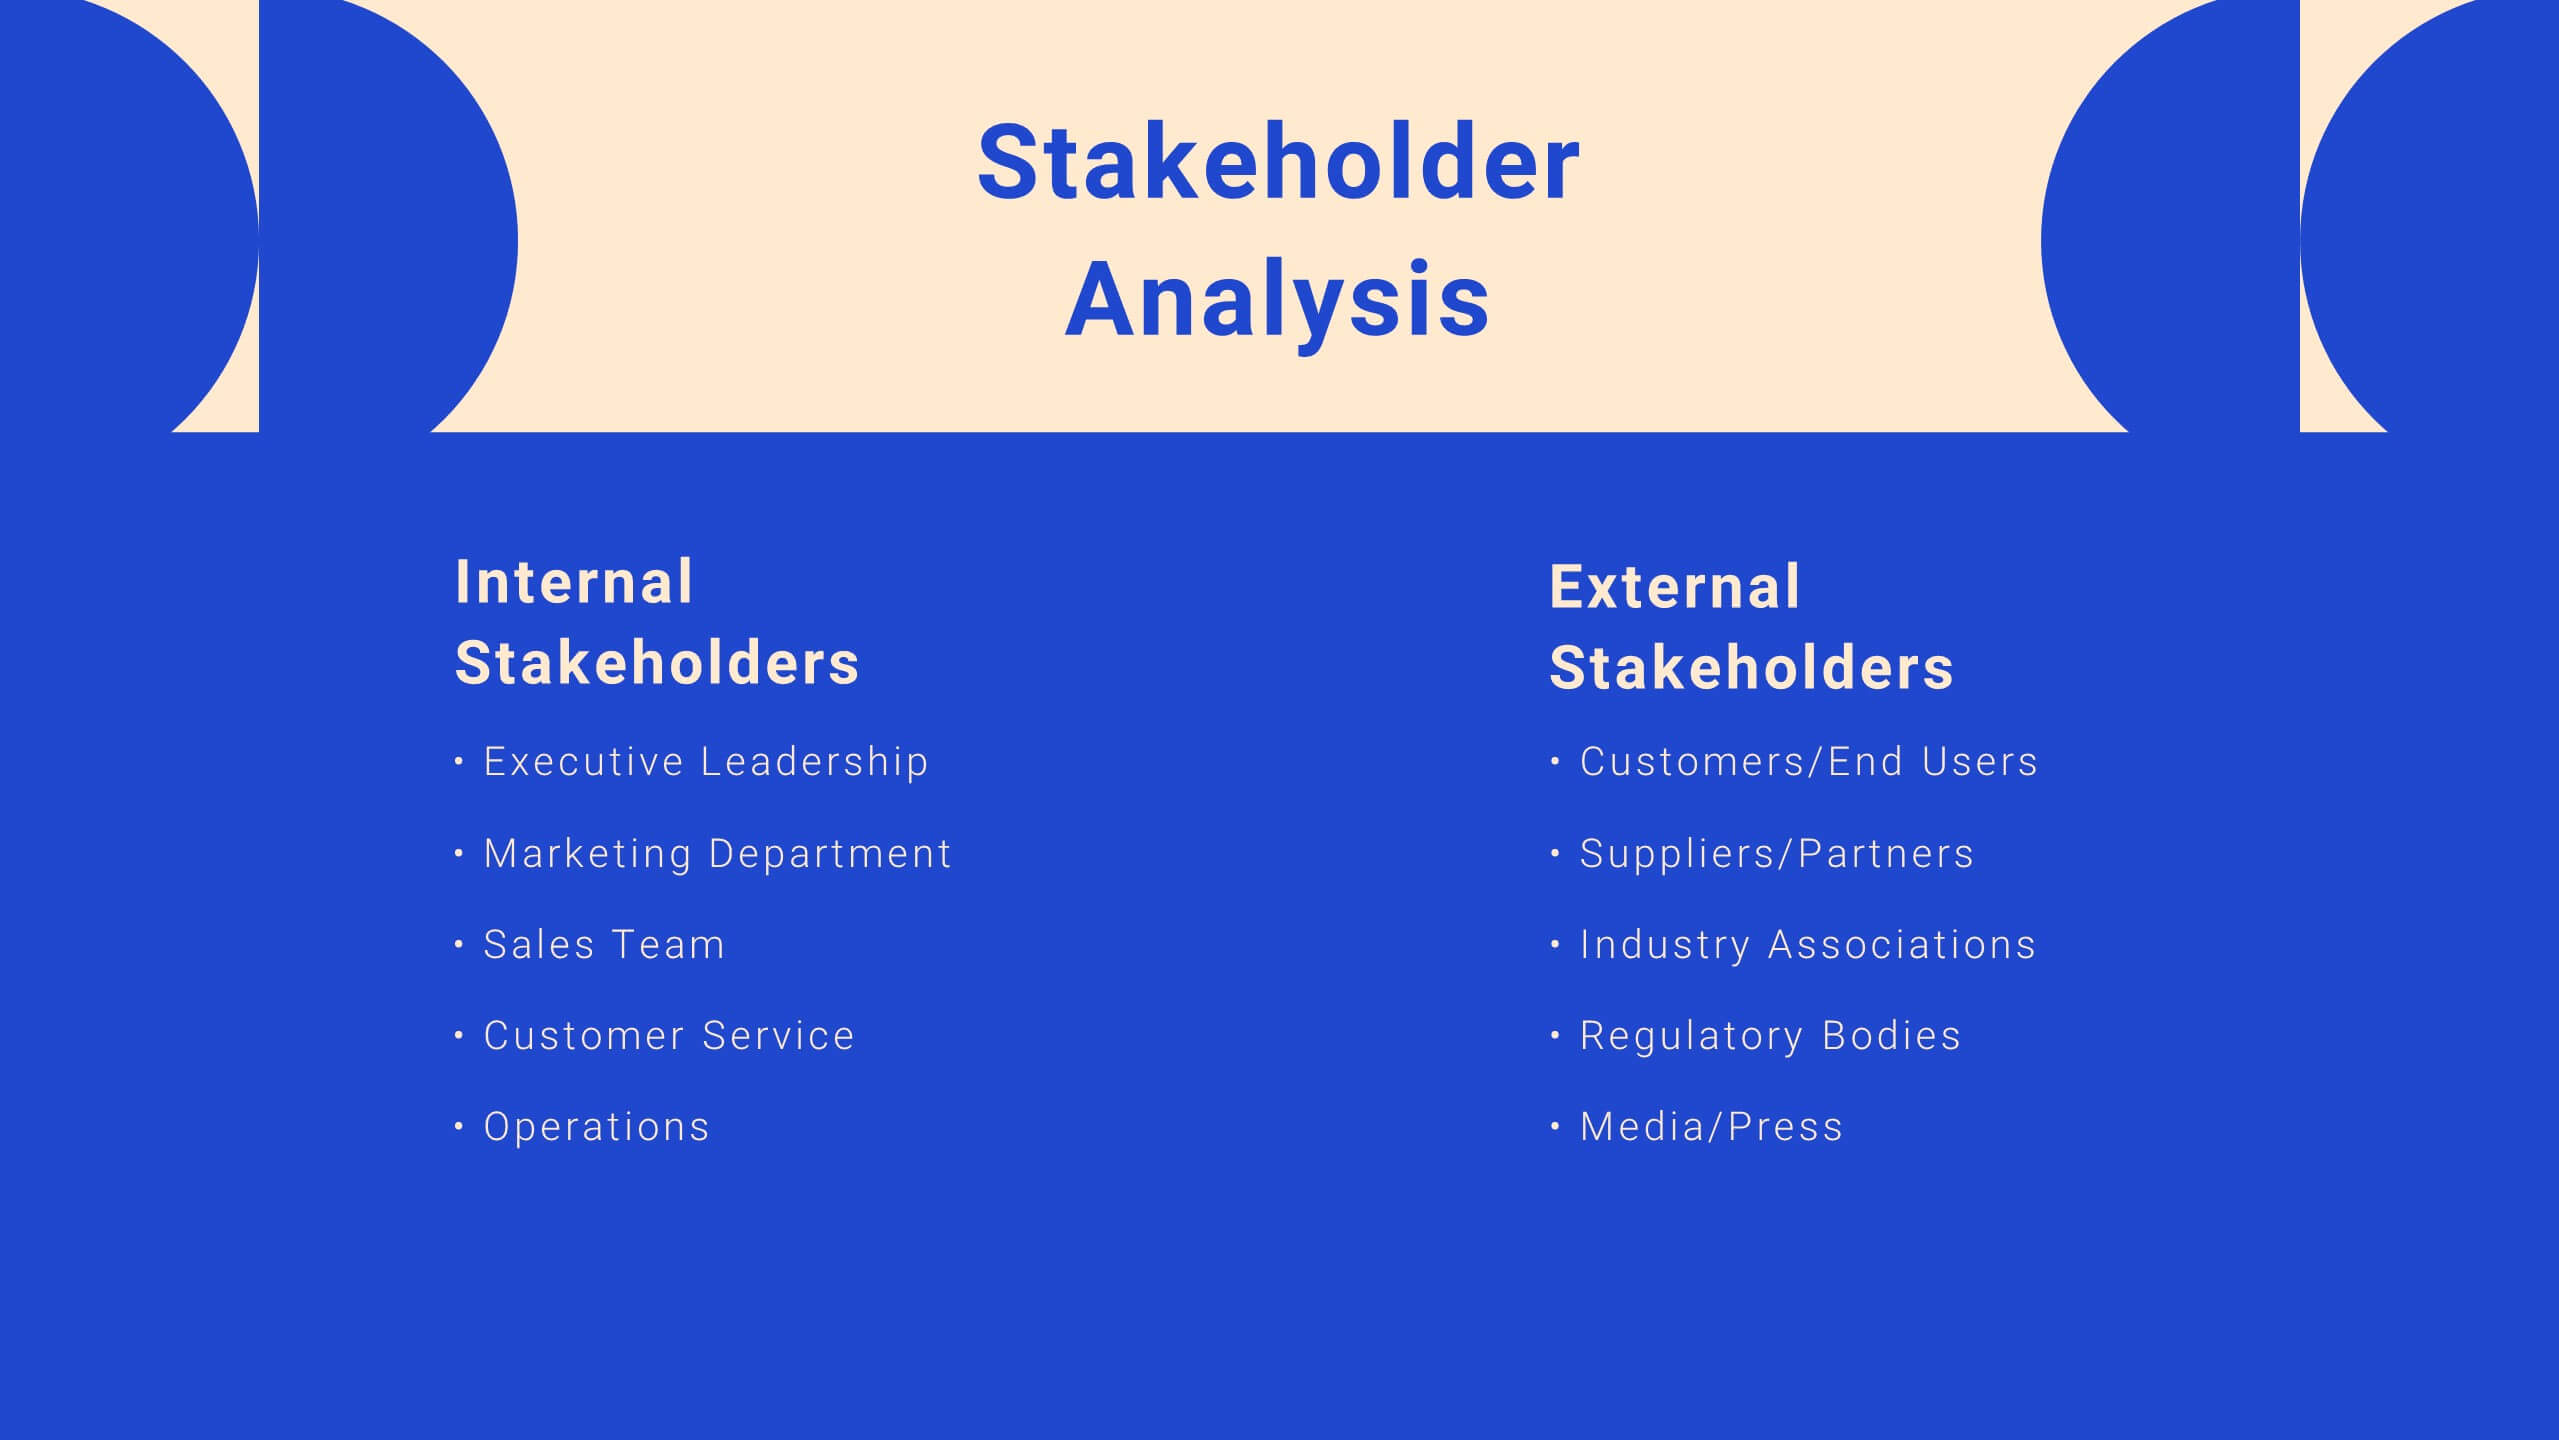
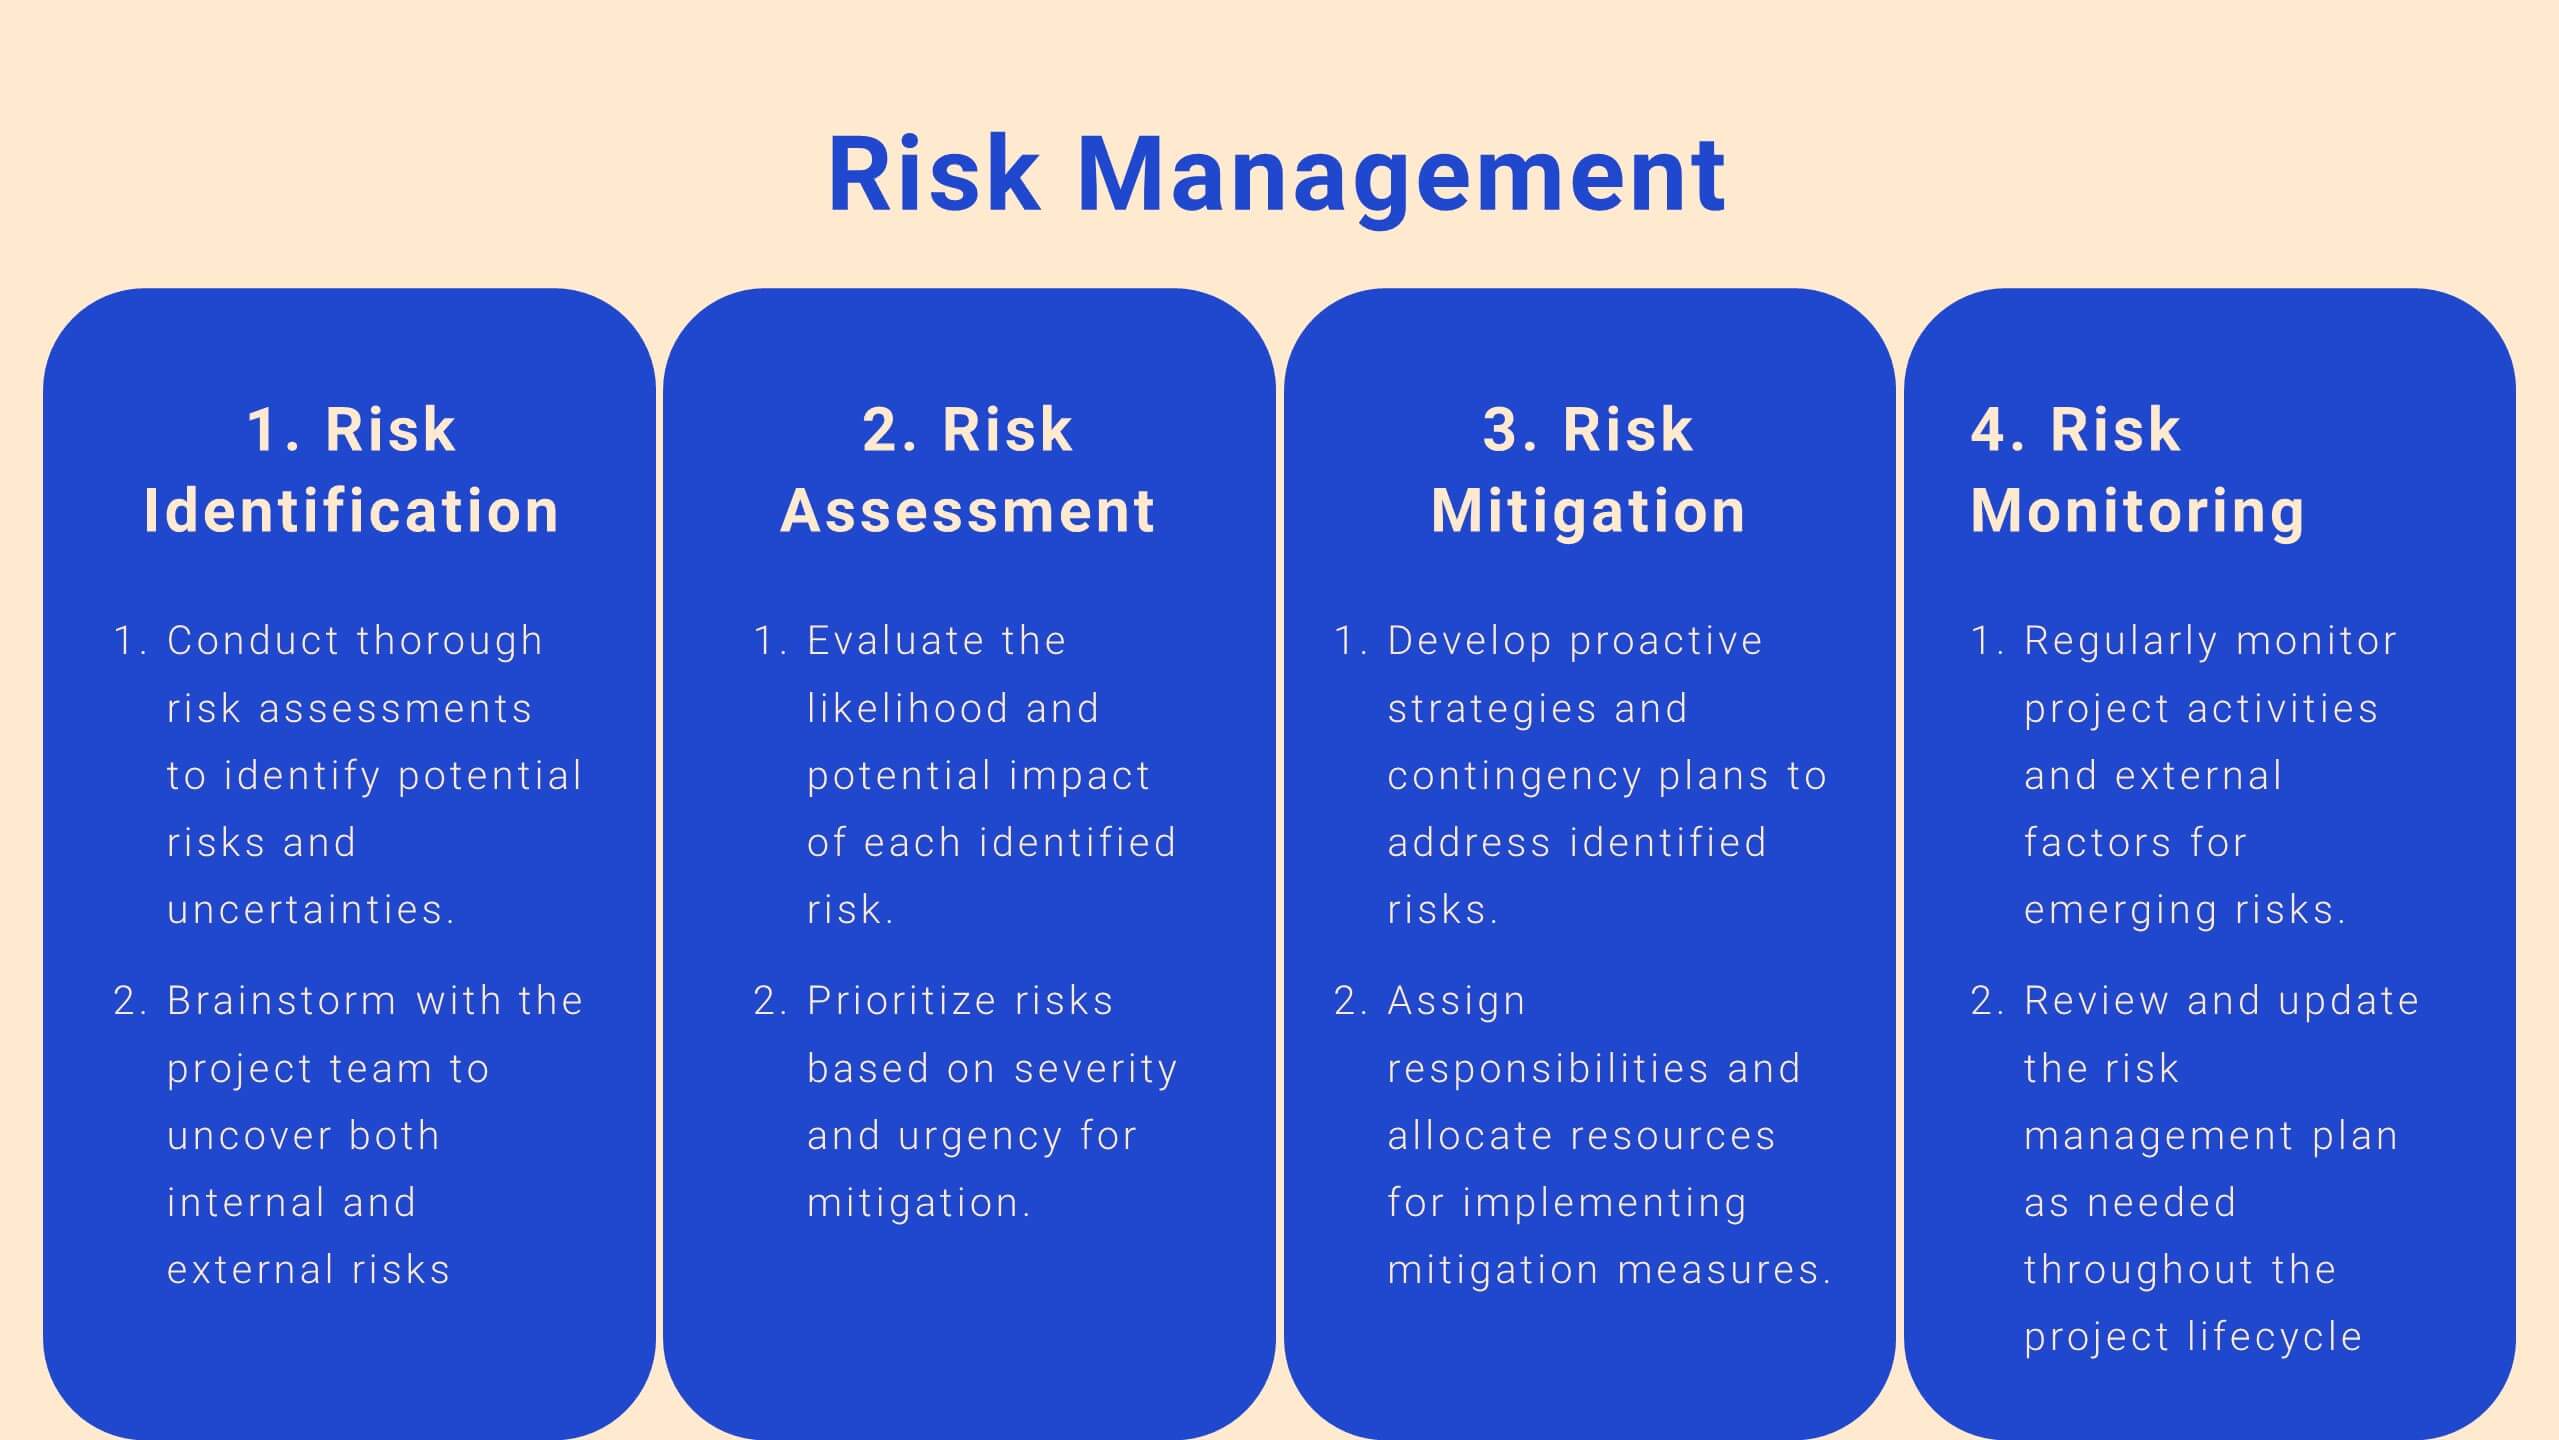
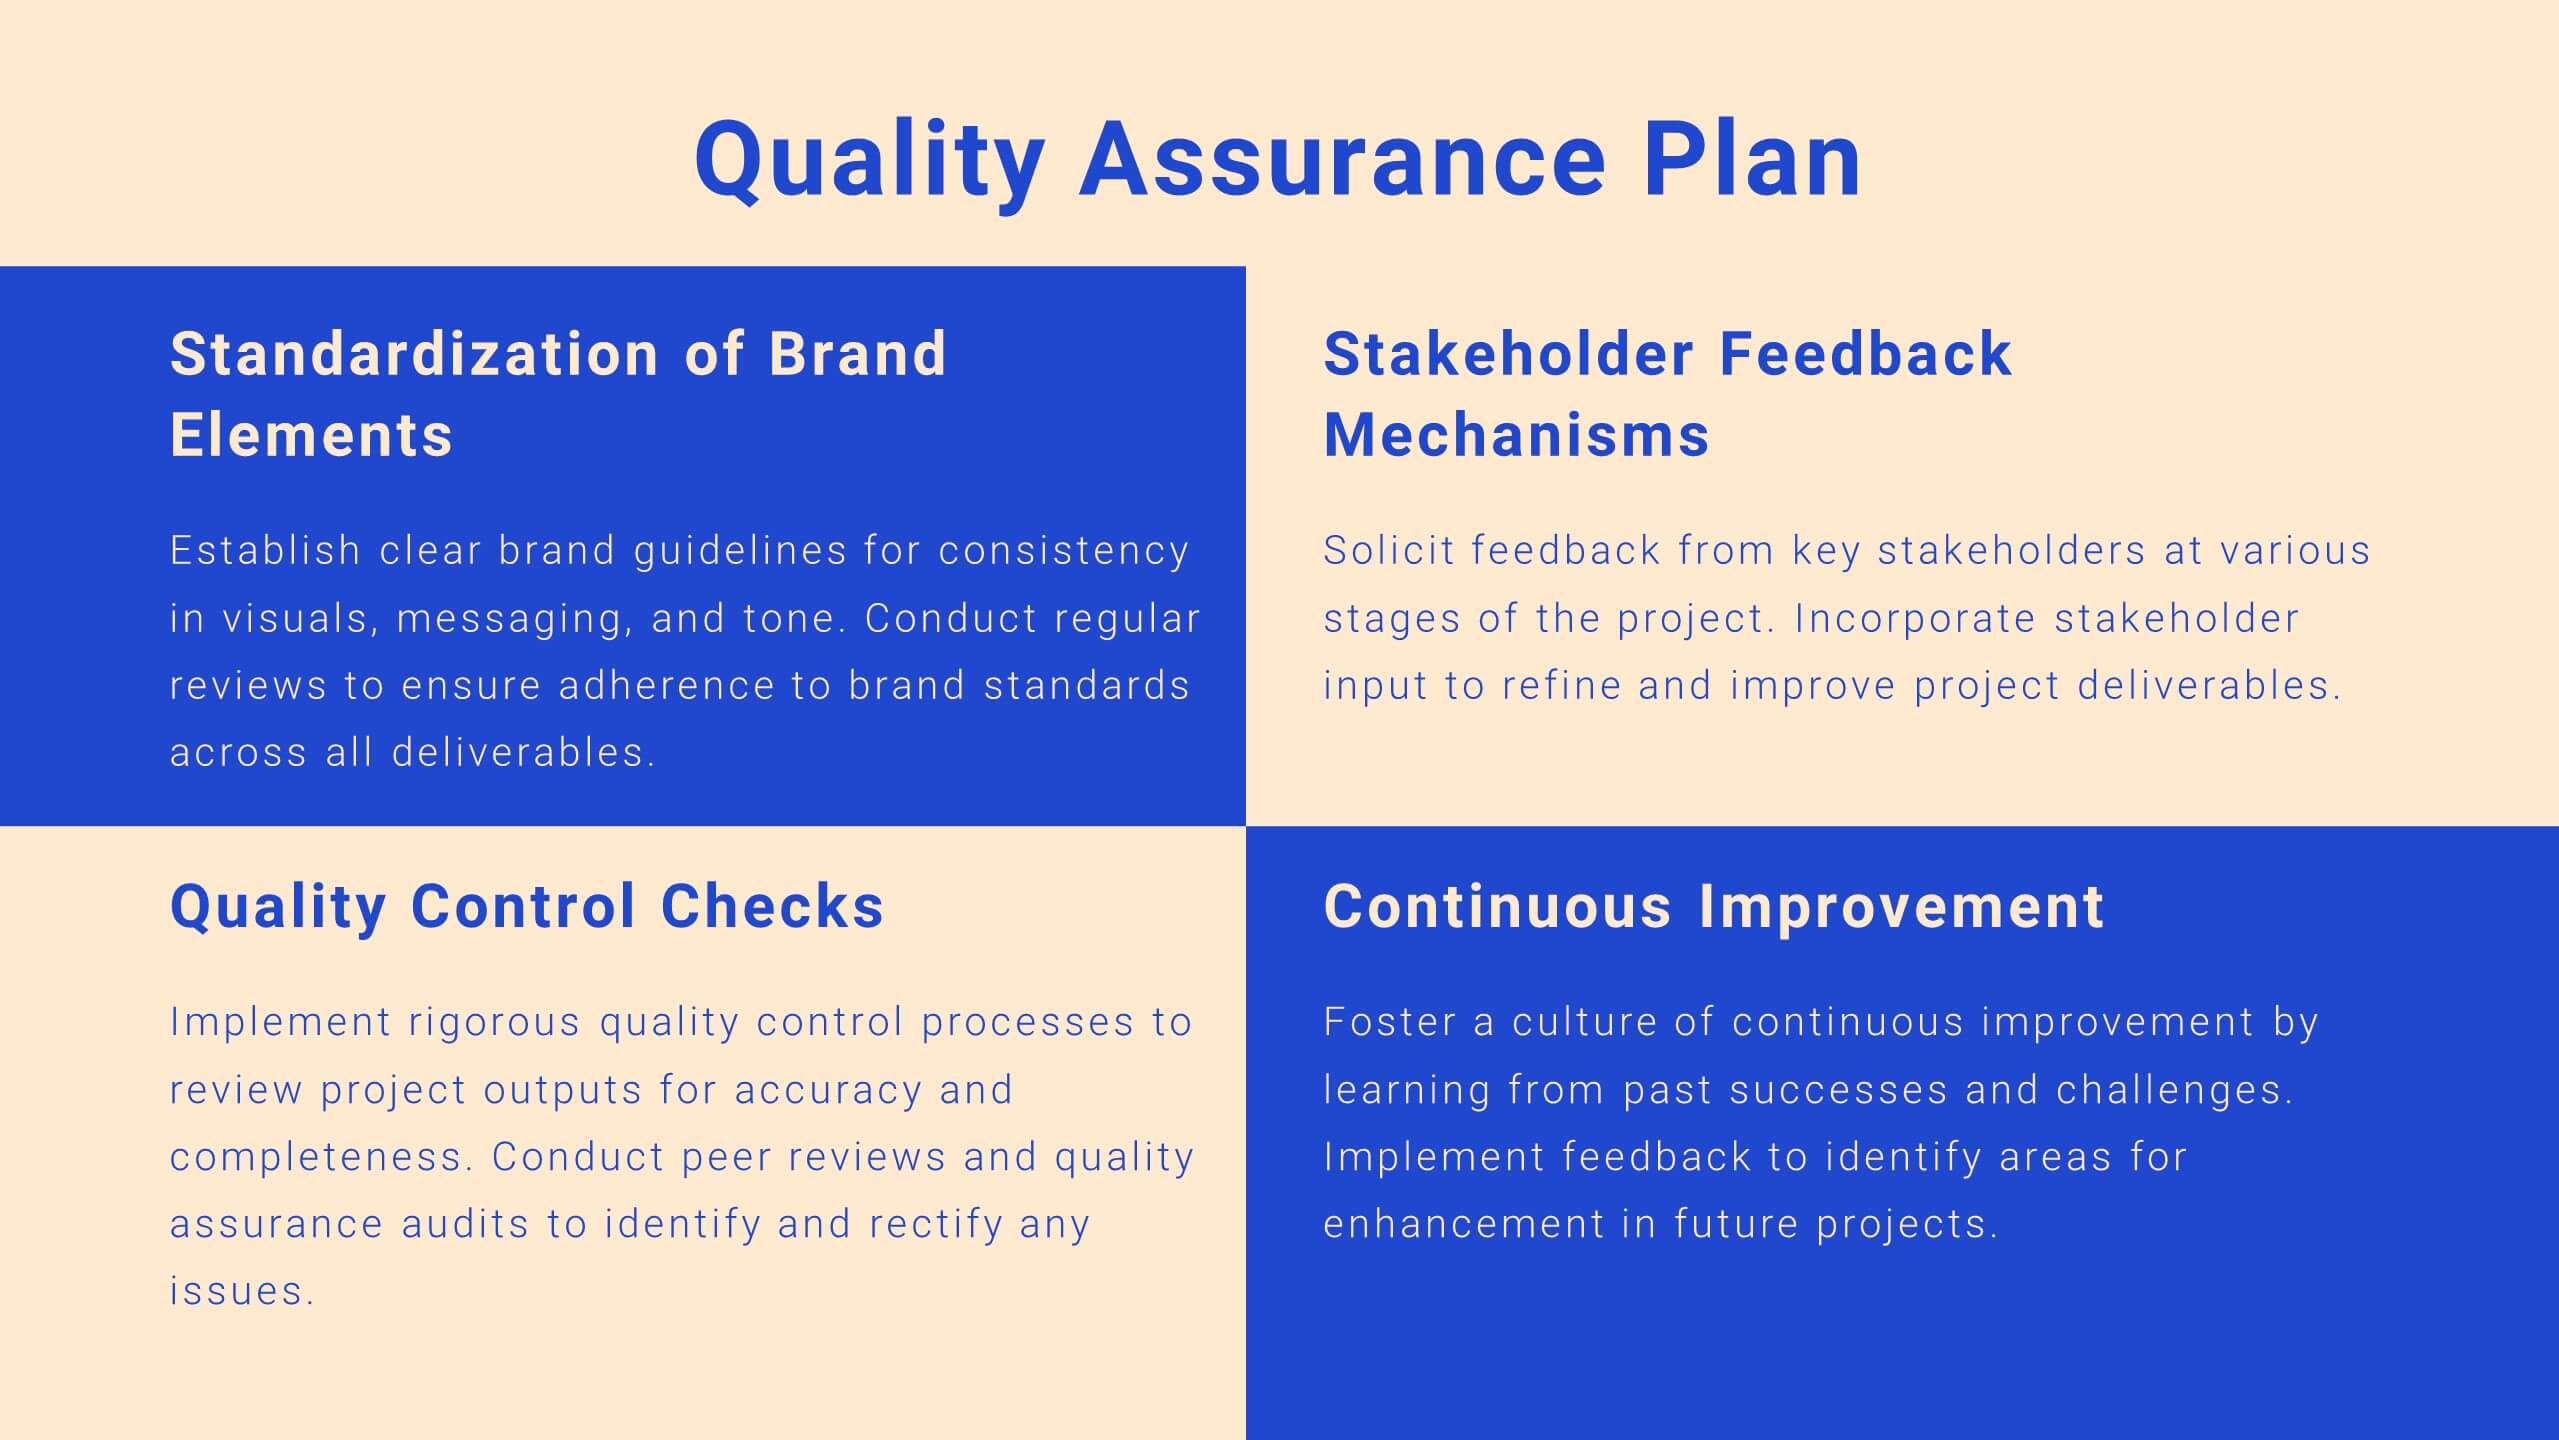
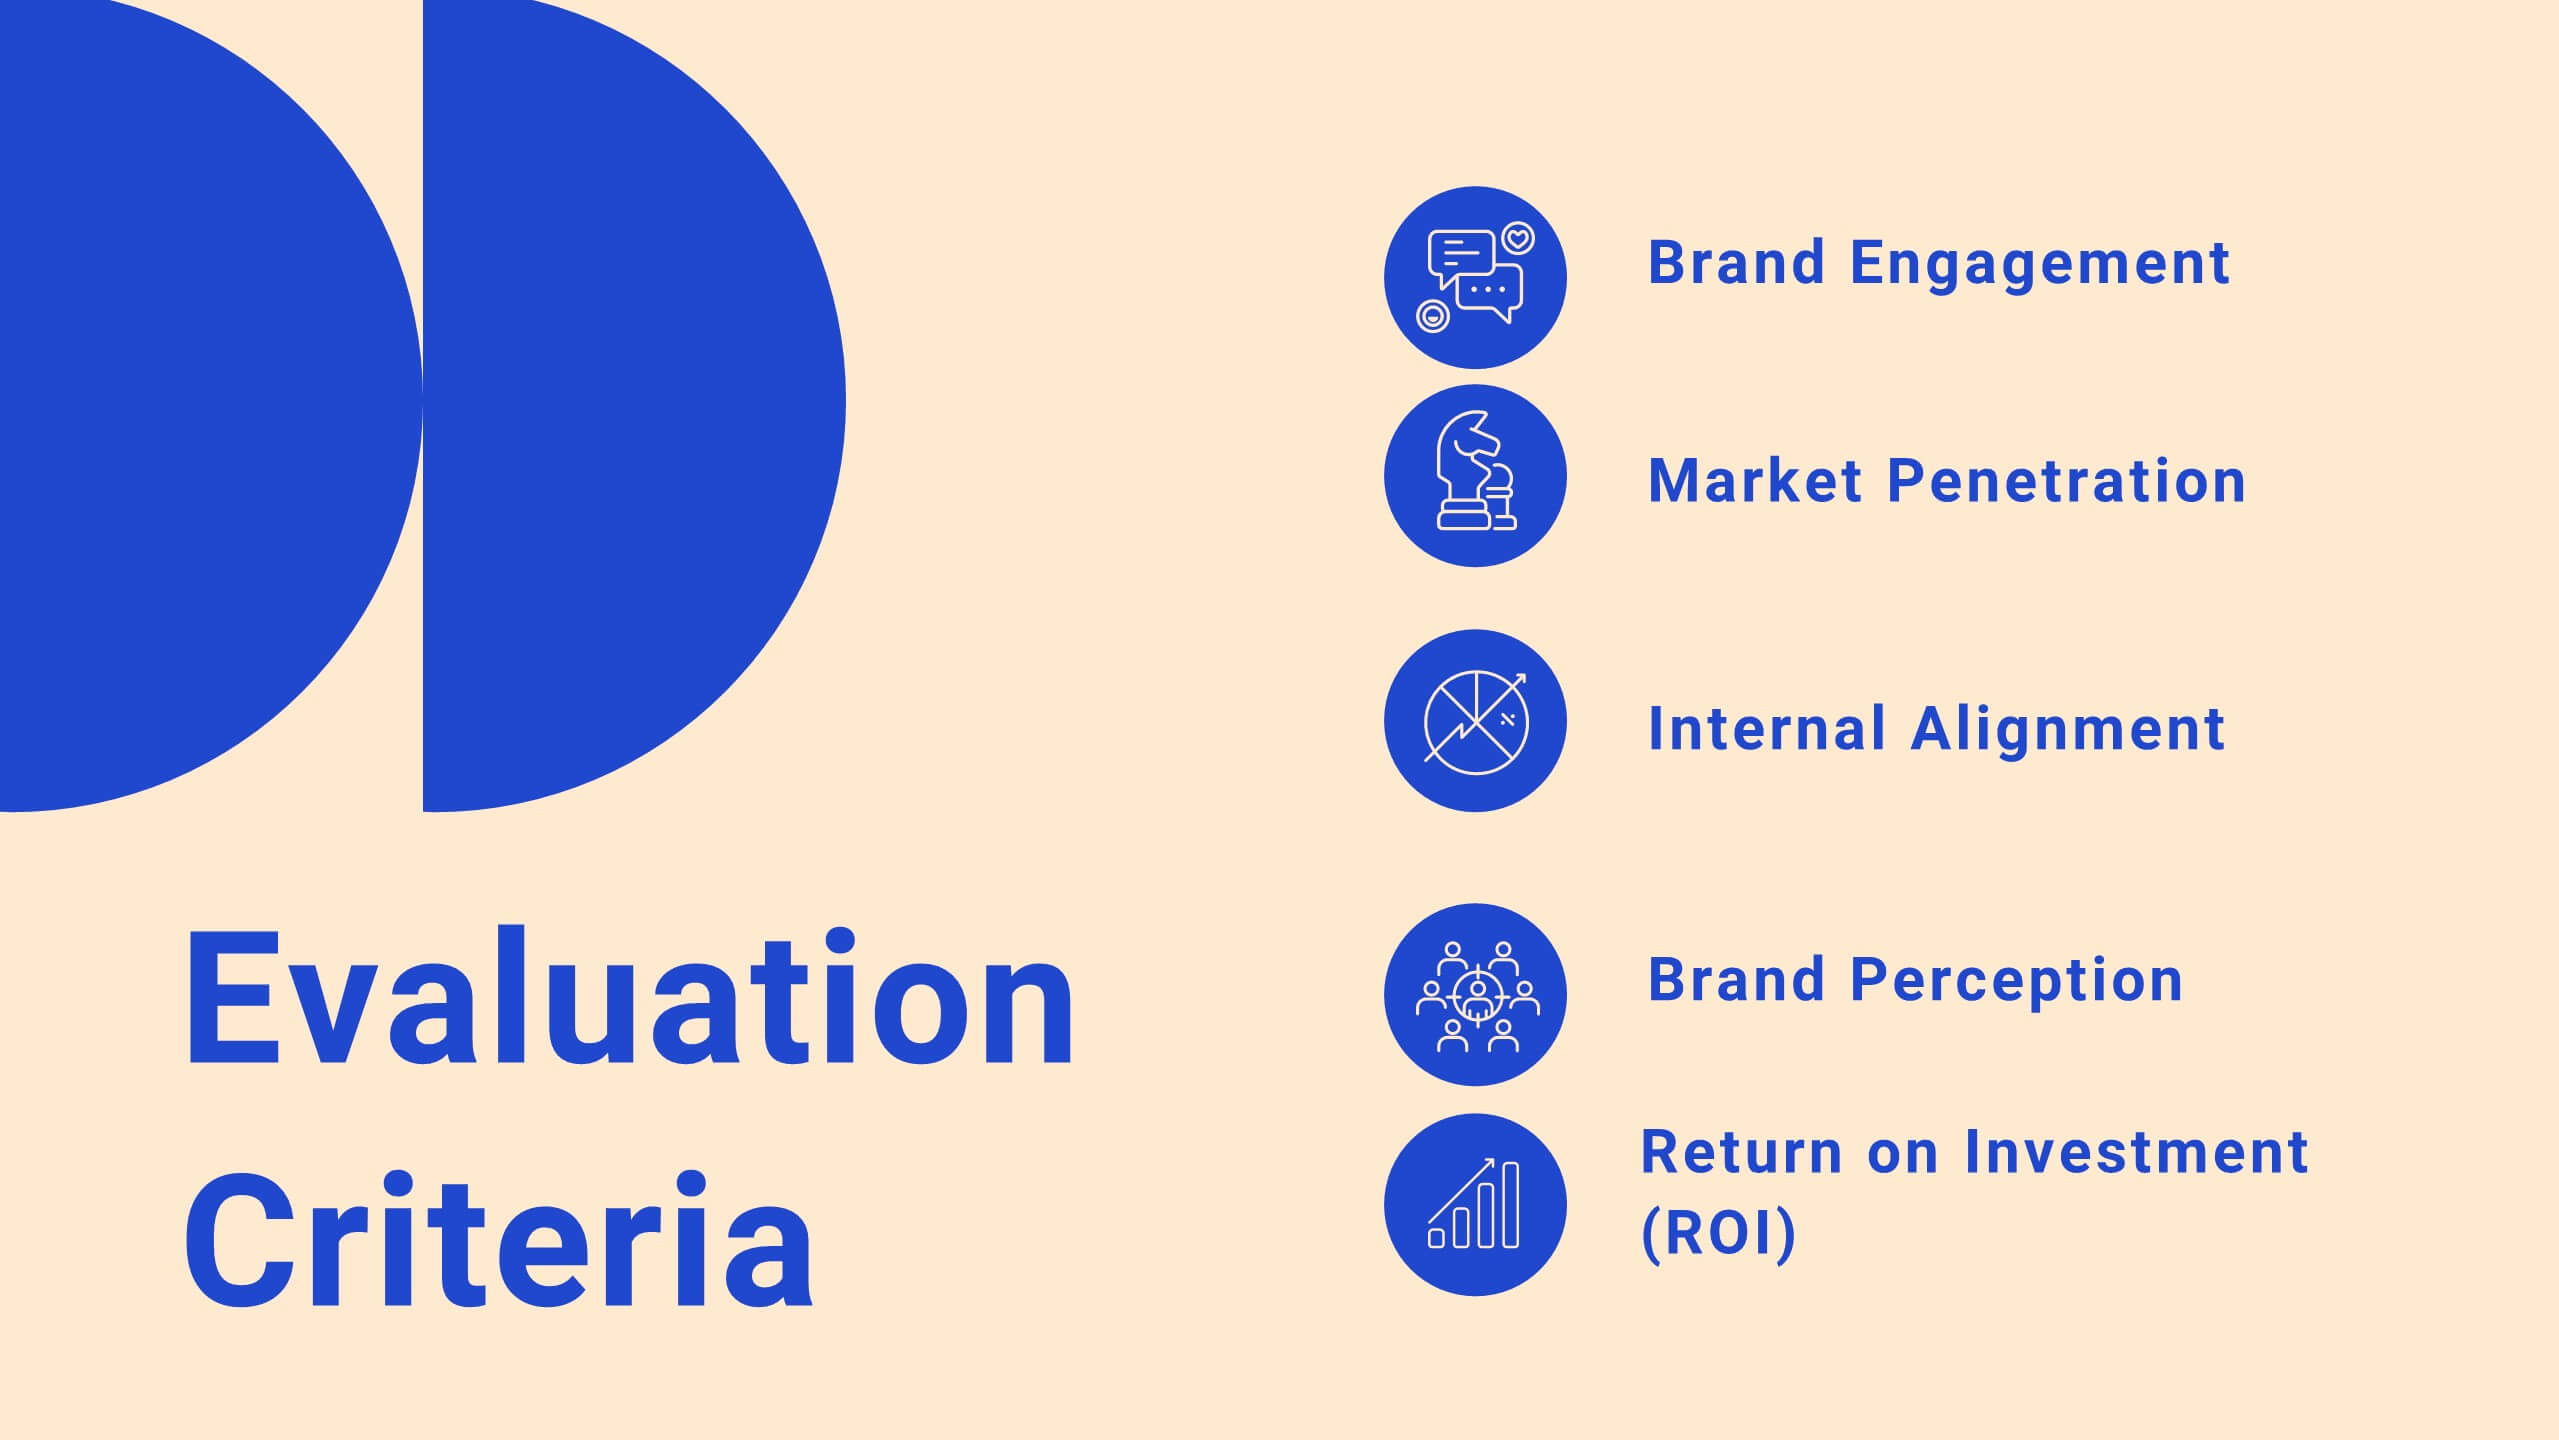
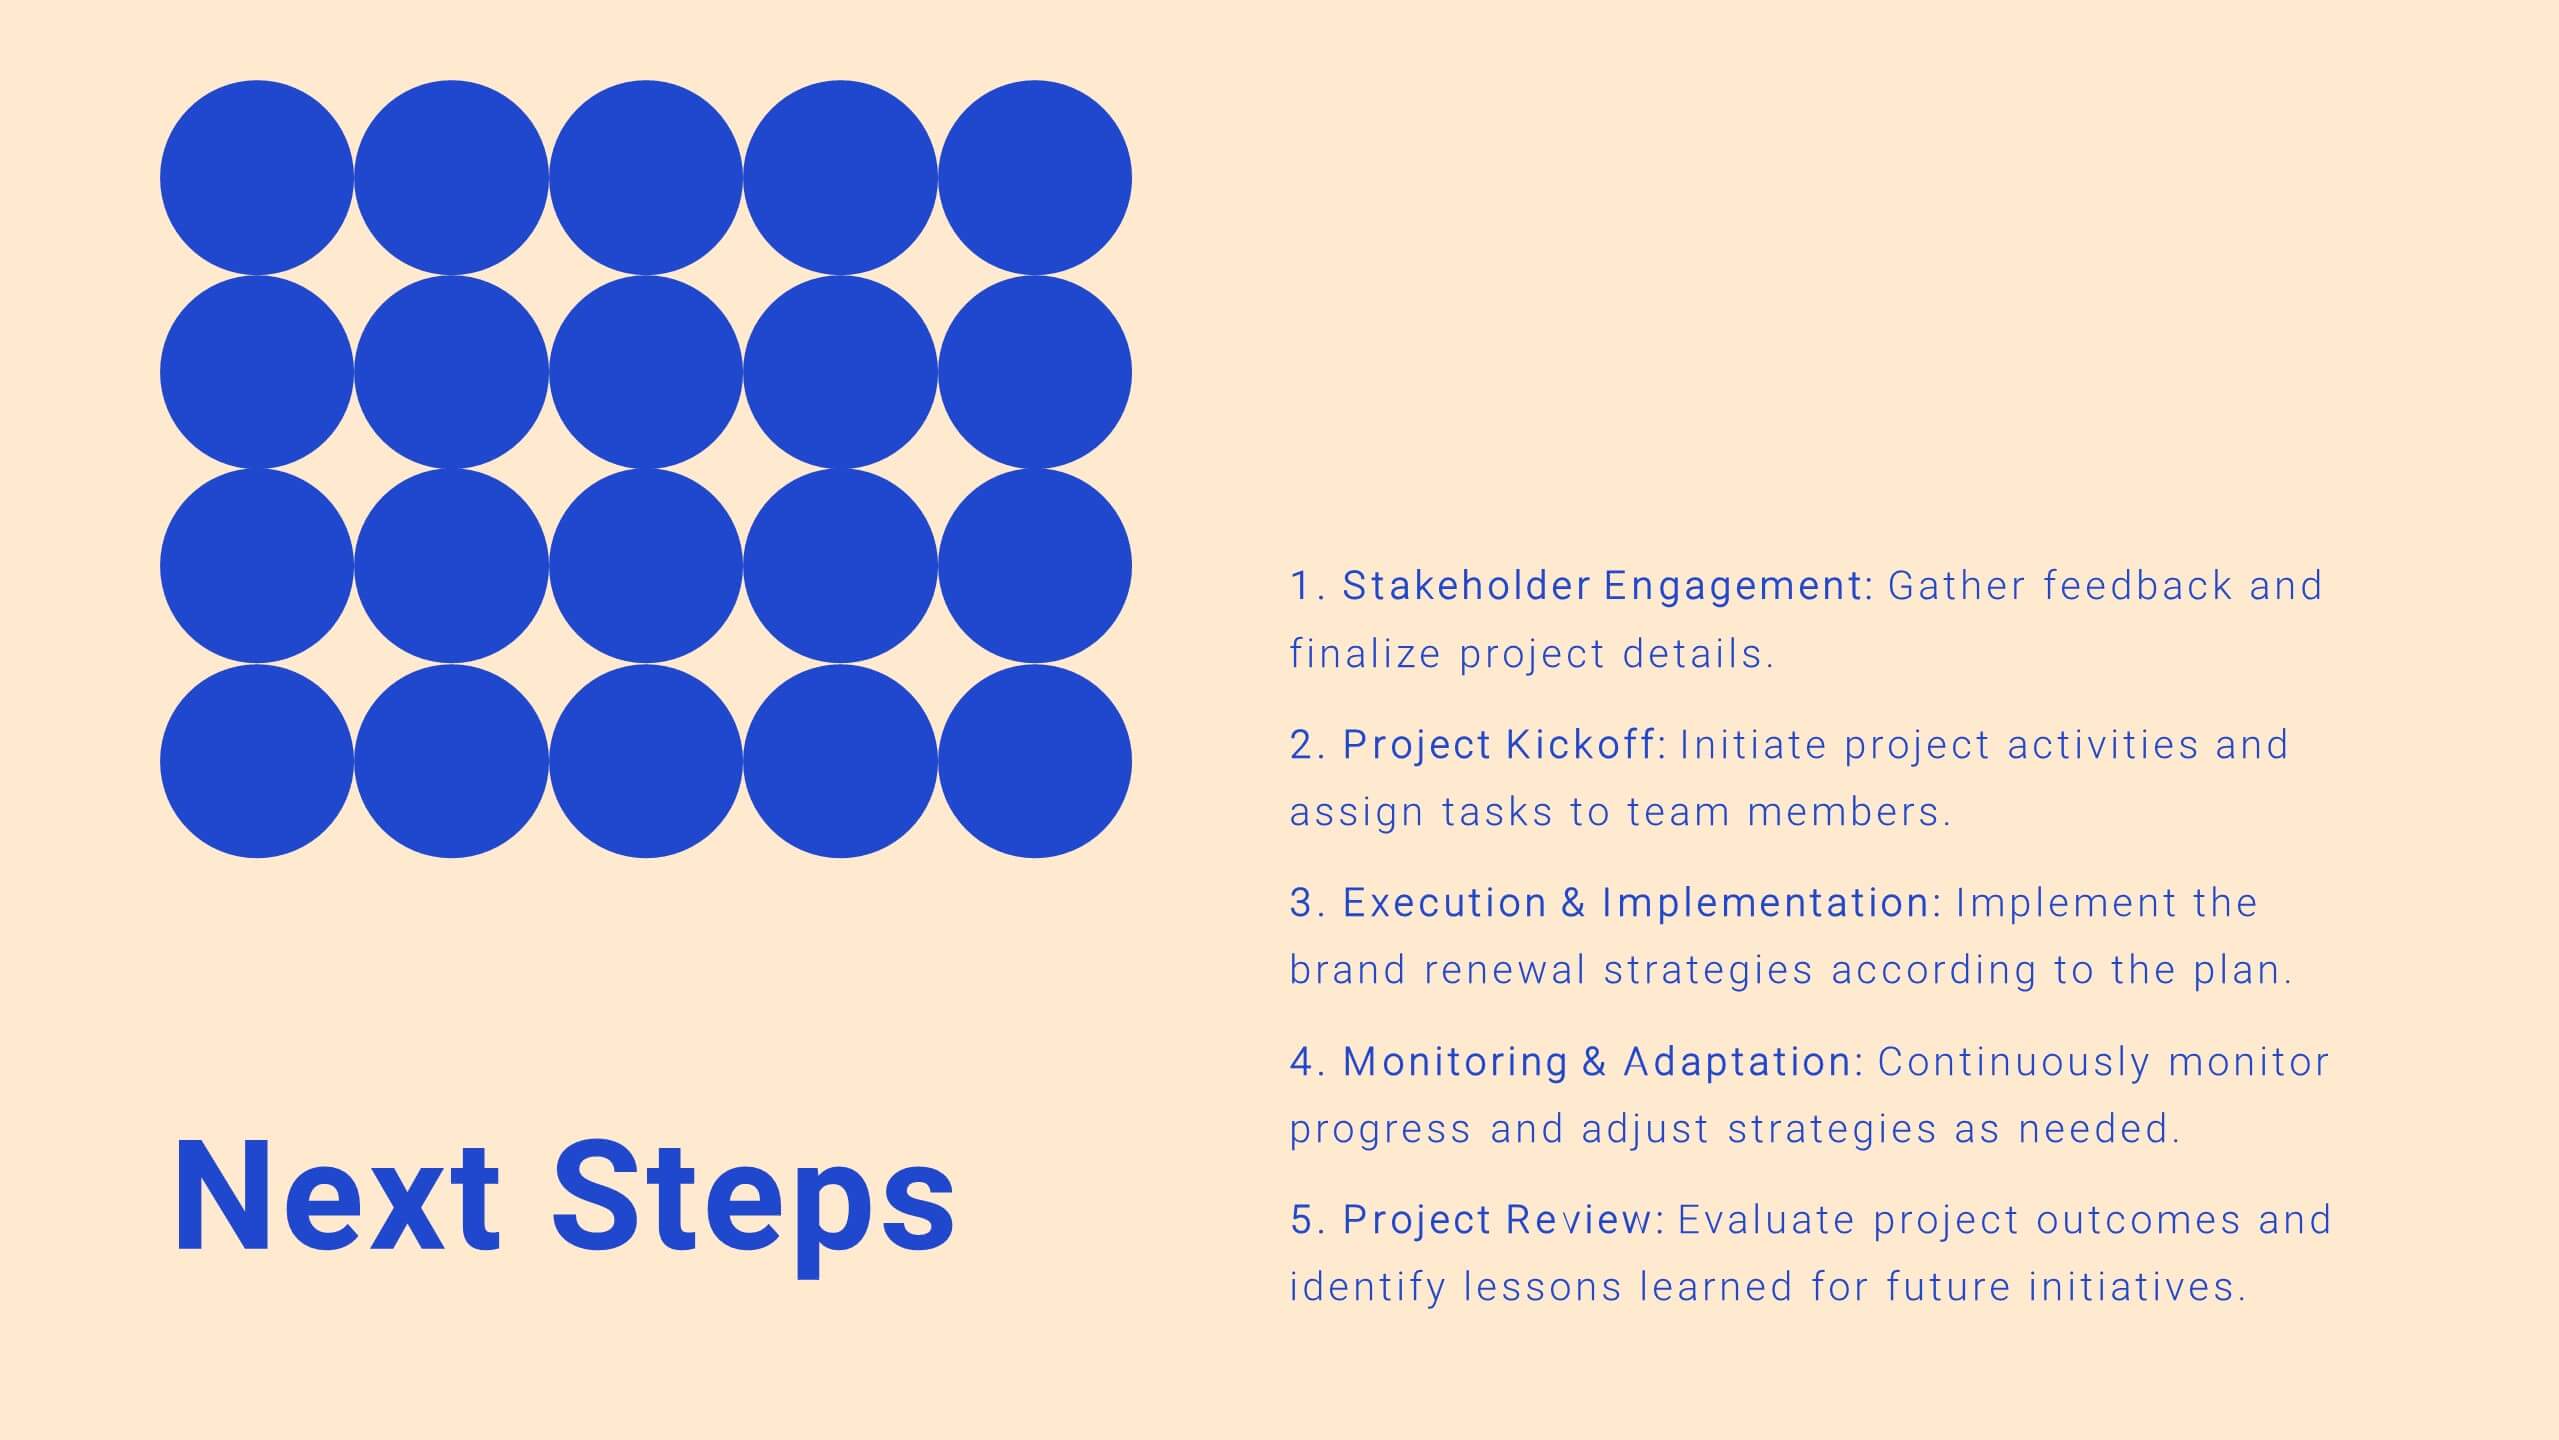
Take control of your projects with this comprehensive project plan template! From introductions to detailed objectives, this template covers scope of work, methodology, timelines, budget breakdowns, and risk management. Ideal for ensuring your project stays on track, it also includes stakeholder analysis and quality assurance plans. Compatible with PowerPoint, Keynote, and Google Slides.


4 slides
Stakeholder Analysis Mapping Strategy Presentation
Turn complex stakeholder relationships into clear, actionable insights with this dynamic and modern quadrant design. Ideal for visualizing influence, communication strategies, and engagement priorities, it helps teams build stronger collaboration frameworks. Fully editable and compatible with PowerPoint, Keynote, and Google Slides for effortless professional use.


8 slides
Team OKRs Planning and Monitoring Presentation
Foster alignment across teams with the Team OKRs Planning and Monitoring Presentation. This creative hand-shaped visual helps illustrate collaboration between objectives, key results, and responsibilities. Ideal for performance check-ins, OKR workshops, and team planning meetings. Fully customizable in PowerPoint, Canva, Keynote, and Google Slides for seamless integration.


26 slides
Jenna Presentation Template
Want to let your customers know how your services can help with their interior design needs? The Jenna template features attractive images of different room designs, color palettes, services, and lighting concepts that this business can help you with. This presentation uses soft pastel colors and a clean design so that potential clients can focus on the importance of your services. With its eye-catching graphics, informative content, and organized structure, this presentation template will engage and inspire your audience as you present your ideas for creating beautiful, functional interior spaces.


23 slides
Stormrider Business Plan Presentation
This Business Presentation Template is designed to help you deliver structured and professional content for conferences, meetings, and corporate events. Featuring key sections such as objectives, speaker introductions, panel discussions, and networking breaks, it ensures a smooth and engaging experience. Fully customizable and compatible with PowerPoint, Keynote, and Google Slides.


7 slides
Pyramid Model Infographic
A pyramid model is a visual representation that uses the structure of a pyramid to convey information, concepts, or hierarchies in a clear and visually engaging manner. Our Pyramid Model Infographic template is the perfect tool to depict your concepts in a structured way. This template embodies an essence, enabling you to present your ideas in a way that's both powerful and timeless. This infographic is a powerful representation of your ideas, allowing you to showcase their strength, structure, and enduring potential. Use this template to construct a visual masterpiece that stands tall, just like the pyramids of ancient times!


5 slides
Consequences of Fake News Infographics
Fake news refers to false or misleading information presented as factual news. These are informative infographic templates that highlights the significant impact of fake news on individuals, society, and democracy. They are designed with the aim to raise awareness about the dangers of misinformation and its far-reaching consequences. Use this to educate and inform your audience about the detrimental effects of fake news on individuals, society, and democracy. This increases awareness and promotes media literacy. Fully customizable and compatible with Powerpoint, Keynote, and Google Slides.


5 slides
Monthly Report Statistics Infographics
A Monthly Report is a document that provides an overview of activities, progress, achievements, and challenges within a specific month. These infographic templates are designed to present monthly data and statistics in a clear and engaging manner. These infographics will help you showcase key information effectively. This is perfect for preparing reports for management, stakeholders, clients, or colleagues, this template will help you communicate your findings clearly and impressively. Compatible with Powerpoint, Keynote, and Google Slides, its customizable design and visual appeal will ensures that your monthly reports are engaging and informative.


6 slides
Marketing Business Plan Infographics
The "Marketing Business Plan" infographic template is a strategic and detailed resource, perfect for PowerPoint, Keynote, and Google Slides. Designed for marketing professionals, business strategists, and entrepreneurs, this template is an effective tool for planning and presenting marketing strategies. This template includes key components of a marketing business plan, such as market analysis, marketing strategies, target audience identification, and budget allocation. Its structured layout helps users clearly present their marketing approach, making it invaluable for business plan presentations, strategy meetings, and marketing courses. The design is professional and focused, with a dynamic color scheme that uses shades of blue, green, and orange. This palette not only makes the template visually appealing but also symbolizes important aspects of marketing planning, such as creativity, growth, and organization. Whether used in business pitches, strategy workshops, or educational settings, this template ensures that your marketing business plan is conveyed with clarity and visual impact.


10 slides
Work Schedule and Task Management Presentation
Enhance your project management with the Work Schedule and Task Management template, expertly designed to organize and visualize tasks efficiently, ensuring productivity and clarity in your workflow. It features distinct icons and color-coded stages to delineate project phases, ideal for tracking progress and ensuring team alignment. This versatile template is compatible with PowerPoint, Keynote, and Google Slides, allowing for seamless integration into any presentation workflow.


12 slides
Real Estate Business Proposal Presentation
Present your Real Estate Business Proposal with this structured and visually compelling template. Designed for real estate professionals, investors, and agencies, this slide helps communicate investment strategies, market opportunities, and property insights effectively. Fully customizable and compatible with PowerPoint, Keynote, and Google Slides for seamless editing.


5 slides
Key Business Benefits and Value
Present your organization’s core strengths using this 4-part value diagram. Ideal for outlining benefits, service pillars, or strategic goals, the slide features directional arrows with matching icons for clarity and structure. Easy to customize in PowerPoint, Keynote, and Google Slides—adjust text, icons, and colors to align with your business branding.


2 slides
Elegant Thank You Slide
Leave a lasting impression with this modern and refined thank-you slide. Designed with clean lines, professional typography, and an image placeholder to showcase your team, workspace, or branding. Ideal for closing business decks and project presentations. Compatible with PowerPoint, Keynote, and Google Slides.


4 slides
Business Framework Strategies Presentation
Bring your ideas to life with a smooth, flowing sequence that makes complex strategies feel simple and intuitive. This presentation guides audiences through each stage of your business framework with clear visuals and focused messaging, helping you communicate structure, goals, and direction effortlessly. Fully compatible with PowerPoint, Keynote, and Google Slides.


5 slides
Five Essential Steps for Business Success Presentation
Visualize your growth plan with the Five Essential Steps for Business Success Presentation. This step-by-step layout highlights key milestones using a modern isometric staircase design, with speech bubble markers for added clarity. Ideal for roadmaps, strategic planning, or onboarding workflows. Fully editable in PowerPoint, Keynote, and Google Slides.


5 slides
Large-Scale Data Strategy Template Presentation
Present your data strategy with clarity using this four-step triangle layout. Each triangle highlights a key phase, ideal for outlining processes like planning, cloud adoption, integration, and scalability. Clean icons and a modern design enhance communication. Fully editable and compatible with PowerPoint, Keynote, and Google Slides for flexible use.


4 slides
Governance Practices for Risk Mitigation Presentation
Break down your risk strategy with the Governance Practices for Risk Mitigation Presentation. This slide features a step-stair 3D block visual, ideal for illustrating layered compliance initiatives, control measures, and escalation paths. Perfect for corporate governance teams, compliance officers, and strategic risk planners. Fully editable in PowerPoint, Keynote, and Google Slides.