


Features
- 4 Unique slides
- Fully editable and easy to edit in Microsoft Powerpoint, Keynote and Google Slides
- 16:9 widescreen layout
- Clean and professional designs
- Export to JPG, PDF or send by email


Do you have any questions?
Recommend


7 slides
Feedback Control Infographic
Feedback is information, reactions, or comments given to individuals or entities regarding their performance, actions, products, services, or behaviors. This infographic template is an educational odyssey through the world of precision and control, guiding you through the principles and applications of feedback mechanisms. Compatible with Powerpoint, Keynote, and Google Slides. This template displays a target icon with decreasing error rings, illustrating the goal of minimizing errors through feedback control for optimal performance. Display icons representing sensors and actuators, emphasizing their pivotal roles in feedback control systems.


10 slides
Agile Sprint Planning with Scrum Board Presentation
Plan and track your sprints effectively with this Agile Scrum Board Template. Featuring customizable “Stories,” “To Do,” “In Progress,” and “Testing” columns, this layout helps visualize workflow and team tasks clearly. Perfect for scrum masters and agile teams. Compatible with PowerPoint, Keynote, and Google Slides for easy editing.


4 slides
Step-by-Step Company Workflow Map Presentation
Visually track business processes with this step-by-step workflow map. Each stage is illustrated as a vertical bar, representing progression and task hierarchy. Ideal for project managers, operations teams, and onboarding sessions. Fully editable in PowerPoint, Keynote, and Google Slides for quick customization of labels, icons, and stage descriptions to fit your goals.


6 slides
Economic Pyramid Infographic
Showcase economic structures with our Economic Pyramid Infographic, compatible with Powerpoint, Google Slides, and Keynote. This template is designed for economists, educators, and business professionals, providing a visual hierarchy of economic indicators or demographics. Each level of the pyramid represents a different segment, such as income brackets, consumer classes, or resource distribution. It's an ideal tool for presentations that require a clear depiction of economic stratification or market segmentation. Customizable and easy to understand, this infographic helps simplify complex economic data into digestible visual tiers for any audience.


5 slides
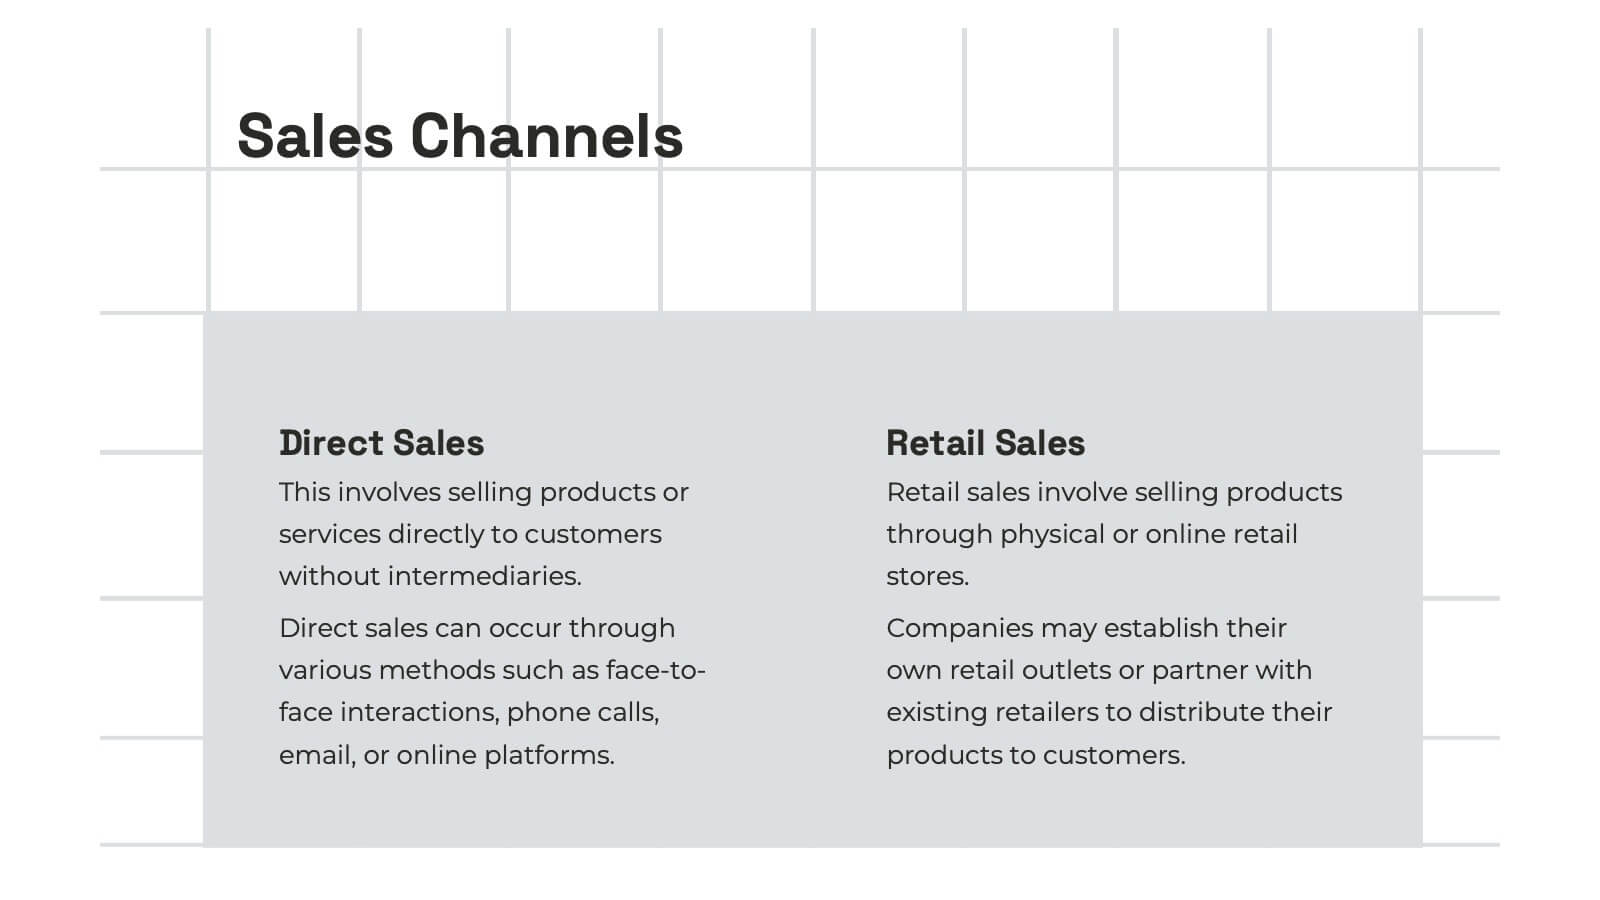
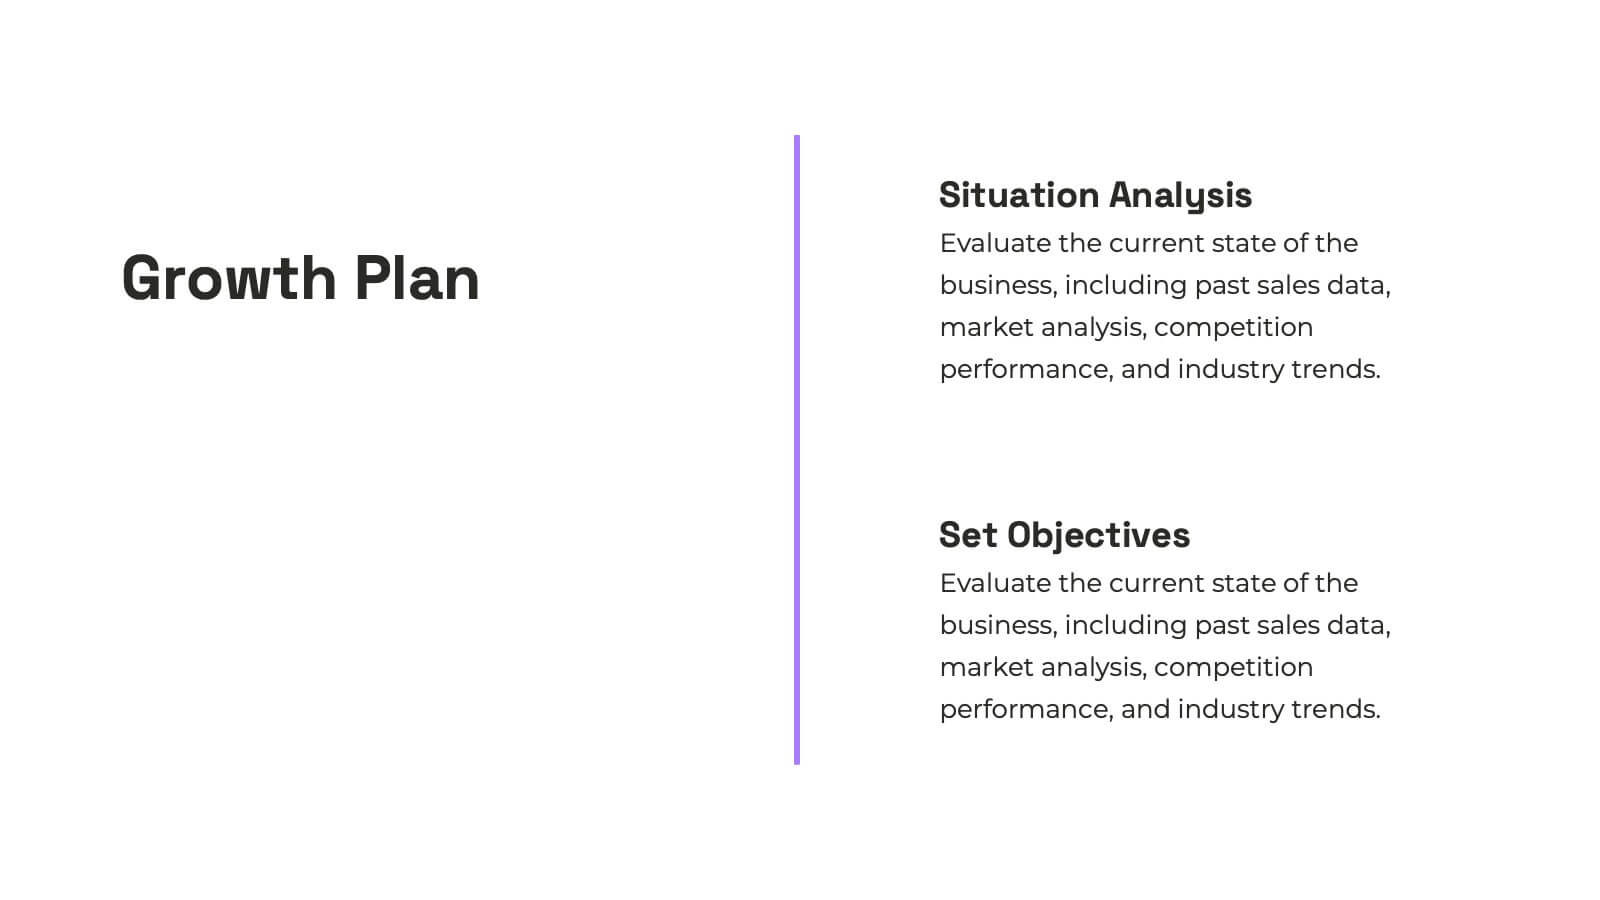
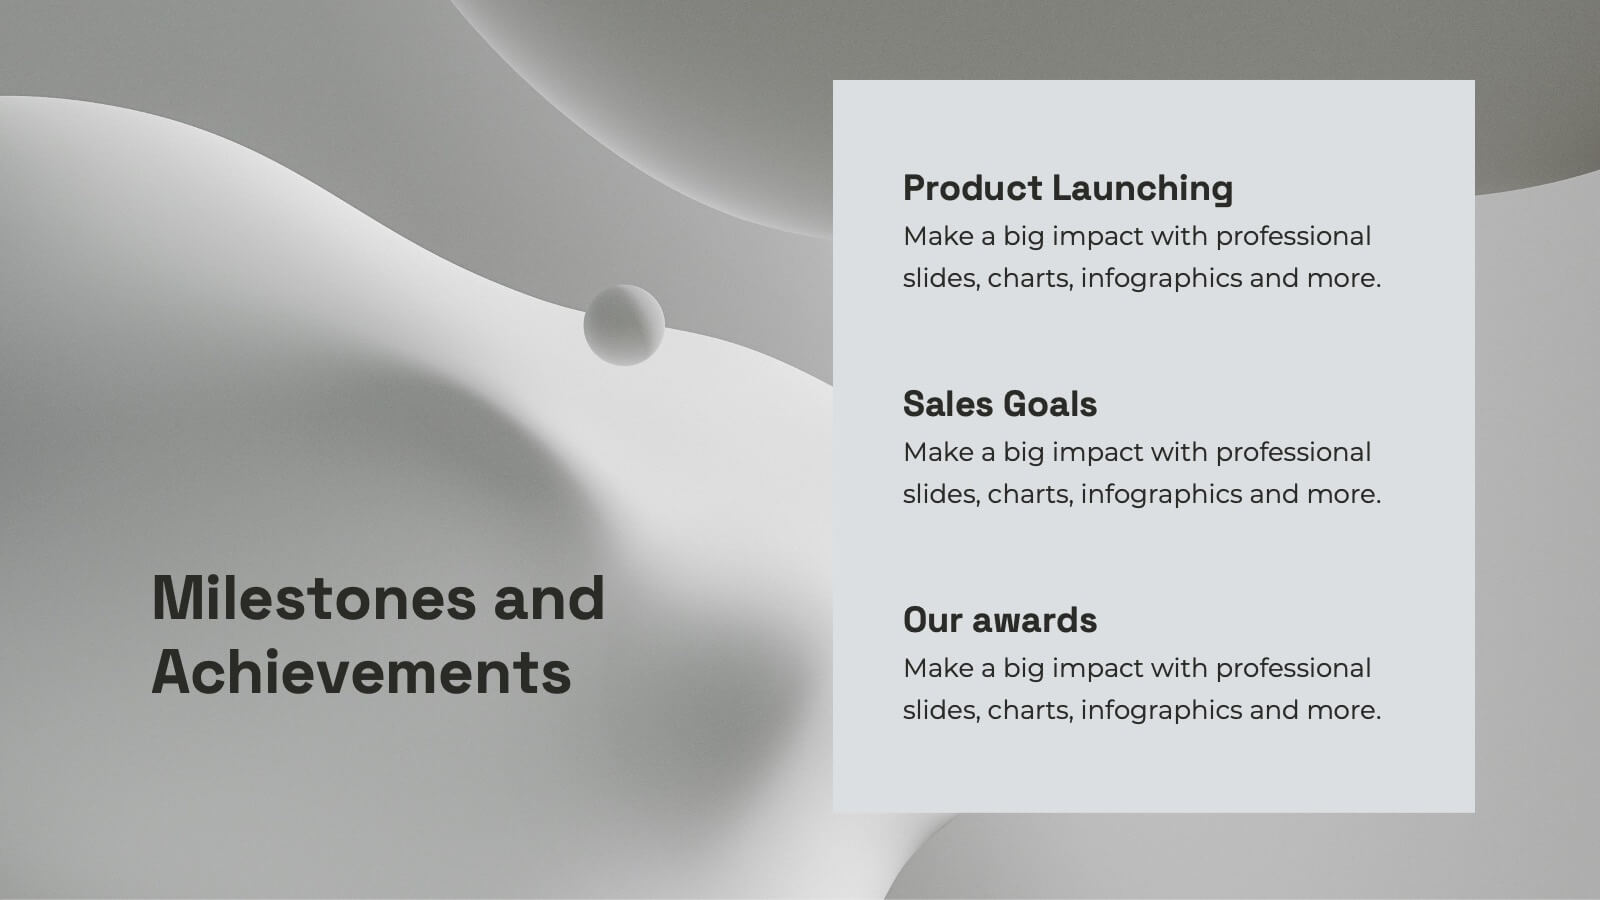
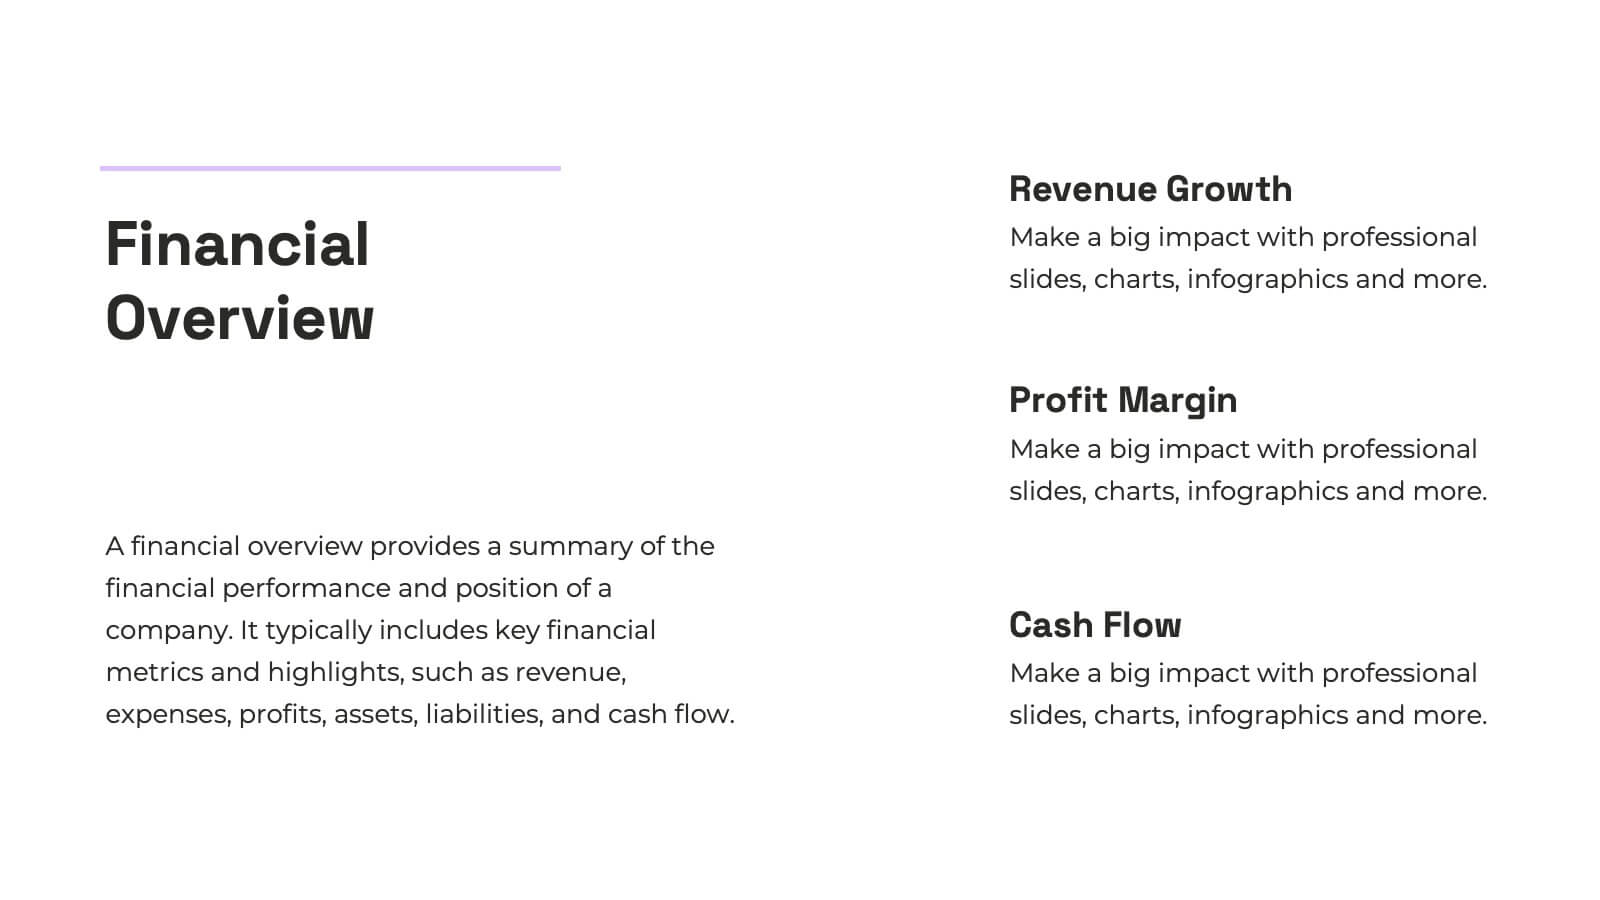
Annual Overview Report Template Presentation
Bring your yearly achievements to life with this sleek and structured layout designed for clarity and impact. Ideal for summarizing company performance, milestones, and future goals, it organizes data into easy-to-follow visuals. Fully editable and compatible with PowerPoint, Keynote, and Google Slides for a smooth presentation experience.


7 slides
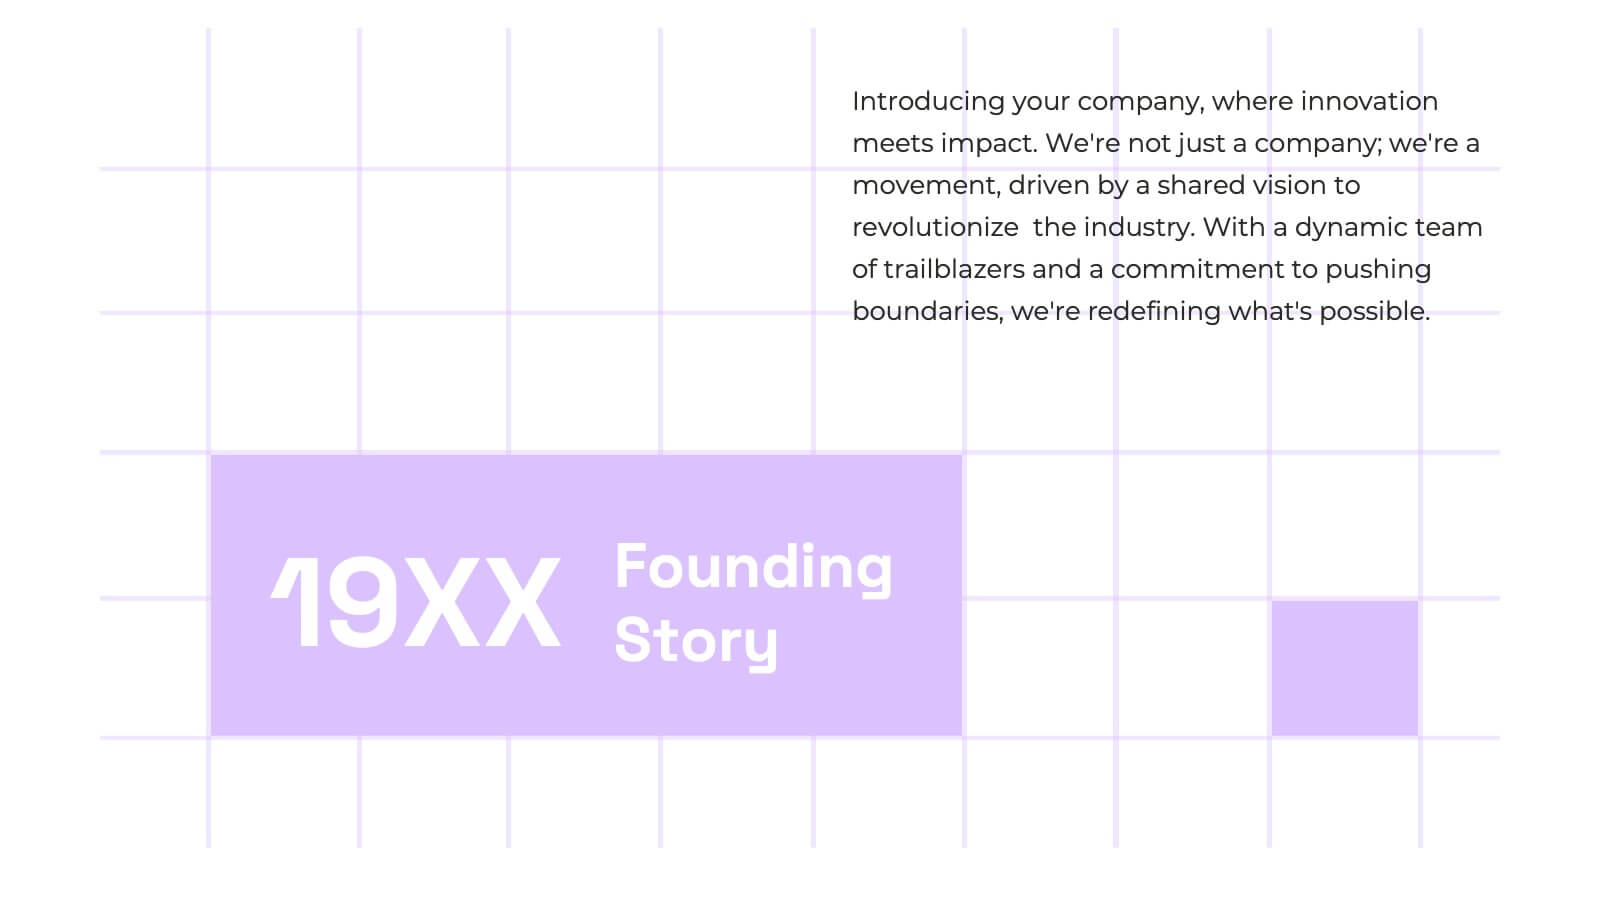
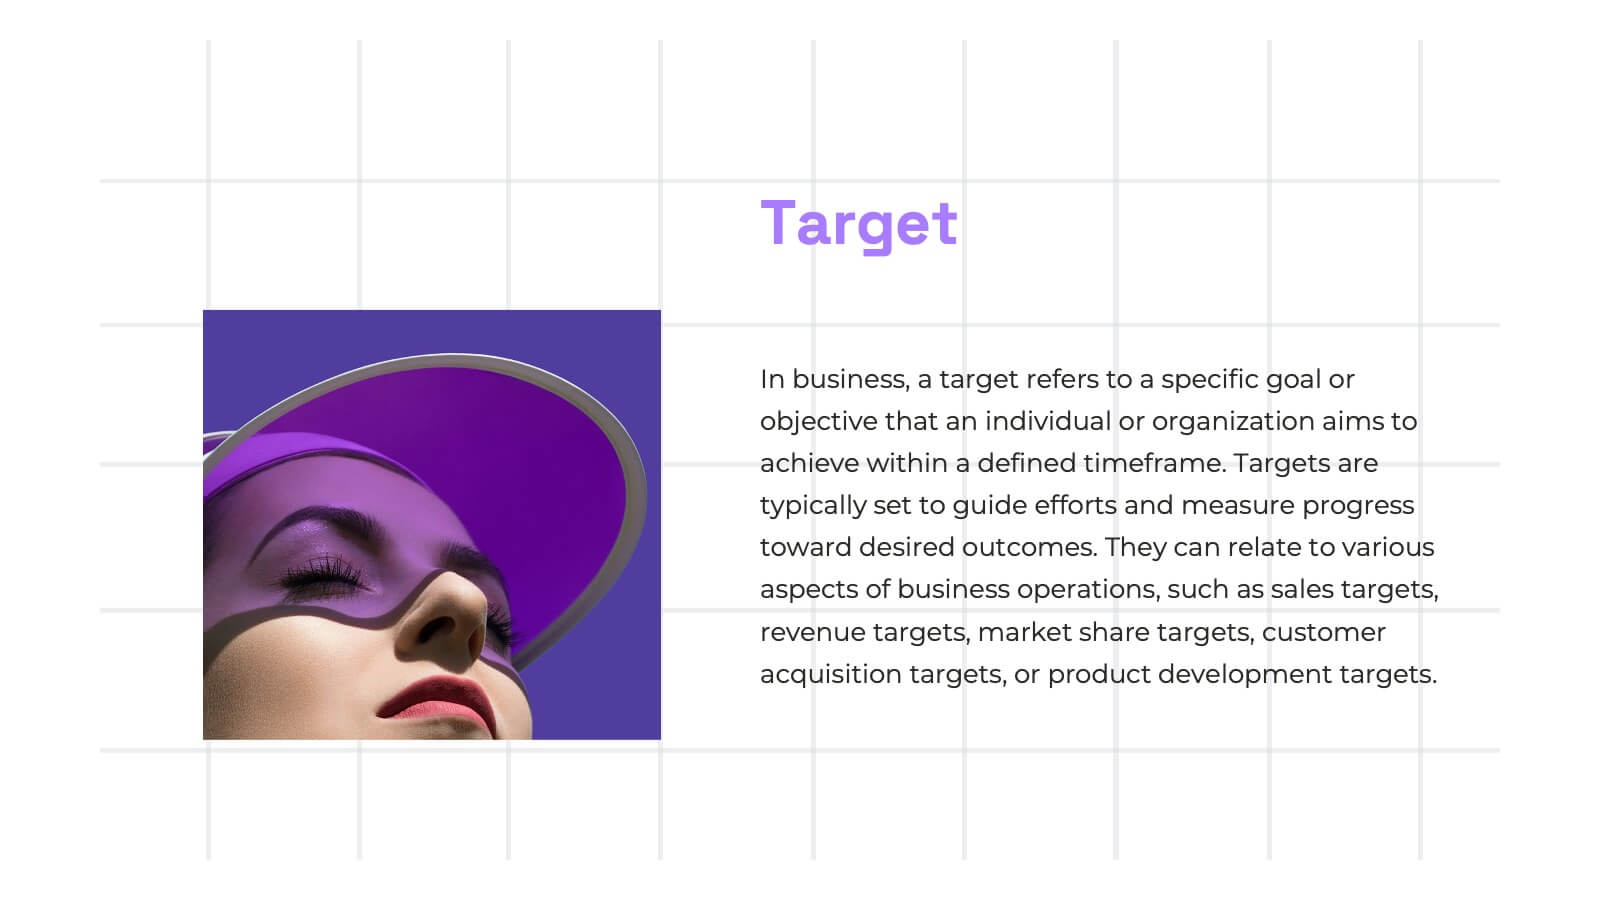
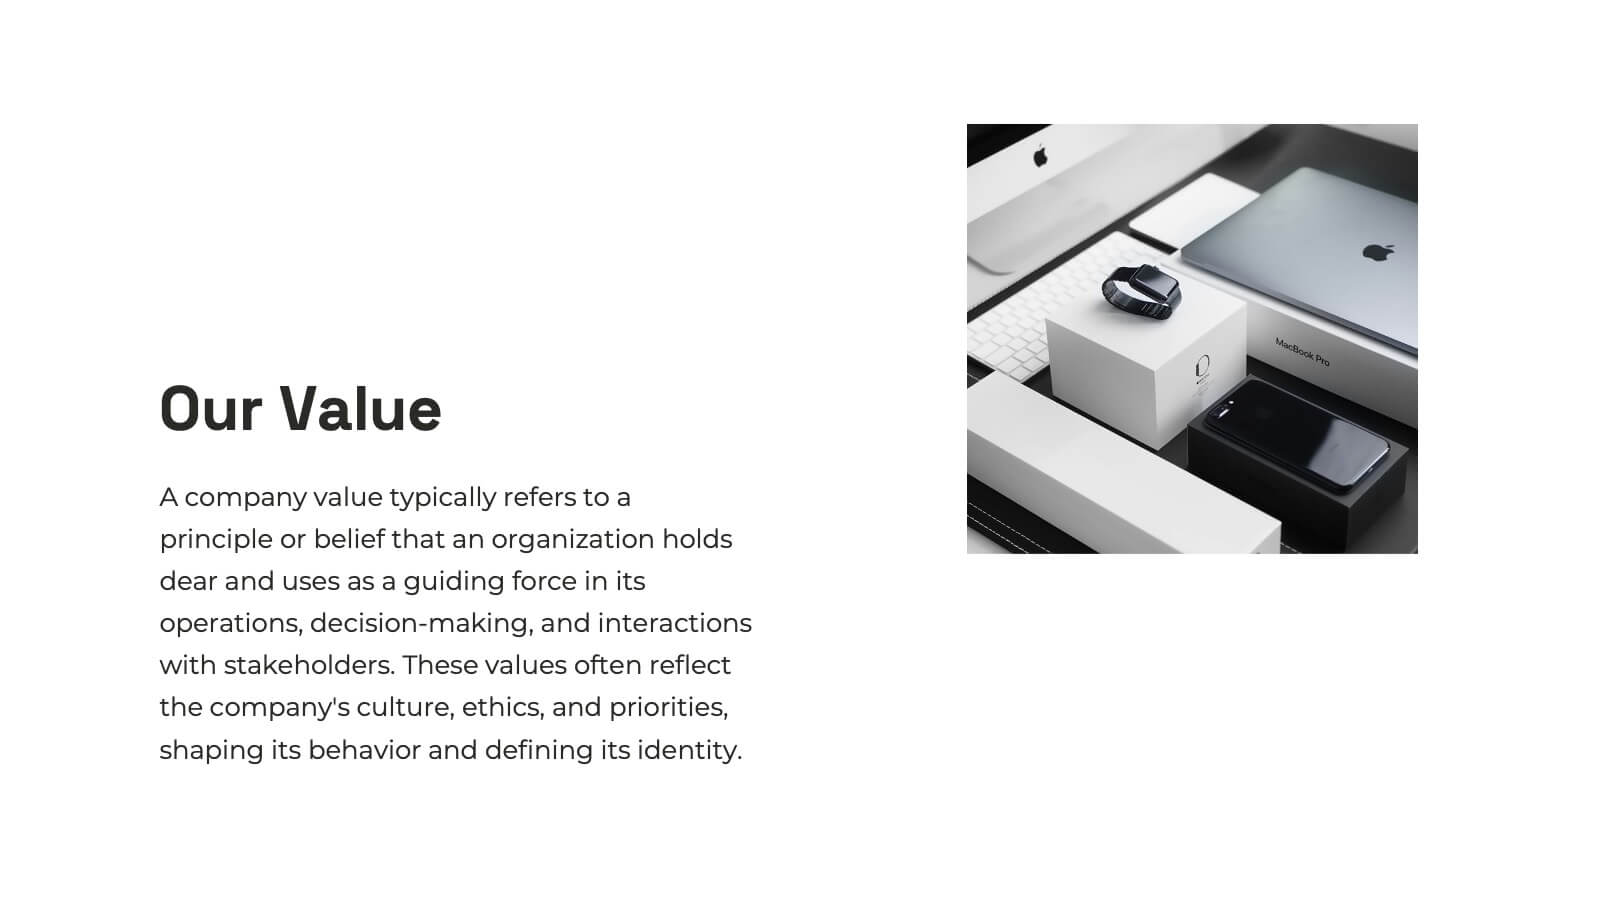
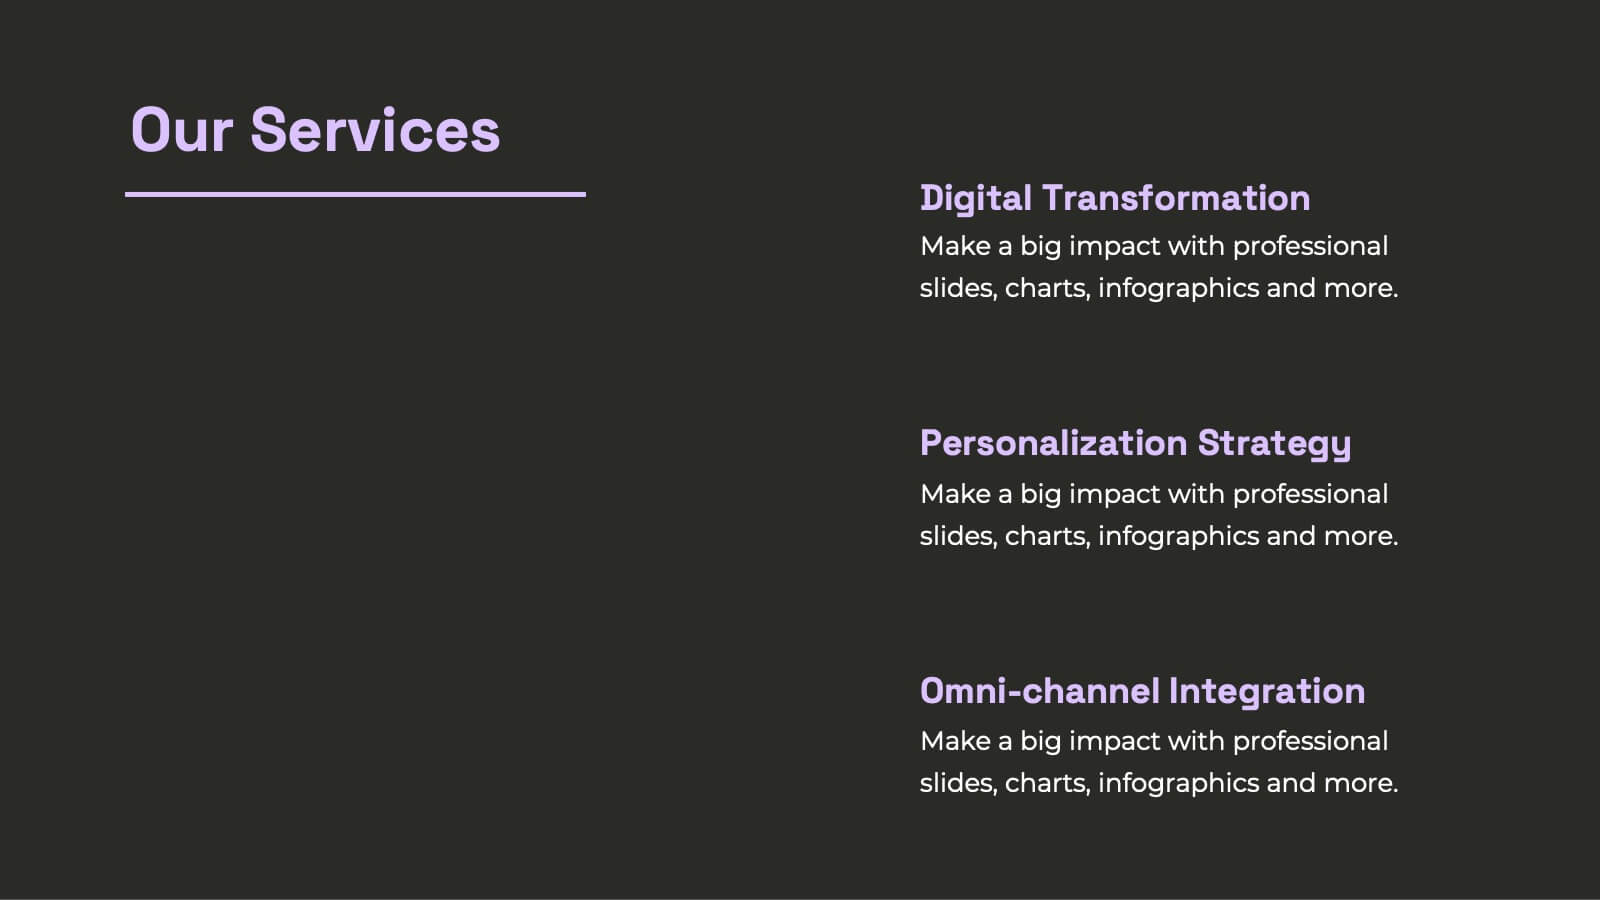
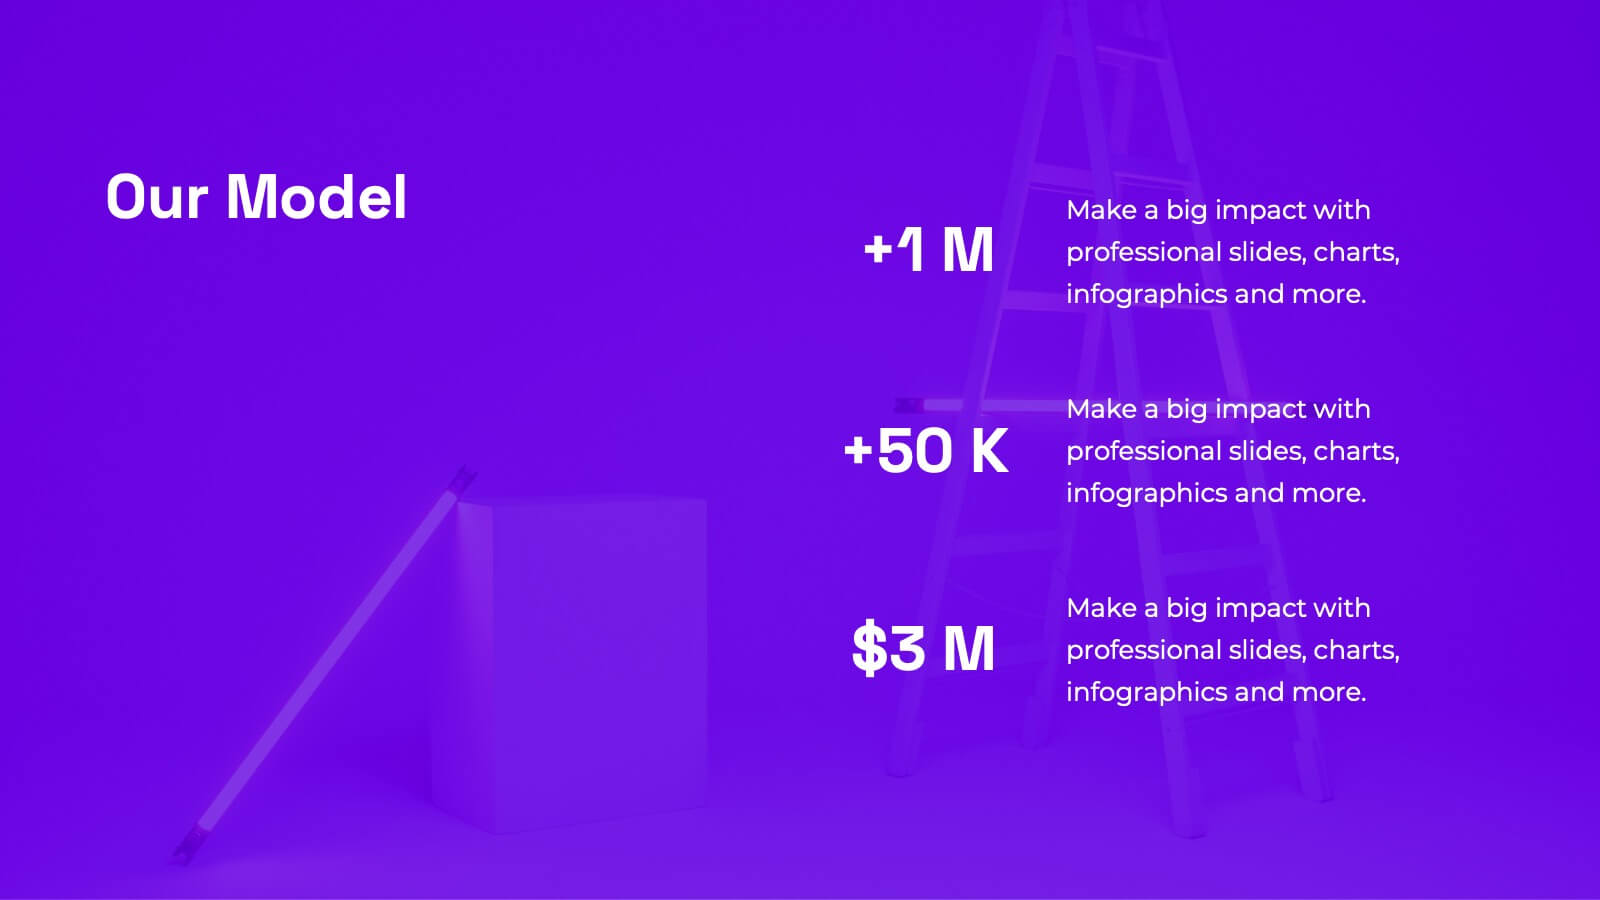
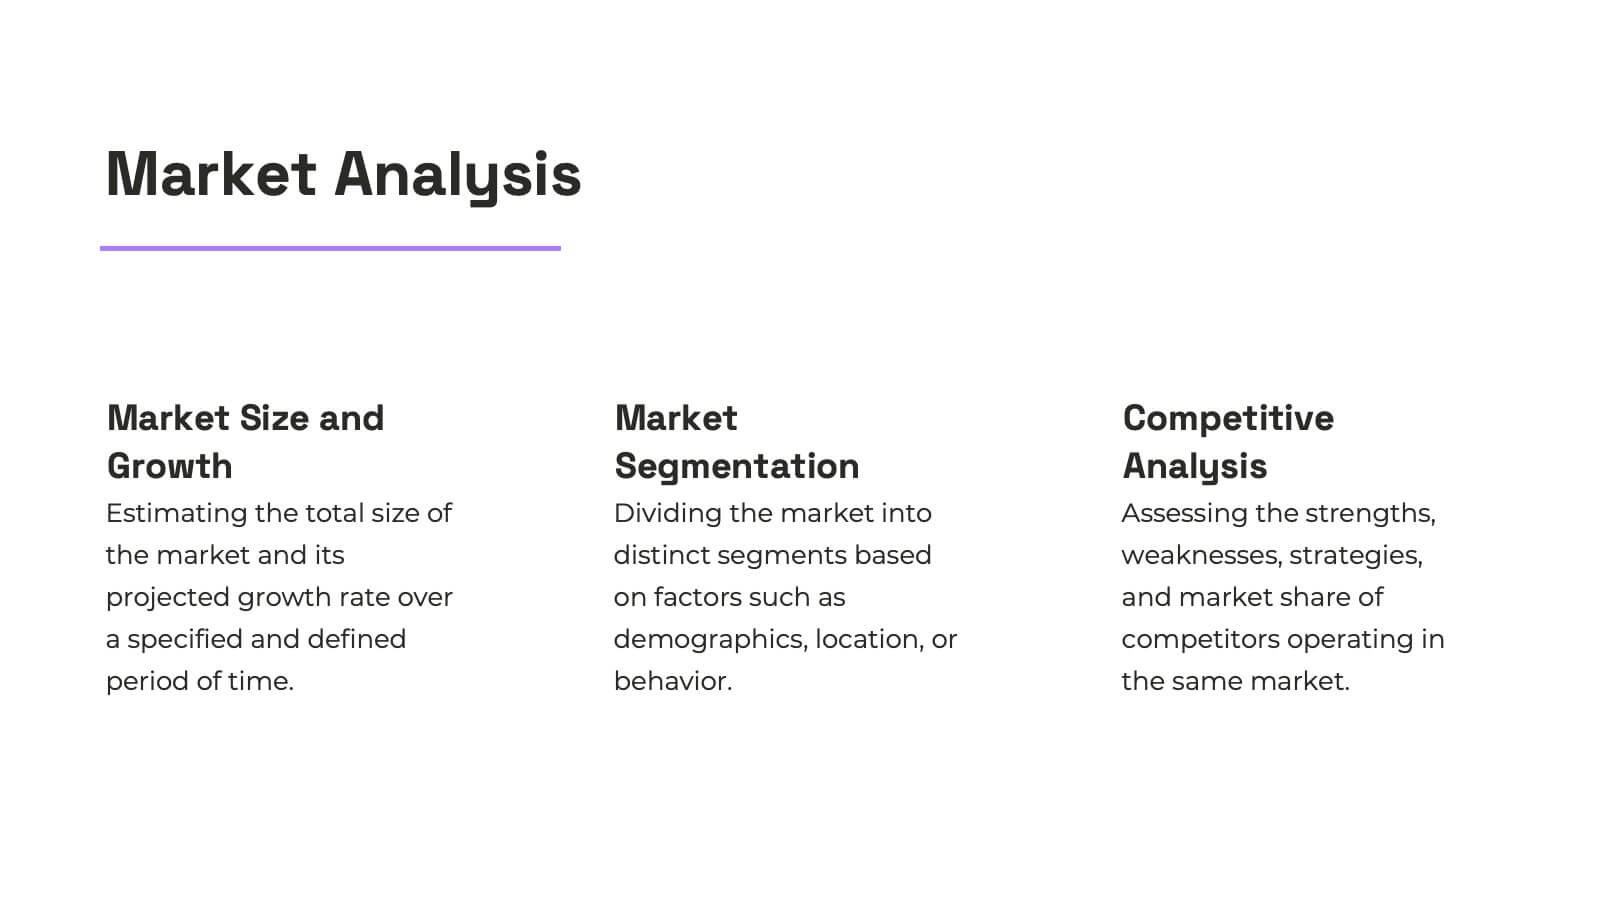
Company Profile Structure Infographic
This series of templates is meticulously crafted to represent a company’s structure in a detailed and organized manner. Each template varies in design and layout, ensuring that there is a style to suit different business needs and preferences. From straightforward, clean layouts to more dynamic, visually engaging designs, these templates provide an excellent basis for companies to present their organizational structure, core team members, departmental divisions, and key business areas effectively. Key information such as company values, mission statements, and strategic objectives can be clearly highlighted, allowing companies to communicate their business essence and operational ethos to stakeholders. Each template also accommodates data visualization through charts, graphs, and infographics, which are instrumental in depicting growth trajectories, performance metrics, or demographic breakdowns. With customization options, these templates can be tailored to reflect a company's unique brand identity, including color schemes, typography, and corporate logos, making each presentation not only informative but also reflective of the company's image. This collection is ideal for corporate introductions, stakeholder meetings, and internal presentations aimed at fostering a clear understanding of the company’s operational framework and strategic direction.


4 slides
Human Cognitive Bias Framework Presentation
Enhance your presentations on decision-making and psychology with the Human Cognitive Bias Framework Presentation. This editable slide helps you visualize how cognitive biases influence perception, thought, and behavior. Ideal for workshops, training sessions, or behavioral research discussions. Compatible with Canva, PowerPoint, Google Slides, and Keynote.


7 slides
Editable List Slide Presentation
Organize your ideas with style and simplicity using this clean, structured layout designed for clarity and impact. Ideal for summarizing key points, checklists, or action plans, it keeps your content professional and easy to follow. Fully customizable and compatible with PowerPoint, Keynote, and Google Slides for seamless presentation design.


10 slides
5-Level Circular Diagram Presentation
Visualize complex concepts with this professional 5-Level Circular Diagram template. Perfect for business strategies, project planning, and hierarchical structures, it provides a clear, layered approach. Fully editable and compatible with PowerPoint, Keynote, and Google Slides, this design ensures a polished, impactful presentation with structured, easy-to-understand visuals.


6 slides
Customer Journey Map Presentation
Visualize the customer experience step-by-step with the Customer Journey Map Presentation. This sleek infographic helps you outline key touchpoints from awareness to post-purchase, making it ideal for marketing strategies, service design, or UX presentations. Fully editable and compatible with PowerPoint, Keynote, and Google Slides.


22 slides
Nexus Startup Growth Plan Presentation
Jumpstart your business journey with this dynamic presentation template! Ideal for outlining your startup growth plan, it covers mission, vision, market analysis, and financial projections with sleek, professional slides. Capture investor interest and articulate your strategy effortlessly. Compatible with PowerPoint, Keynote, and Google Slides, ensuring seamless presentation across all platforms.


6 slides
Organizational Structure Overview Presentation
Map out your team’s structure with clarity using this simple organizational chart template. Ideal for showcasing departments, reporting lines, or team roles, it helps stakeholders quickly understand who’s who and how responsibilities are divided. Perfect for internal meetings, onboarding decks, or company overviews. Works with PowerPoint, Keynote, and Google Slides.


6 slides
Event Planning Agenda Presentation
Organize every detail with the Event Planning Agenda Presentation. Featuring a 6-step layout styled like a calendar, this template clearly outlines each agenda point with vibrant blocks and icons for visual impact. Ideal for conferences, workshops, or launches. Fully editable in PowerPoint, Keynote, and Google Slides.


7 slides
Cyber Security Infographic Presentation Template
Cybersecurity helps protect your business from cybercrime and unauthorized access to data. It is a crucial step to safeguard your business from malicious attacks that can lead to confidential data being stolen, as well as loss of revenue through fraudulent transactions. With this template you can ensure that you and your business are well informed on the importance of cybersecurity. This template will provide you with a good starting point to create a cybersecurity strategy. This template includes illustrations on goals, benefits, limitations and recommendations based on your audience's needs.


4 slides
Target Audience and Buyer Persona Analysis Presentation
Visually map out your core audience segments with this modern target diagram layout. This presentation features a concentric ring graphic to represent buyer personas and user data, alongside three editable text sections with icons for clear and structured insights. Ideal for marketing strategies, customer profiling, and campaign planning. Easily customizable in PowerPoint, Keynote, and Google Slides.


7 slides
IT Architecture Services Infographic Presentation
An IT Architecture Infographic presents information related to the design, structure, and components of an organization's architecture. IT Architecture refers to the overall framework of an organization's IT systems and infrastructure. This template is designed to communicate the design, structure, and components of your organization's IT architecture. The template features a modern design with a blue color scheme, giving your presentation a professional and sleek look. It is compatible with Powerpoint, Keynote, and Google Slides, making it simple for you to create a professional presentation.


5 slides
Workout Benefits Infographics
Engaging in regular workouts and physical exercise offers numerous benefits for both physical and mental well-being. These vertical infographic templates aim to motivate and educate individuals about the positive impact of workouts on physical health, mental well-being, and overall quality of life. These infographics are the perfect tools to be used in presentations, educational material, or fitness campaigns, this template helps inspire and inform viewers about the significant benefits of incorporating workouts into their daily routines. Compatible with Powerpoint, Keynote, and Google Slides.