


Features
- 22 Unique Slides
- Fully editable and easy to edit in Microsoft Powerpoint, Keynote and Google Slides
- 16:9 widescreen layout
- Clean and professional designs
- Export to JPG, PDF or send by email


Do you have any questions?
Recommend


21 slides
Argentis UX Strategy Plan Presentation
Craft a seamless user experience with this professional UX strategy plan presentation. Covering key topics like user research, interaction design, wireframes, and accessibility considerations, this template helps you present a structured and insightful design approach. Fully customizable and compatible with PowerPoint, Keynote, and Google Slides for a smooth and impactful presentation.


5 slides
Future of 5G and Wireless Innovation Presentation
Step into the next era of connectivity with a clean, visual story that highlights how emerging wireless technologies continue to evolve. This presentation helps you explain trends, breakthroughs, and network innovations in a clear, modern layout. Fully compatible with PowerPoint, Keynote, and Google Slides.


5 slides
Skills Gap Assessment Presentation
Spot talent strengths and uncover hidden weaknesses with a clean, visual layout that makes workforce insights easy to understand. This presentation helps teams evaluate current abilities, identify missing competencies, and plan targeted development. Ideal for HR, training, and leadership reviews. Fully compatible with PowerPoint, Keynote, and Google Slides.


22 slides
Zephyr Product Launch Pitch Deck Presentation
Step into the spotlight with this modern and captivating product launch pitch deck! Designed to showcase your ideas with clarity, it covers every key aspect from market opportunities to financials. Impress investors with strategic insights and sleek visuals that guide them through your business plan. Perfect for PowerPoint, Keynote, and Google Slides!


5 slides
Task Automation Process Flow Presentation
Streamline operations with this visual task automation flowchart. Perfect for illustrating automated sequences, decision nodes, and multi-branch logic. Clearly labeled elements guide viewers through each step. Ideal for tech teams, process designers, and workflow planning. Fully editable in PowerPoint, Keynote, and Google Slides to match your branding and automation strategy.


8 slides
Architectural Design and Smart Home Trends Presentation
Showcase modern architecture insights and tech-savvy innovations with this layered home diagram slide. Ideal for real estate, construction, or smart home professionals, it highlights key features in a visually tiered format. Fully editable in PowerPoint, Keynote, and Google Slides—perfect for clean, tech-forward presentations with a sleek design.


10 slides
4-Quadrant Responsibility Chart Presentation
Bring your message to life with a slide that feels bold, modern, and instantly engaging. This presentation helps you outline four key responsibilities or categories in a clean quadrant layout, making complex information easy to follow and visually compelling. It’s perfect for strategy, workflow, or team-based insights. Fully compatible with PowerPoint, Keynote, and Google Slides.


5 slides
Smart Decision Making Models Presentation
Make complex choices simple with this modern and colorful template designed to visualize analytical thinking and structured planning. Ideal for presenting frameworks, strategies, or goal-setting models, it helps communicate logic and clarity effectively. Fully compatible with PowerPoint, Keynote, and Google Slides for smooth customization and presentation delivery.


5 slides
Clean Water Access and Sustainability Goals Presentation
Visually track progress with the Clean Water Access and Sustainability Goals Presentation. This intuitive slide design uses water-filled glasses to represent four stages of development, making it perfect for sustainability metrics, public health initiatives, or project benchmarks. Fully customizable and compatible with PowerPoint, Keynote, Google Slides, and Canva.


20 slides
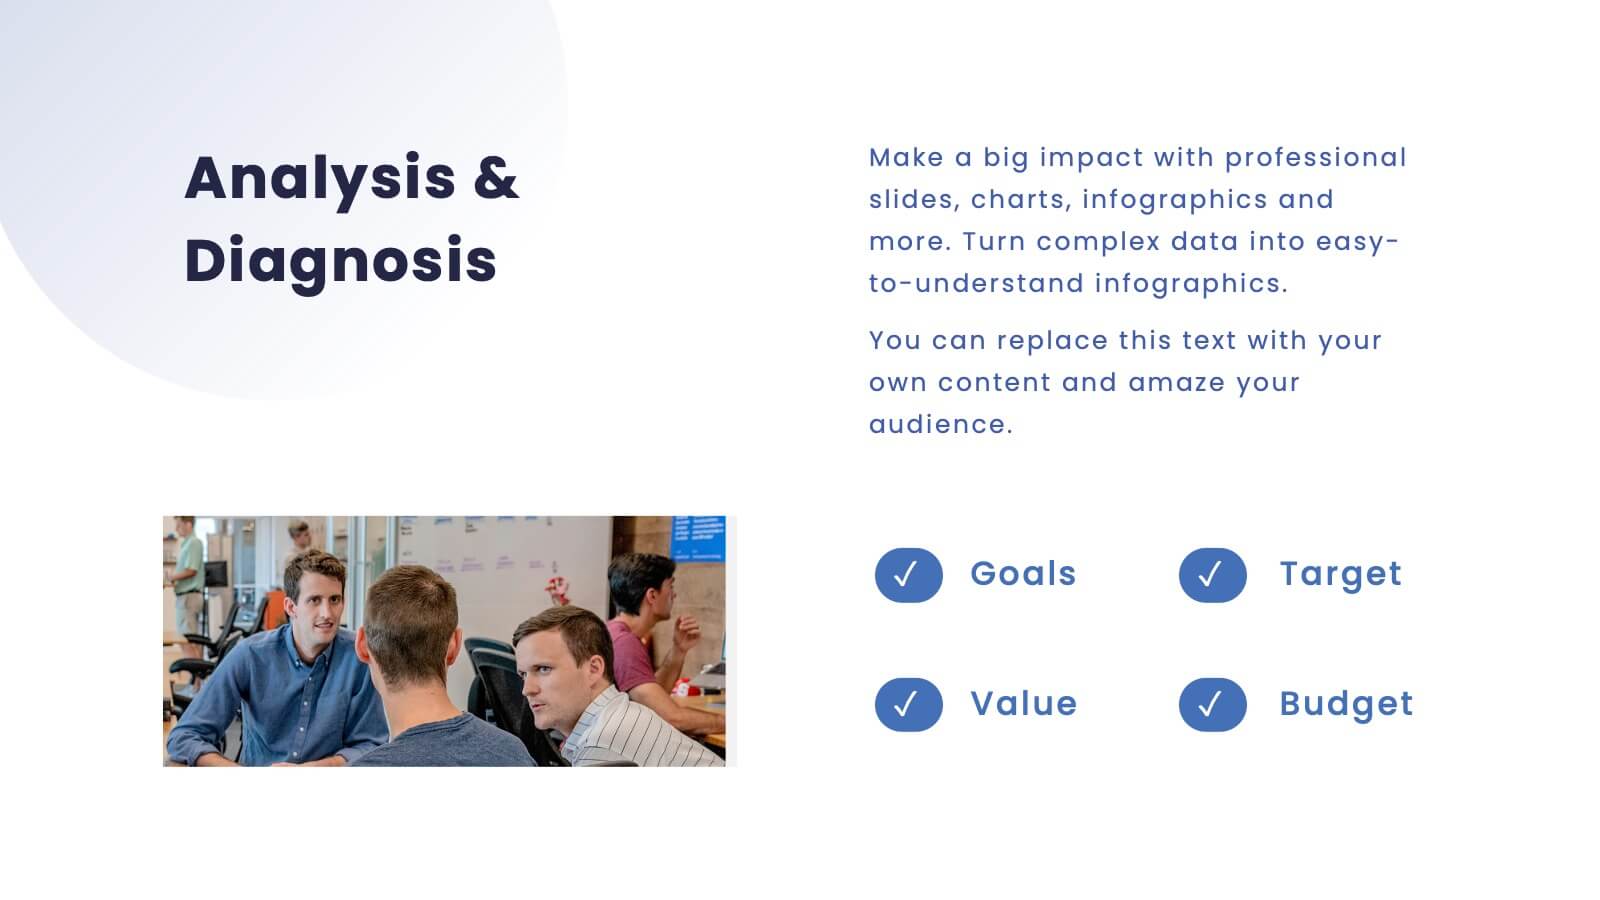
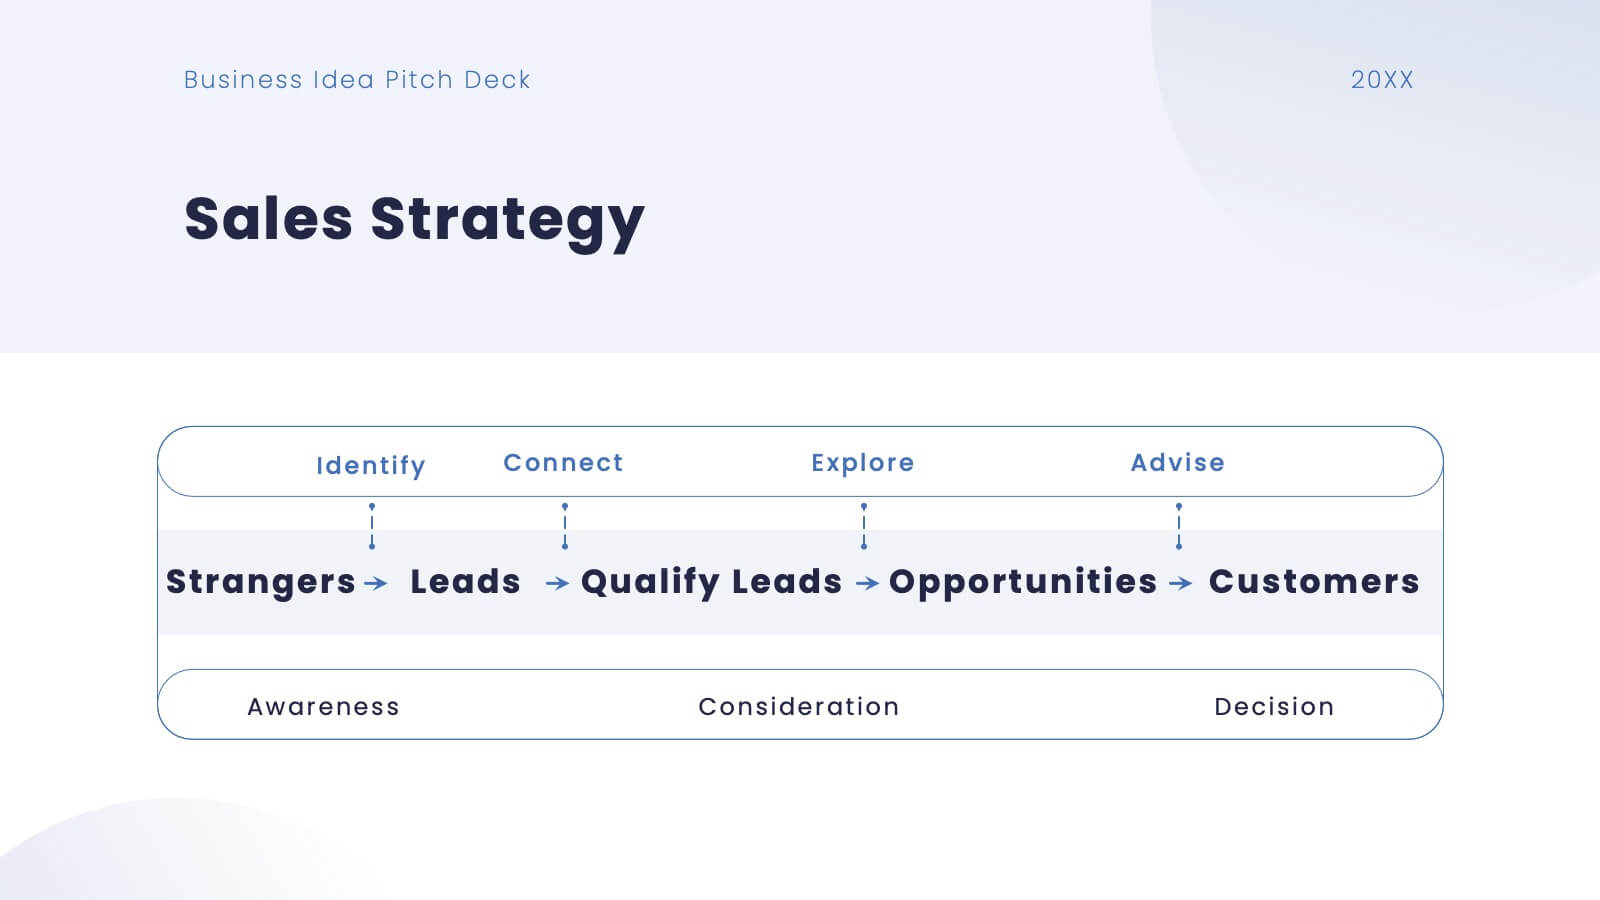
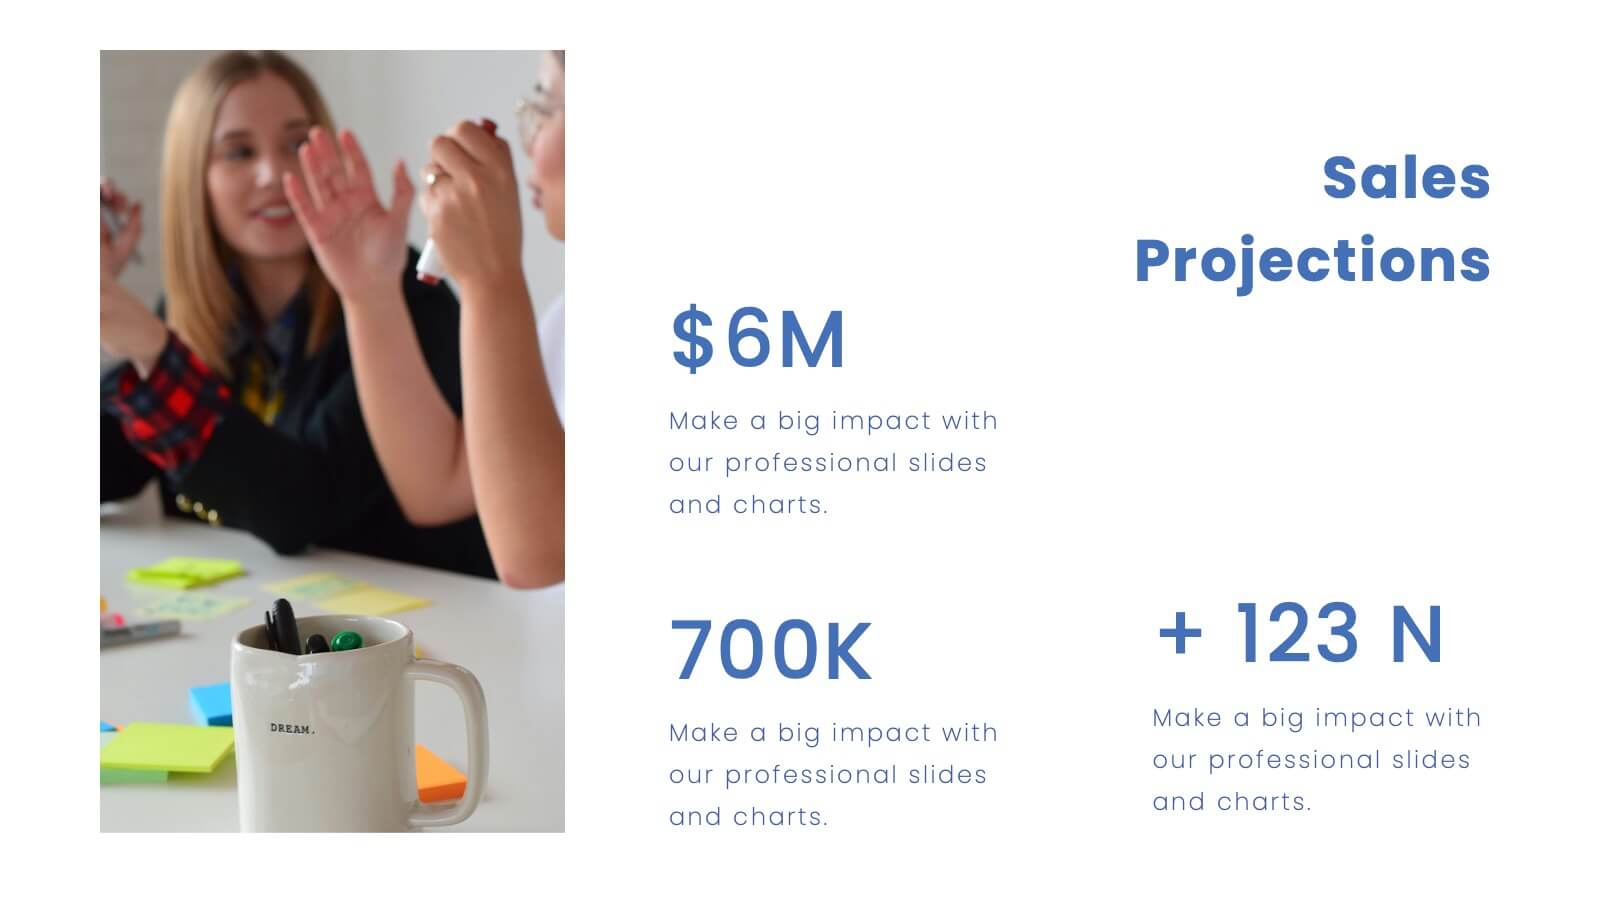
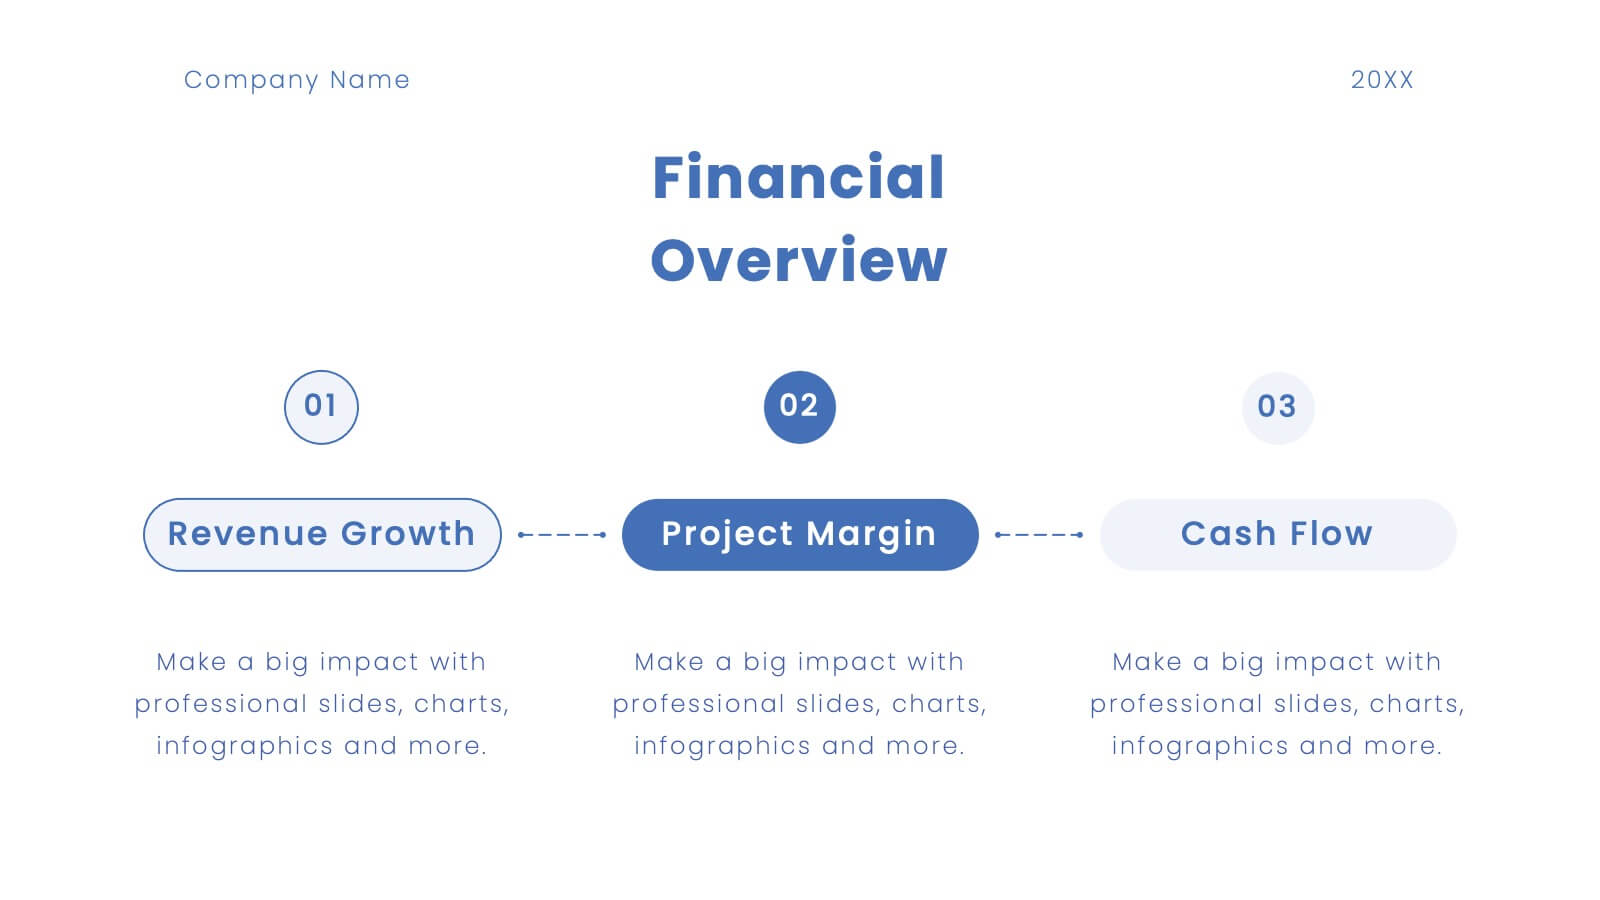
Professional Business Presentation
Deliver impactful insights with our Professional Presentation template. Ideal for enterprise projects, it features slides for introductions, methodology, budget breakdowns, and more. This template facilitates thorough business analyses and clear communication of objectives and results, compatible with PowerPoint, Keynote, and Google Slides.


4 slides
Effective Leadership Tips Presentation
Lead with clarity and confidence using this clean, modern presentation design. Perfect for sharing management insights, motivational principles, and communication strategies, it helps visualize ideas that inspire stronger teams and better decision-making. Fully editable and compatible with PowerPoint, Keynote, and Google Slides for effortless professional customization.

28 slides
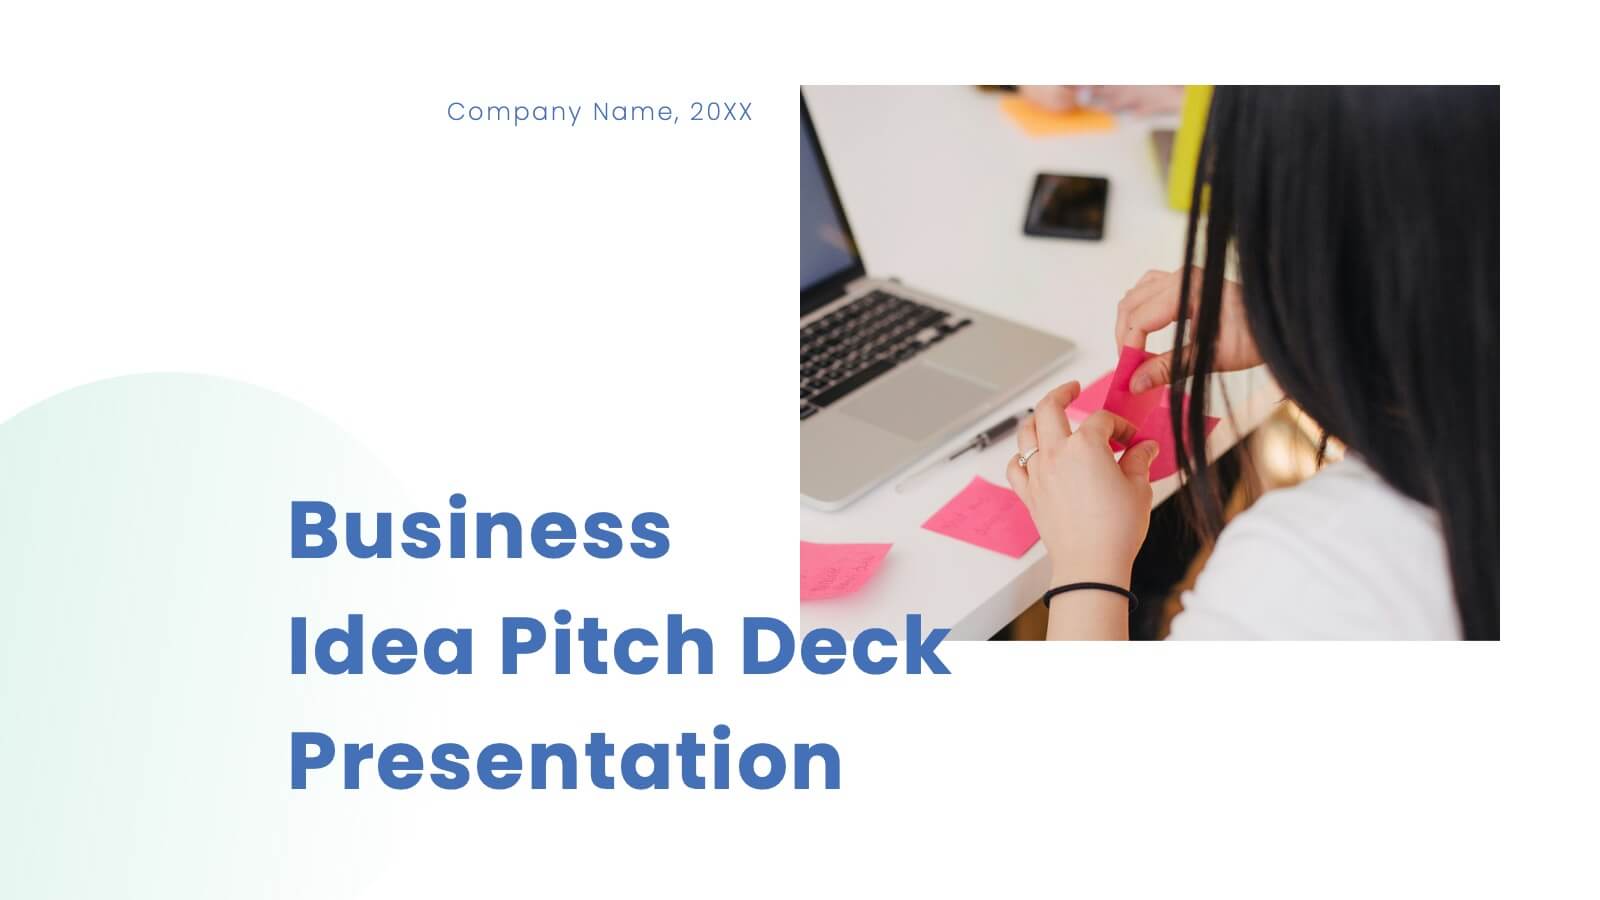
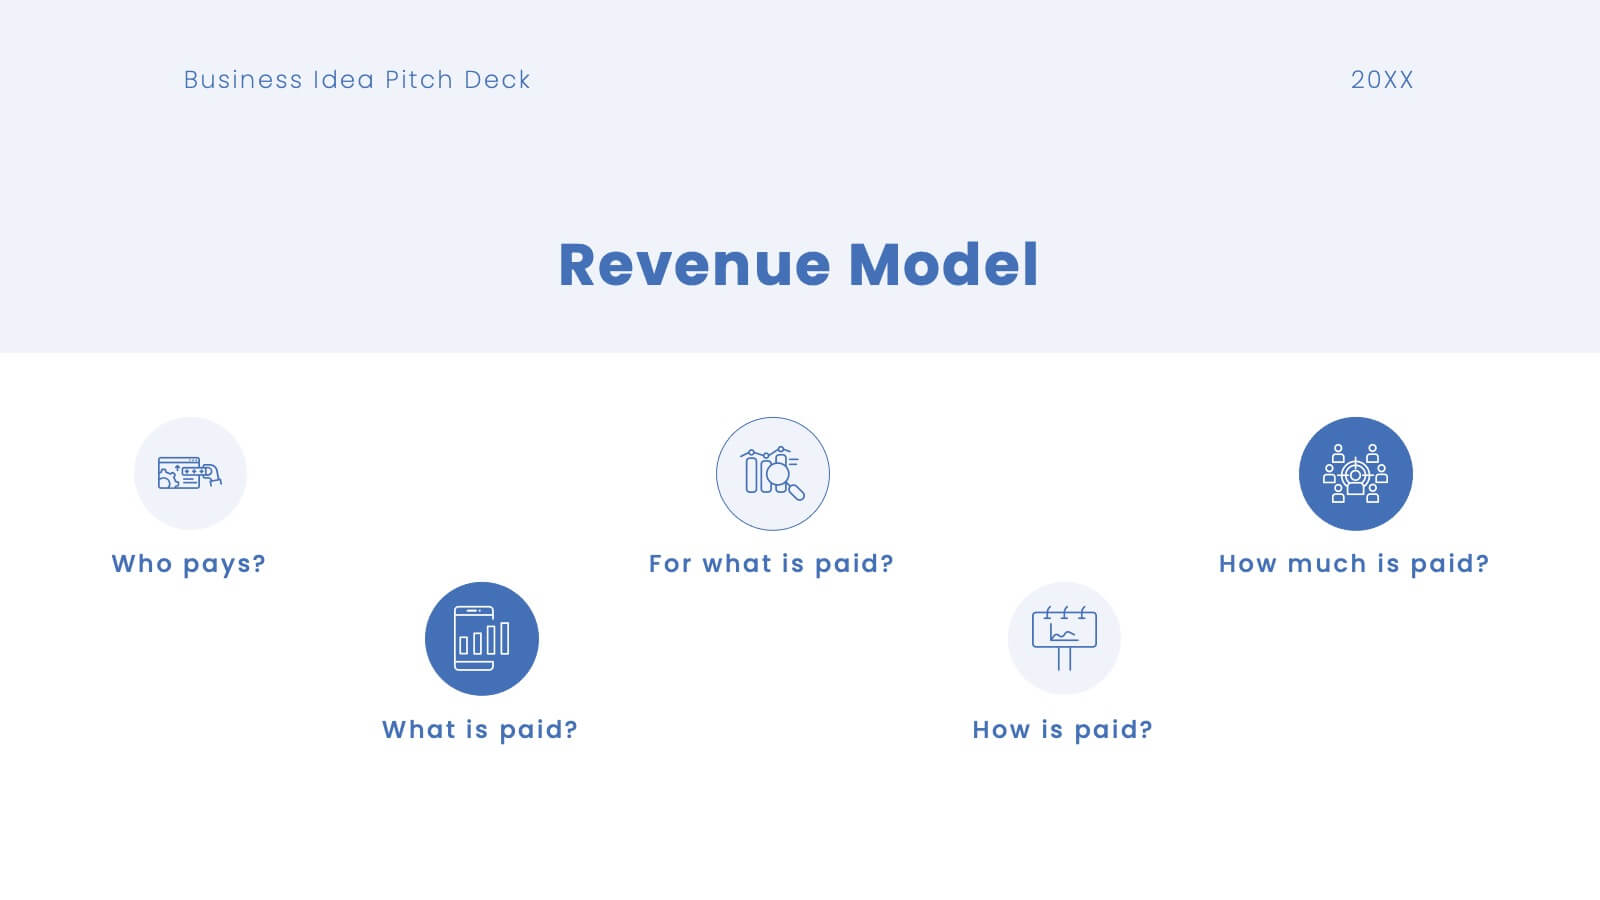
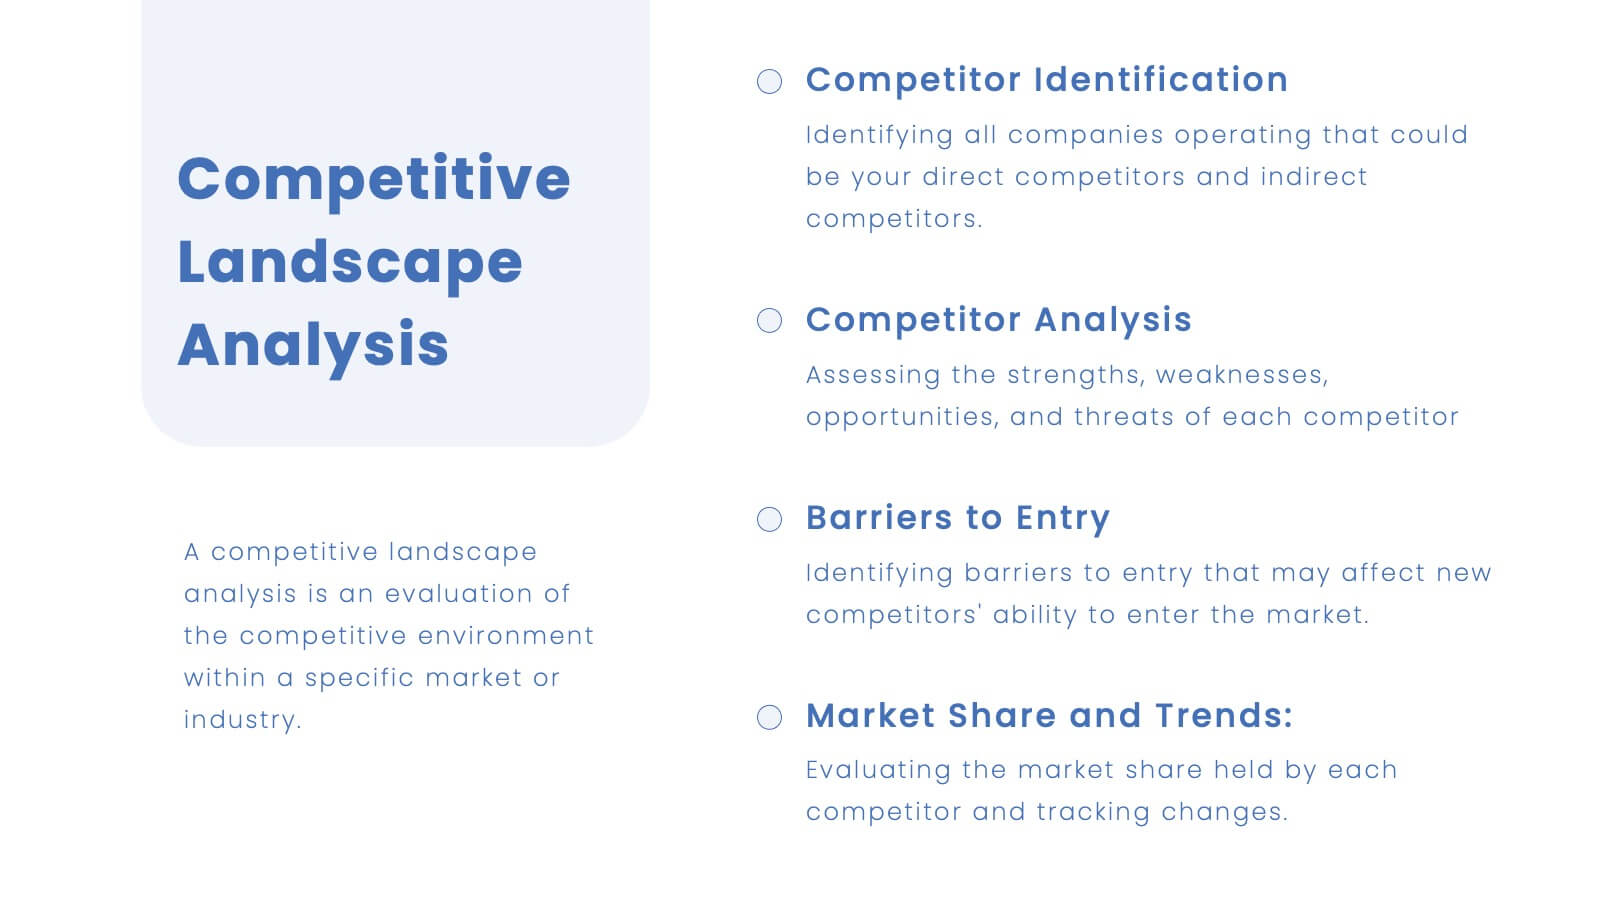
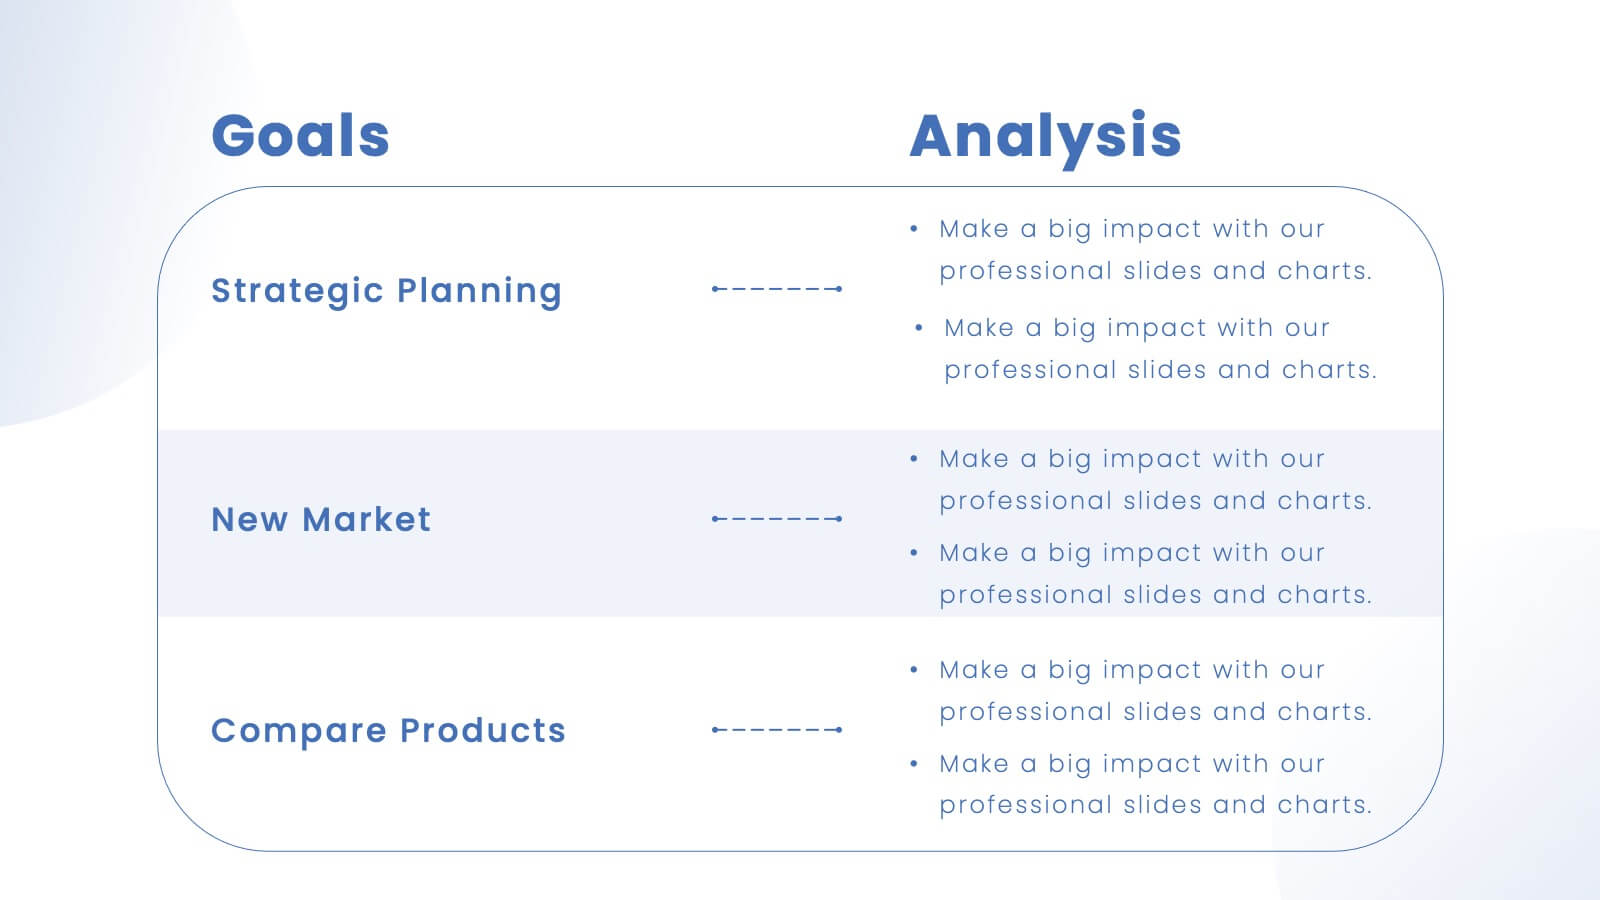
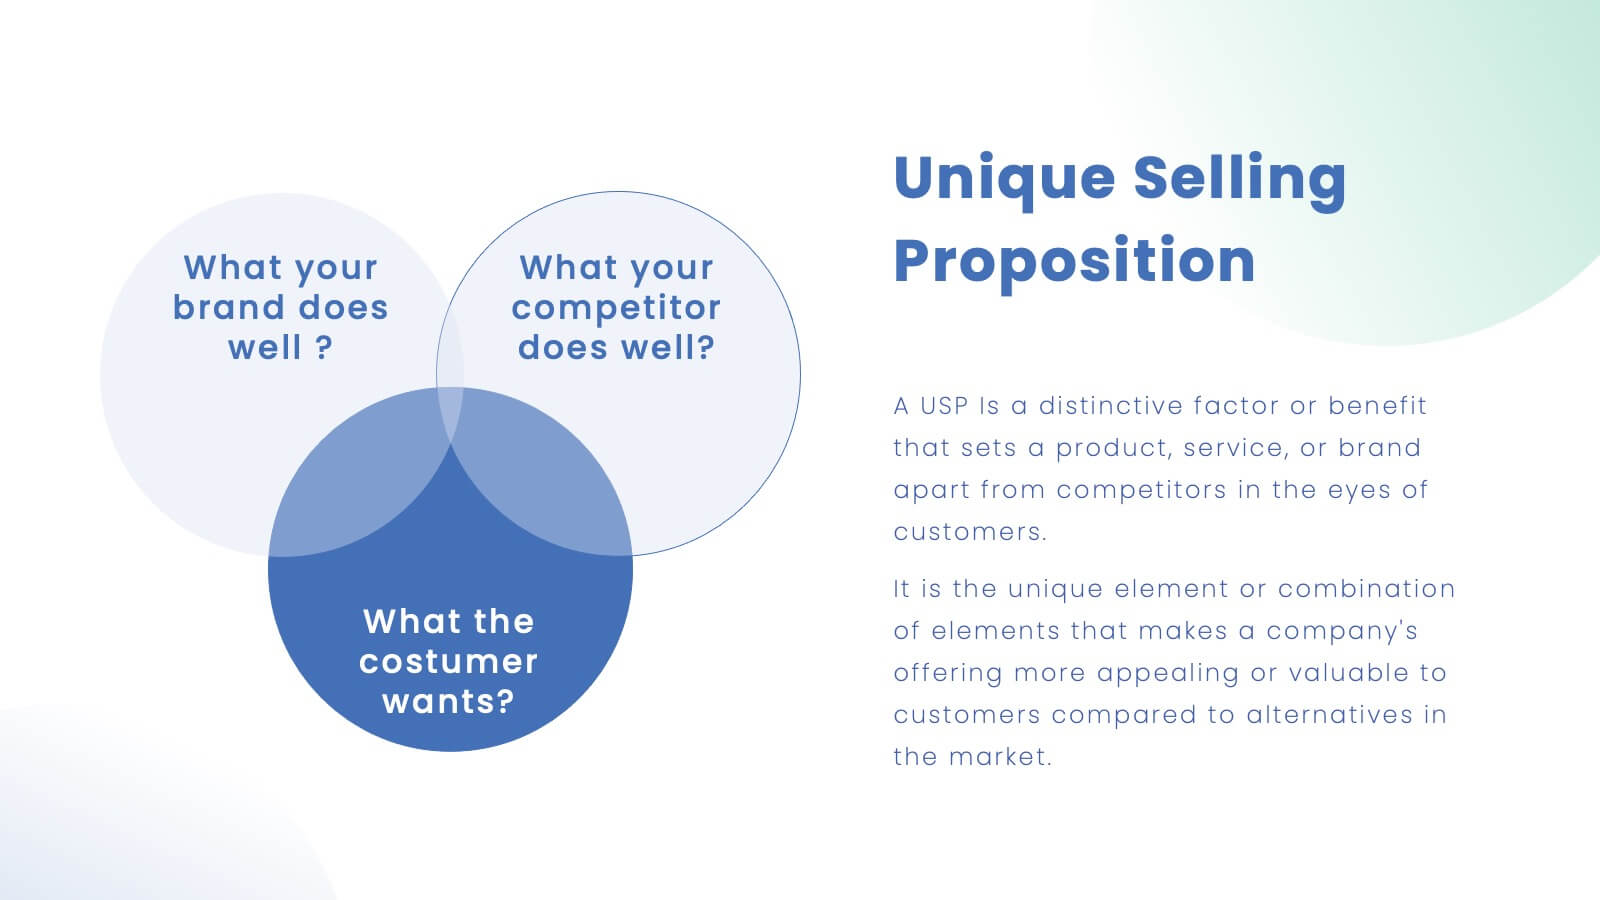
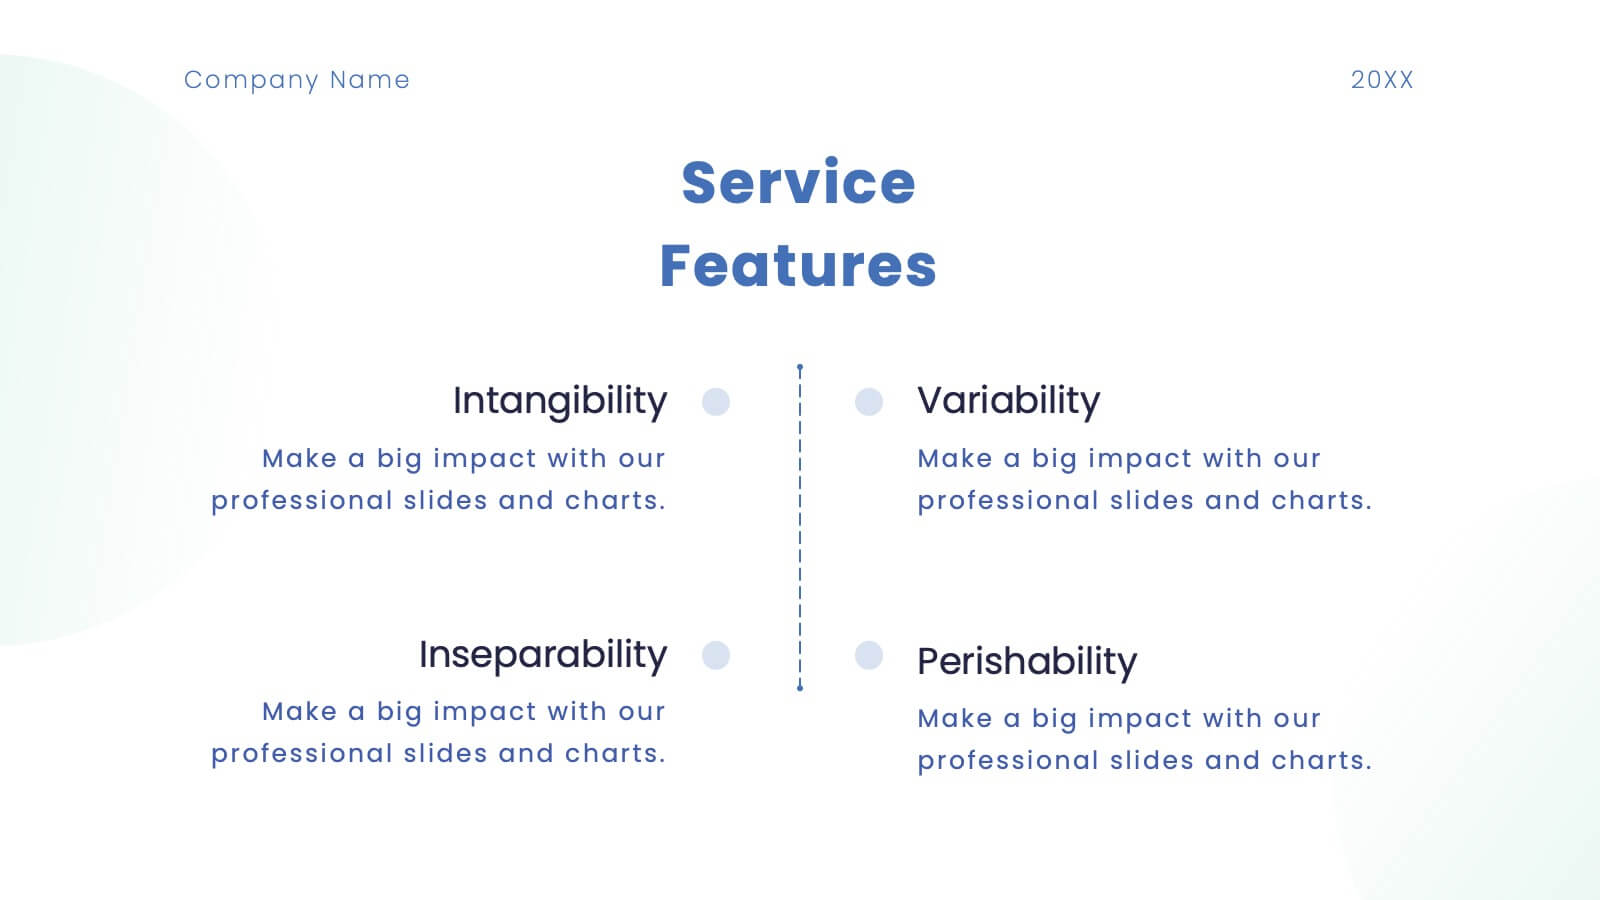
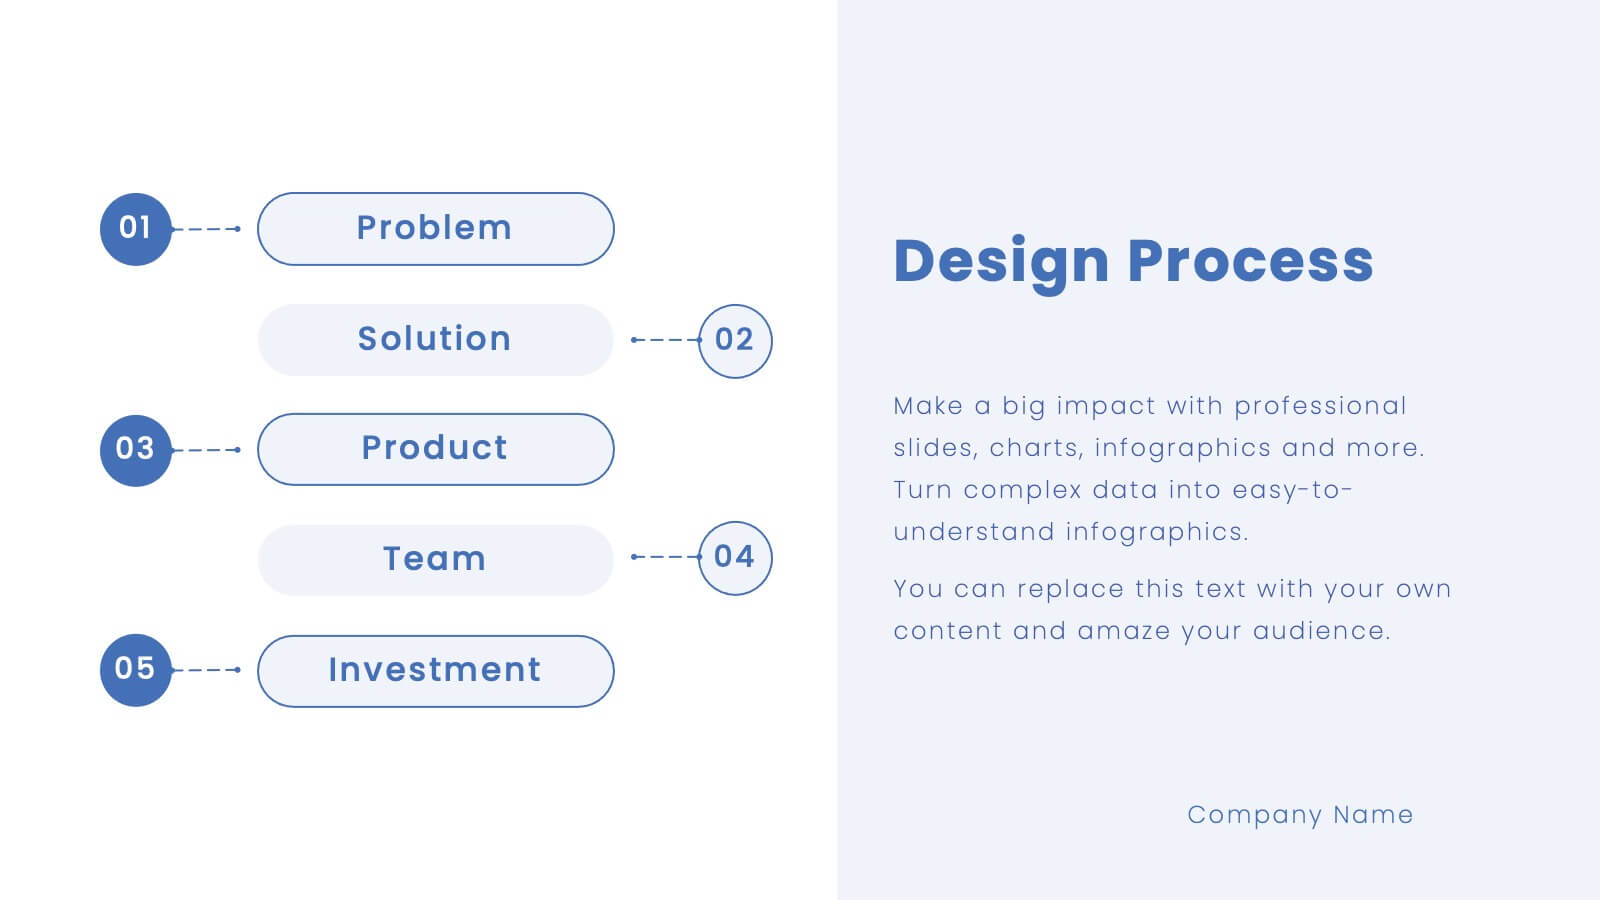
Platinum Business Idea Pitch Deck Presentation
Present your business idea with this sleek and professional pitch deck template! It includes everything from market opportunities to financial projections and sales strategies, providing a comprehensive structure for your pitch. Fully customizable and compatible with PowerPoint, Keynote, and Google Slides, this template is ideal for impressing investors and stakeholders.


5 slides
SMART Objective Planning for Success Presentation
Turn your goal-setting process into a clear, actionable strategy with this SMART Objective Planning slide. Designed around the SMART framework—Specific, Measurable, Achievable, Relevant, Time-bound—this layout helps you articulate objectives with clarity and focus. Each segment features a bold letter with icons and editable descriptions beneath. Ideal for planning sessions, strategic reviews, and team alignment meetings. Compatible with PowerPoint, Keynote, and Google Slides.


5 slides
RACI Role Assignment Matrix Overview Presentation
Clarify team responsibilities with the RACI Role Assignment Matrix Overview Presentation. This professional template helps define who is Responsible, Accountable, Consulted, and Informed across key project tasks. Perfect for streamlining communication, reducing overlap, and improving accountability. Fully editable in PowerPoint, Canva, and Google Slides.


3 slides
Short-Term and Long-Term Action Goals Presentation
Plan with purpose using the Short-Term and Long-Term Action Goals Presentation. This clear, side-by-side layout helps you organize initiatives by timeframe—perfect for project planning, strategy roadmaps, or goal tracking. Fully editable in Canva, PowerPoint, and Google Slides for easy customization across teams and presentations.


4 slides
Business Information Security Compliance Presentation
Ensure your systems meet security standards with the Business Information Security Compliance presentation slide. Designed with a central cloud and laptop graphic surrounded by icons representing data, user access, encryption, and compliance checks, this layout is perfect for illustrating IT governance, risk management, and data protection protocols. Fully customizable in PowerPoint, Keynote, and Google Slides.


4 slides
Project Task Ownership with RACI Chart Presentation
Assign roles clearly with the Project Task Ownership with RACI Chart Presentation. This template simplifies responsibility mapping across tasks using the RACI framework (Responsible, Accountable, Consulted, Informed). With a clean matrix layout, it's perfect for project planning, stakeholder alignment, and workflow transparency. Fully editable in PowerPoint, Canva, and Google Slides.