
Features
- 5 Unique slides
- Fully editable and easy to edit in Microsoft Powerpoint, Keynote and Google Slides
- 16:9 widescreen layout
- Clean and professional designs
- Export to JPG, PDF or send by email


Do you have any questions?
Recommend


22 slides
SEO Report Presentation
Optimize your SEO strategies using our comprehensive SEO Report template. It includes sections for keyword performance, market trends, competitor insights, and client feedback. Tailored for digital marketers and SEO specialists, this template supports presentations in PowerPoint, Keynote, and Google Slides.


12 slides
Compliance and Policy Management Presentation
Visualize your compliance ecosystem with the Compliance and Policy Management Presentation. Designed around a planetary orbit concept, this slide maps core policies at the center with surrounding regulations and enforcement layers. Each orbit can represent levels of governance, department roles, or regulatory zones—making it ideal for risk teams, auditors, and legal advisors. Fully customizable in PowerPoint, Keynote, and Google Slides for seamless use.


4 slides
Cross-Functional Role Matrix Chart Presentation
Visualize responsibilities across teams with the Cross-Functional Role Matrix Chart Presentation. This template makes it easy to map roles, tasks, or departments in a clean matrix layout. Ideal for project managers, team leaders, or operations professionals, the chart highlights role relationships and task ownership. Fully editable in Canva, PowerPoint, Keynote, and Google Slides.


20 slides
Legacy Sales Strategy Presentation
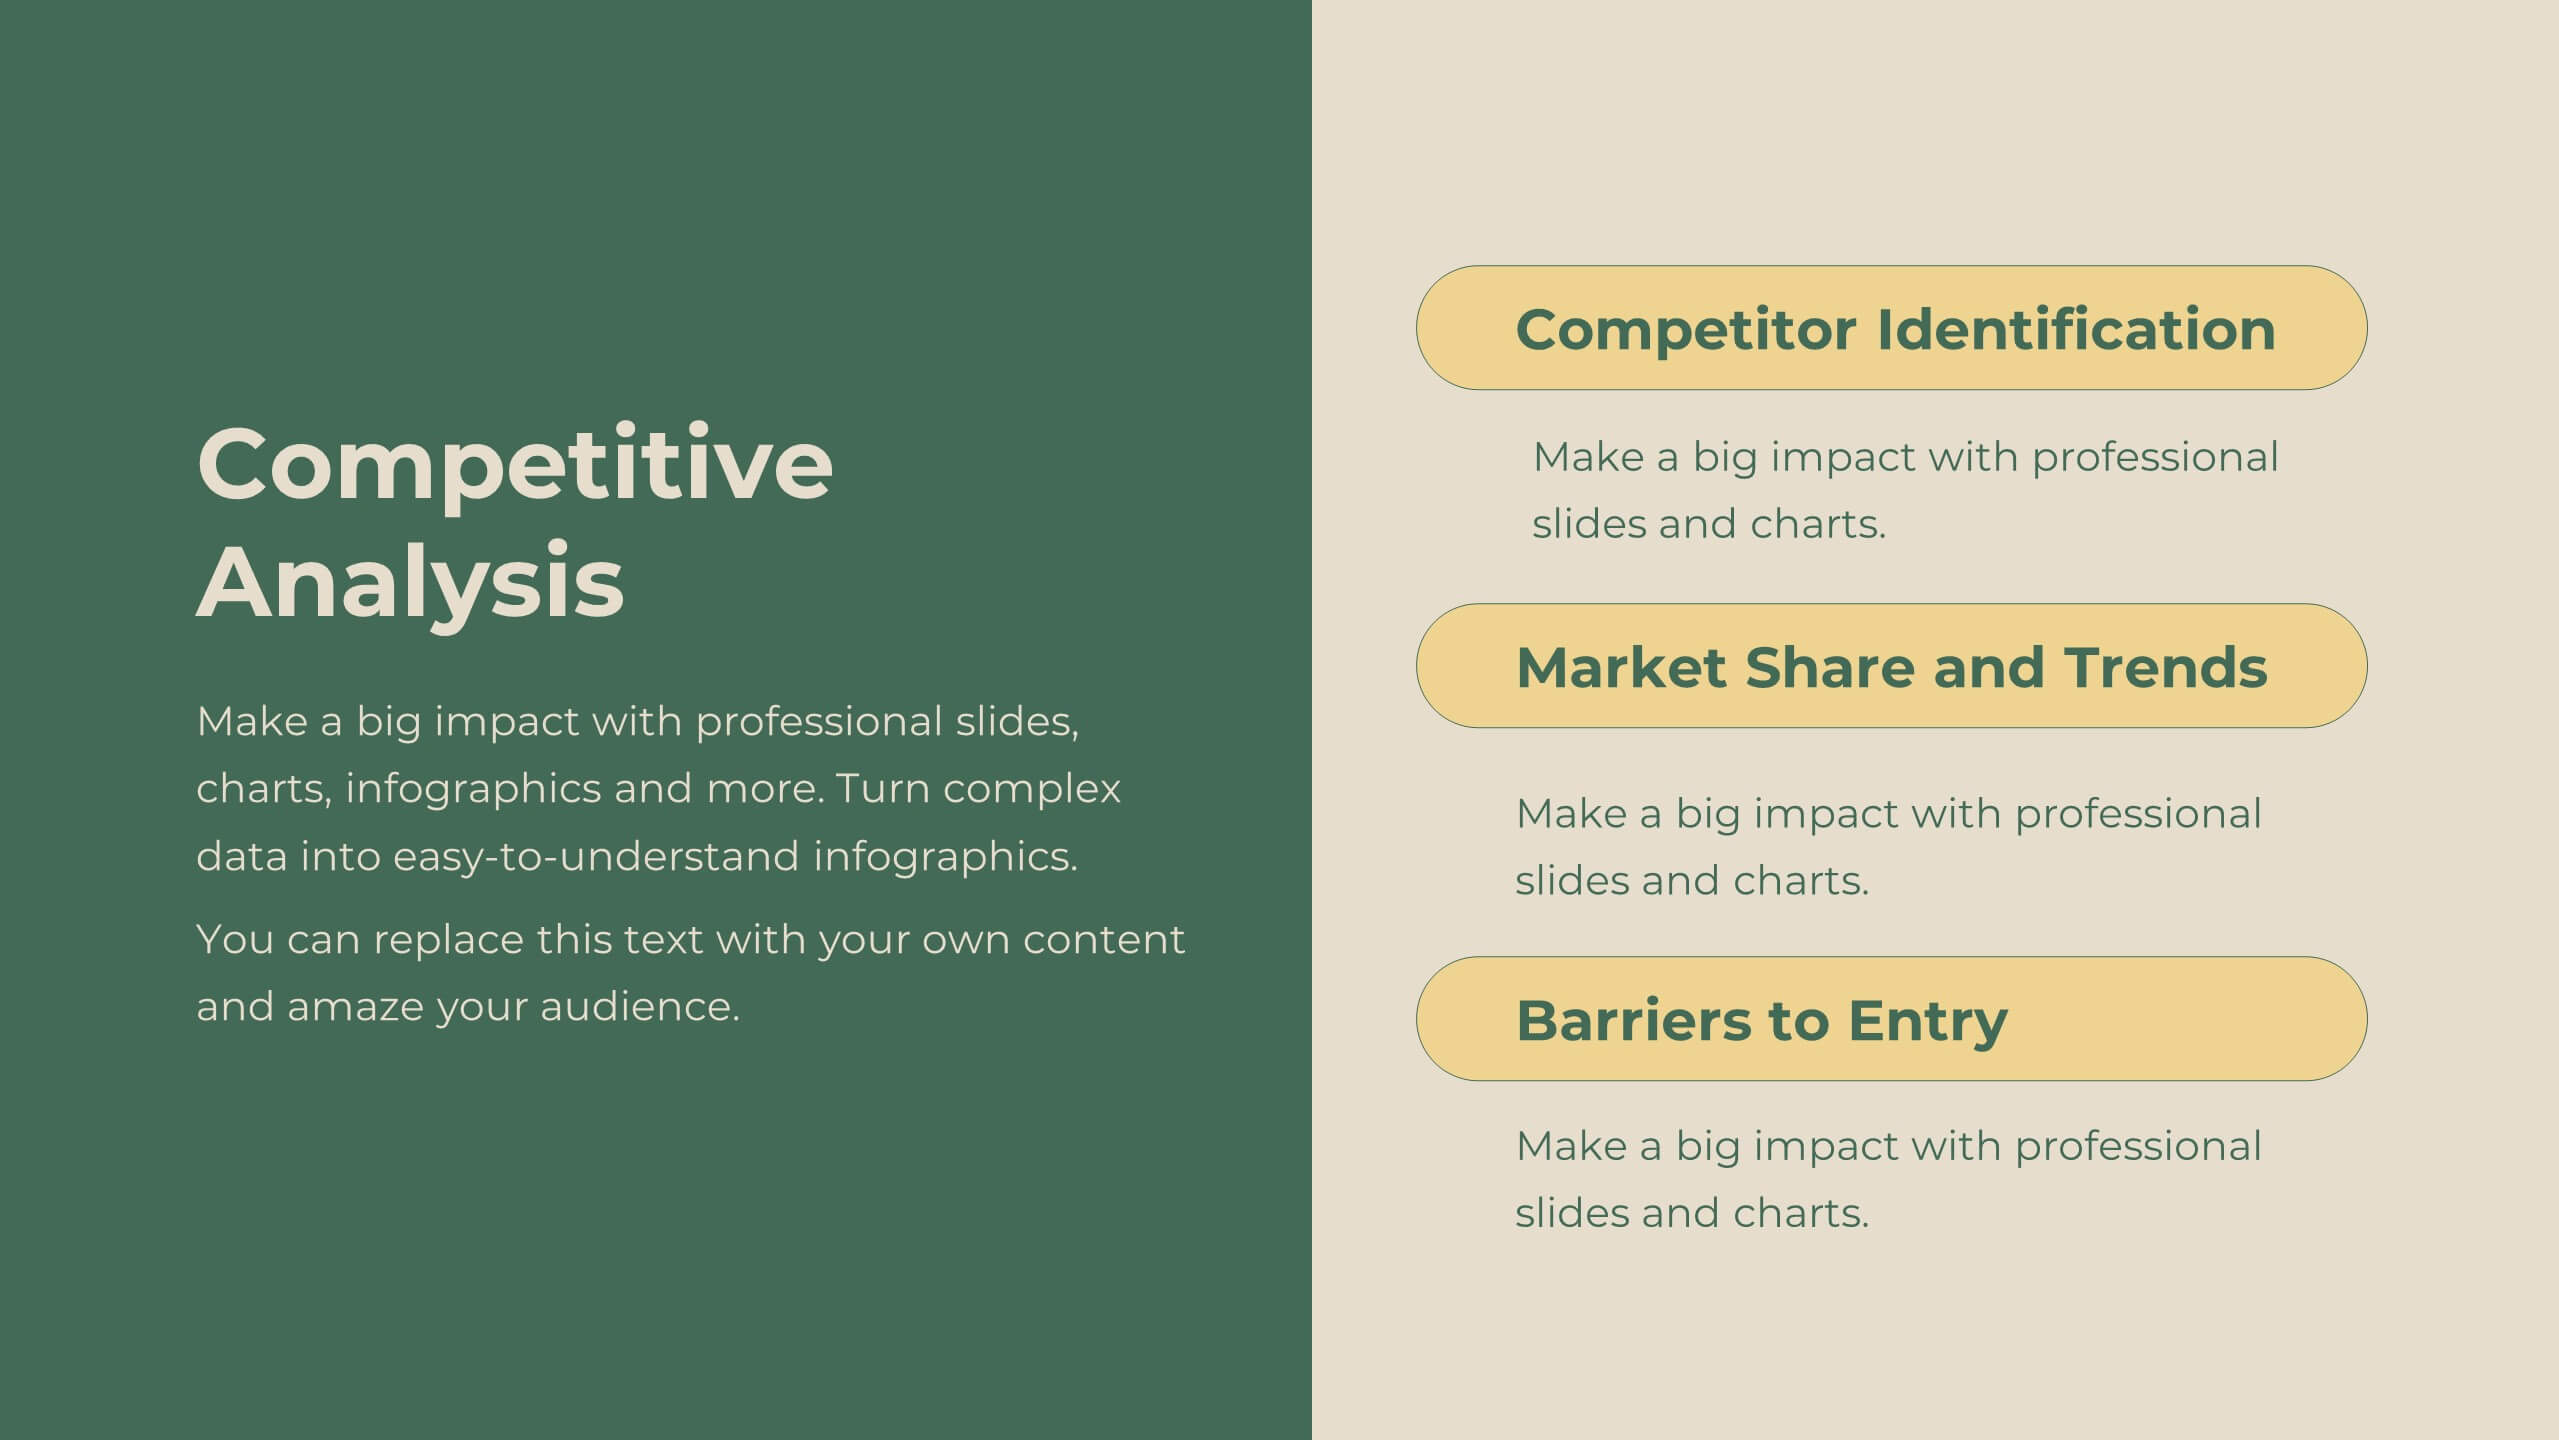
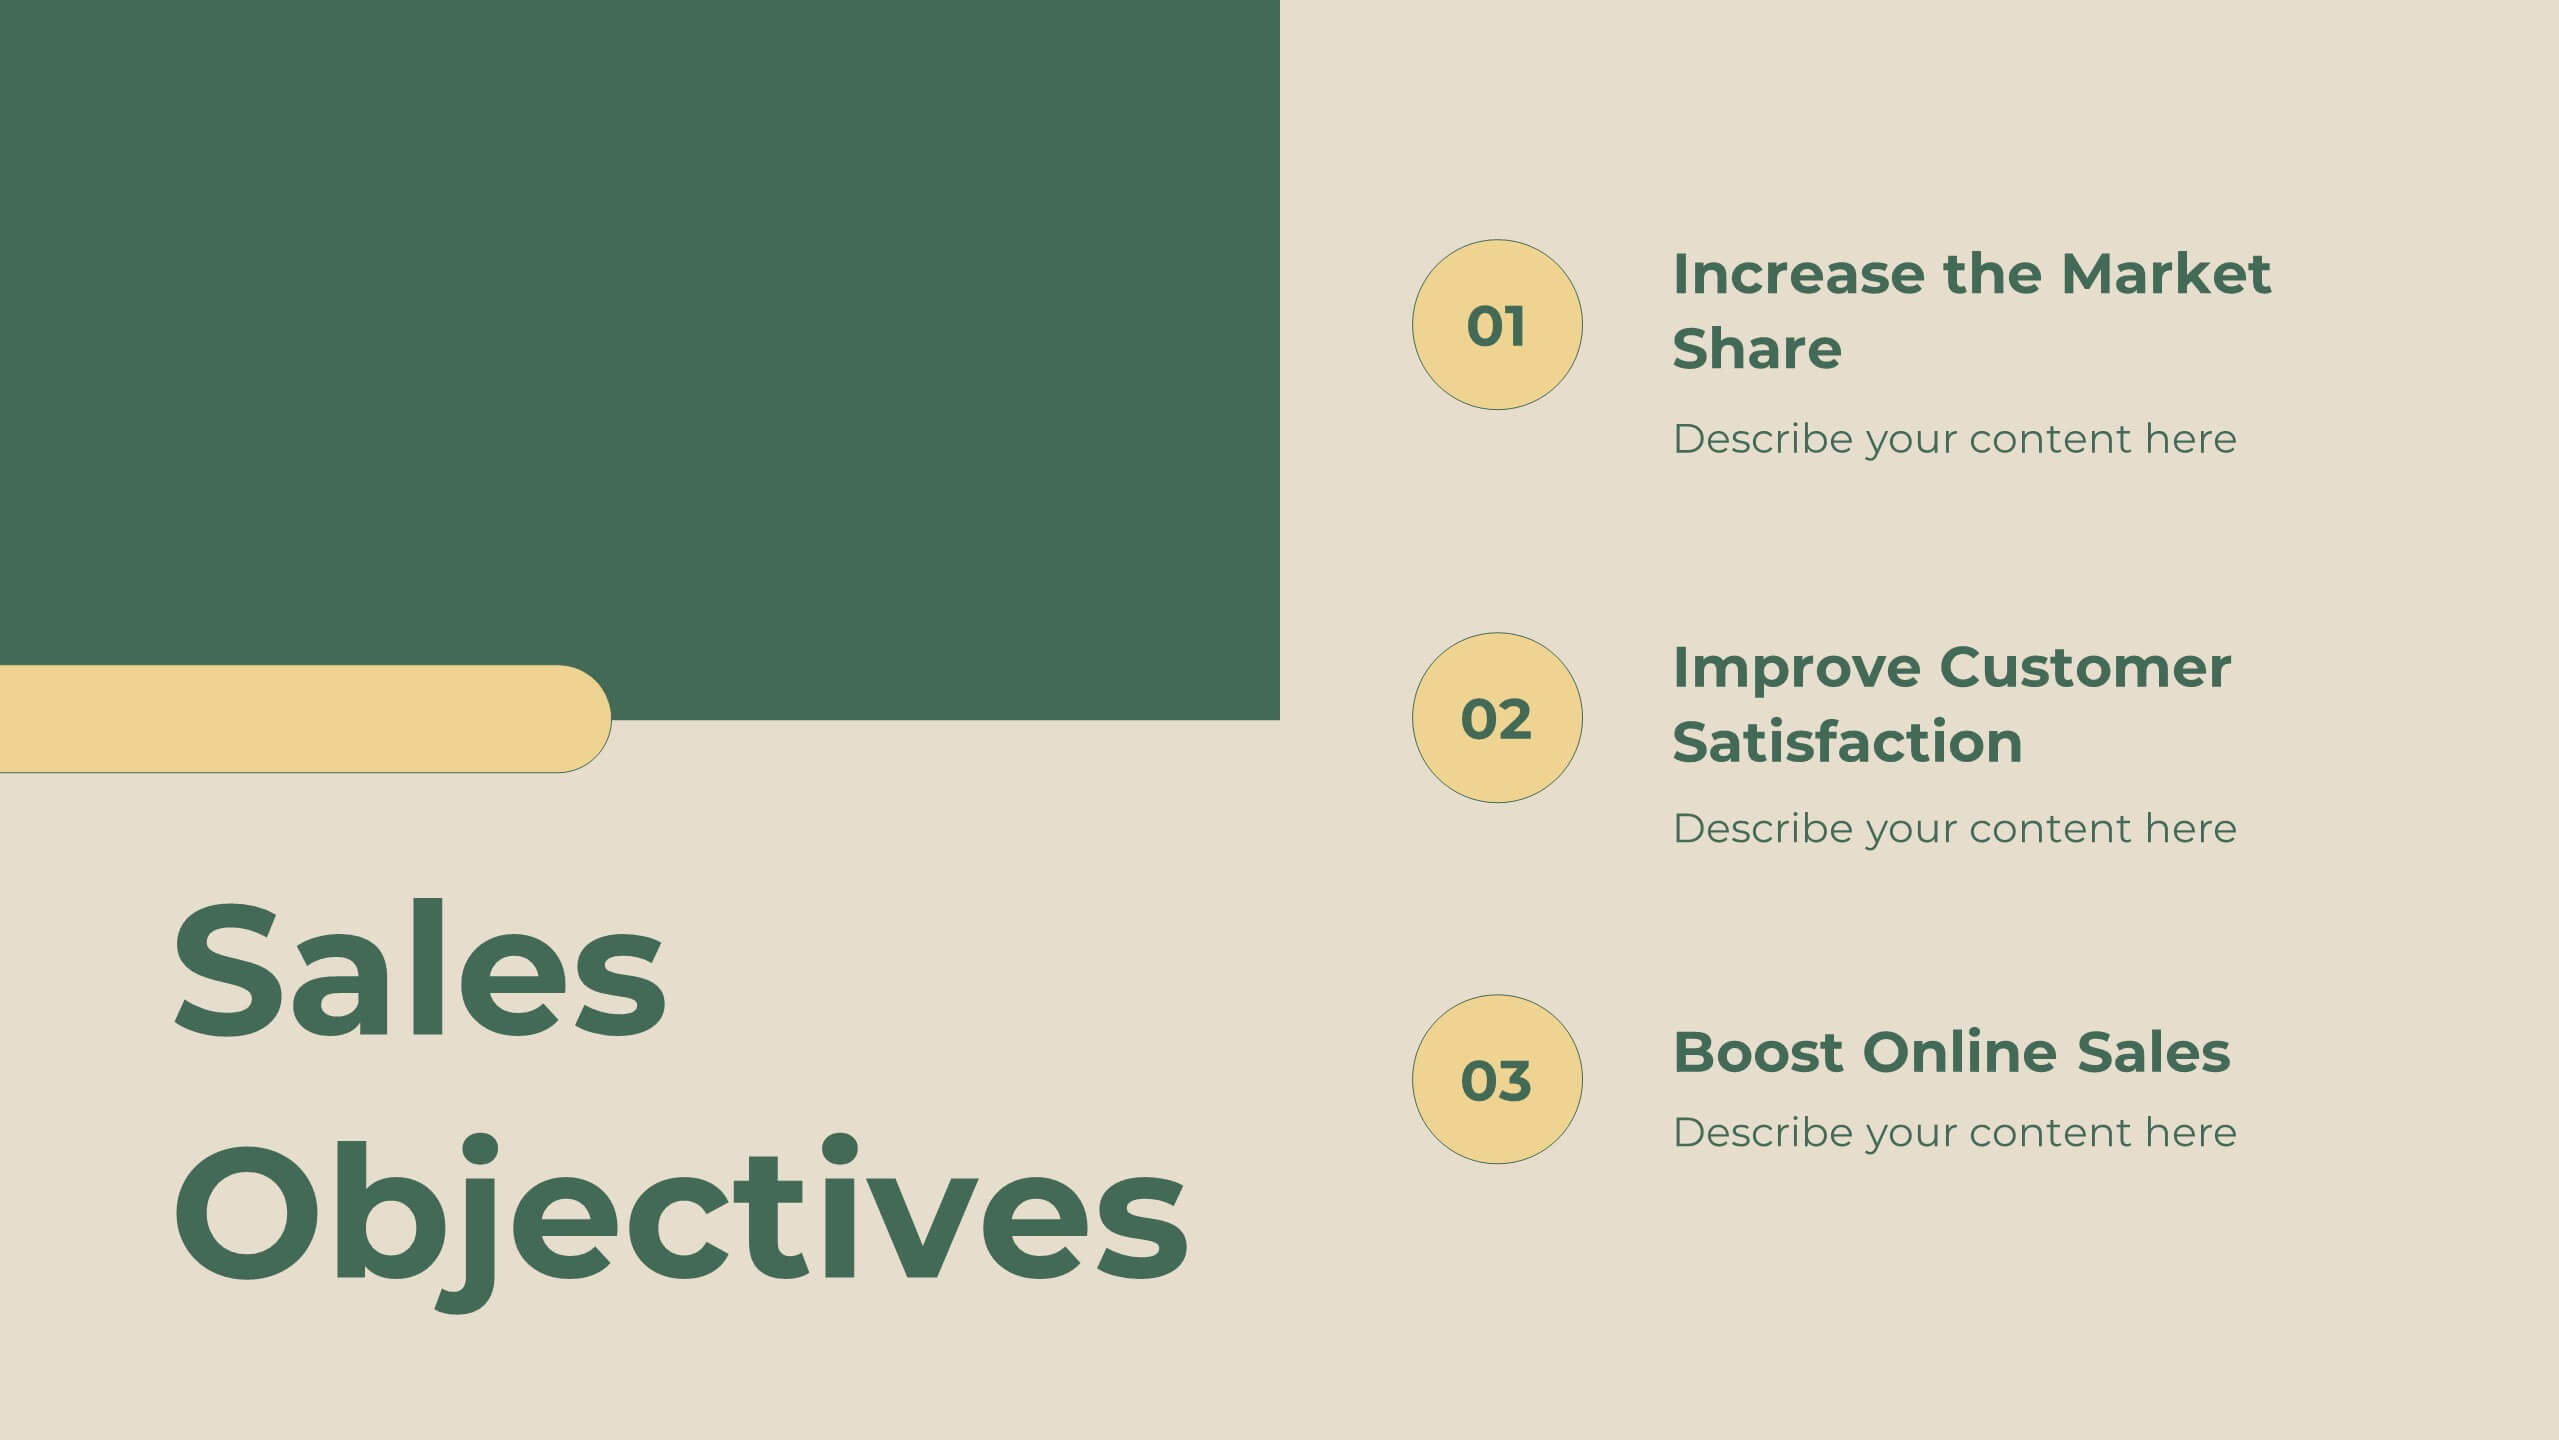
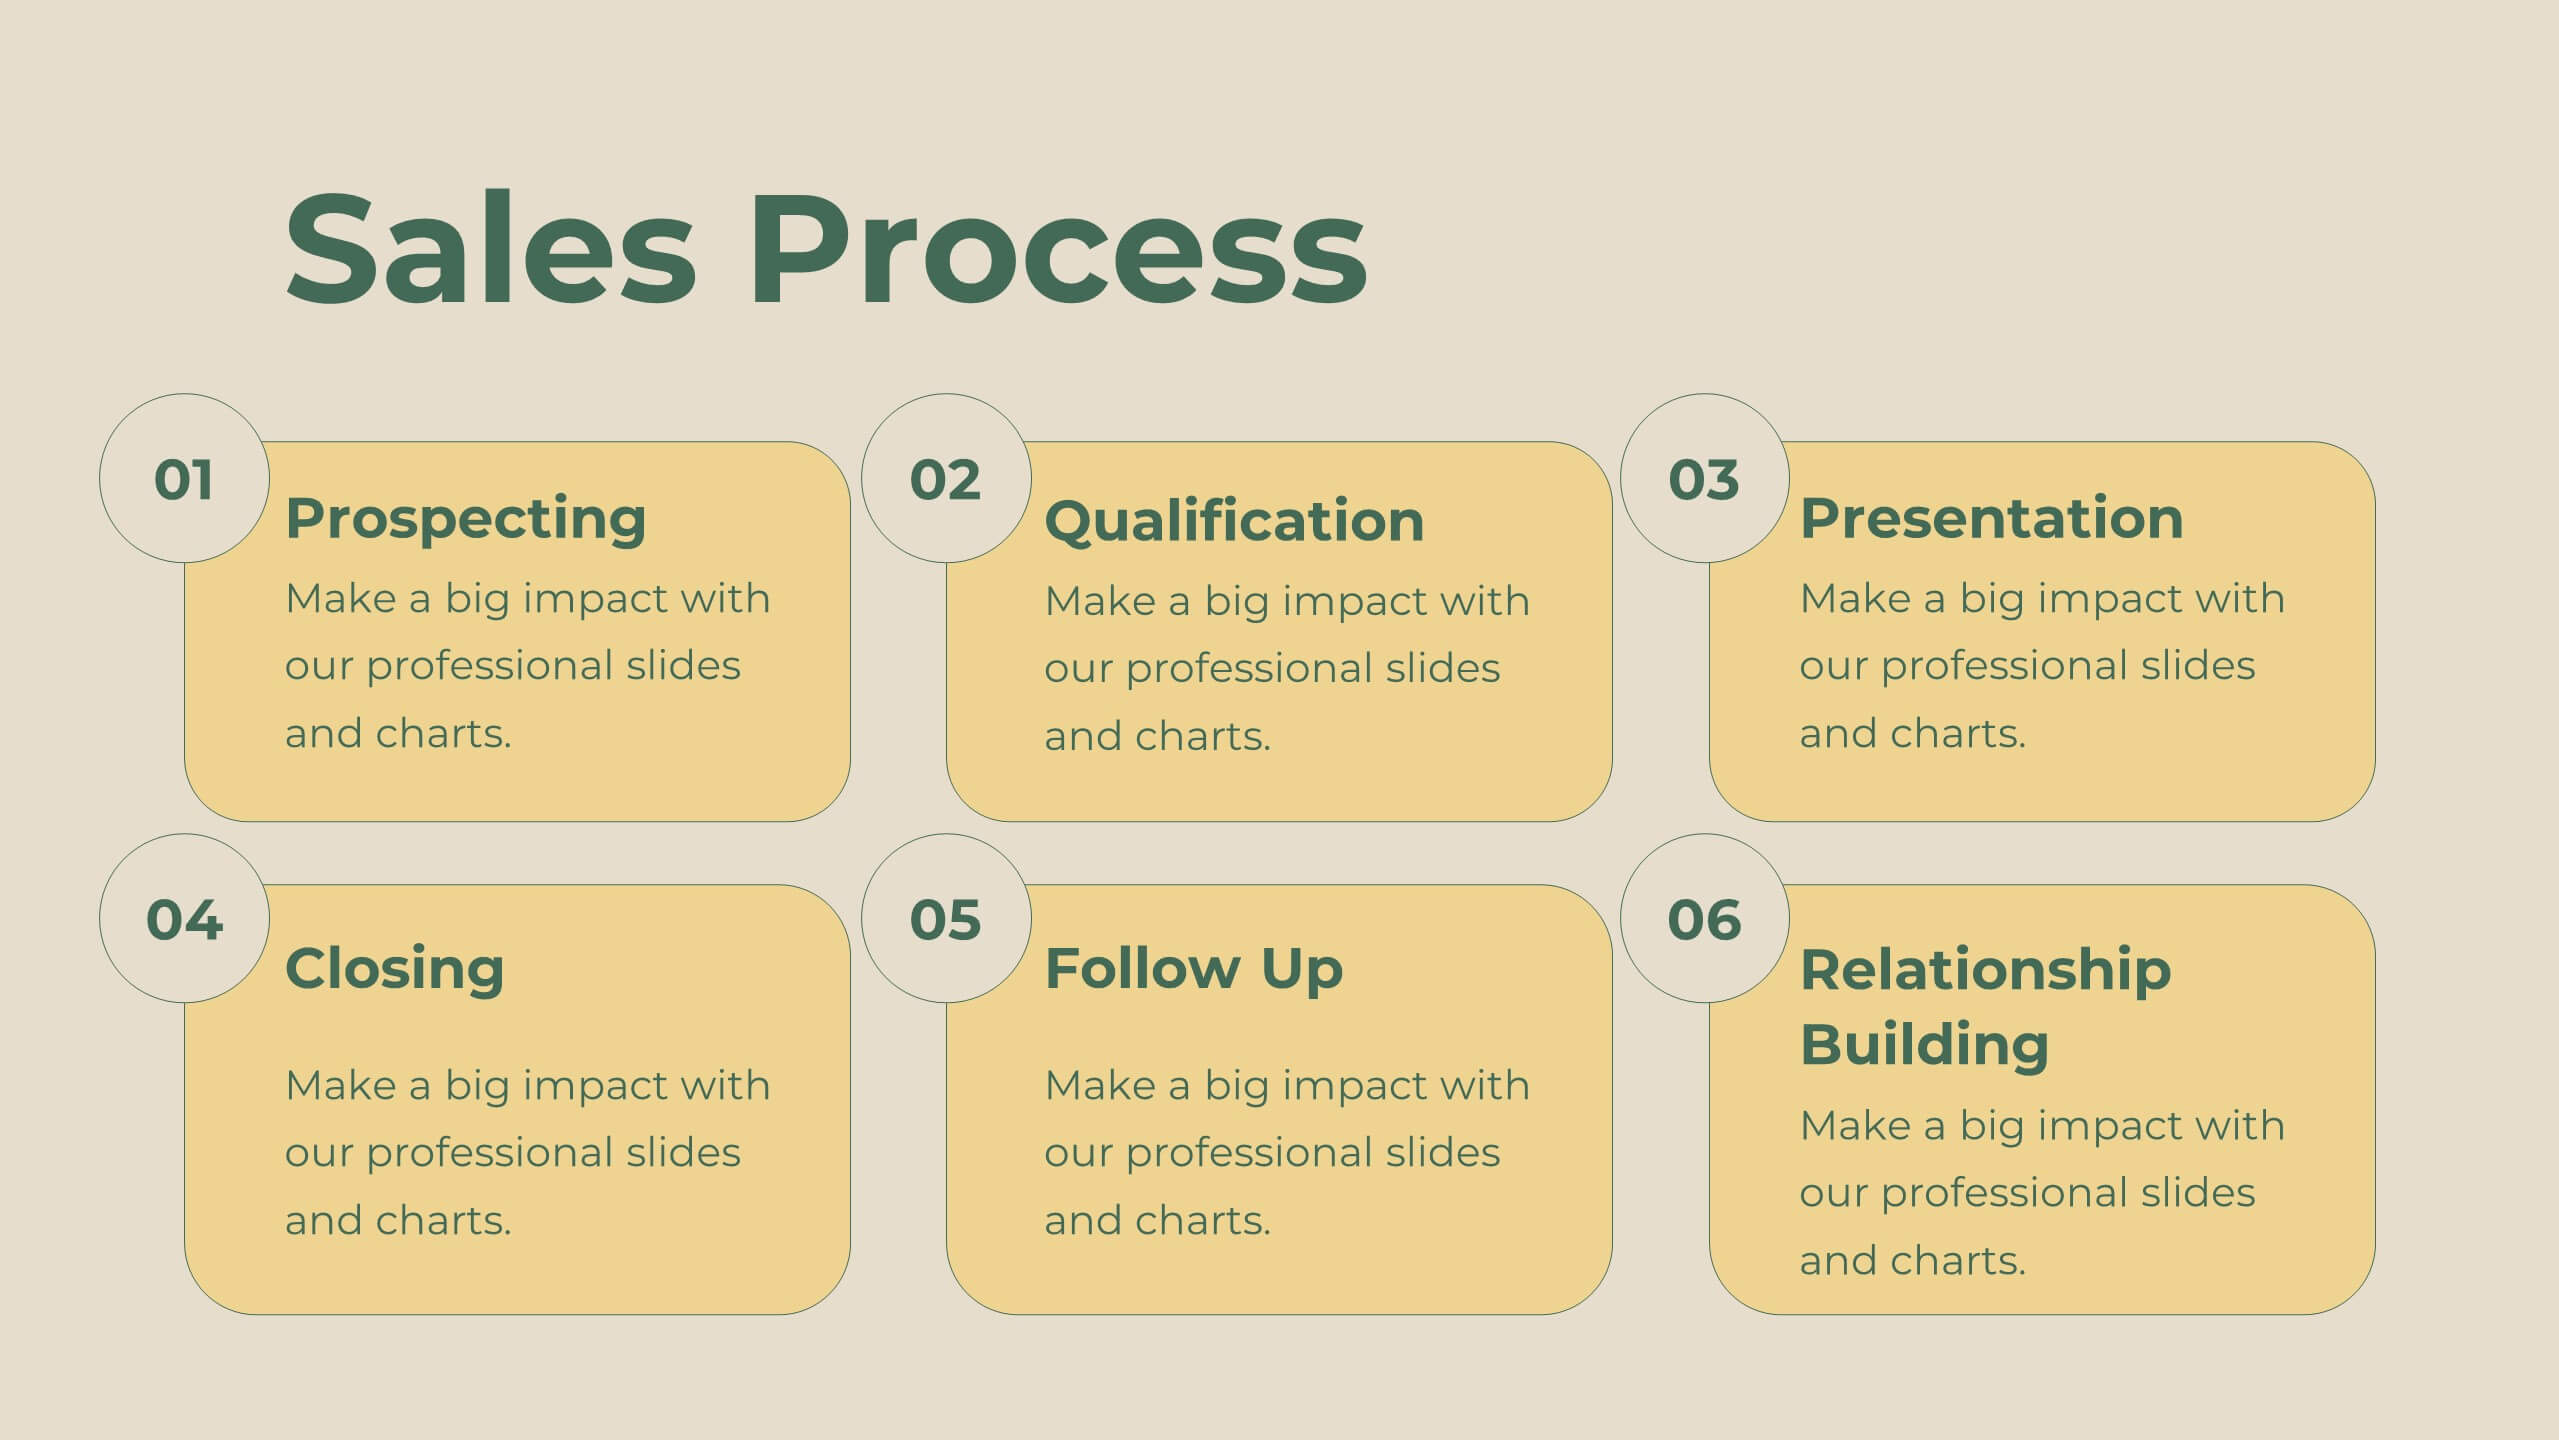
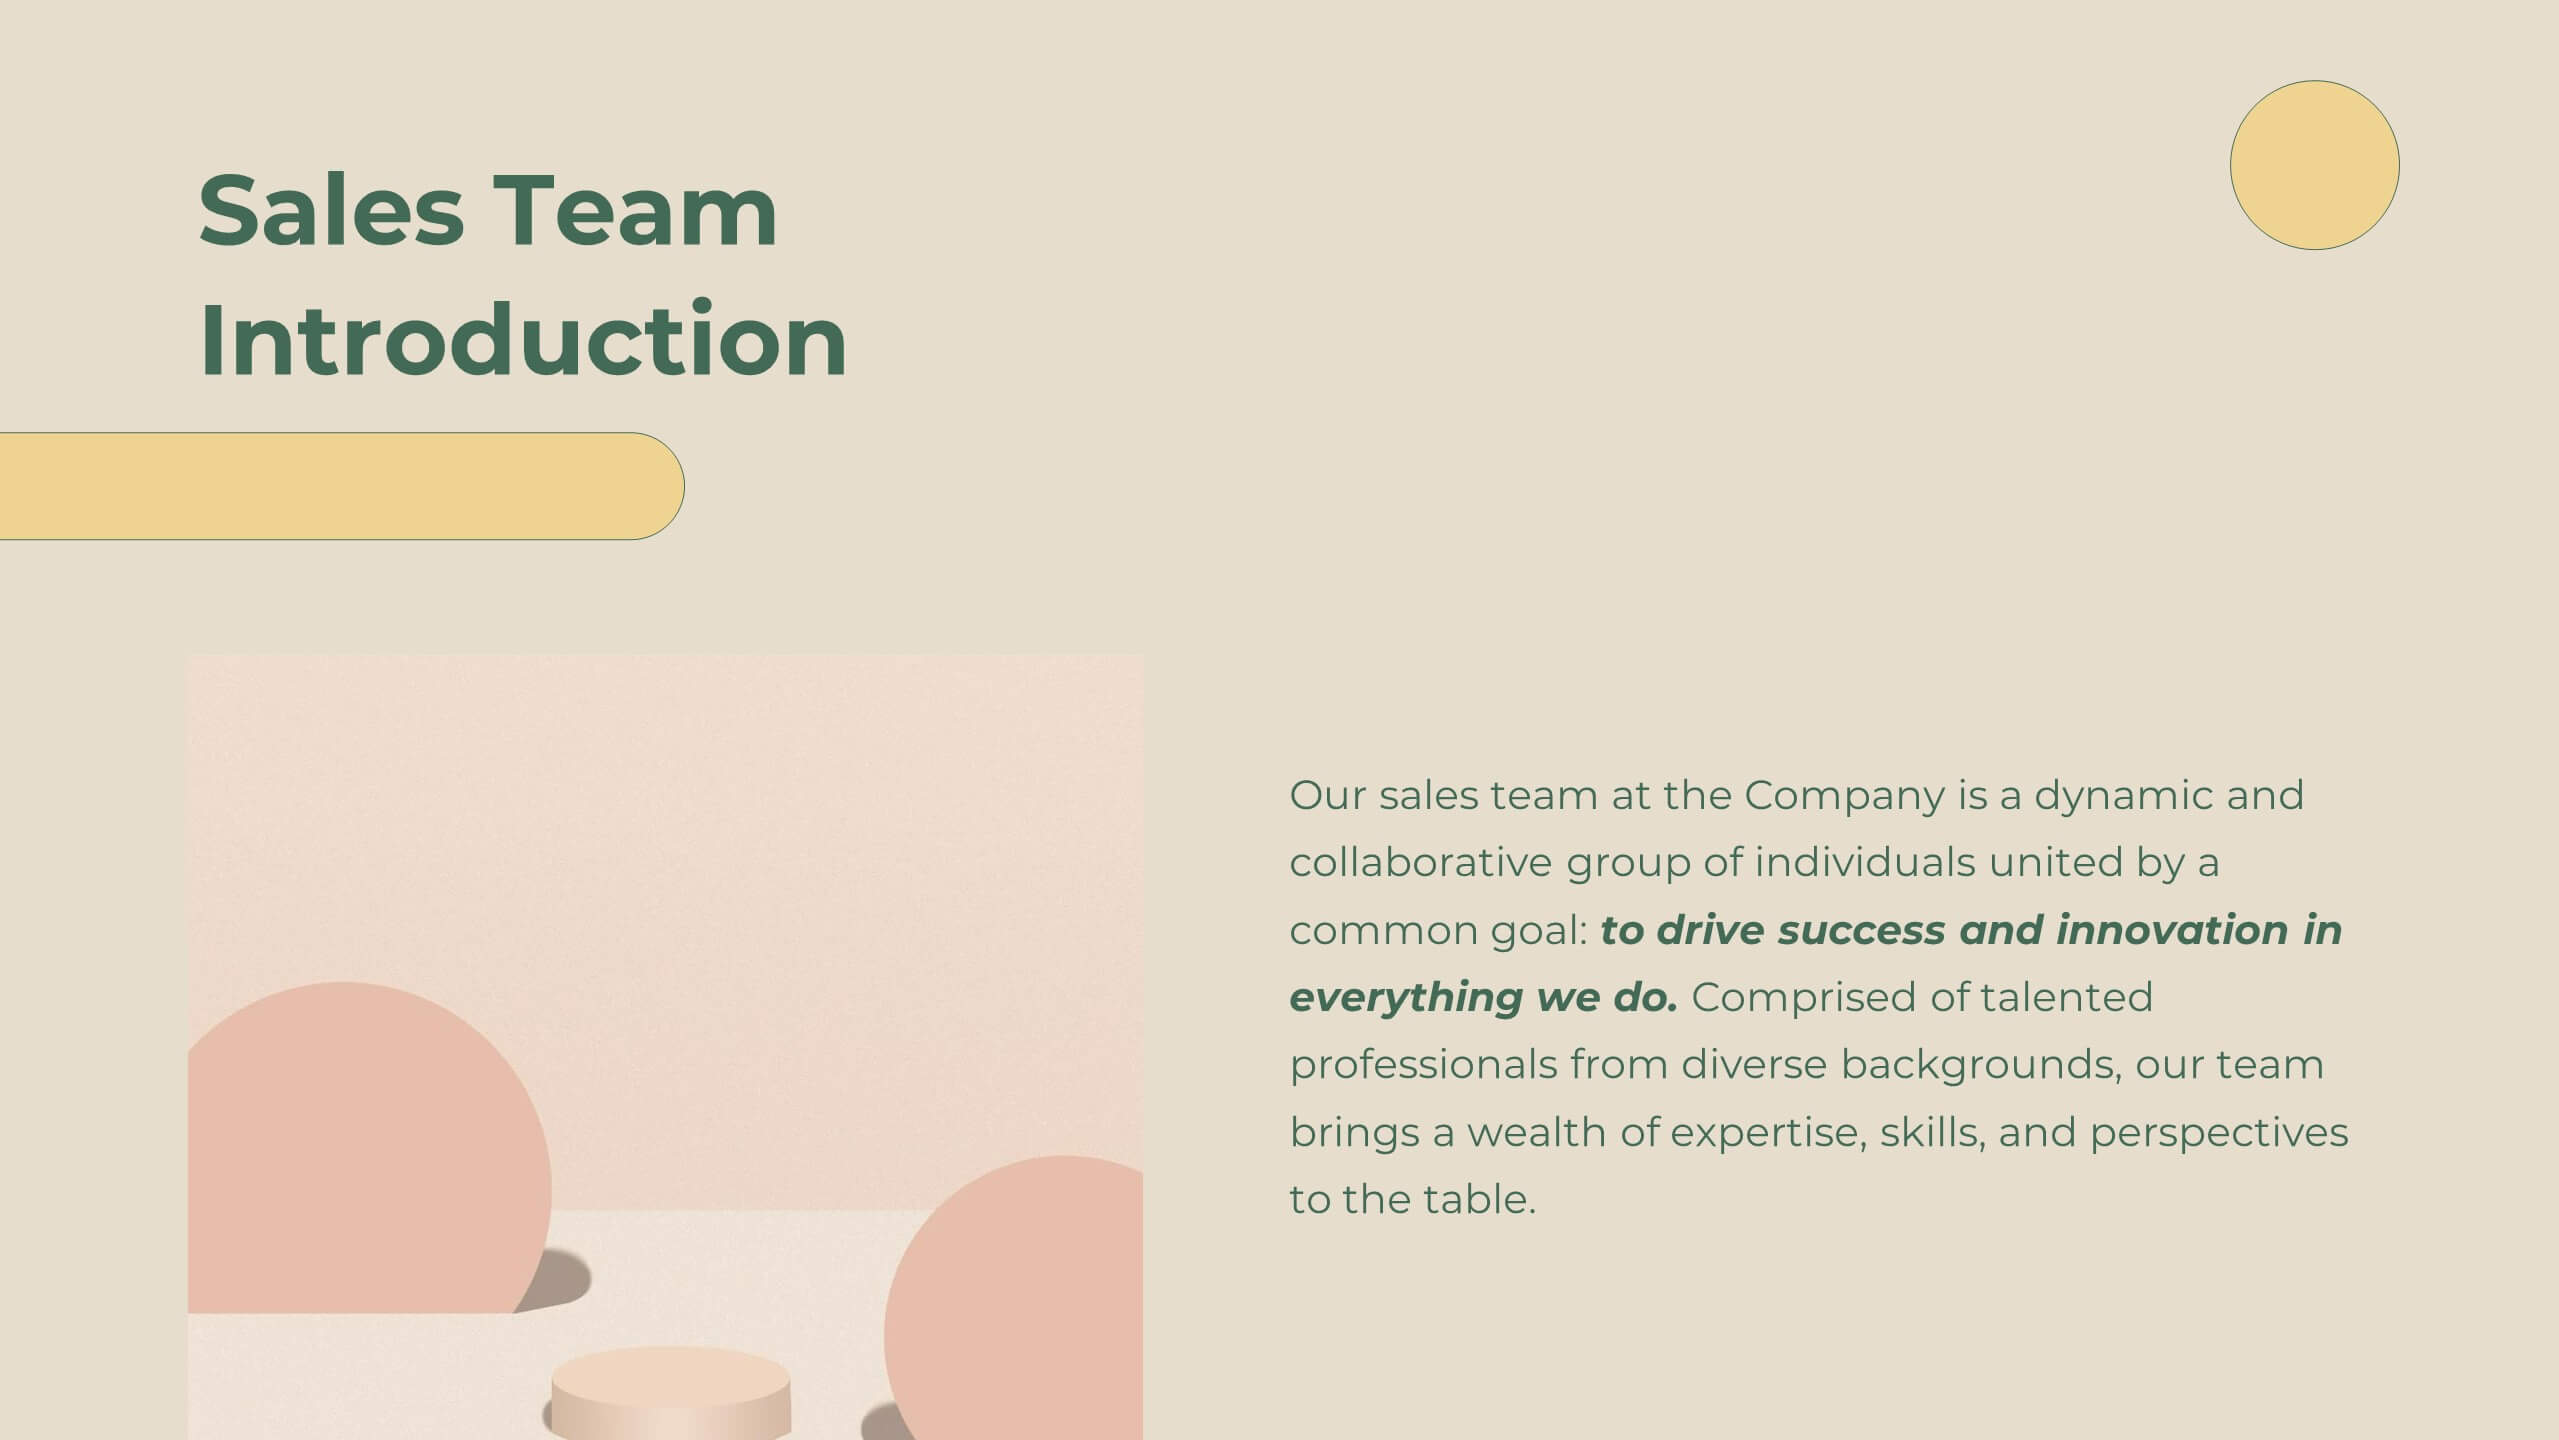
Boost your sales presentations with this modern template! It features sections for objectives, process, team introduction, customer testimonials, and performance metrics. Ideal for outlining strategies, opportunities, and pricing. Engage your audience with a professional, clean design. Compatible with PowerPoint, Keynote, and Google Slides for seamless integration. Make your sales strategy stand out!


4 slides
Mind Mapping for Idea Expansion Presentation
Visualize your concepts clearly with this Mind Mapping for Idea Expansion presentation. Designed to help structure brainstorming sessions or strategic planning, this template organizes ideas around a central theme with clean, radial layouts. Ideal for creative teams and professionals. Fully editable in Canva, PowerPoint, and Google Slides.


4 slides
RACI Matrix for Role Assignment Presentation
Simplify team roles and task ownership with this RACI Matrix for Role Assignment slide. Clearly map out who is Responsible, Accountable, Consulted, and Informed for each project task across team members. Ideal for project planning, team meetings, or stakeholder alignment. This structured matrix layout allows easy customization for names, tasks, and role indicators. Fully editable and compatible with PowerPoint, Keynote, and Google Slides.


10 slides
Agile Scrum Framework Presentations
Kickstart your workflow with a clear, energetic layout designed to simplify complex processes and highlight each stage of your agile cycle. This presentation explains how iterative teamwork, transparency, and fast delivery shape efficient project management. Clean visuals guide viewers through structured steps. Compatible with PowerPoint, Keynote, and Google Slides.


5 slides
Clear Business Objectives Slide Presentation
Spark clarity and direction with a slide built to showcase key objectives in a straightforward, visually engaging way. This presentation helps teams define priorities, outline expected outcomes, and communicate strategic intent with ease. Perfect for planning, reporting, and leadership updates. Fully compatible with PowerPoint, Keynote, and Google Slides.


5 slides
Business Model Canvas and Strategy Presentation
Visualize your entire business model in one clean, structured slide. This presentation template breaks down key areas—Partners, Activities, Value Propositions, Customers, Channels, Costs, and Revenue—into a color-coded layout for strategic clarity. Perfect for startups, consultants, or internal strategy teams. Fully editable in PowerPoint, Keynote, and Google Slides.


7 slides
Success Business People Infographic Presentation
A Business People Infographic is a visual representation of data and information related to various aspects of business and the people involved in it. This infographic is a great way to illustrate your topic, point by point. This is an ideal template for making professional business presentations. This template is fully editable, perfect for business presentations and meetings. It includes all of the graphics you need to shows your audience interesting statistics and data. Compatible with Powerpoint, Keynote and Google Slides, your audience will be impressed by the dynamic slides!


5 slides
Business Innovation Strategy Presentation
Present a compelling Business Innovation Strategy with this modern infographic. Designed to highlight key insights, innovative solutions, and strategic approaches, this template is perfect for business professionals, consultants, and startups. Fully editable and compatible with PowerPoint, Keynote, and Google Slides.


6 slides
Social Media Metrics Dashboard Presentation
Bring your analytics to life with a bold, visual dashboard that makes social performance easy to understand at a glance. This presentation helps you showcase engagement, growth, and platform insights with clean charts and organized data sections. Fully editable and compatible with PowerPoint, Keynote, and Google Slides.


5 slides
Video Games History Infographics
The history of video games is a testament to the constant innovation and evolution of technology. These vertical infographics are visually captivating and informative designs that allow you to showcase the evolution and milestones of the video game industry. This template is perfect for presentations, educational materials, or any content related to video game history. Compatible with PowerPoint, Keynote, and Google Slides. This template features a combination of text, icons, illustrations, and vibrant colors to captivate your audience and present information in a visually appealing way. This is a powerful tool for showcasing the impact of the video game industry.


6 slides
Professional Title Infographic
This collection of professional presentation templates is meticulously designed to meet a variety of business needs, blending visual appeal with practical functionality. The templates are versatile, allowing professionals to effectively communicate complex data, strategic insights, and operational updates. One template is perfect for detailed data visualization, helping to highlight trends and insights that are crucial for data-driven decision-making. Another template focuses on team introductions, ideal for building a connection between your team and the audience, whether in stakeholder meetings or internal briefings. For marketing strategies, there's a template designed to outline customer demographics and behaviors, which is essential for tailoring marketing campaigns and product development. The collection also includes templates for financial reporting and pricing strategies, ensuring that financial data is communicated clearly and efficiently. Additionally, a strategic analysis template aids in outlining key business strengths, weaknesses, opportunities, and threats, supporting strategic planning and risk management. Overall, these templates are a valuable tool for any professional looking to present information clearly and compellingly in various business contexts.


12 slides
Alphabet Learning and Education Presentation
Introduce concepts creatively with this bold "A"-shaped infographic designed for education topics. Each segment of the letter highlights a numbered point, making it ideal for step-by-step instructions, learning stages, or literacy development. Use it to simplify complex ideas visually. Fully editable in PowerPoint, Keynote, and Google Slides.


12 slides
Market Research Data Insights Presentation
Gain Valuable Market Insights! The Market Research Data Insights Presentation is designed to help businesses analyze trends, customer behavior, and competitive landscapes. Featuring a structured circular layout, this template ensures data is easy to interpret and present. Fully customizable and compatible with PowerPoint, Keynote, and Google Slides for seamless editing.


21 slides
Mercurion Project Status Report Presentation
Stay on top of your project's progress with this structured and visually engaging presentation template. Covering key highlights, performance metrics, financial summaries, team productivity, and future priorities, this template helps you communicate project updates effectively. Whether for stakeholders, management, or team meetings, it provides clear insights and actionable recommendations. Fully customizable and compatible with PowerPoint, Keynote, and Google Slides.