


Features
- 4 Unique slides
- Fully editable and easy to edit in Microsoft Powerpoint, Keynote and Google Slides
- 16:9 widescreen layout
- Clean and professional designs
- Export to JPG, PDF or send by email


Do you have any questions?
Recommend


6 slides
Ideas Connection Venn Presentation Design
Present interconnected ideas with creativity and impact using the Ideas Connection Venn Presentation Design. This colorful, lightbulb-themed 5-section layout helps you visualize related concepts or stages, ideal for brainstorming, innovation mapping, or content planning. Each segment includes icons, titles, and descriptions to showcase your thoughts clearly. Fully customizable in PowerPoint, Keynote, and Google Slides.


6 slides
Strategy Wheel Stocks Infographic
A strategy wheel, also known as a strategic wheel or strategy clock, is a visual tool used in strategic management and marketing to analyze and compare different business strategies based on their market positioning and competitive advantage. This Infographic template visually presents different investment strategies in the stock market, helping investors understand and choose the best approach based on their goals and risk tolerance. Use this template to present various strategic options on a circular diagram, allowing for easy comparison and analysis. In each strategy segment provide a brief description of the key features, goals, and risk level.


6 slides
Employee Survey Results Infographic
"Survey results" typically refer to the collected data and findings from a survey conducted to gather information from a specific group of people, often for the purpose of research or decision-making. This infographic template is a visual representation of the data collected from an employee survey. It presents key findings, insights, and trends in a visually engaging format. This allows you to summarize the importance of employee feedback, and the positive impact of improvement efforts. This survey results infographic can be shared within the organization to communicate the survey outcomes to employees, managers, and leadership.


2 slides
Creative Gratitude Slide Presentation
Express gratitude in style with this creative thank-you slide template! Featuring bold typography and modern geometric elements, this design adds a unique touch to your presentations. Ideal for business pitches, creative projects, and professional meetings. Fully customizable and compatible with PowerPoint, Keynote, and Google Slides for effortless personalization.


4 slides
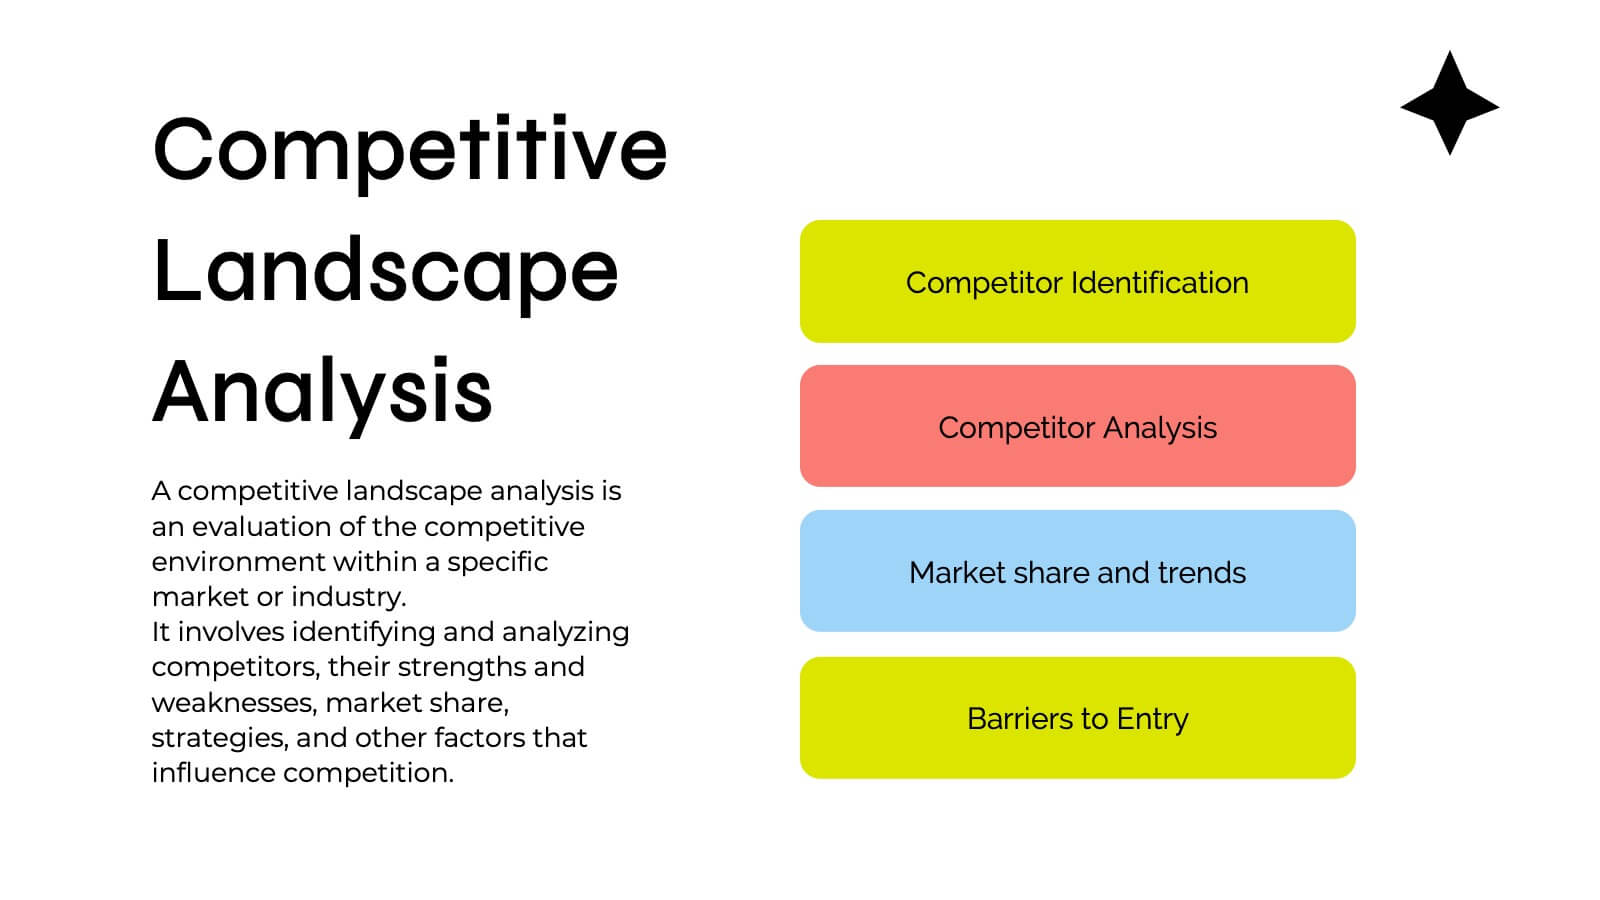
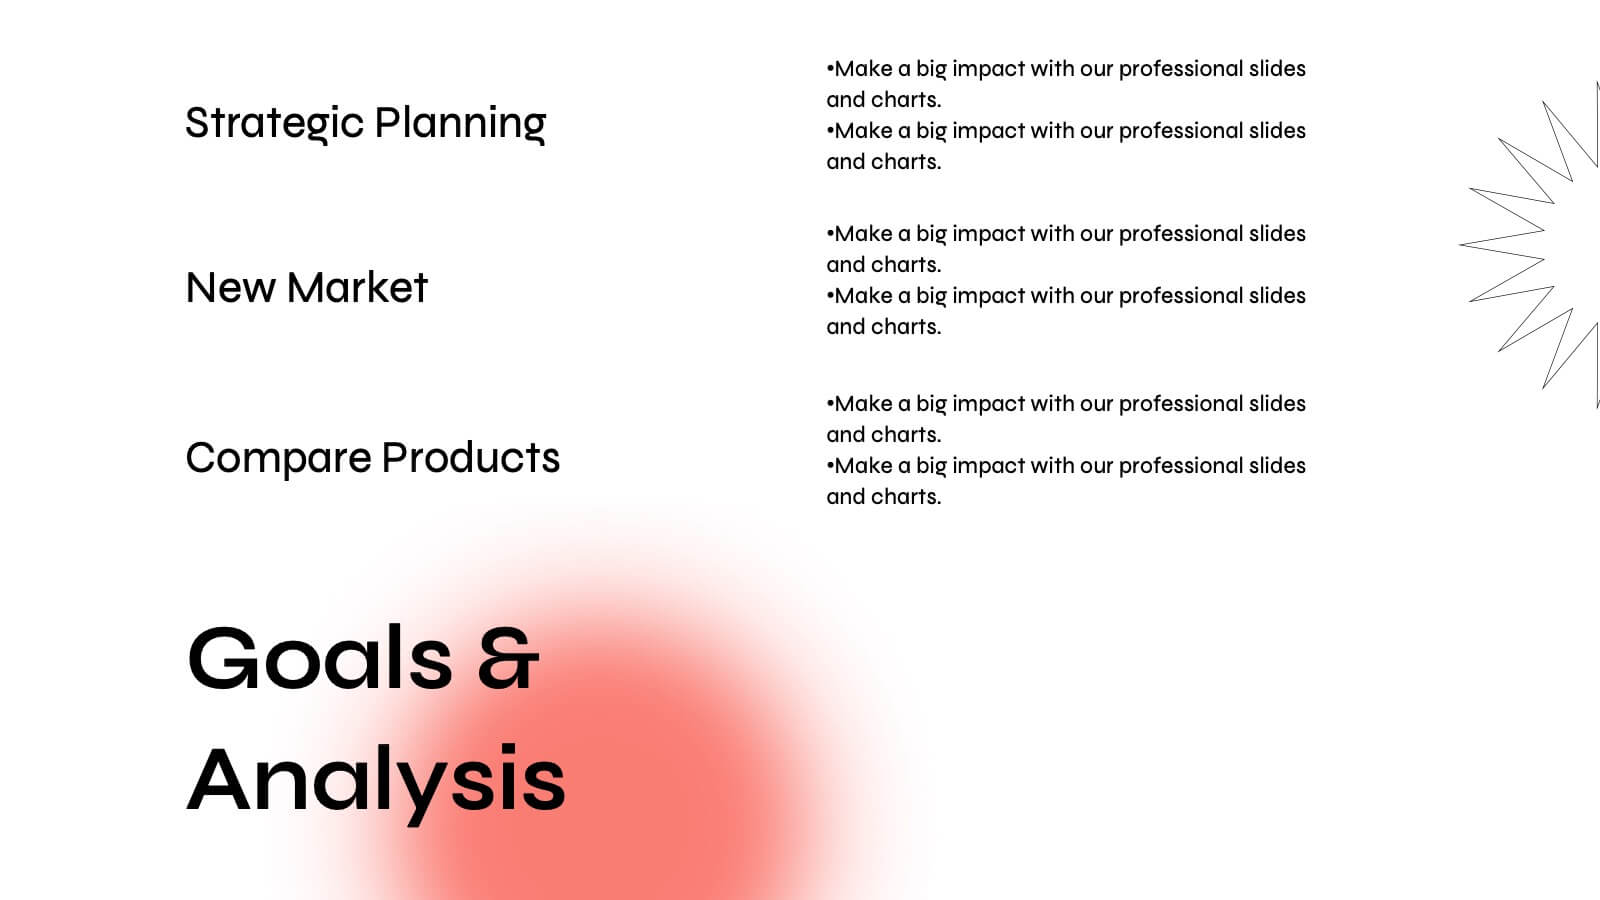
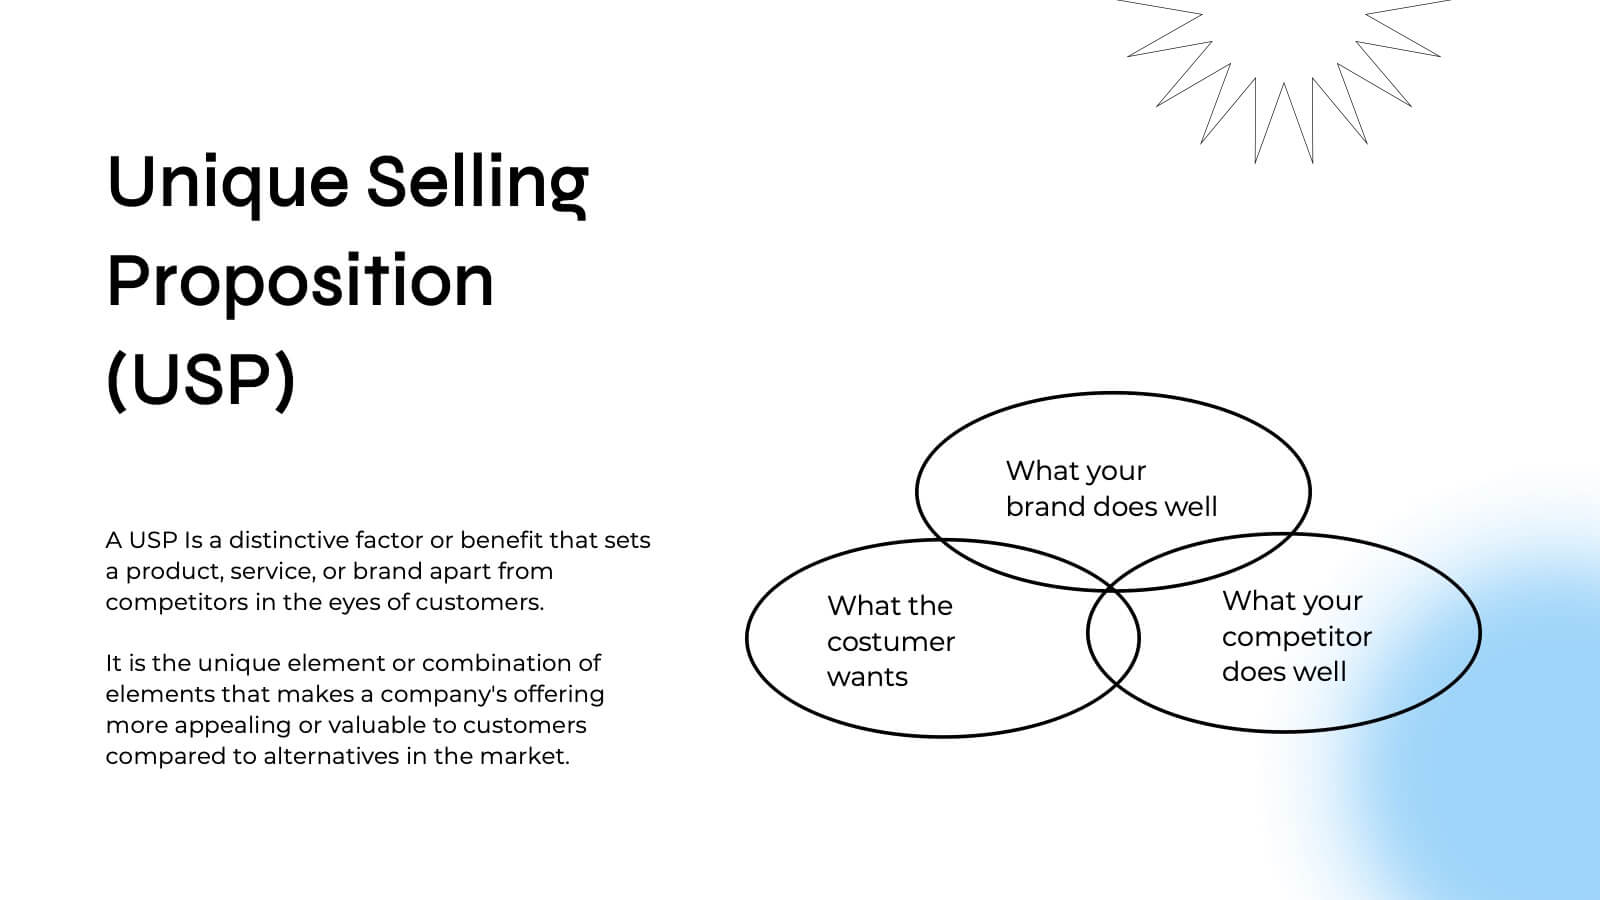
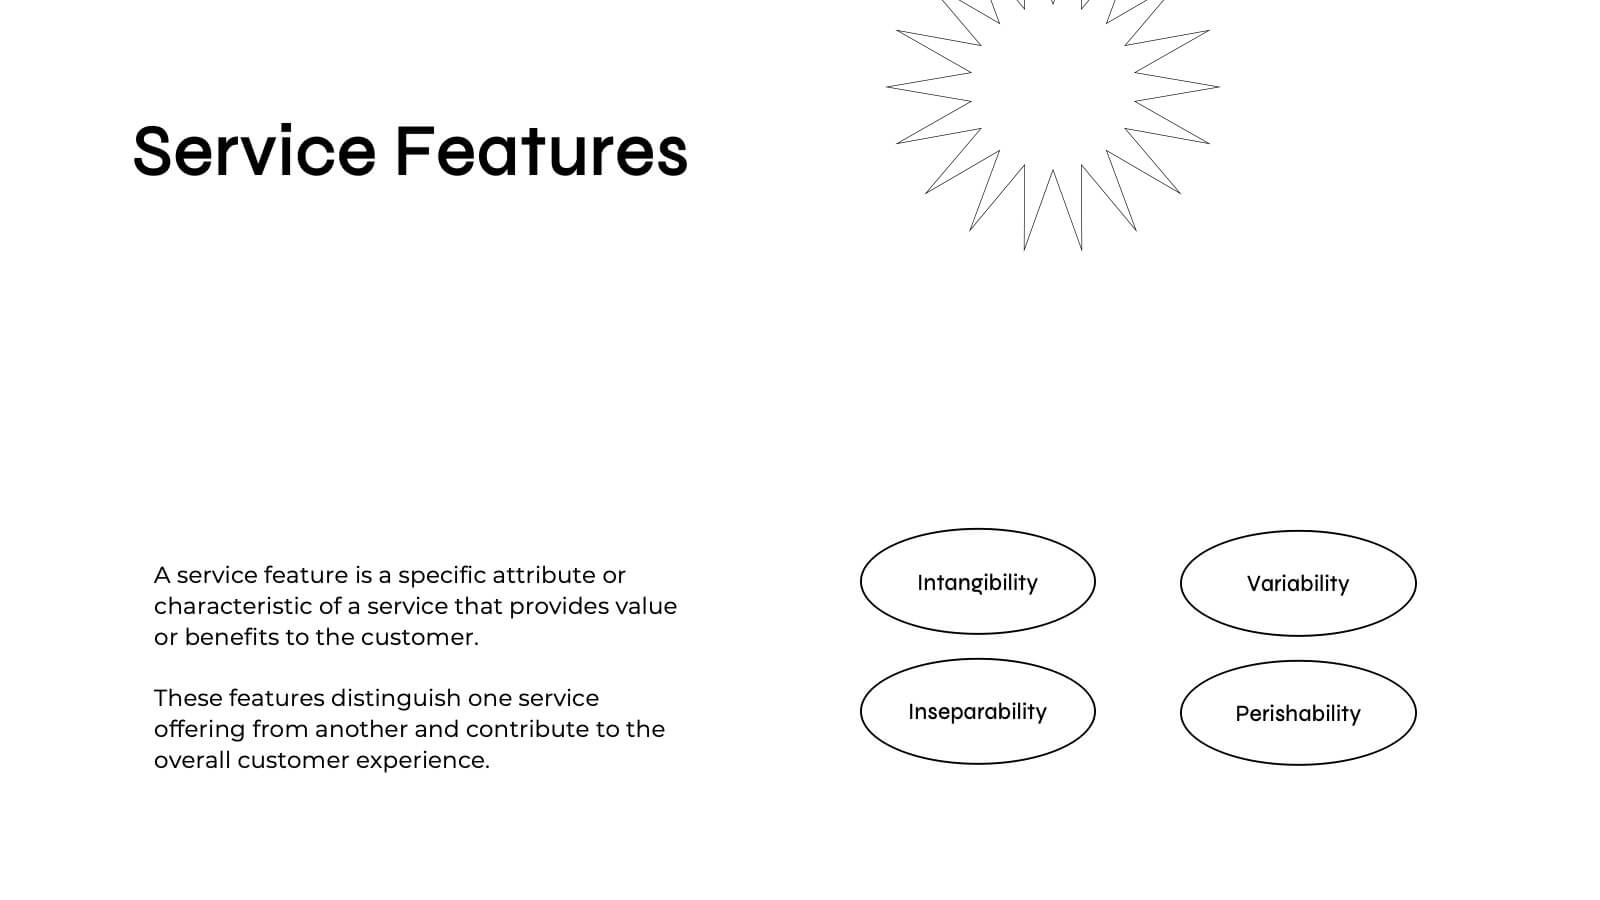
Corporate Planning and Analysis Presentation
Simplify strategic discussions with this Corporate Planning and Analysis Presentation. Featuring a circular 4-piece puzzle diagram, each section highlights a different business focus area using icons and color coding. Ideal for illustrating synergy between departments or initiatives. Fully customizable in PowerPoint, Keynote, and Google Slides.


10 slides
Africa Market Potential and Growth Map Presentation
Unlock business opportunities with the Africa Market Potential and Growth Map template, designed to showcase market analysis and growth trends across different African regions. It features a map highlighting specific countries coupled with adjustable data bars reflecting market potential percentages. This template is ideal for presentations focusing on market trends, investment opportunities, and growth forecasts in Africa.


3 slides
Professional Introduction Slide
Introduce team members with clarity and style using this profile-focused slide. Designed to highlight key stats, roles, and responsibilities, it’s perfect for internal presentations, onboarding, or proposals. Easily customizable in PowerPoint, Keynote, and Google Slides.


7 slides
Value Chain Business Infographic
The value chain is a concept used in business management to describe the full range of activities that businesses go through to bring a product or service from conception to delivery to customers. This infographic template is designed to showcase the various activities and processes that add value to your product or service, enlightening your audience about the holistic journey from start to finish. Compatible with Powerpoint, Keynote, and Google Slides. Present a visual representation of a value chain analysis, emphasizing the importance of evaluating each activity's contribution to the overall value.


5 slides
Artificial Intelligence Tools Infographics
Artificial Intelligence has advanced rapidly in recent years, leading to the development of various tools and technologies that leverage AI algorithms and techniques. These vertical infographics highlight various tools and technologies used in the field of AI. This template provides an engaging way to showcase different AI tools and their functionalities. This features a sleek and contemporary design that captures attention. The combination of vibrant colors, high-quality icons, and visuals adds a modern touch to the infographics. The template offers multiple slides that provide an overview of AI and its technologies.


22 slides
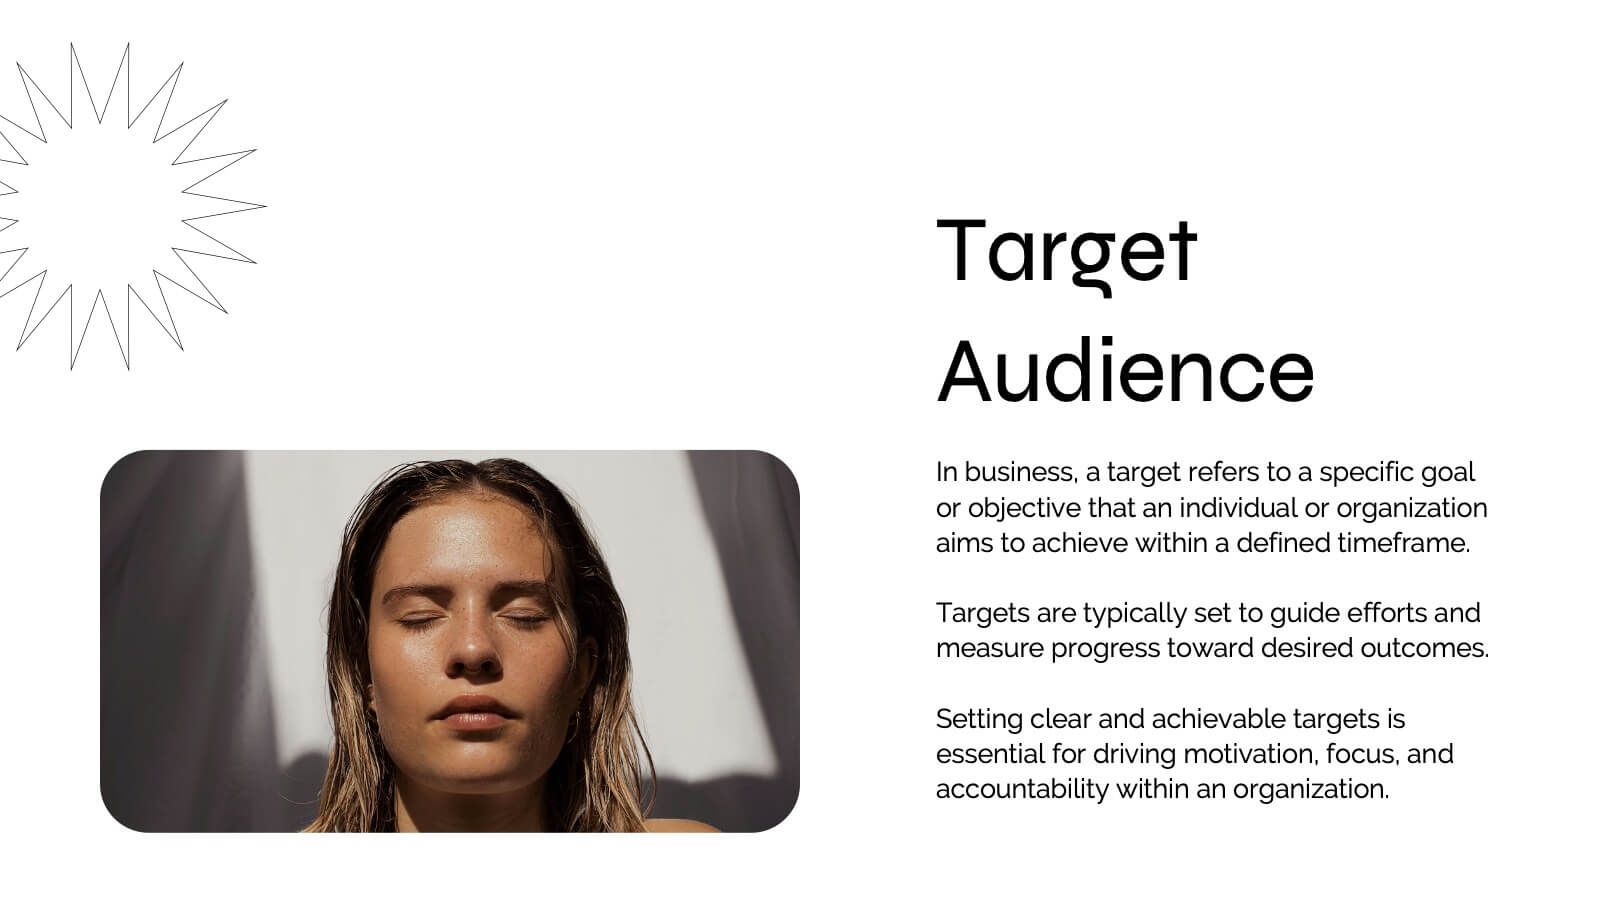
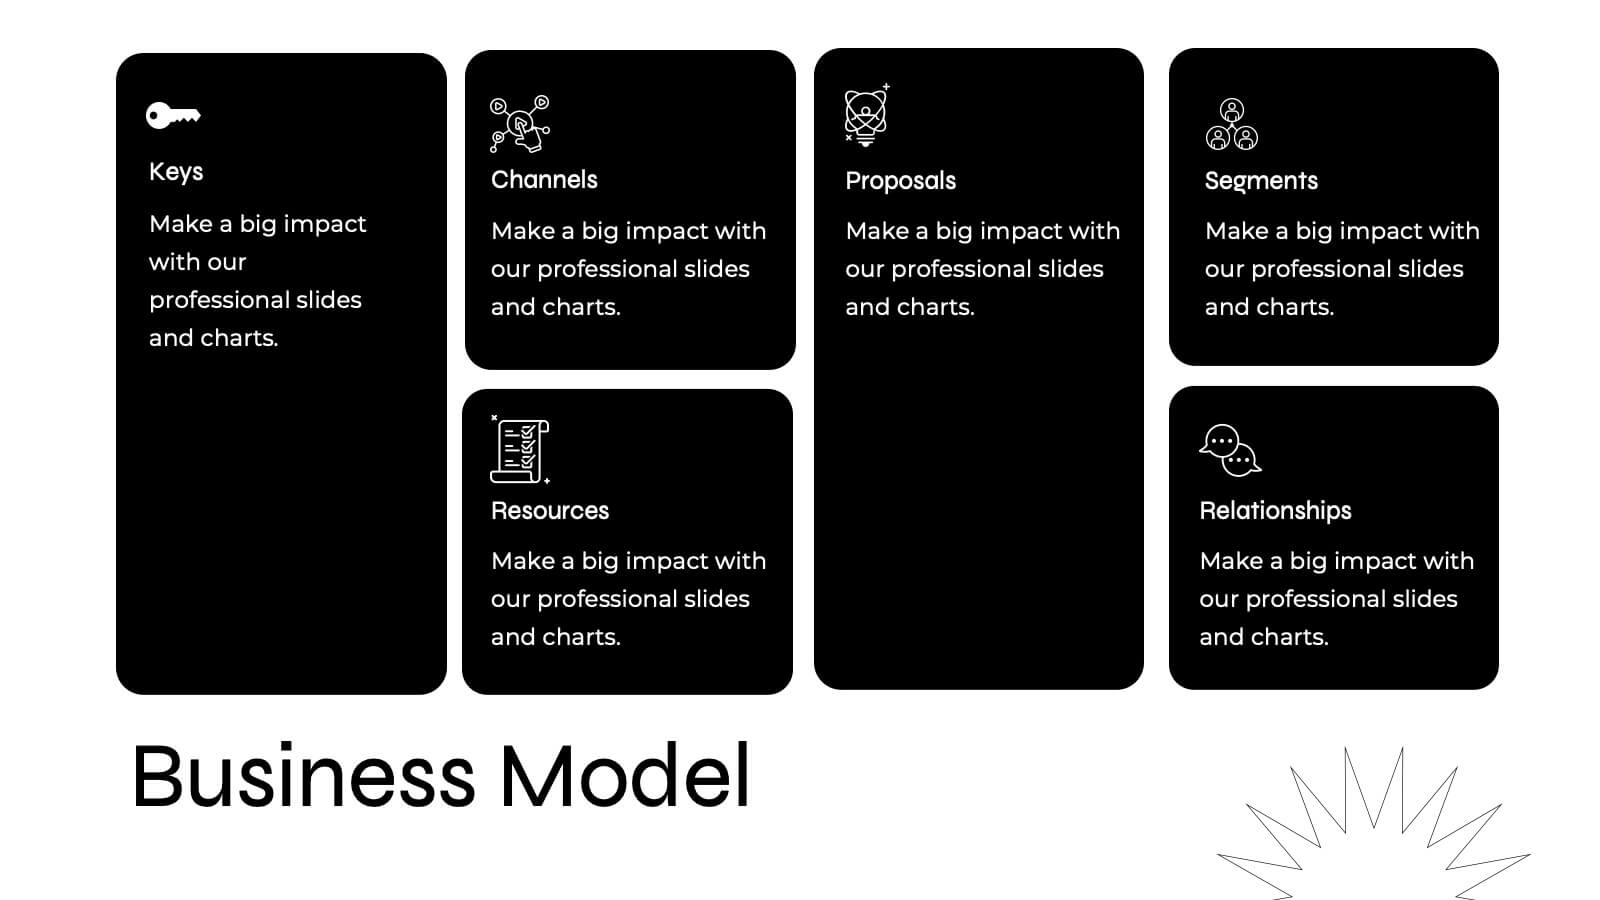
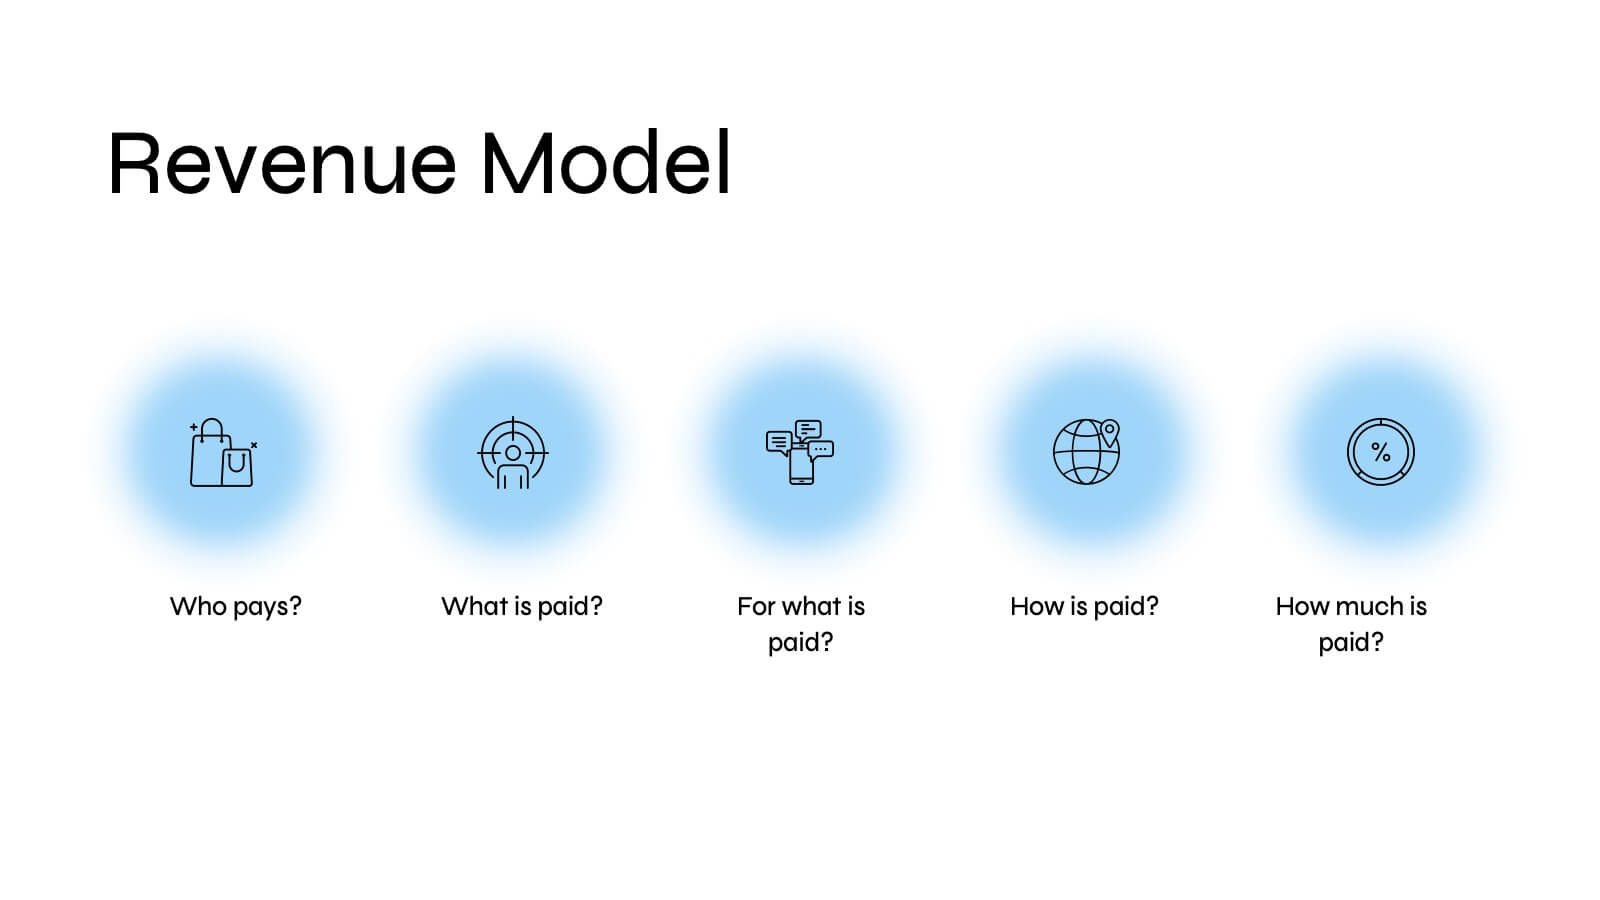
Quirinus Investor Pitch Presentation
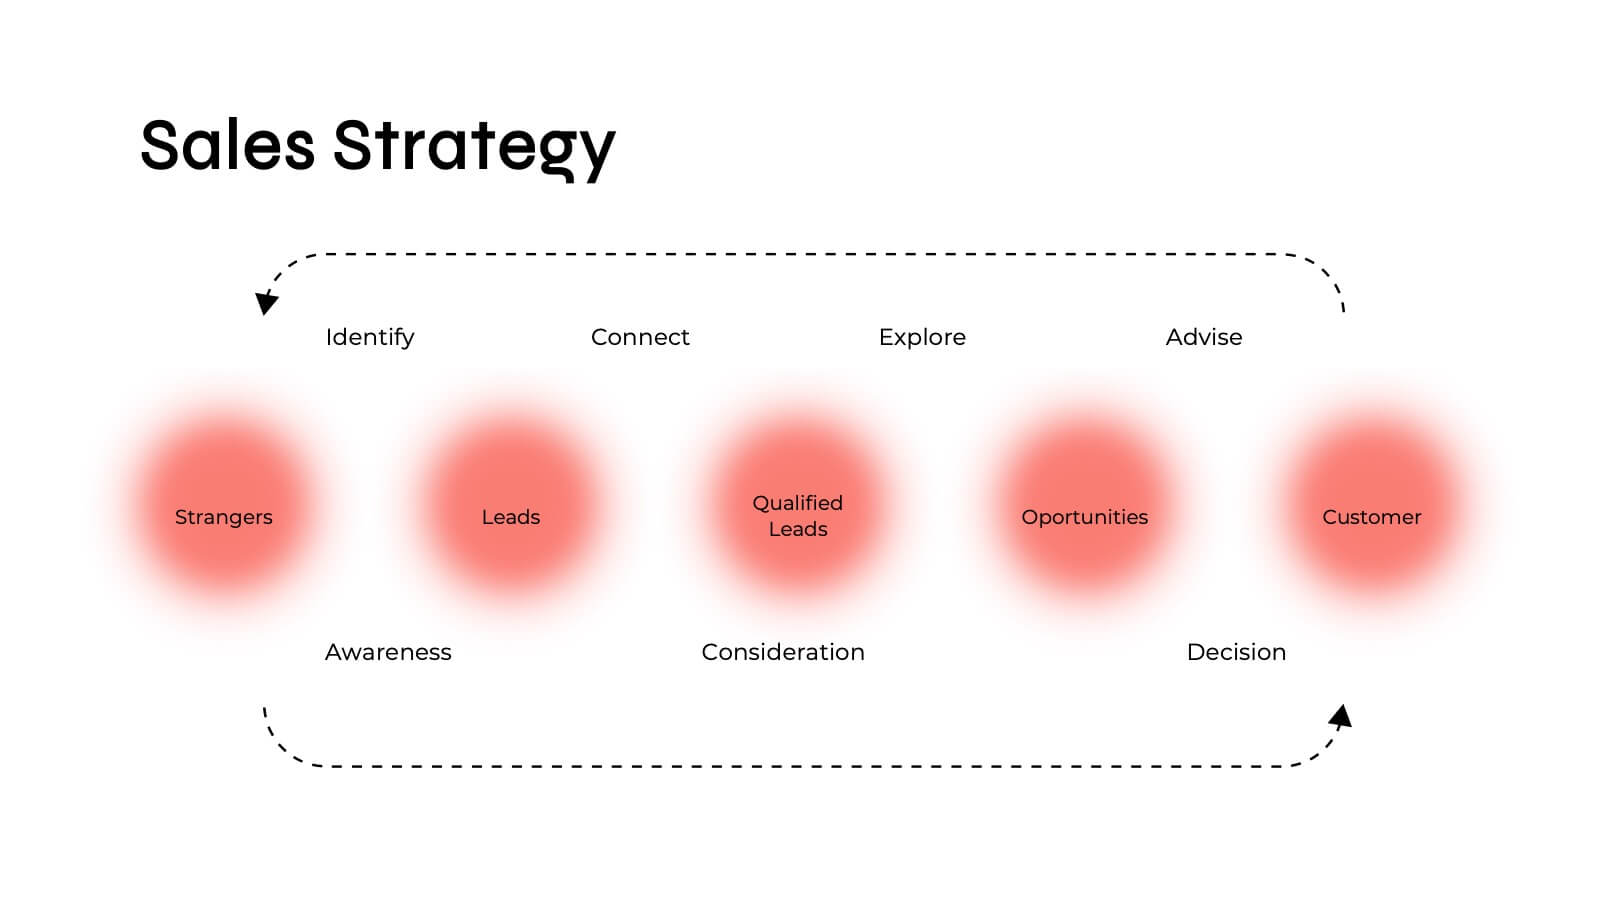
Ready to impress investors and stakeholders? This sleek and modern pitch deck template covers all the essentials, from problem statements and market opportunities to revenue models and growth projections. Each slide is designed to convey clear and compelling information for maximum impact. Fully compatible with PowerPoint, Keynote, and Google Slides, making it the perfect tool for your next product launch!


6 slides
Innovative Idea Pitching Guide Presentation
Present your ideas with clarity using the Innovative Idea Pitching Guide Presentation. This dynamic five-step circular flow design is perfect for showcasing pitch stages, idea development, or startup concepts. Each section includes icons and text blocks to clearly explain key points, keeping your message organized and impactful. Fully editable in Canva, PowerPoint, Keynote, and Google Slides.


8 slides
Project Stakeholder Mapping Presentation
Visualize the impact and influence of different stakeholder groups with our Project Stakeholder Mapping Presentation template. This tool offers a clear graphical representation to guide project managers in understanding stakeholder dynamics, ensuring effective engagement and strategic decision-making. Compatible with PowerPoint, Keynote, and Google Slides.


8 slides
Product Development and Innovation
Break down your product journey with this modern step-by-step infographic. Ideal for startups, product managers, and innovation teams, this slide illustrates four stages—perfect for visualizing design thinking, MVP rollouts, or feature planning. Easily editable in PowerPoint, Keynote, and Google Slides.


4 slides
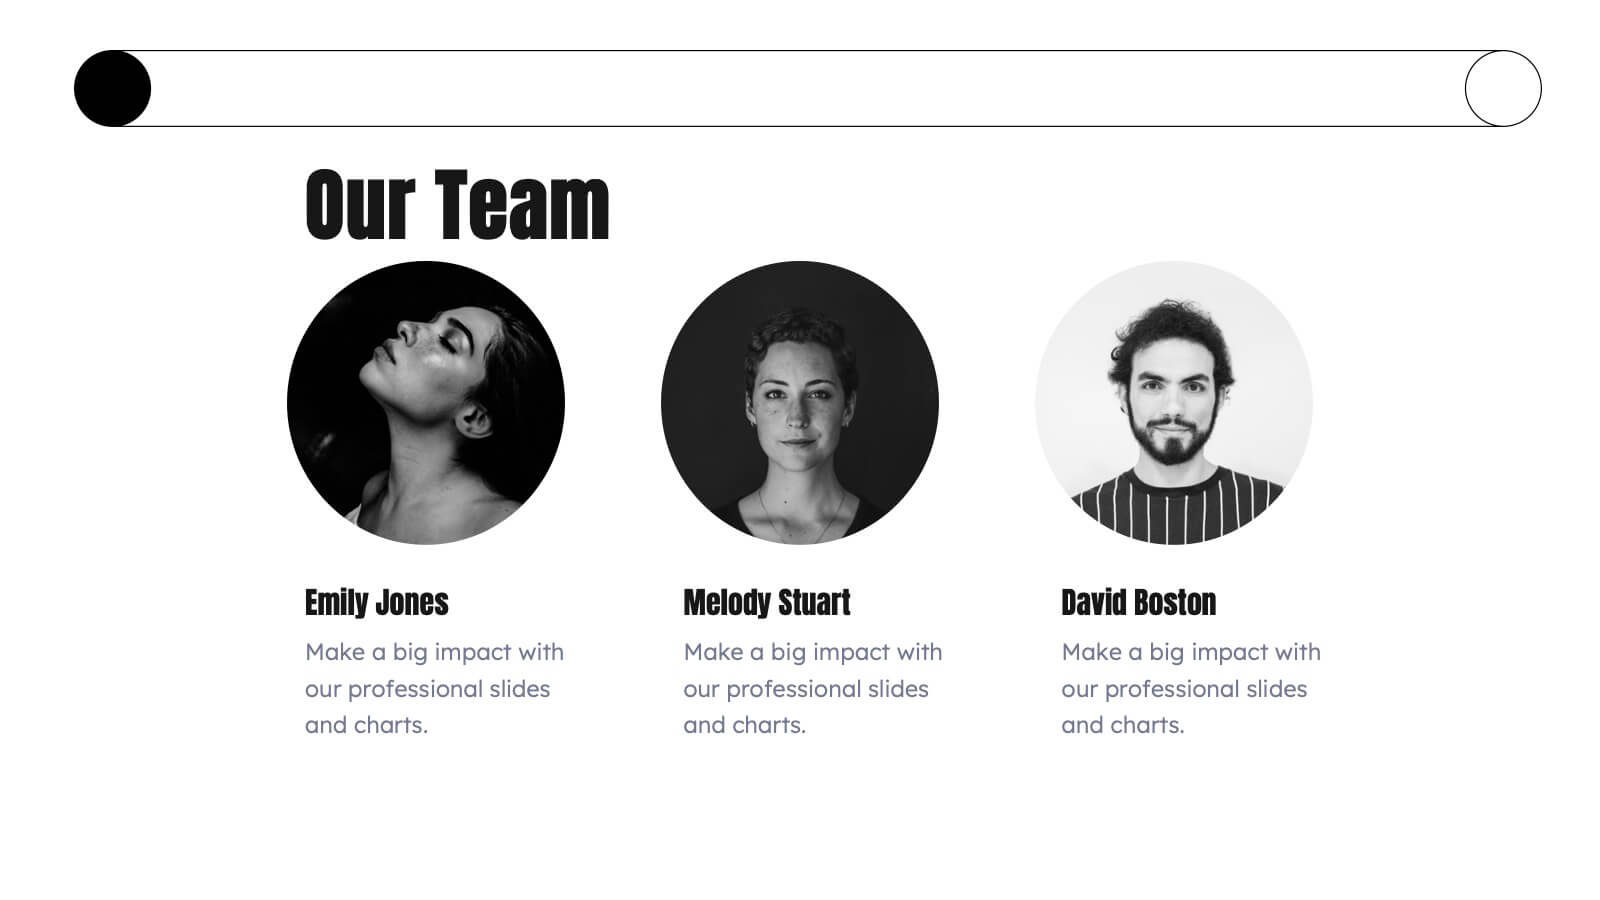
Professional Team Profiles and Roles Presentation
Showcase your team with impact using the Professional Team Profiles and Roles Presentation. Ideal for company introductions, this slide highlights key members with photo, name, title, and a brief role description. Clean, modern layout makes it easy to customize in PowerPoint, Canva, or Google Slides to match your brand.


8 slides
Travel Planning and Itinerary Overview Presentation
Pack your bags—this stylish template makes mapping adventures a breeze! Designed for trip overviews and itinerary planning, it includes world maps, must-see lists, weather forecasts, and schedules all in one layout. Perfect for travel agencies, bloggers, or wanderlust planners. Fully compatible with PowerPoint, Keynote, and Google Slides for easy customization.

22 slides
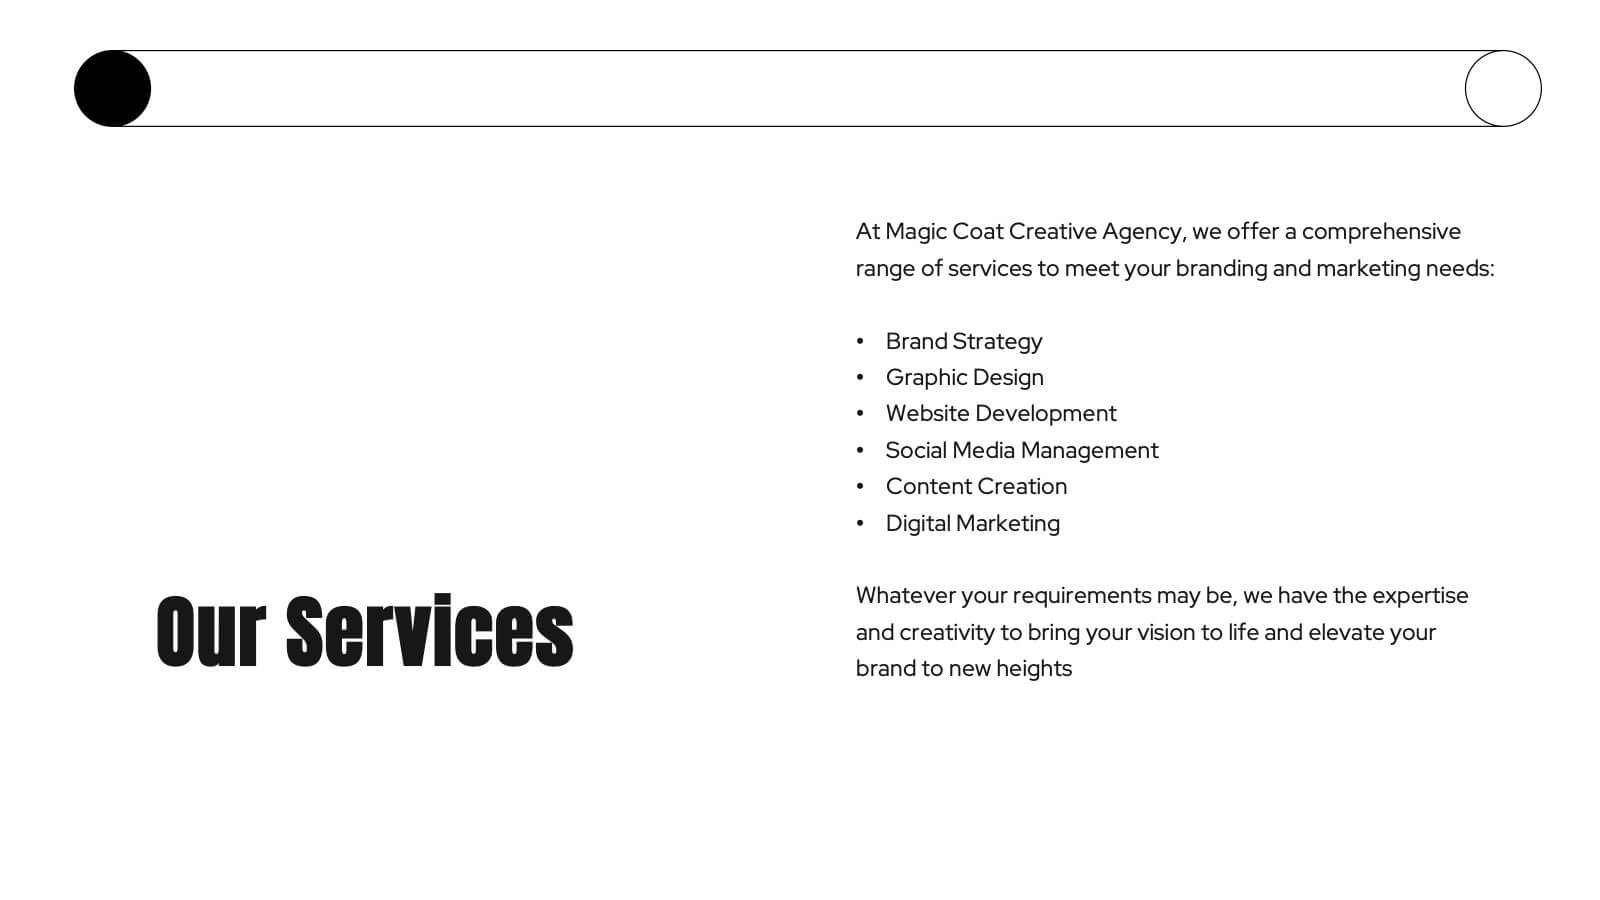
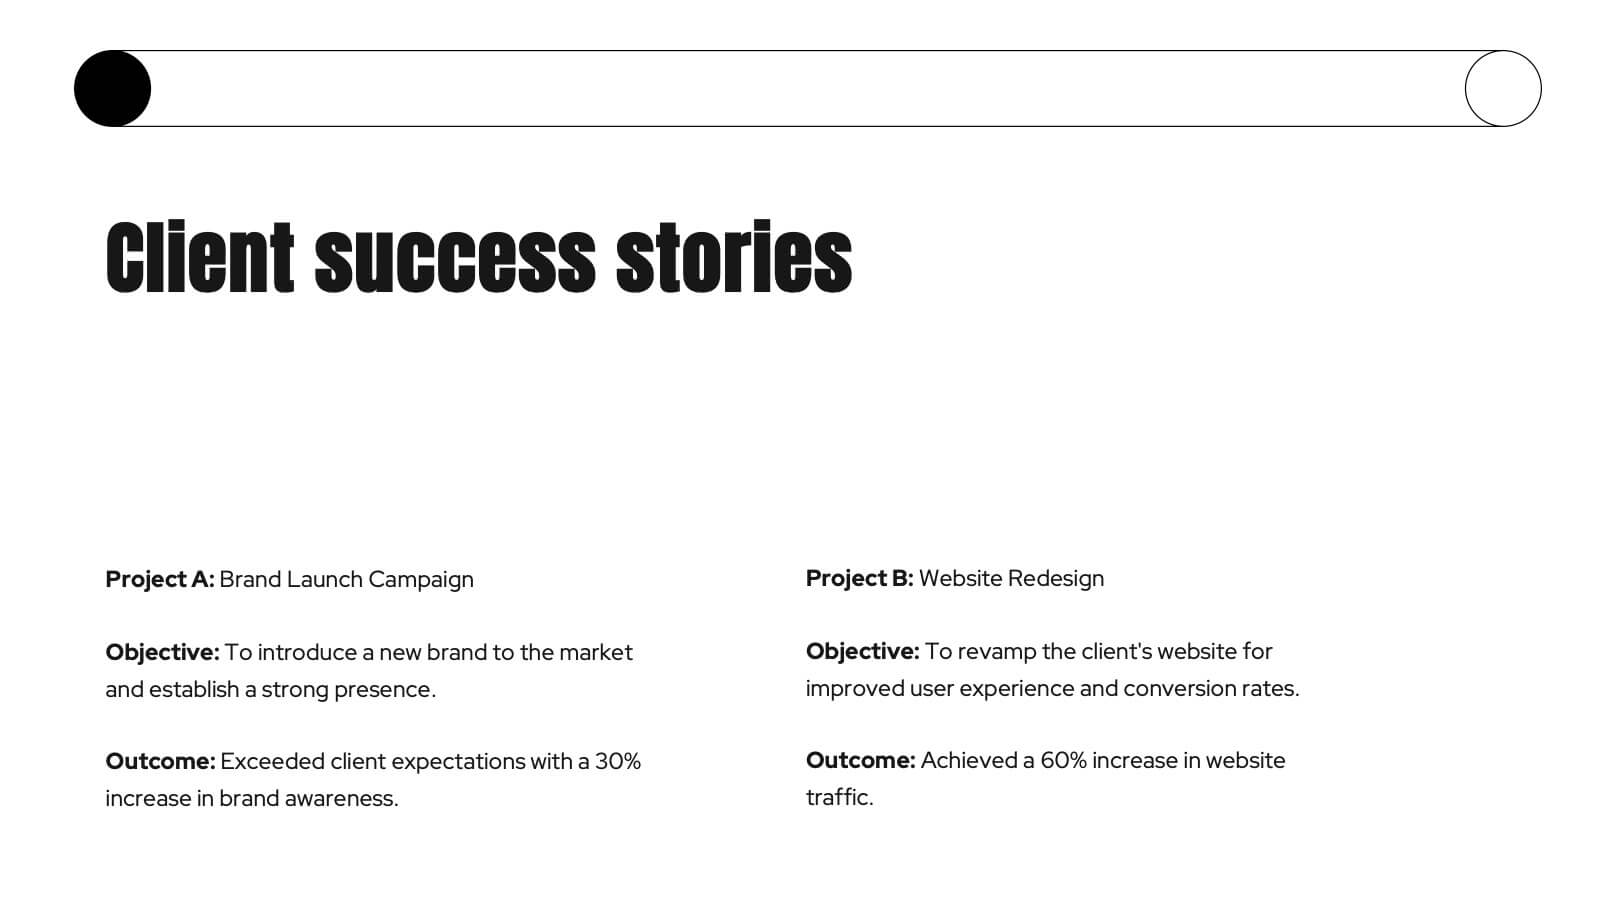
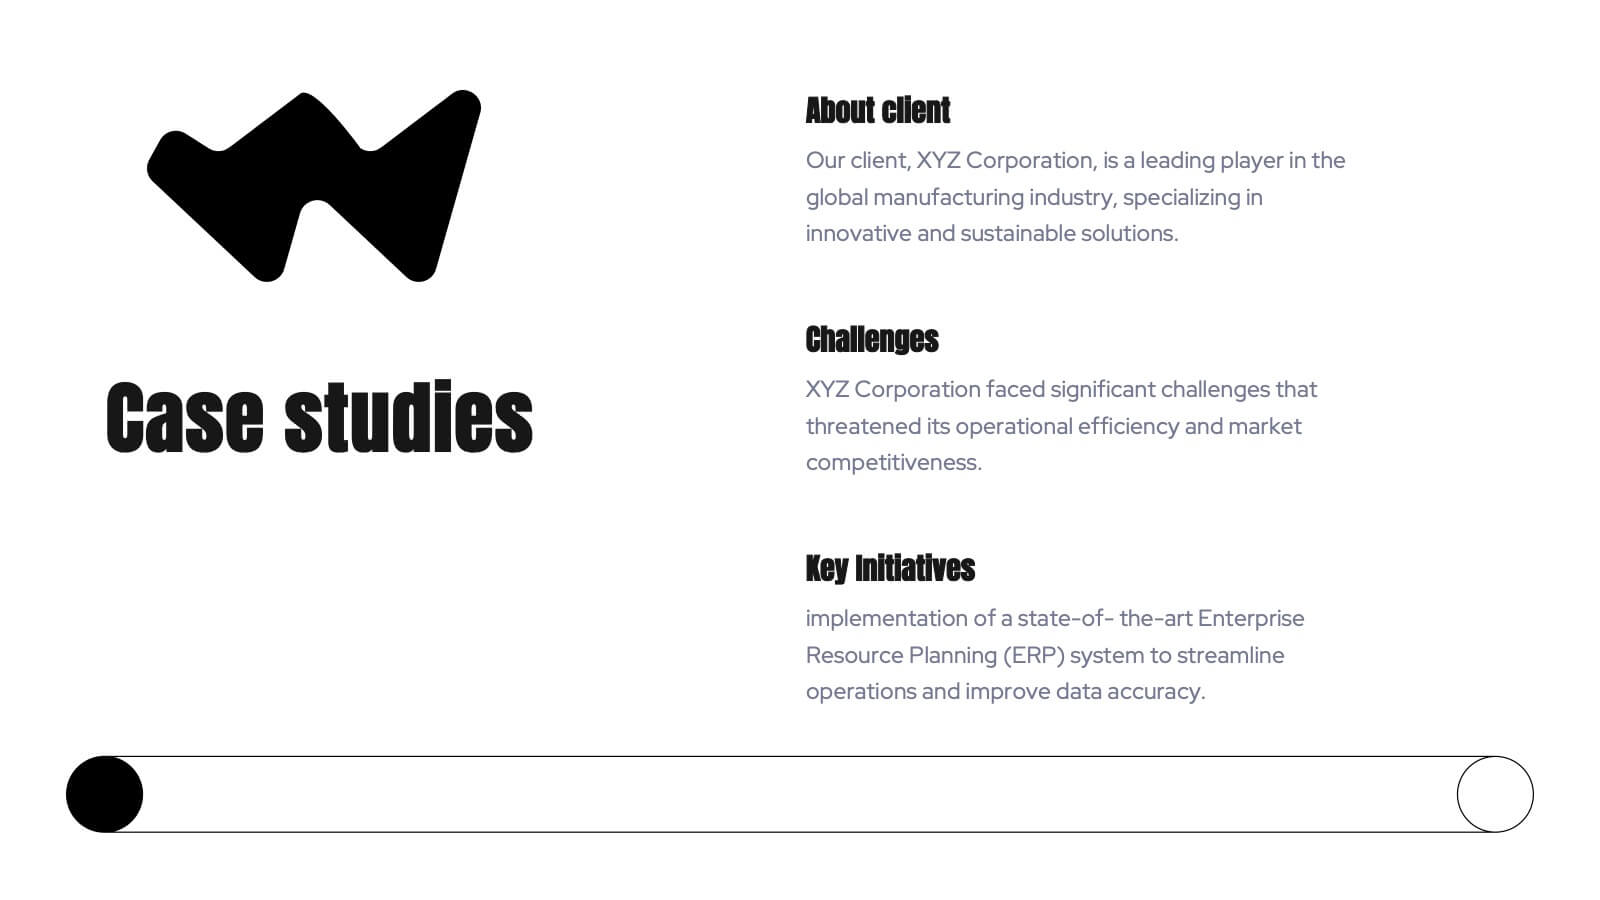
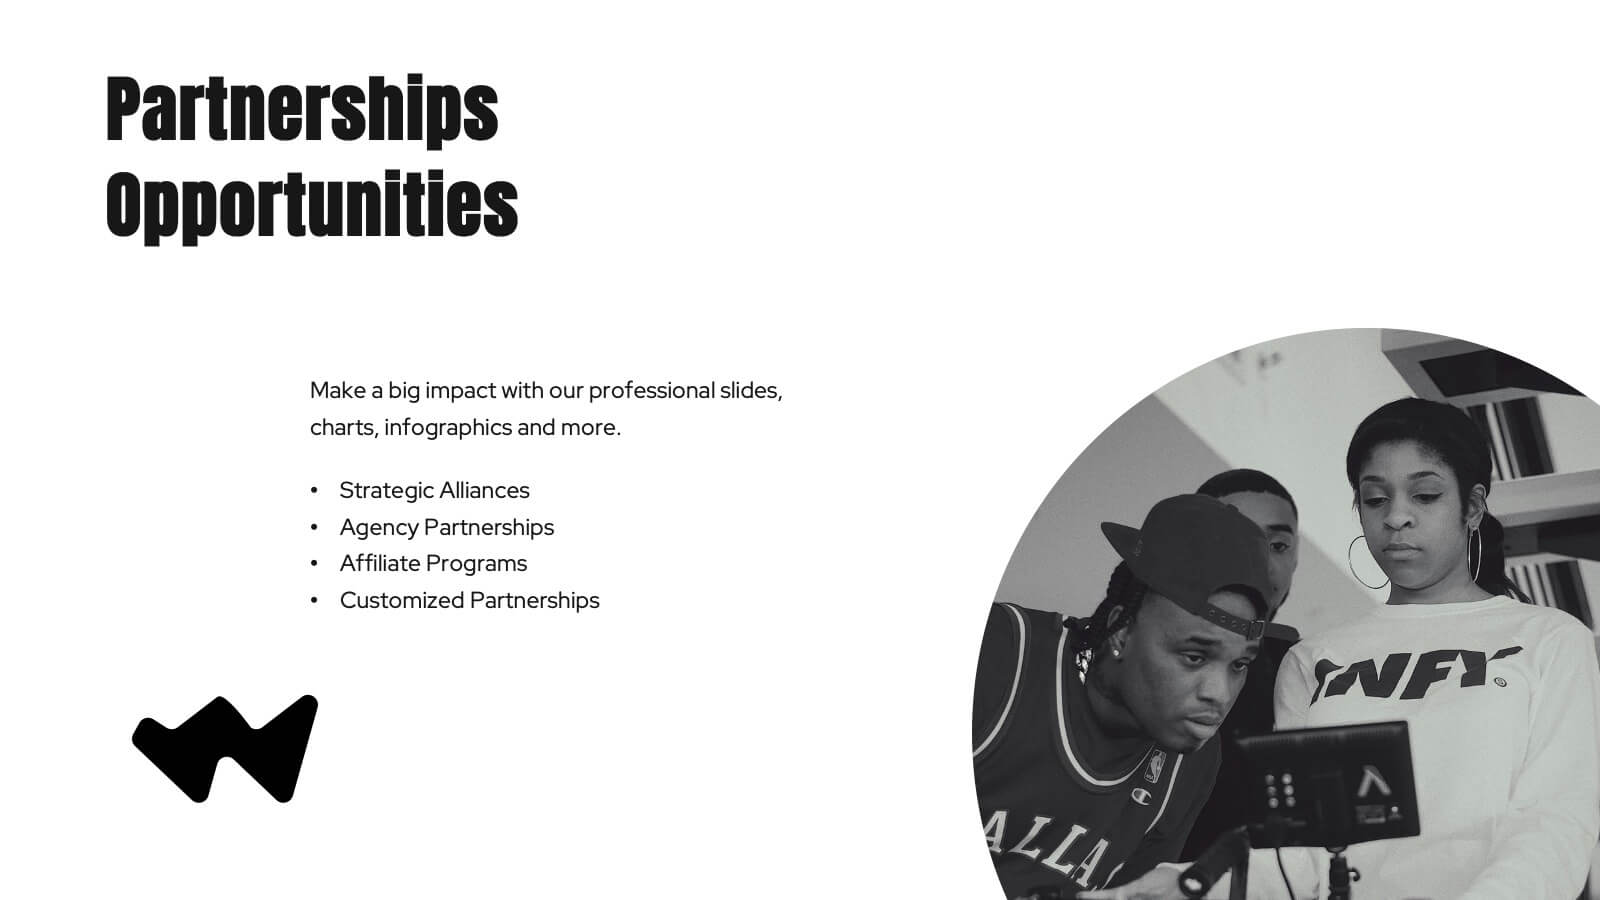
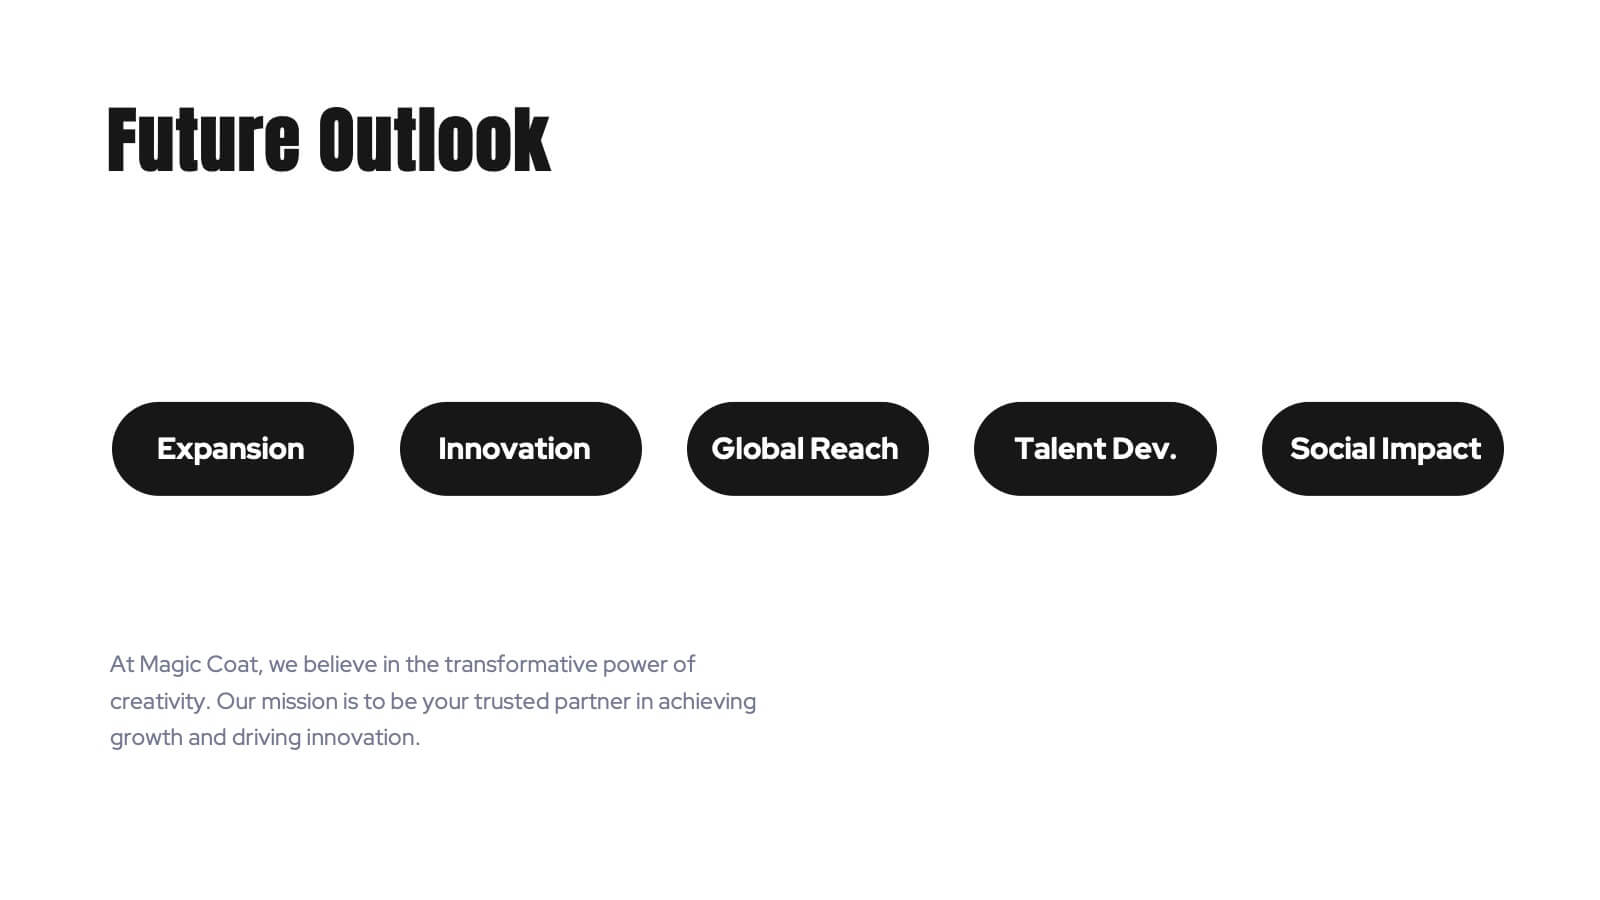
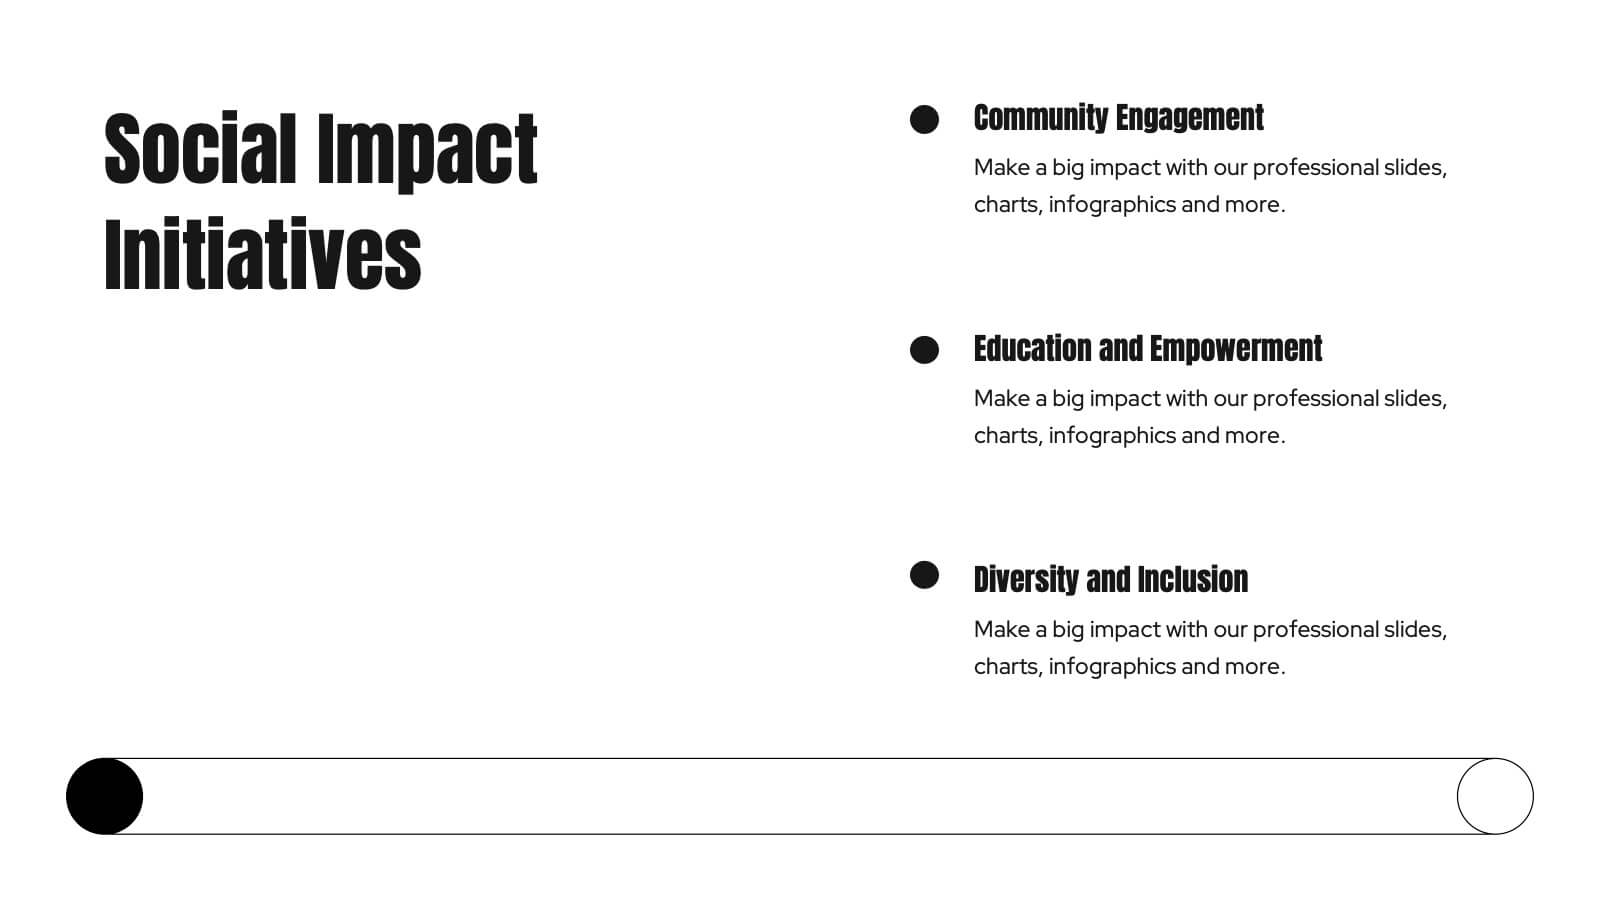
Kraken Agency Portfolio Presentation
This agency portfolio template showcases your agency's work and expertise with a sleek, modern design. It features slides for client success stories, case studies, services, market analysis, and creative process. Perfect for demonstrating your team’s skills and approach. Compatible with PowerPoint, Keynote, and Google Slides for easy customization and presentation.


5 slides
Regional Development in Oceania Map Presentation
The Regional Development in Oceania Map template provides a comprehensive visualization of growth and development metrics across various regions in Oceania. This template is designed to aid in presenting demographic data, economic indicators, or development status in a clear, easily understandable format. It's suitable for reports, presentations, and educational materials. Compatible with PowerPoint, Keynote, and Google Slides.