


Features
- 5 Unique slides
- Fully editable and easy to edit in Microsoft Powerpoint, Keynote and Google Slides
- 16:9 widescreen layout
- Clean and professional designs
- Export to JPG, PDF or send by email


Do you have any questions?
Recommend


6 slides
Organizational Objectives and Key Results Presentation
Showcase your strategic goals and measurable outcomes with the Organizational Objectives and Key Results template. Designed with a sleek radial key layout, it’s ideal for mapping priorities and tracking progress. Fully editable in Canva, PowerPoint, and Google Slides, allowing easy customization of colors, icons, and text to fit your objectives.


23 slides
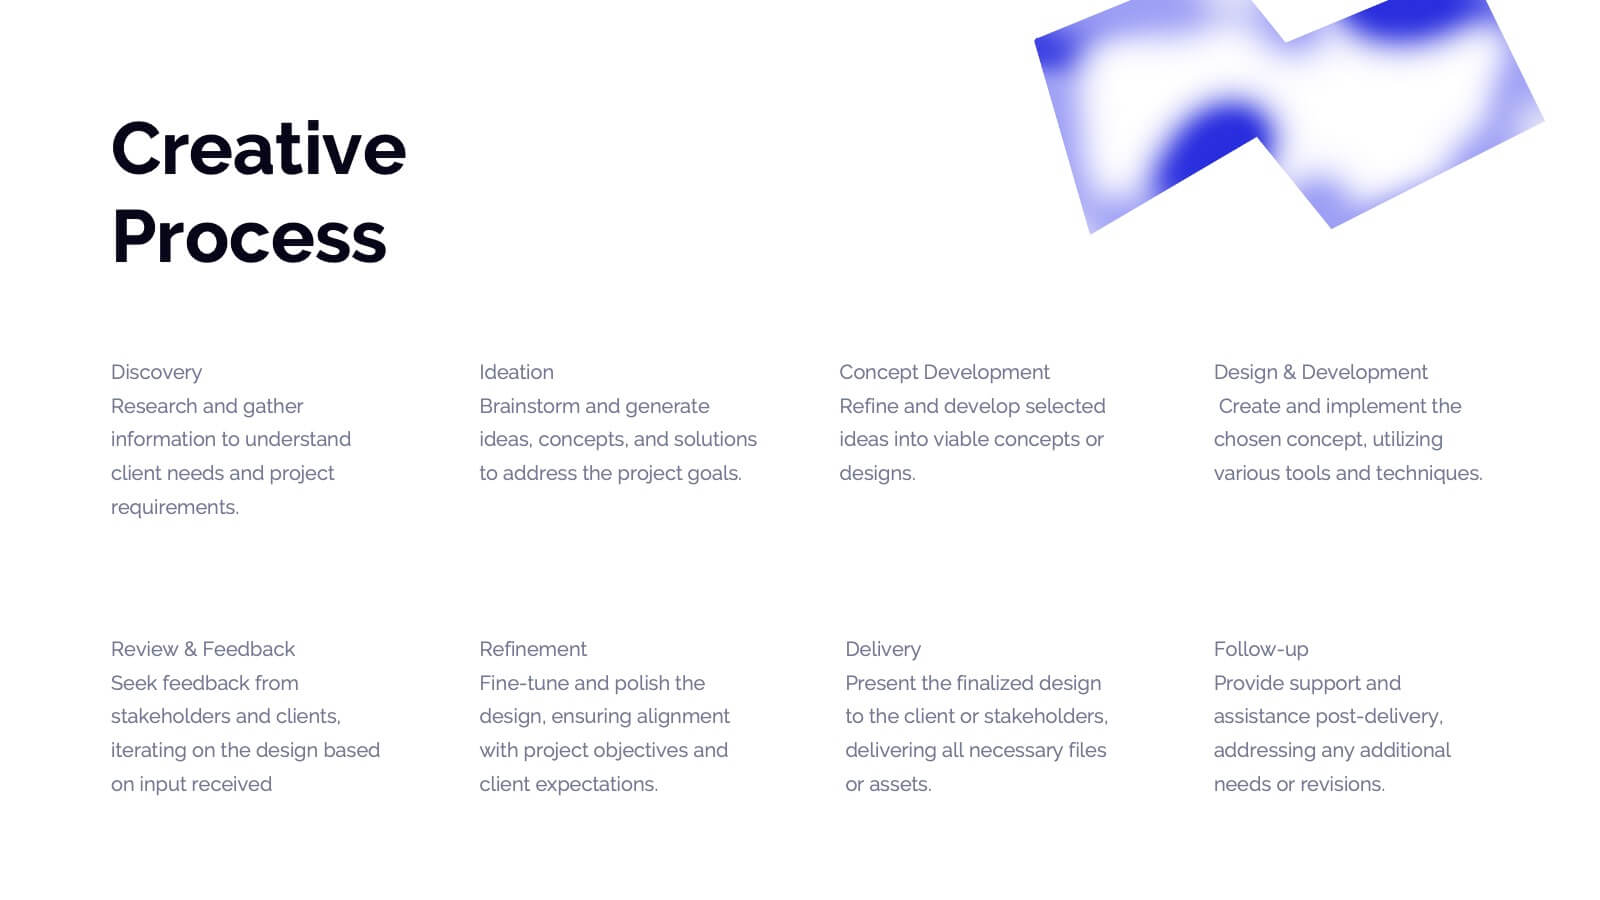
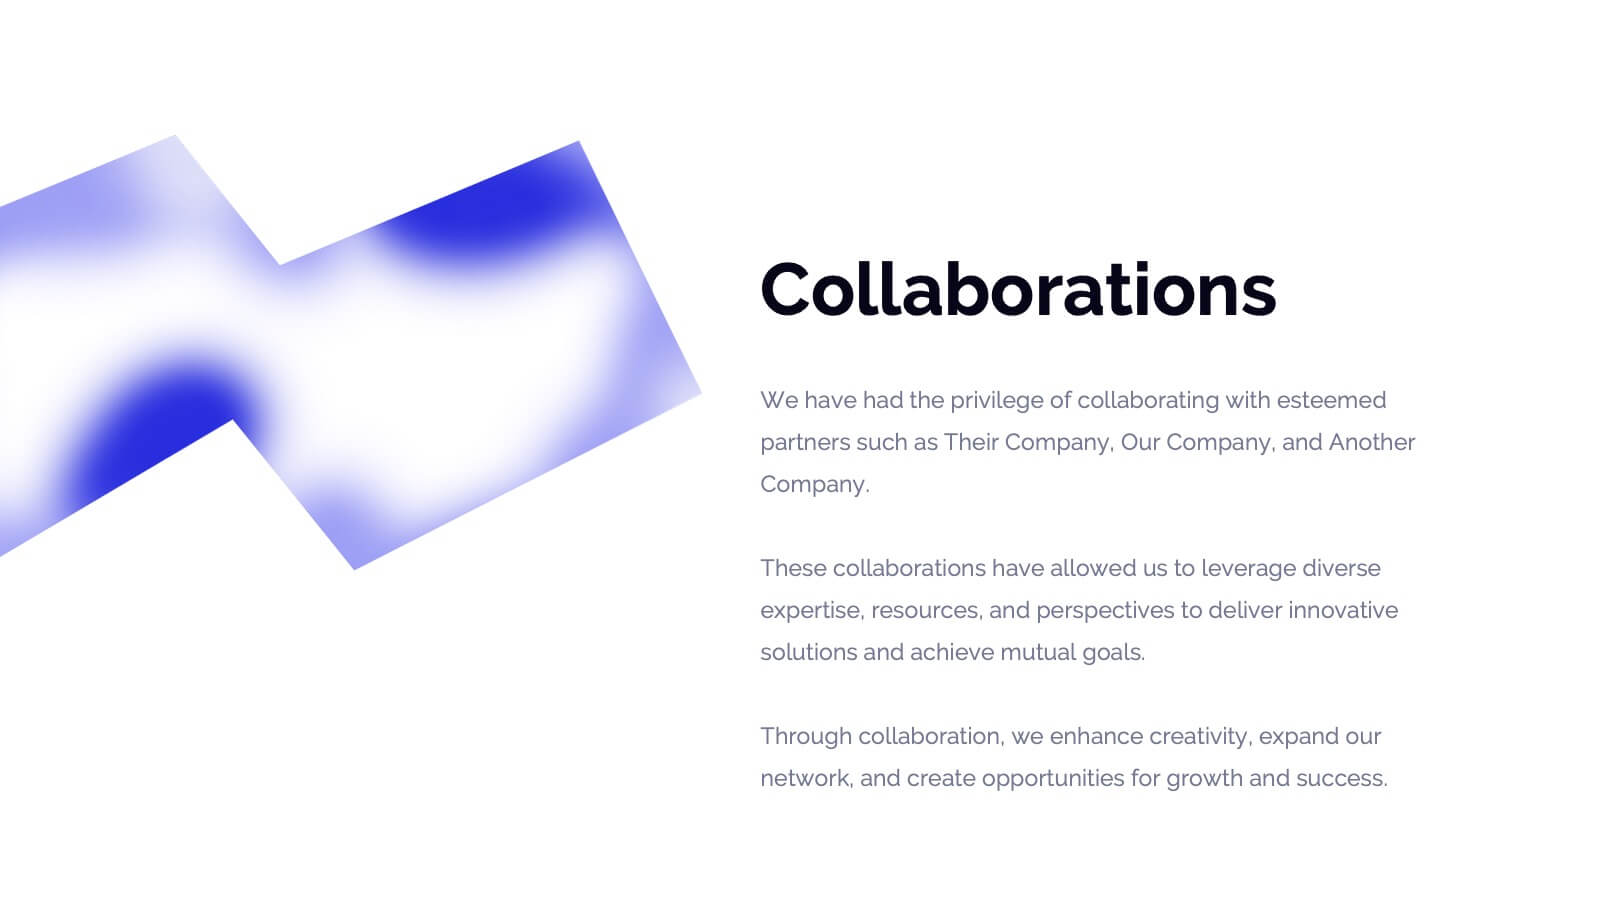
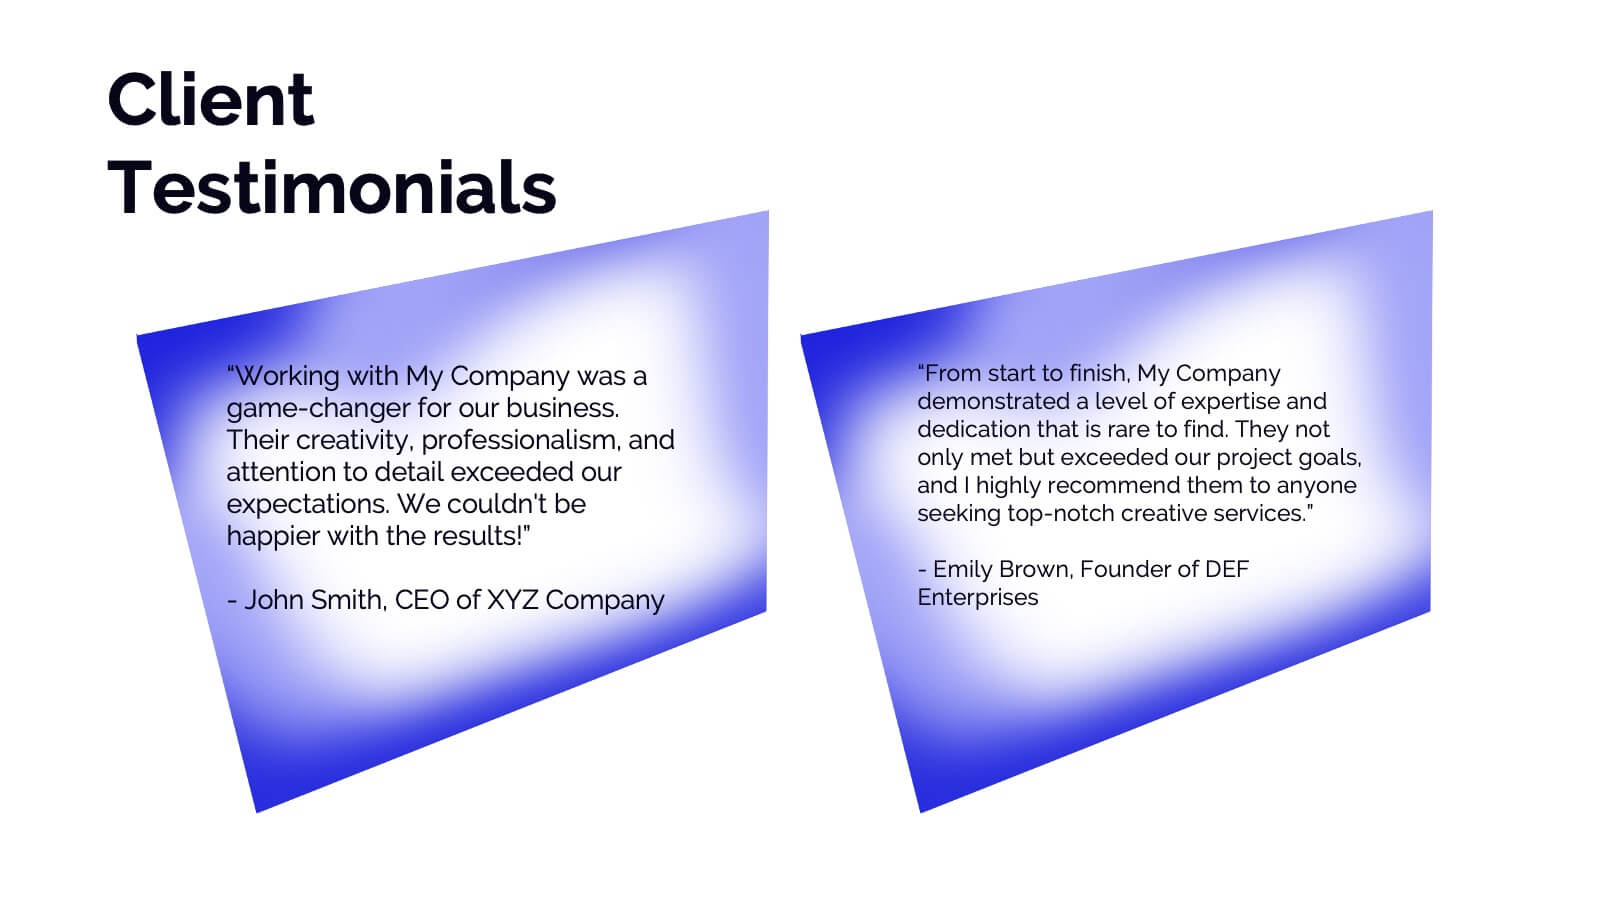
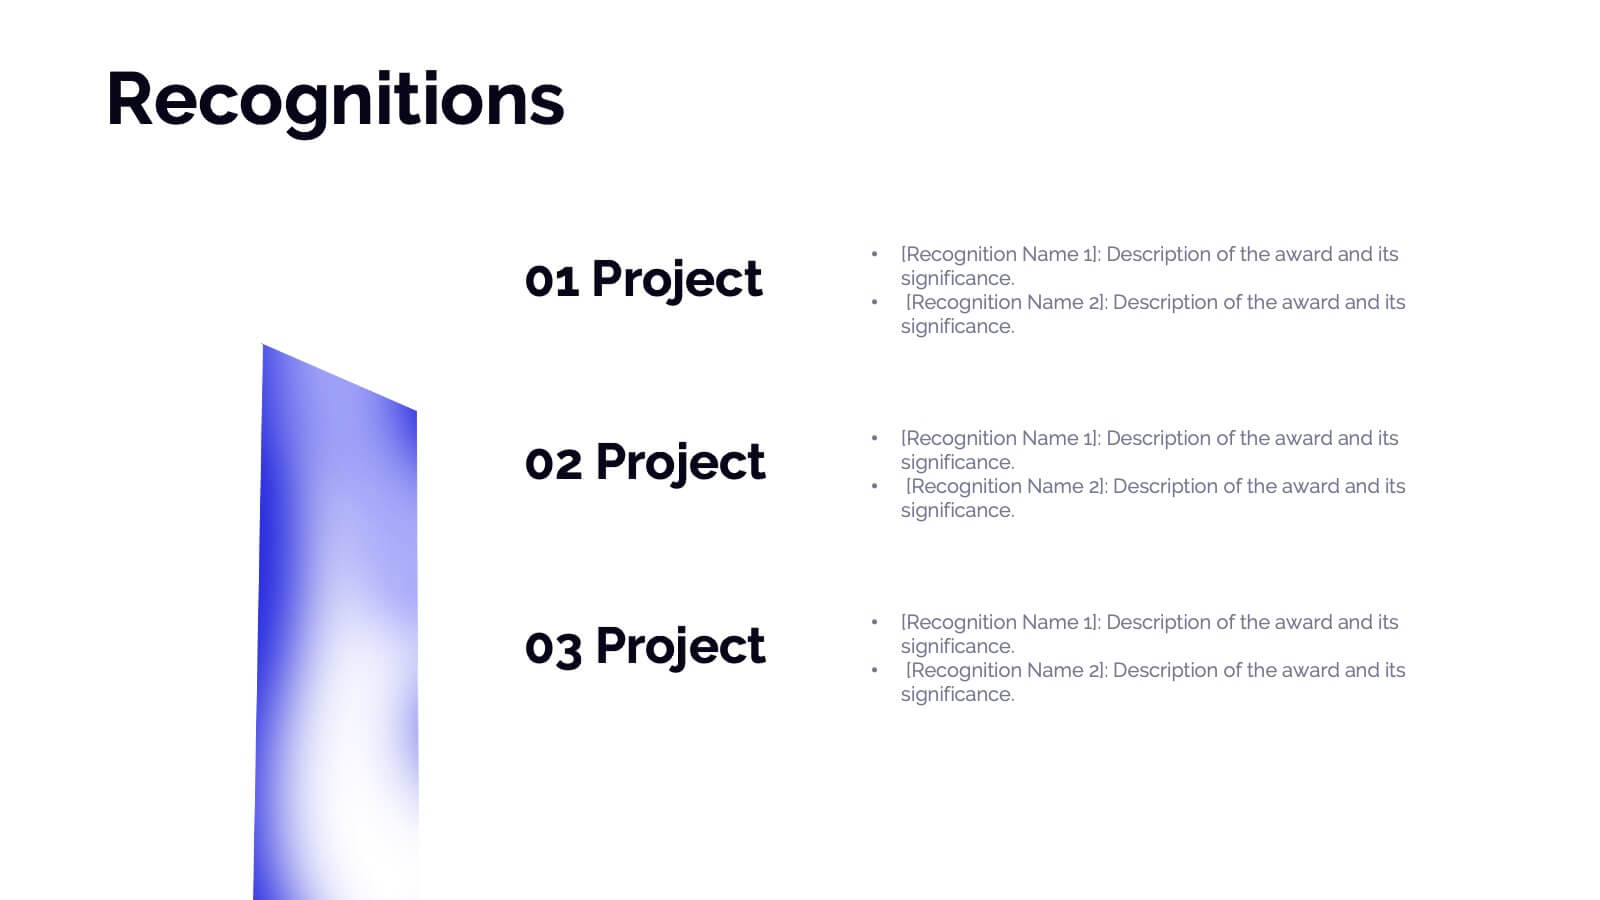
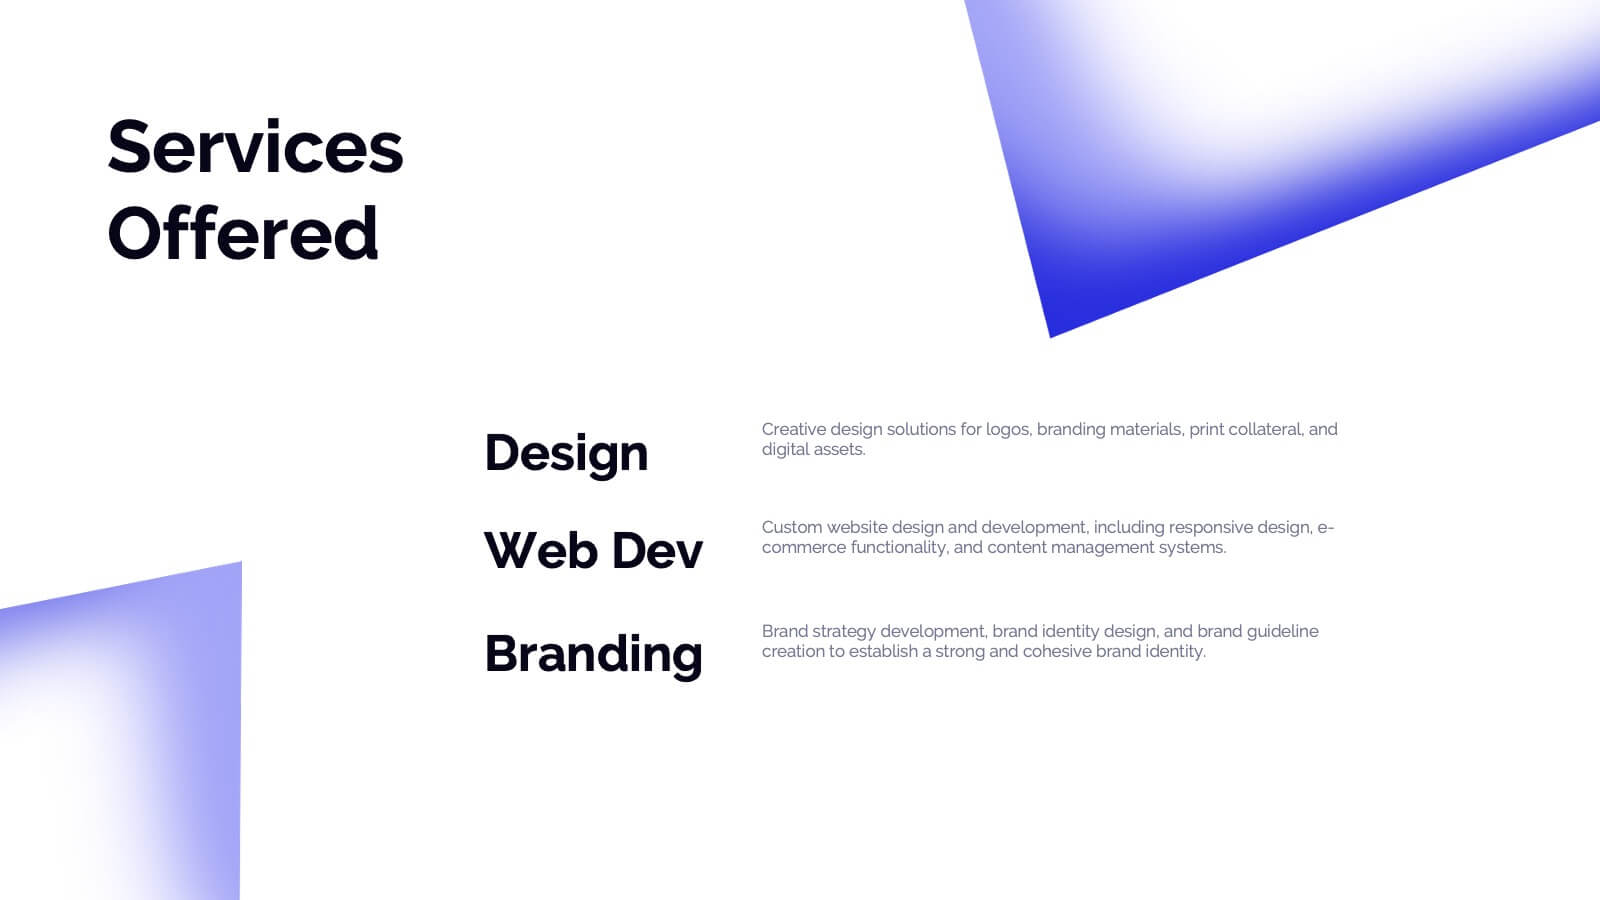
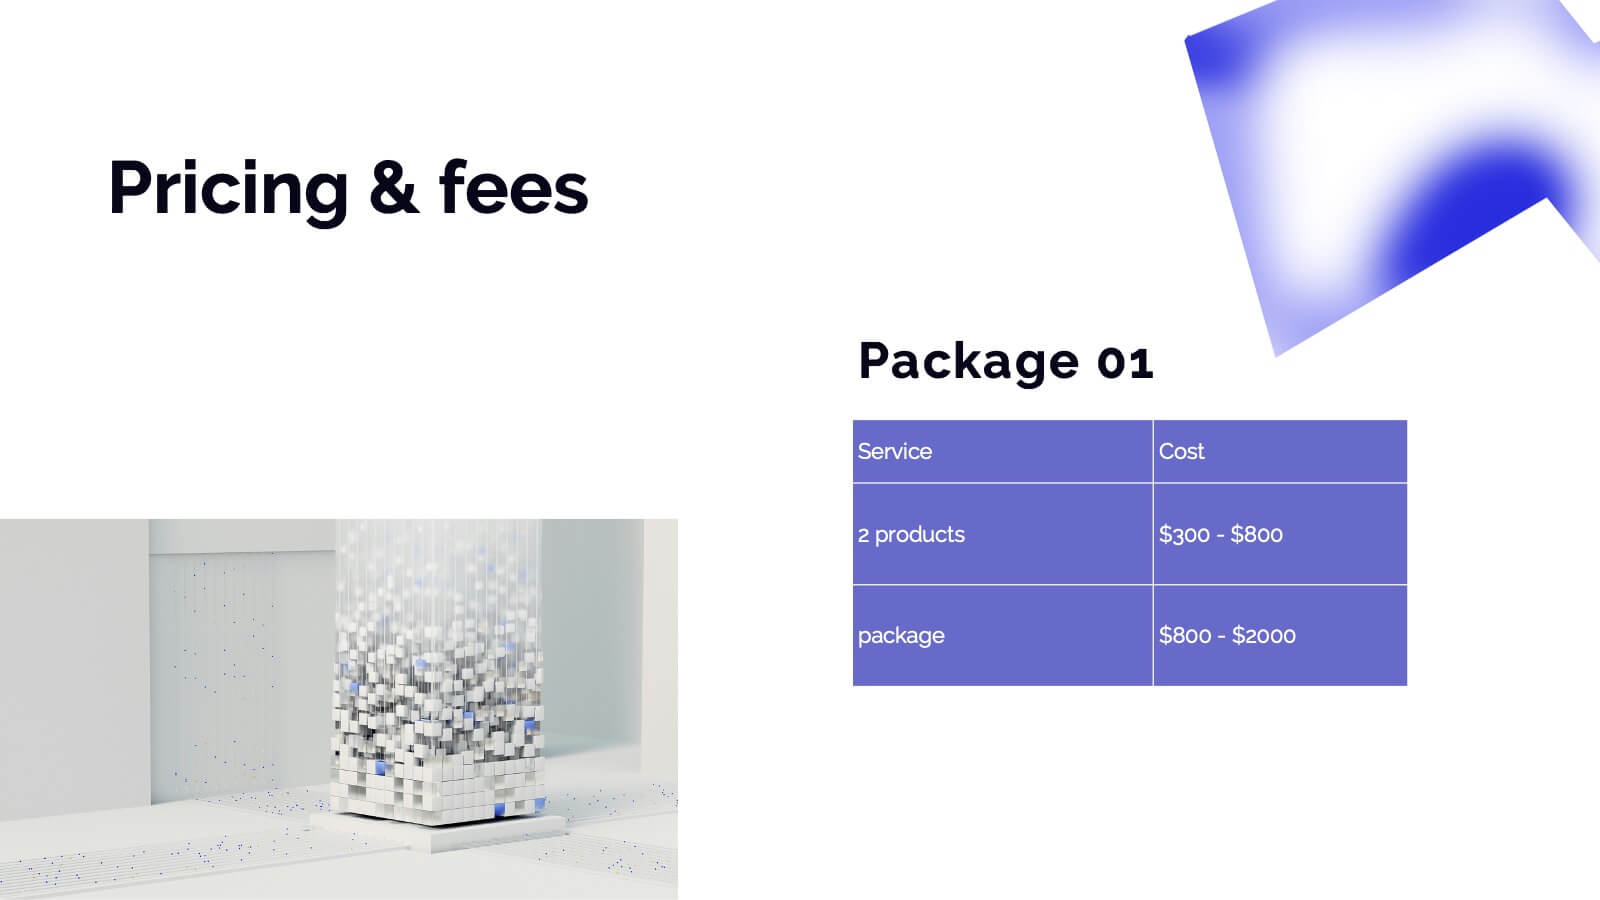
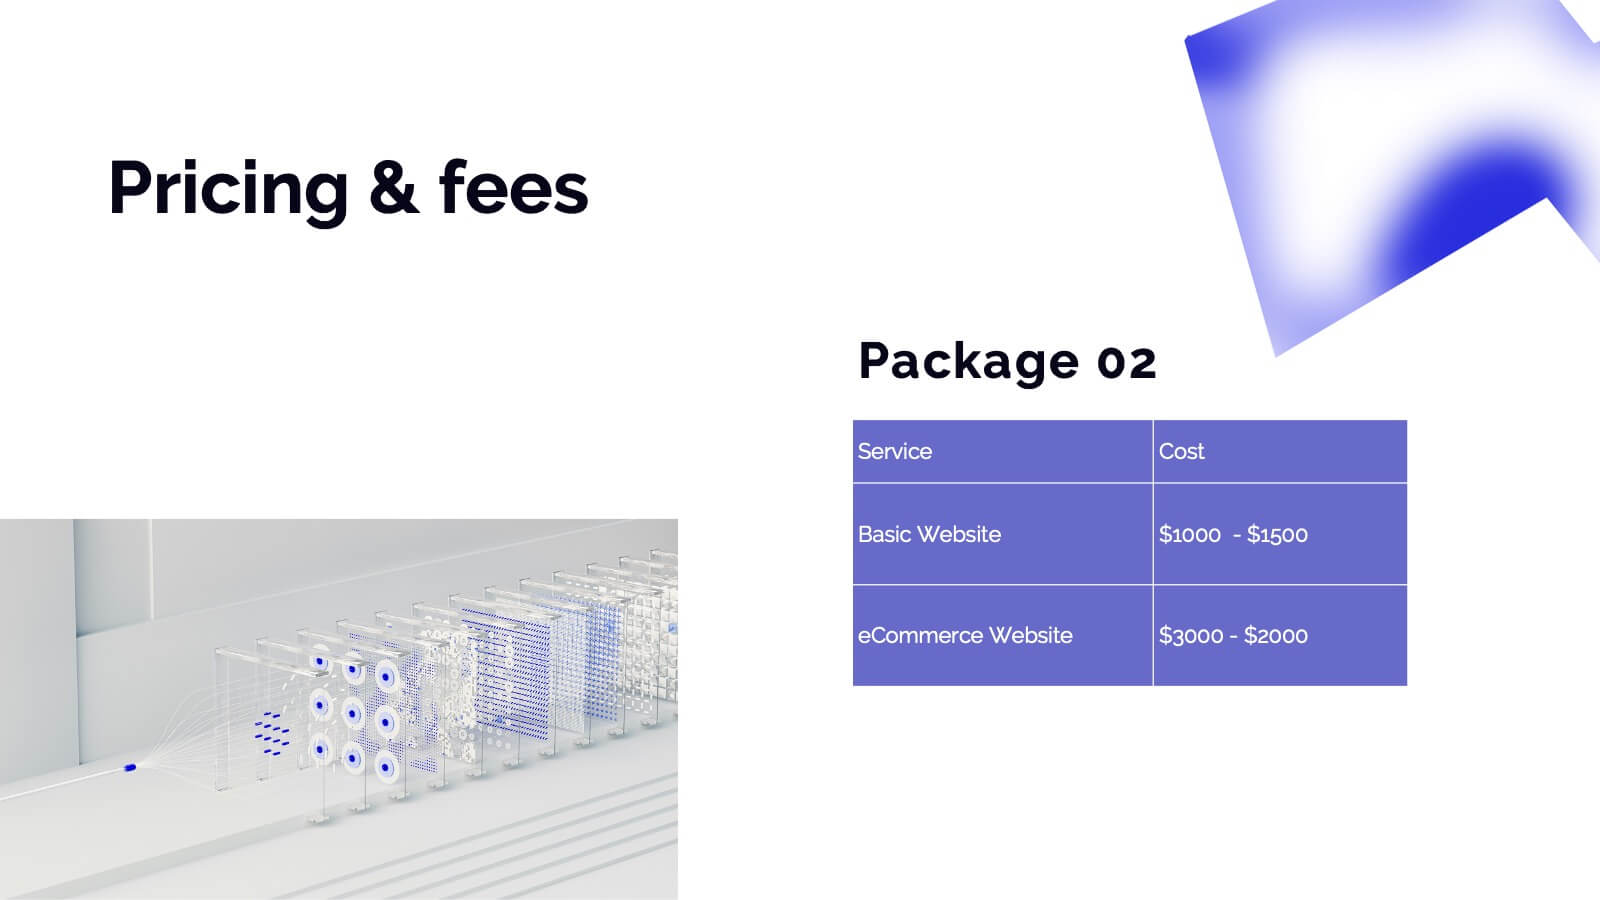
Dryad Photography Portfolio Template Presentation
Showcase your photography skills with this elegant and professional portfolio presentation template! Perfect for highlighting your projects, style, and creative process, this template covers everything from client testimonials to pricing and services offered. It’s ideal for photographers wanting to present their work with style and clarity. Compatible with PowerPoint, Keynote, and Google Slides for effortless sharing and presentations.


6 slides
Strategic Planning Spider Diagram Presentation
Present your strategy with clarity using the Strategic Planning Spider Diagram Presentation. This template offers a bold, visual way to showcase performance across six core categories, helping teams align on goals and priorities. Easily customizable and compatible with PowerPoint, Keynote, and Google Slides. Ideal for executives and planners.


6 slides
Real Estate Property Market Overview Presentation
Present key property market insights using this structured, easy-to-follow layout. The slide features six labeled sections flanking a central house graphic—ideal for highlighting data points, regional comparisons, or investment factors. Fully customizable in Canva, PowerPoint, and Google Slides, making it perfect for real estate reports, pitches, or client presentations.


22 slides
Muse UX Case Study Presentation
Deliver compelling UX case studies with a sleek presentation template designed to highlight your design journey and results. Ideal for showcasing your user-centered approach, it includes dedicated slides for project overview, user research, personas, journey mapping, wireframes, prototyping, and user testing. Clearly communicate your design principles and decision-making processes with visual design elements and brand guidelines. With specific sections for feedback, accessibility considerations, and project outcomes, this template ensures every aspect of your UX process is captured in a structured and visually engaging manner. Whether you're presenting to clients, stakeholders, or design teams, this template is fully editable and compatible with PowerPoint, Google Slides, and Keynote. Its modern design and professional layout provide an effortless way to convey the value of your UX work, making a lasting impact on your audience. Tailor it to your brand, and elevate your case studies today!


5 slides
Contracts and Law Capacity Infographics
In the context of contracts and law, "capacity" refers to a person's legal ability to enter into a contract and be bound by its terms. These colorful infographics are designed to simplify the complex concepts of contracts and law capacity for the audience. This infographic template aims to provide essential information about the legal aspects of contracts and the concept of capacity in a visually appealing manner. This section provides a clear definition of contracts and highlights the essential elements. The template incorporates engaging infographics, icons, and illustrations to visualize key concepts and make the information more memorable.


8 slides
Governance and Compliance Framework
Streamline your compliance reporting with this triangle-based governance framework slide. Featuring three core pillars—Risk, Strategy, and Leadership—this layout visually connects your organizational roles, responsibilities, and regulatory measures. Each corner is paired with numbered titles and editable icons, perfect for illustrating audits, policies, or internal controls. Fully editable in PowerPoint, Keynote, and Google Slides.


10 slides
Marketing Wheels Strategy Presentation
Turn your marketing process into a powerful visual story with this dynamic circular design. Each stage connects seamlessly to highlight planning, execution, and performance insights. Perfect for illustrating campaigns, workflows, or business strategies. Fully customizable and compatible with PowerPoint, Keynote, and Google Slides for effortless editing and presentation.


6 slides
Modern Science Report Presentation
Bring your findings to life with a clean, dynamic layout designed to make scientific insights easy to follow. This presentation highlights key data, research points, and lab observations in a structured, visually engaging format that supports clarity and accuracy. Fully compatible with PowerPoint, Keynote, and Google Slides.


4 slides
Product Life Cycle Stages Explained Presentation
Turn complex business growth phases into a clear visual journey with this clean, modern layout. Ideal for explaining product development, marketing strategies, or performance tracking, it helps you communicate each stage with precision and style. Fully editable and compatible with PowerPoint, Keynote, and Google Slides for seamless customization.


7 slides
Marketing Agency Infographic
A marketing agency is a specialized firm or company that offers a range of services to assist businesses in promoting their products, services, or brand effectively. Our marketing agency infographic is an exploration of marketing mastery, designed to captivate and educate. Fully customizable and compatible with Powerpoint, Keynote, and Google Slides. Showcase the collaborative force that propels your agency towards success, with the combined power of creativity, strategy, and dedication from this template. This infographic will encourage action, inviting your audience to chart a path towards infinite marketing horizons and beyond.


5 slides
Space Race Infographics
The Space Race refers to the competition between the United States and the Soviet Union during the Cold War era to achieve milestones in space exploration and technology. These vertical infographics are informative resources that explore the historic space race. They are designed to present key facts, milestones, and achievements of this significant period in space exploration history. The template features a captivating design with space-themed visuals, cosmic colors, and modern typography. The visuals are carefully selected to depict iconic spacecraft, astronauts, celestial bodies, and other relevant elements, creating an immersive infographic experience.


8 slides
Credit Card Comparison Presentation
The "Credit Card Comparison" presentation template visualizes the differences between credit and debit card options in a straightforward and engaging way. Featuring side-by-side comparisons, the template allows for easy insertion of key points such as fees, benefits, and suitability for different user profiles, making it an excellent tool for financial educators, advisors, and banking professionals. The template’s design ensures that the content is accessible and relatable, making complex financial concepts easier to grasp for the audience. This makes it ideal for presentations aimed at educating consumers about financial choices or for internal training within financial institutions.


7 slides
International Finance Infographic
International finance is a branch of economics and financial studies that deals with monetary interactions that occur between two or more countries. Dive into the intricate world of finance with our visually captivating international finance infographic. This template is your passport to understanding the complexities and opportunities in the global financial landscape. With this template you will be able to analyze the dynamics of exchange rates, foreign investment, and how these factors influence global economics. This infographic is crafted to provide a holistic view of the world of finance.


5 slides
Responsibility Assignment Matrix Slide
Make project accountability crystal clear with this smart and structured matrix designed for assigning responsibilities across roles. Ideal for outlining who's doing what in multi-team environments, this slide keeps everyone on the same page using the classic RACI method. Fully compatible with PowerPoint, Keynote, and Google Slides.


23 slides
Staccato Business Plan Presentation
Present your business plan with this elegant and structured template, designed for clarity and professionalism. This presentation layout provides all the essential elements for showcasing your strategy, goals, and objectives, ideal for entrepreneurs, startups, and established businesses alike. Featuring dedicated sections for company overview, panel discussions, workshop sessions, and closing remarks, the slides are organized for seamless storytelling. Highlight your team, workshop takeaways, and key resources with polished visuals and easy-to-follow layouts. The Q&A and networking break slides allow you to engage your audience effectively while maintaining a professional tone. Fully compatible with PowerPoint, Google Slides, and Keynote, this template is fully editable, allowing you to customize colors, text, and images to reflect your brand. Deliver your business ideas confidently with a presentation template that ensures a strong, lasting impression.


21 slides
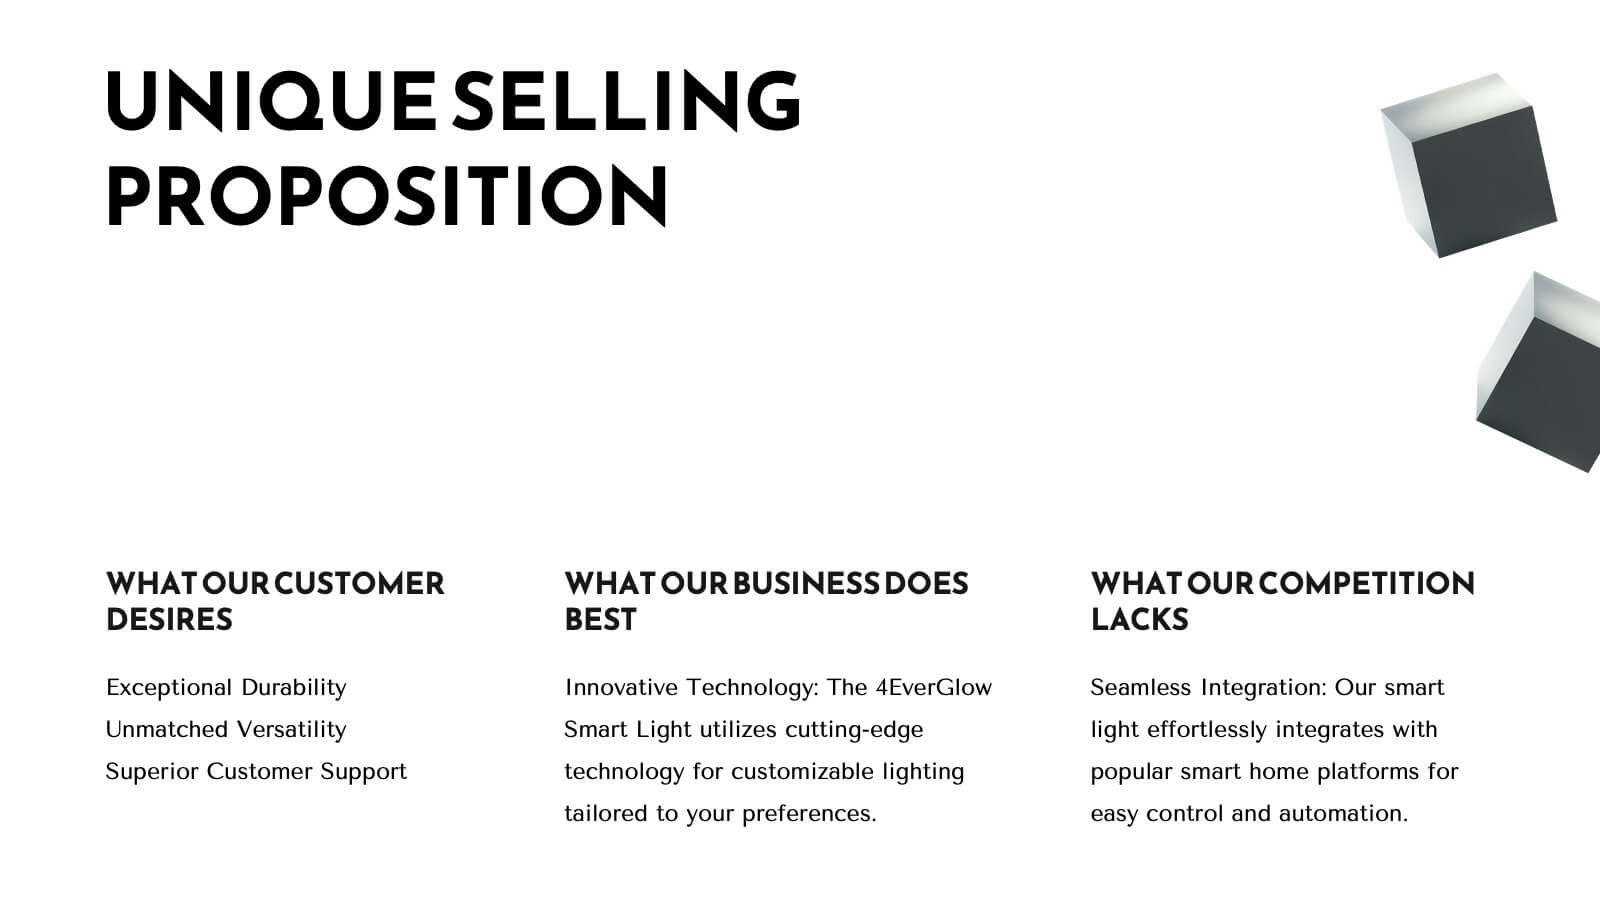
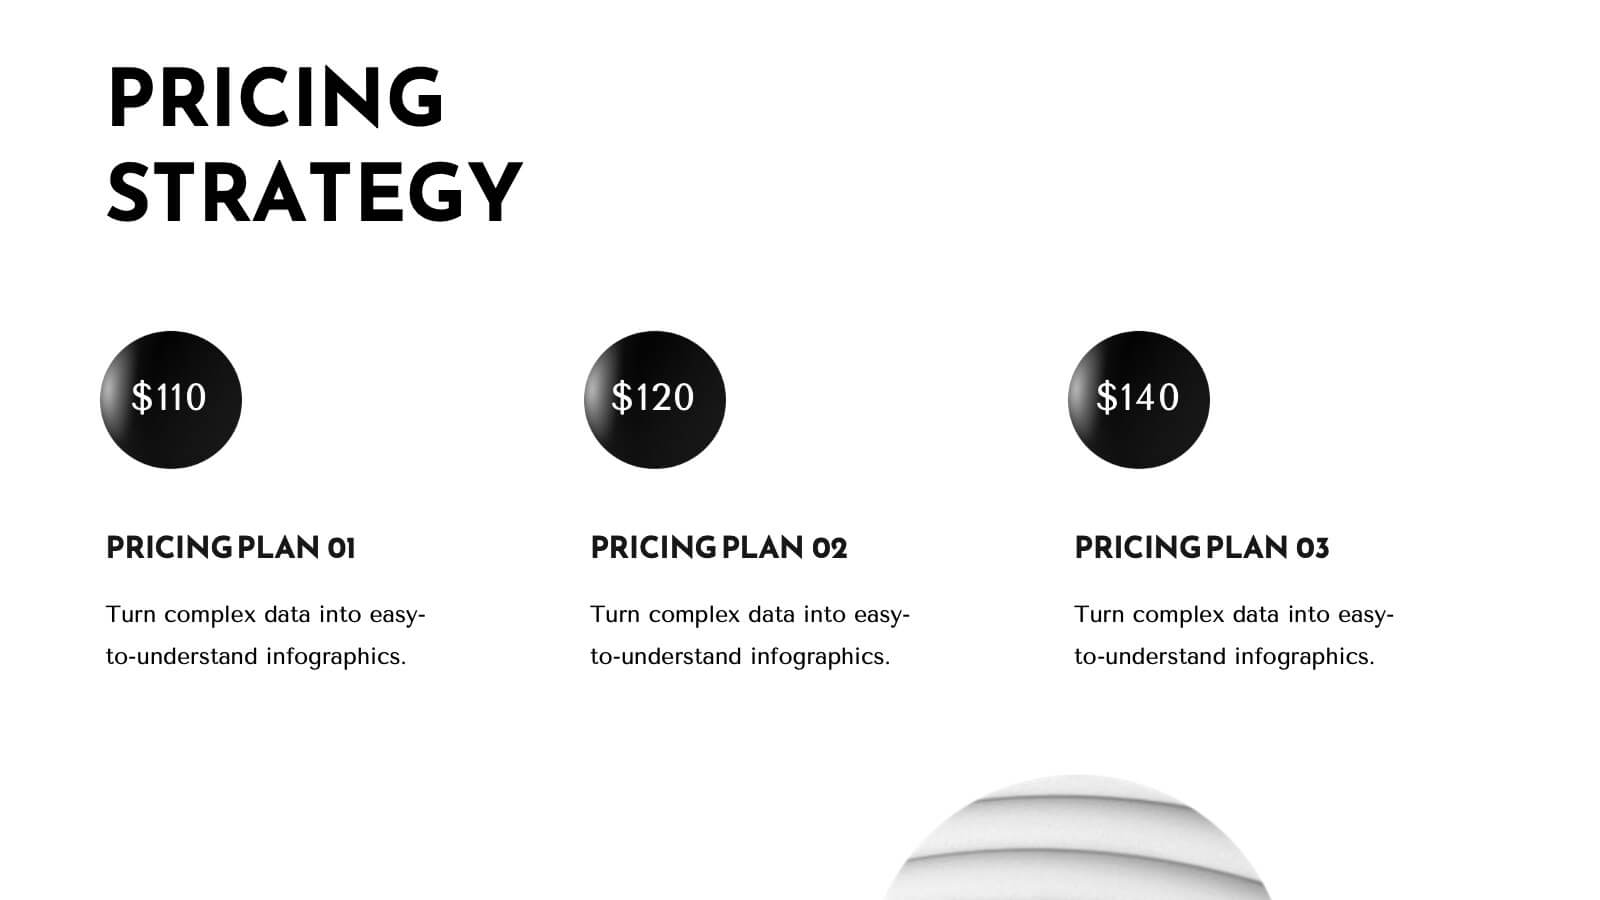
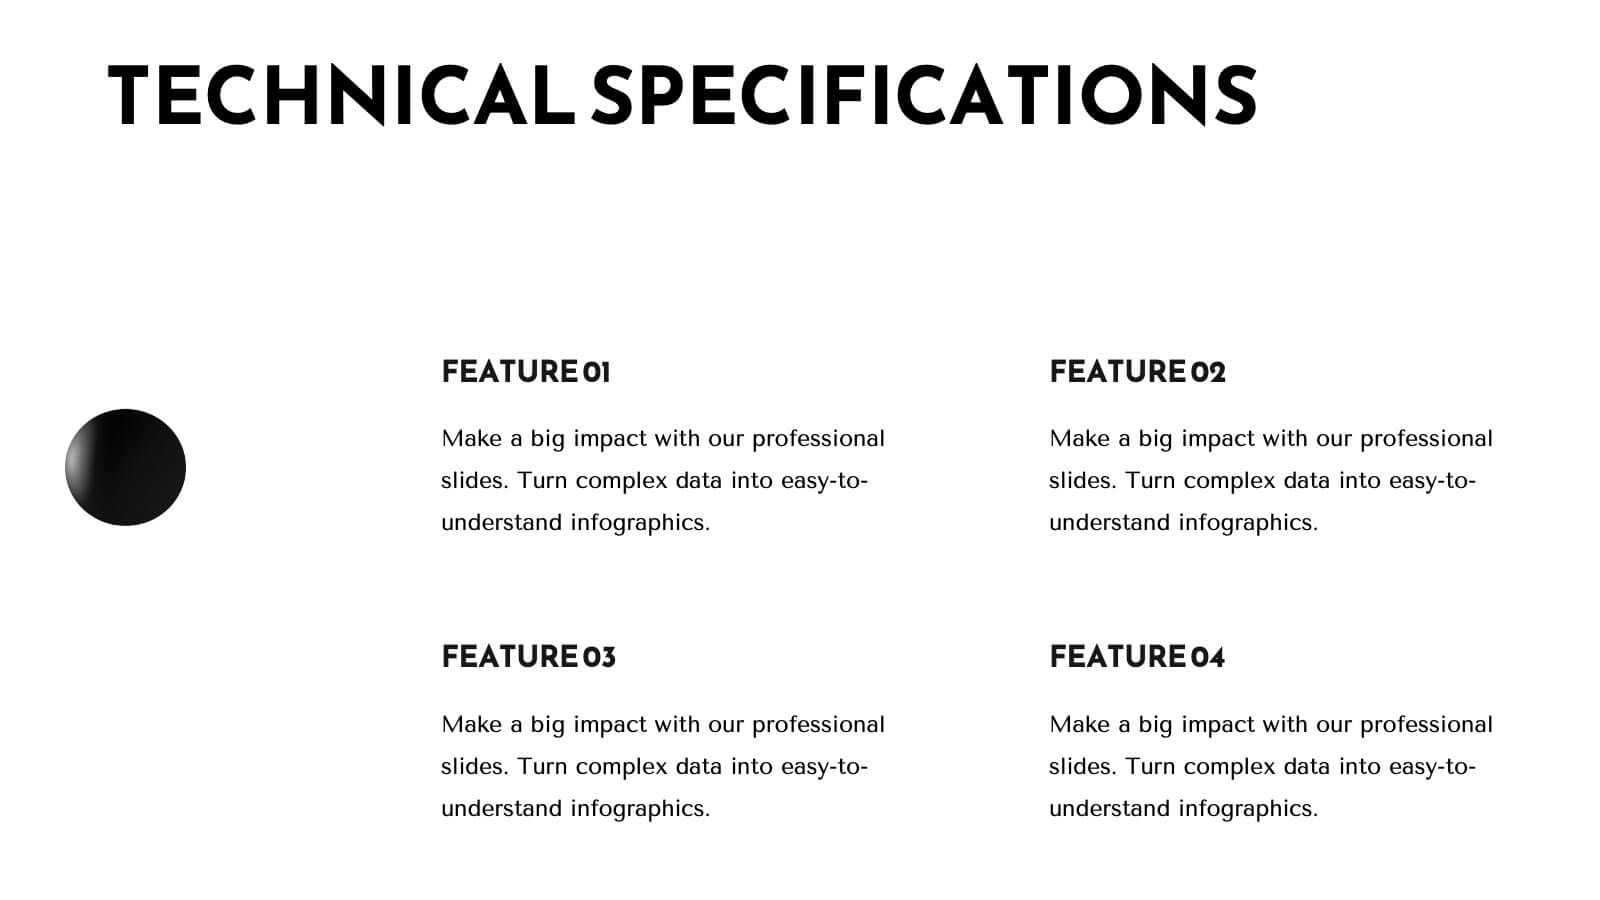
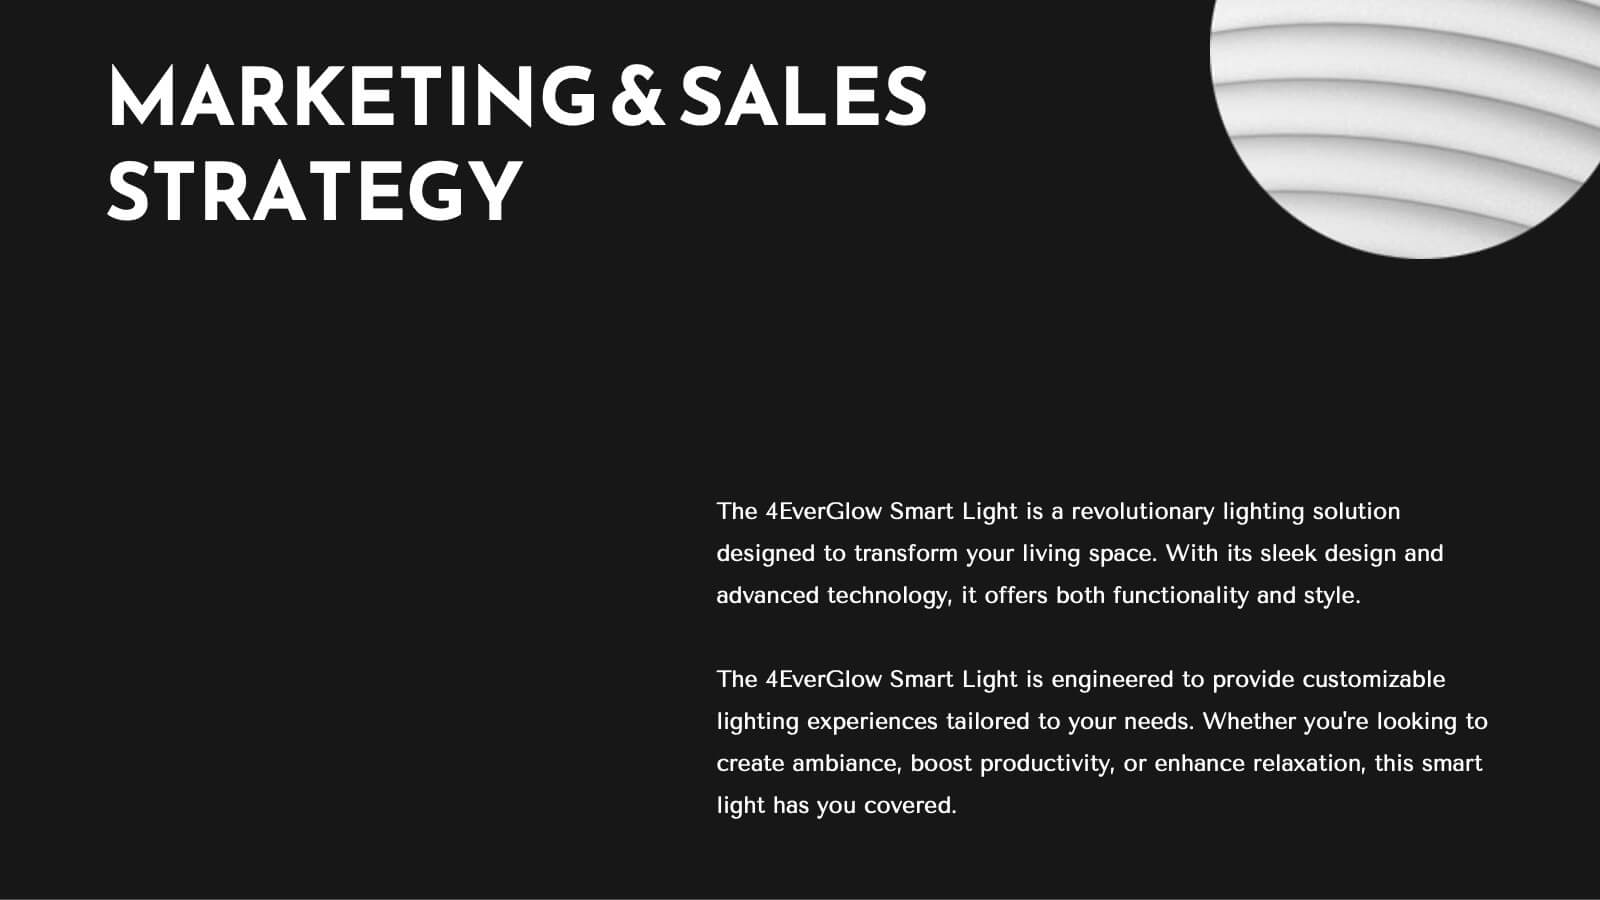
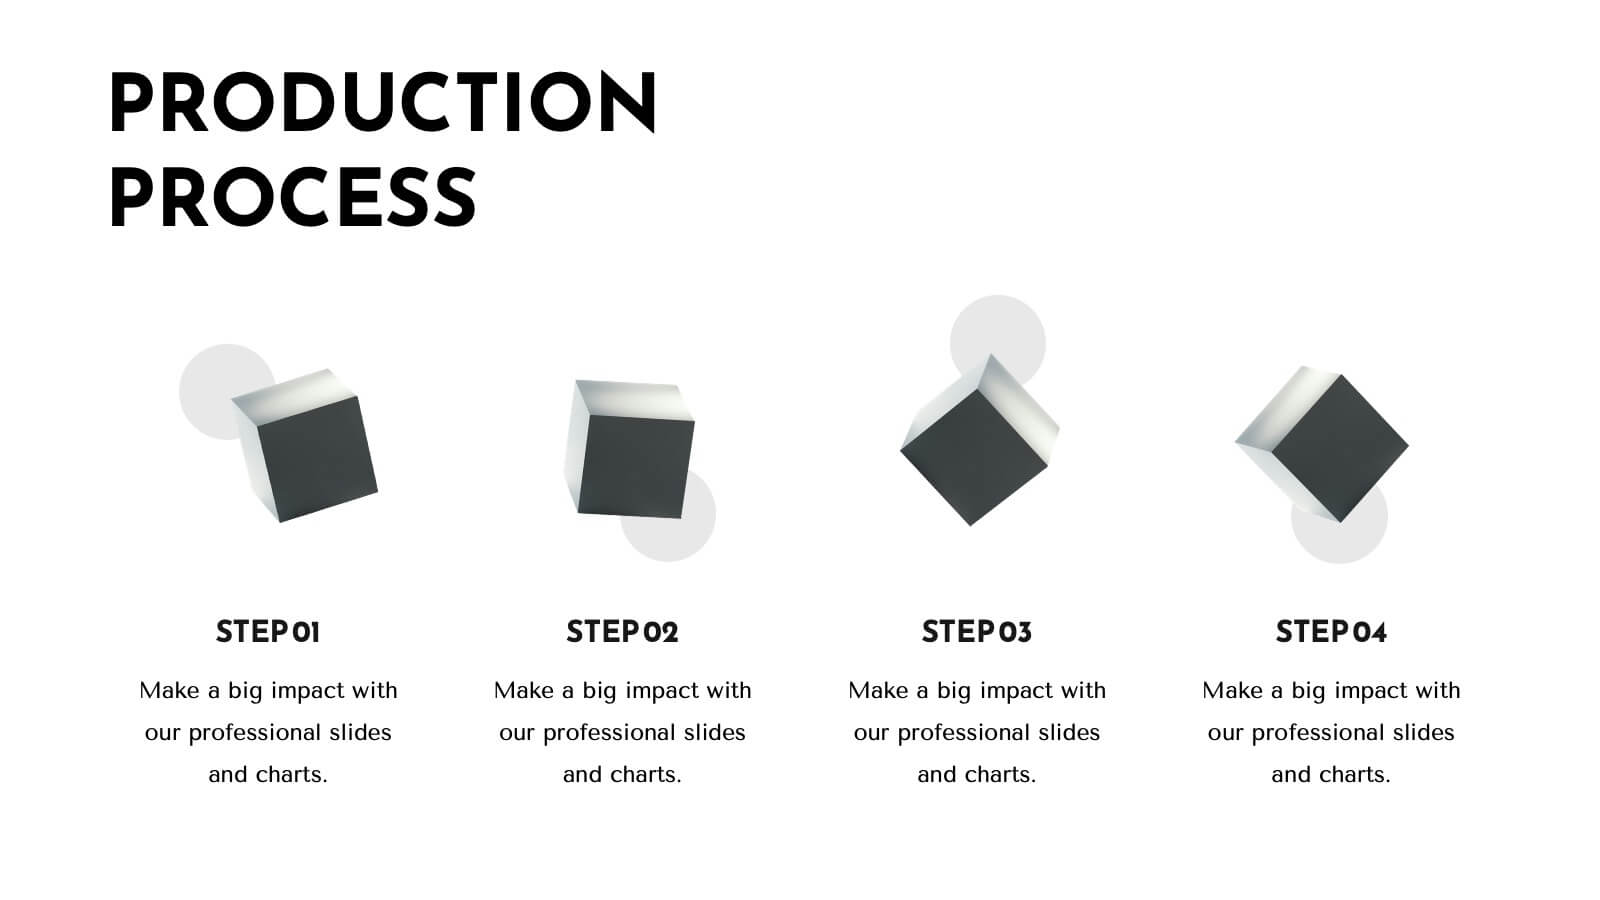
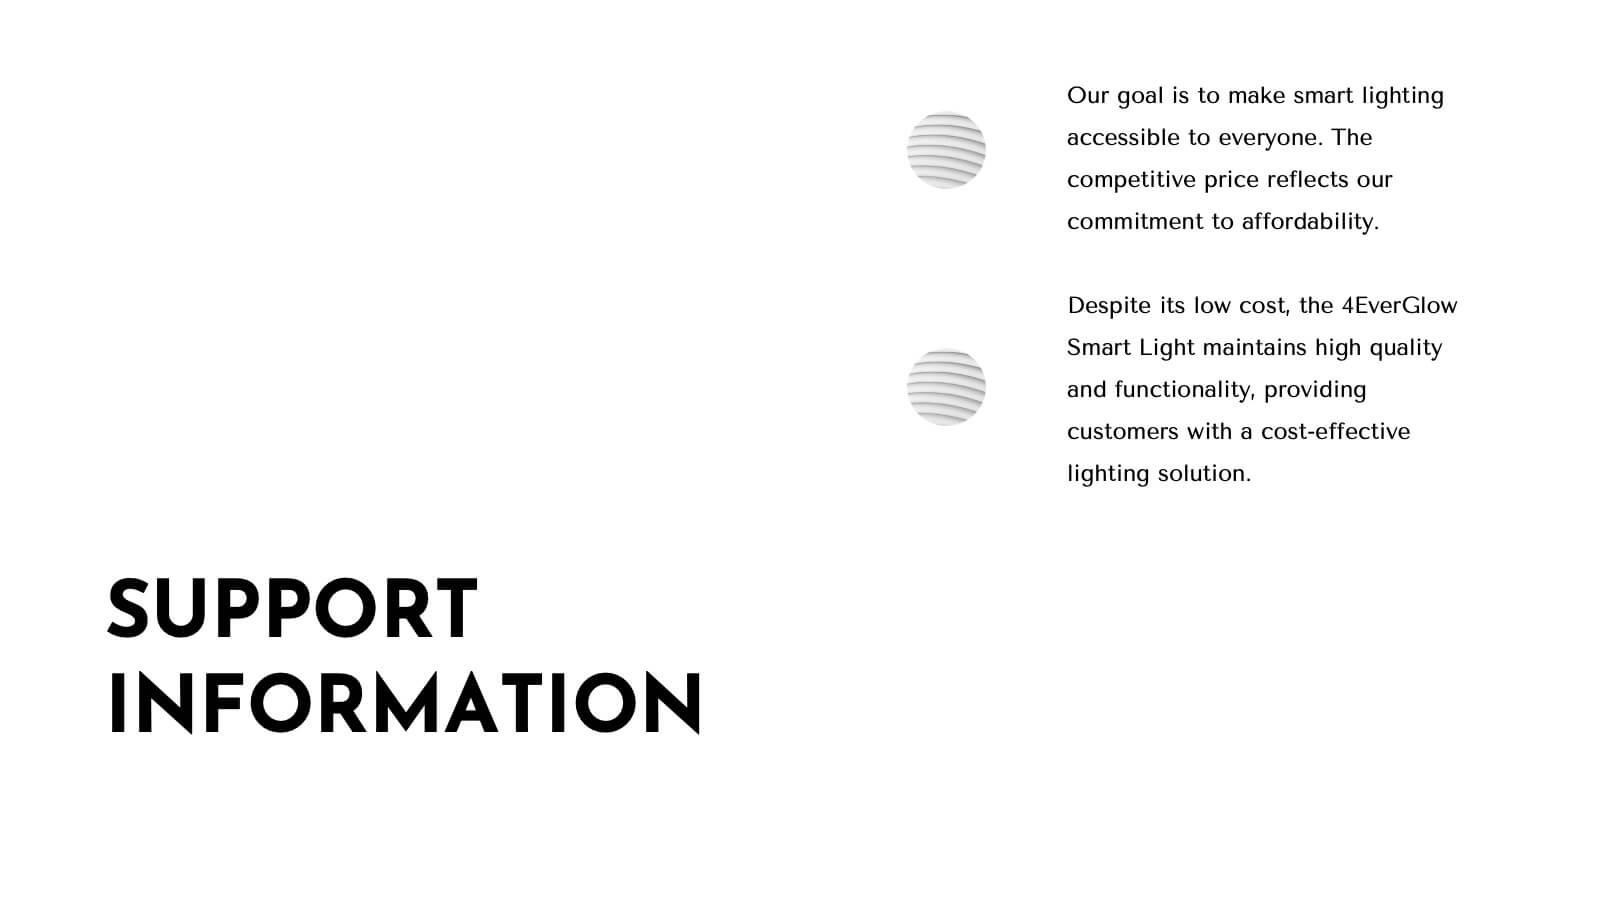
Trident Product Development Plan Presentation
Present your product development strategy with this sleek, professional template! Highlight company overview, product features, and unique selling proposition. Ideal for showcasing market analysis, pricing strategy, and production process. Perfect for developers and project managers. Compatible with PowerPoint, Keynote, and Google Slides.