


Features
- 6 Unique slides
- Fully editable and easy to edit in Microsoft Powerpoint, Keynote and Google Slides
- 16:9 widescreen layout
- Clean and professional designs
- Export to JPG, PDF or send by email


Do you have any questions?
Recommend


21 slides
Seaspray Design Proposal Presentation
Present your design proposal with confidence and clarity using this sleek, professionally crafted template. Tailored for designers and creatives, this presentation includes slides for a company overview, project summary, and a clear articulation of the problem statement with a proposed solution. Walk your audience through your objectives and goals, detailed scope of work, and structured methodology for implementation. Highlight key aspects with a timeline and milestones, and deliver value with dedicated slides for budget breakdowns and pricing structures. Build trust and credibility through client testimonials and showcase expertise with a team introduction. End your presentation with actionable next steps and a well-crafted conclusion to leave a lasting impact. Fully customizable for PowerPoint, Google Slides, and Keynote, this template is perfect for creative professionals aiming to win clients and projects with precision and style.


5 slides
Teenage Suicide Awareness Infographics
Teenage suicide is a serious public health concern that requires awareness and attention. These vertical infographics are designed to raise awareness about teenage suicide, its risk factors, and prevention strategies. The goal of these infographics is to educate the audience, including parents, educators, and community members, about the importance of early intervention, mental health support, and creating a supportive environment for teenagers. The design elements included are carefully chosen to evoke empathy, compassion, and understanding. Fully customizable and compatible with Powerpoint, Keynote, and Google Slides.


7 slides
Sales Infographic Presentation Template
A Sales Infographic is a visual representation of data or information related to sales. They can include charts, graphs, and diagrams that show how much money a company has made, how many products they have sold, and what their best-selling products are. This template is perfect for anyone who wants to show off their sale numbers in a fun and easy-to-understand way. This template has colorful pictures and charts that make it easy to see how much you've sold and how well your sales are doing. This template is a perfect way to help a company make decisions and track progress.


6 slides
Role-Based Responsibility Matrix Presentation
Clarify team roles and accountability with this structured responsibility matrix. Perfect for RACI models and project task alignment, this template features customizable categories, color-coded rows, and editable role labels. Ideal for project managers and team leads. Fully compatible with PowerPoint, Google Slides, and Keynote for easy customization and collaboration.


5 slides
Business Strategy Decision Tree Presentation
Streamline your strategic decisions with this Business Strategy Decision Tree template. Designed to visually map out options, outcomes, and key choices, this slide is perfect for business analysts, consultants, and executives. Featuring hierarchical branching with clear icons and customizable sections, it helps illustrate strategic planning, problem-solving, and risk assessment. Fully compatible with PowerPoint, Keynote, and Google Slides for seamless presentation integration.


8 slides
Project Milestones and Deliverables Presentation
Visualize your project’s journey with this step-by-step milestone timeline—ideal for tracking key phases, task ownership, or delivery checkpoints. The diagonal path connects colorful icons and editable text blocks, helping teams align on objectives and timelines. Compatible with PowerPoint, Keynote, and Google Slides.


4 slides
Emerging AI Applications in Business
Showcase innovation with clarity using the Emerging AI Applications in Business Presentation. This sleek 4-step layout features modern icons and a profile-style AI illustration, perfect for outlining use cases such as automation, data insights, machine learning, or cloud-based AI solutions. Ideal for tech-driven strategy decks, startup pitches, or digital transformation briefings. Fully editable in PowerPoint, Keynote, and Google Slides.


5 slides
Porter's Five Forces Market Analysis
Visualize competitive dynamics with this clear, easy-to-follow Porter’s Five Forces slide. Each force—Buyer Power, Supplier Power, Competitive Rivalry, Threat of Substitution, and Threat of New Entry—is color-coded and icon-labeled for quick reference. Perfect for strategy meetings, SWOT comparisons, or investment pitches. Editable in PowerPoint, Keynote, and Google Slides.


4 slides
AIDA Marketing Funnel Slide Presentation
Capture attention from the very first slide with a bold, structured layout that turns each stage of your message into a clear, engaging flow. This presentation helps simplify complex decision paths and guide viewers through each step with ease. Fully editable and compatible with PowerPoint, Keynote, and Google Slides.


5 slides
History in Science Infographics
The history in science refers to the development of scientific knowledge throughout human history. These Infographics can be used to visualize and simplify complex scientific concepts and discoveries in a historical context. This can help students and others interested in science understand the evolution of scientific theories and breakthroughs over time, and how they have shaped our understanding of the world. These infographics use a variety of visual elements, such as timelines, graphs, illustrations, and icons, to tell a compelling story about the history of science. Compatible with Powerpoint, Keynote, and Google Slides.


5 slides
User-Centered Design with Empathy Map Presentation
Improve User Insights with the Empathy Map for User-Centered Design! This User-Centered Design with Empathy Map template provides a structured approach to understanding user behaviors, motivations, and needs. Designed with clear quadrant sections, this template helps teams map out key insights for UX research, customer journey mapping, and product development. Ideal for designers, marketers, and strategists, this fully editable slide deck works seamlessly with PowerPoint, Keynote, and Google Slides for a hassle-free customization experience.


28 slides
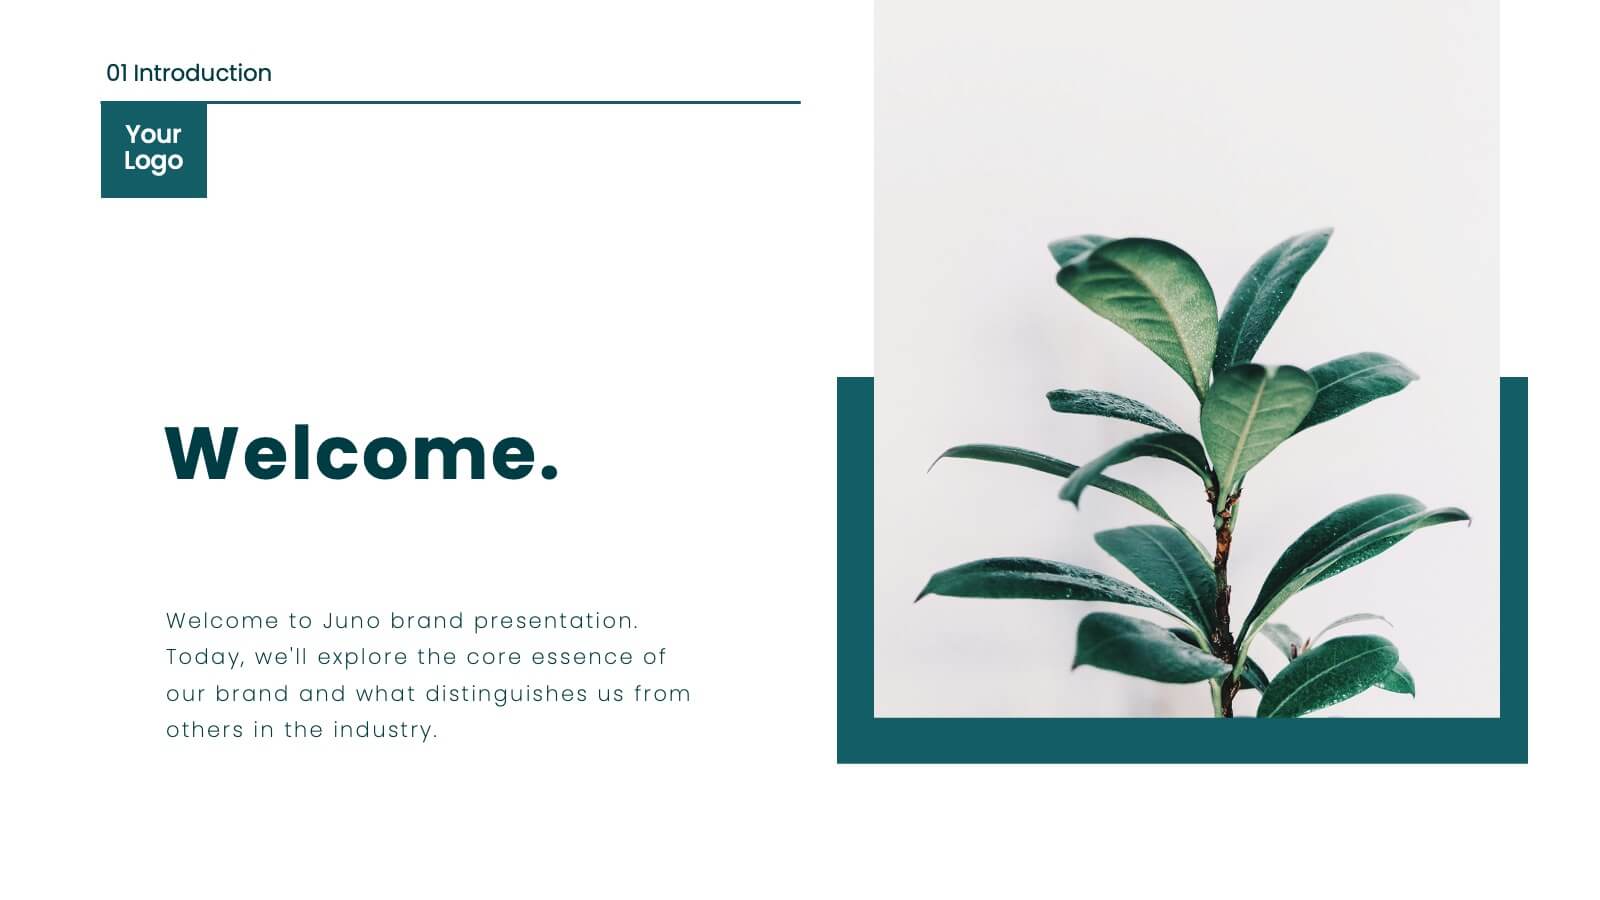
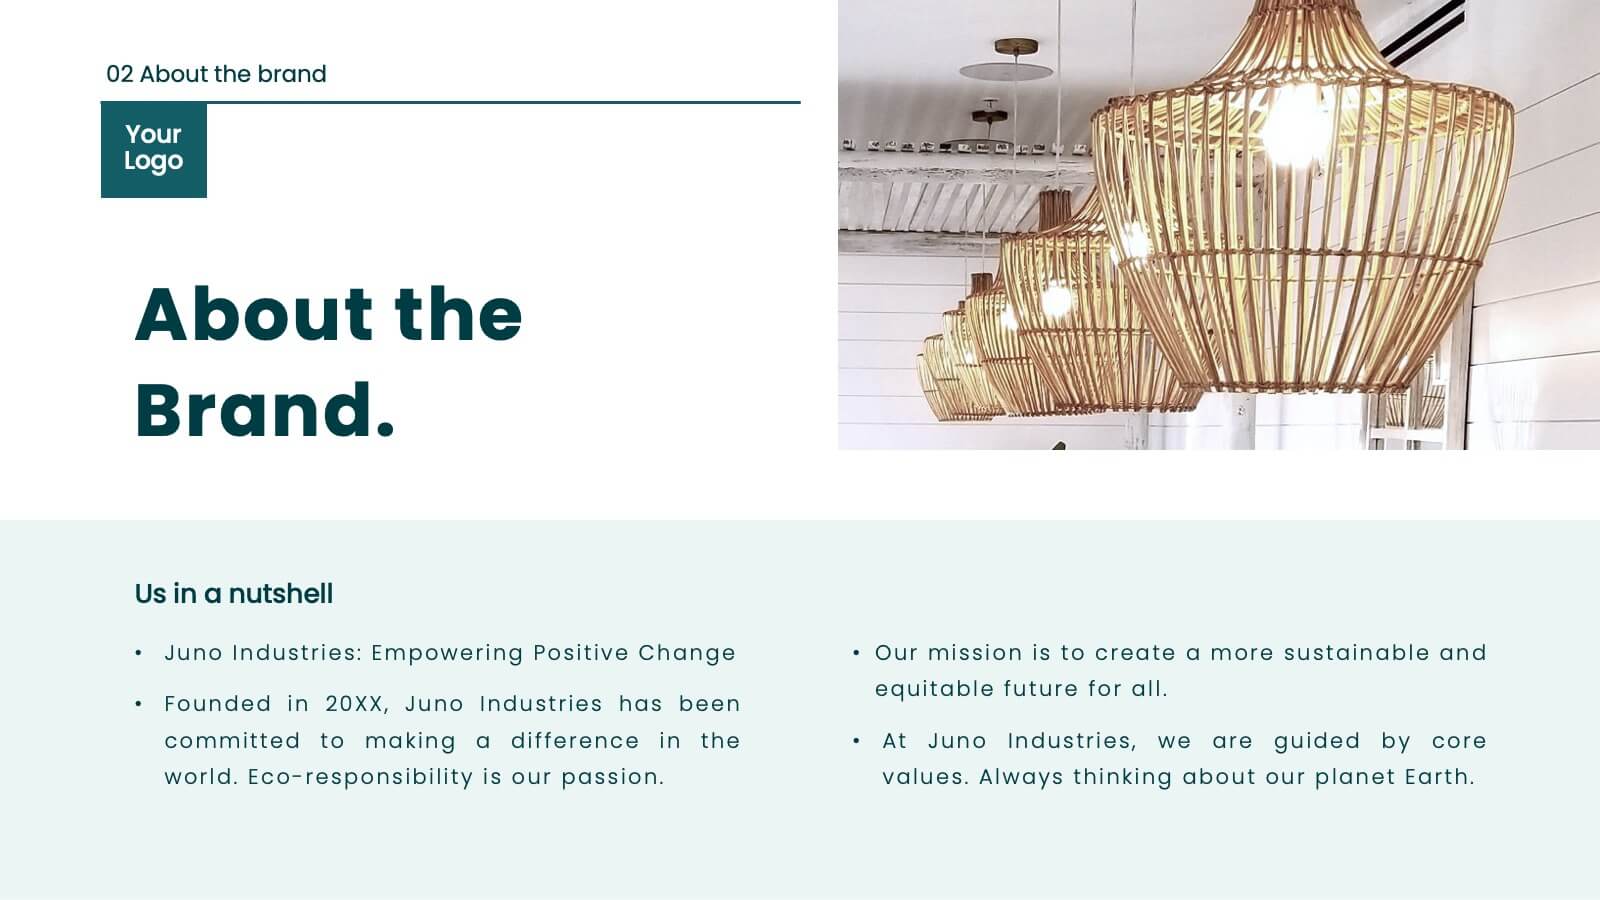
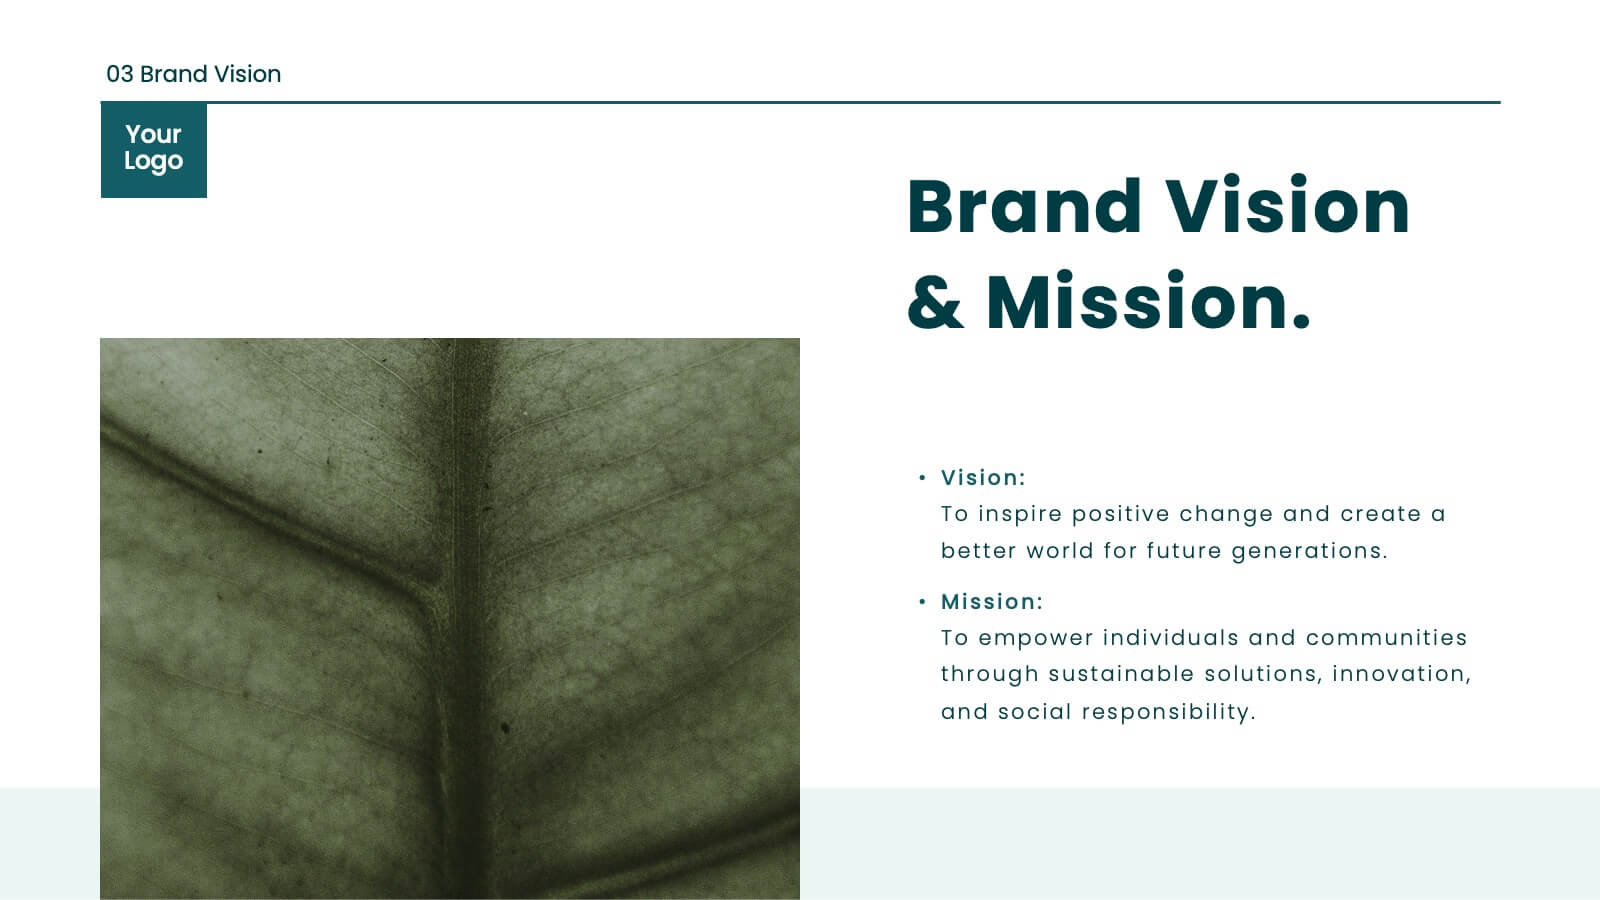
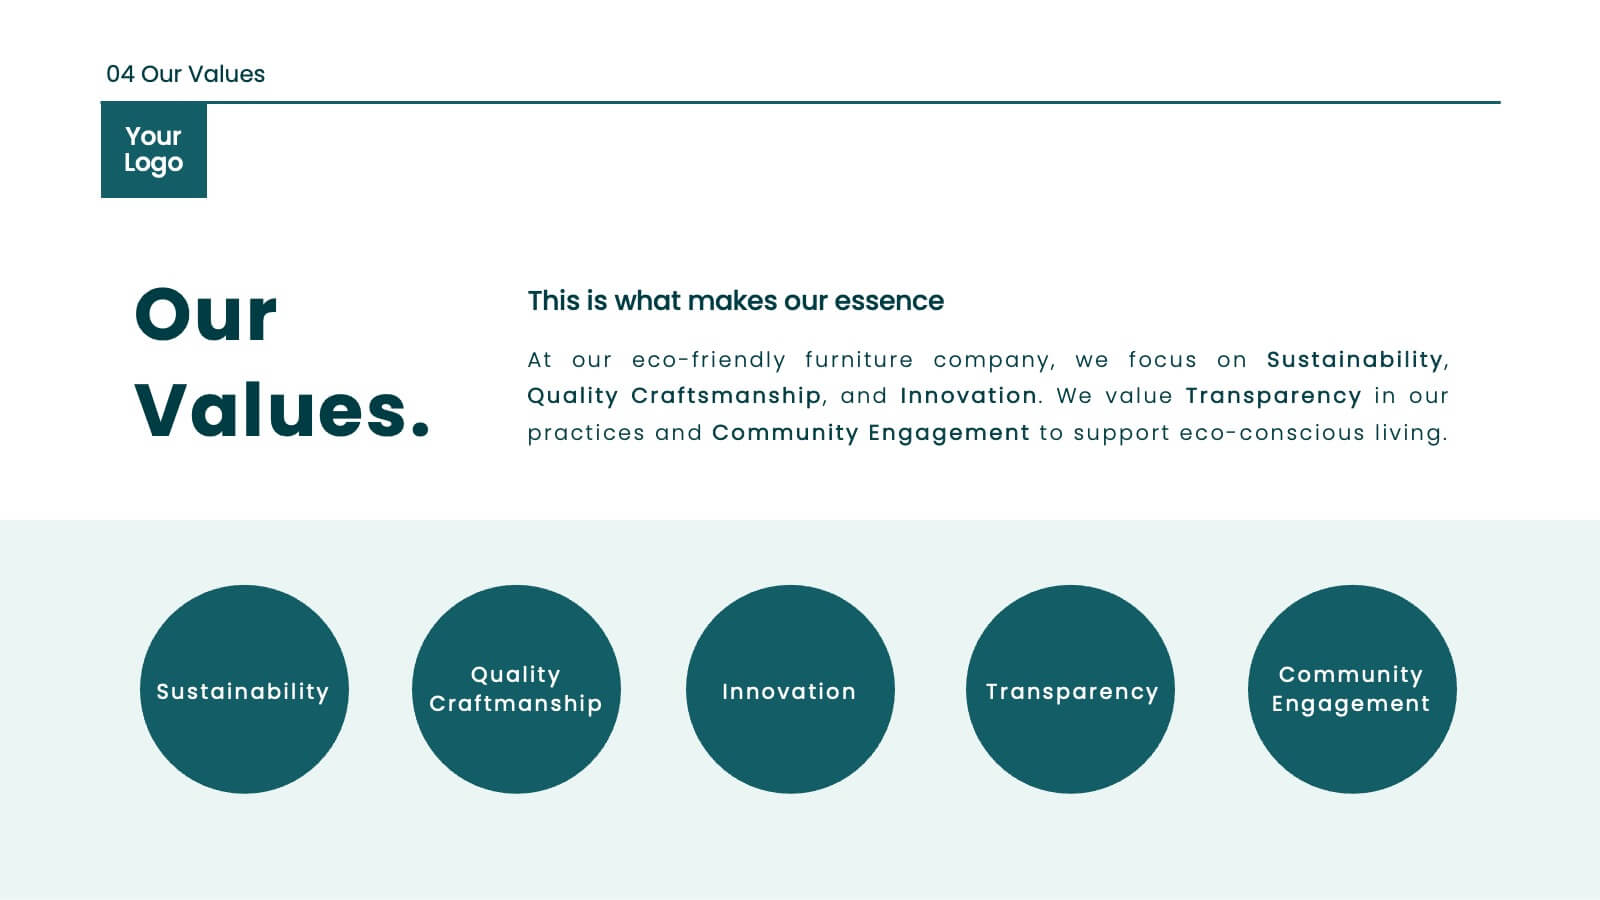
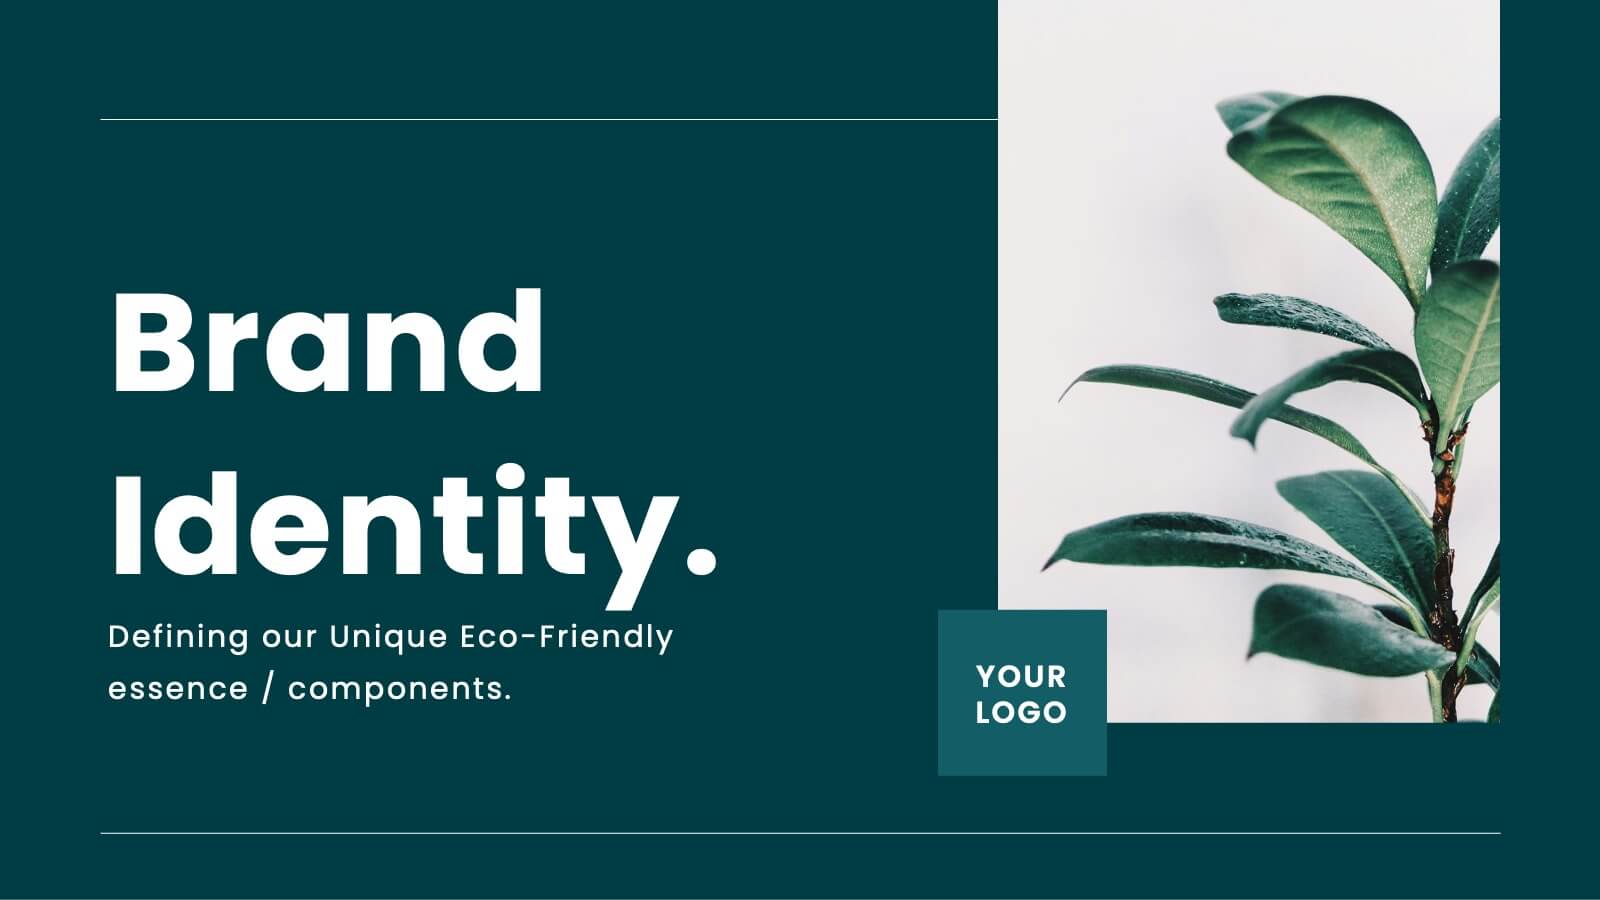
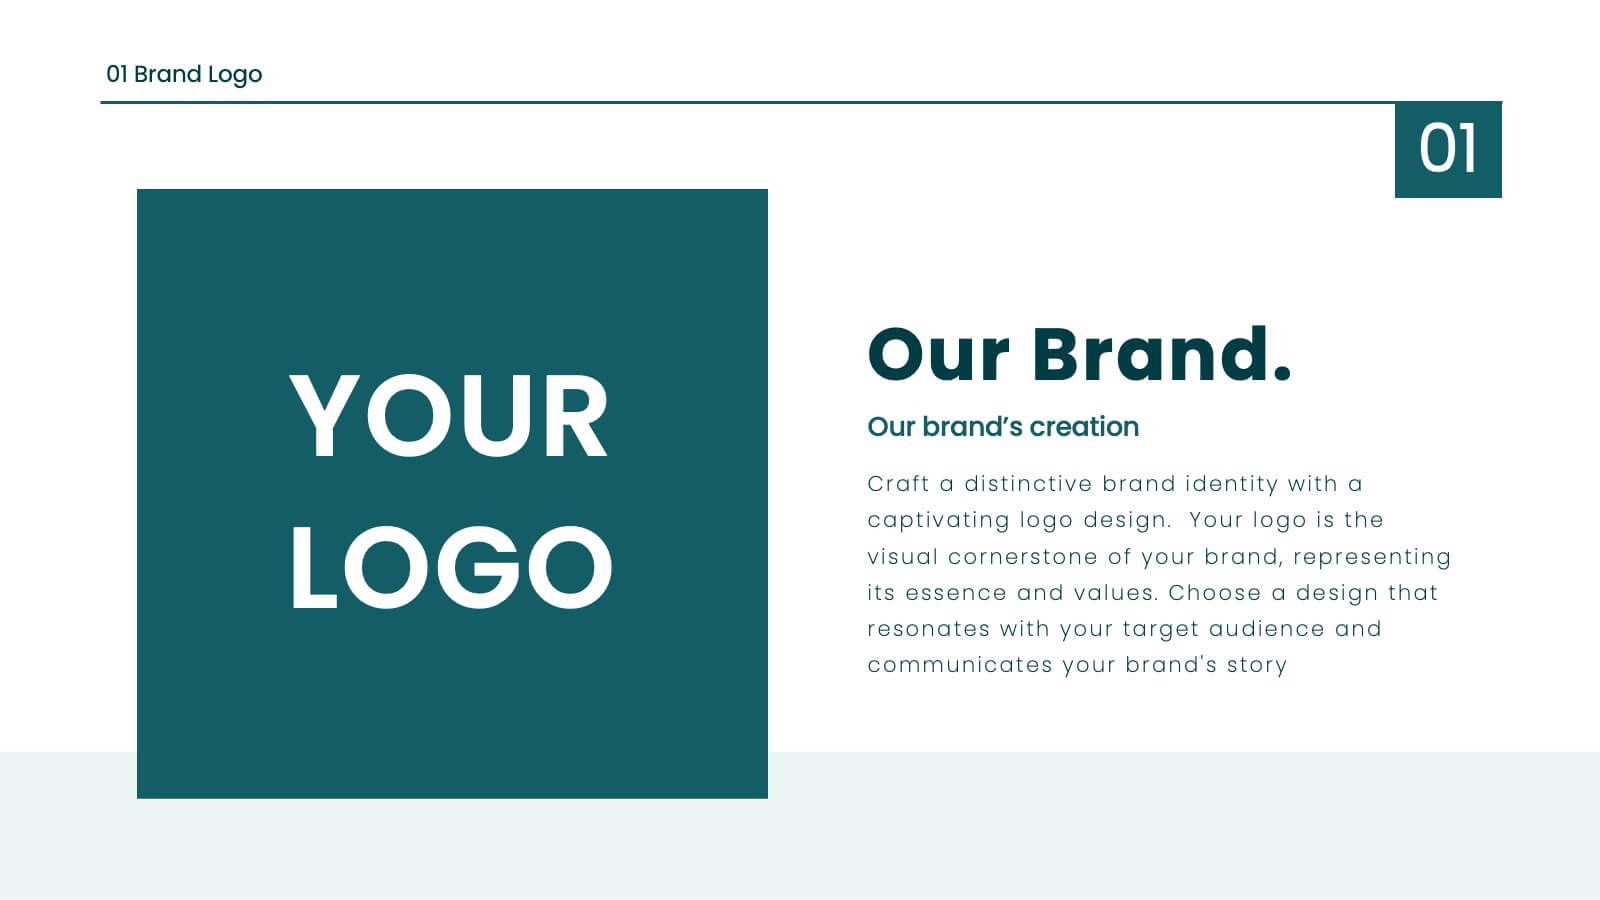
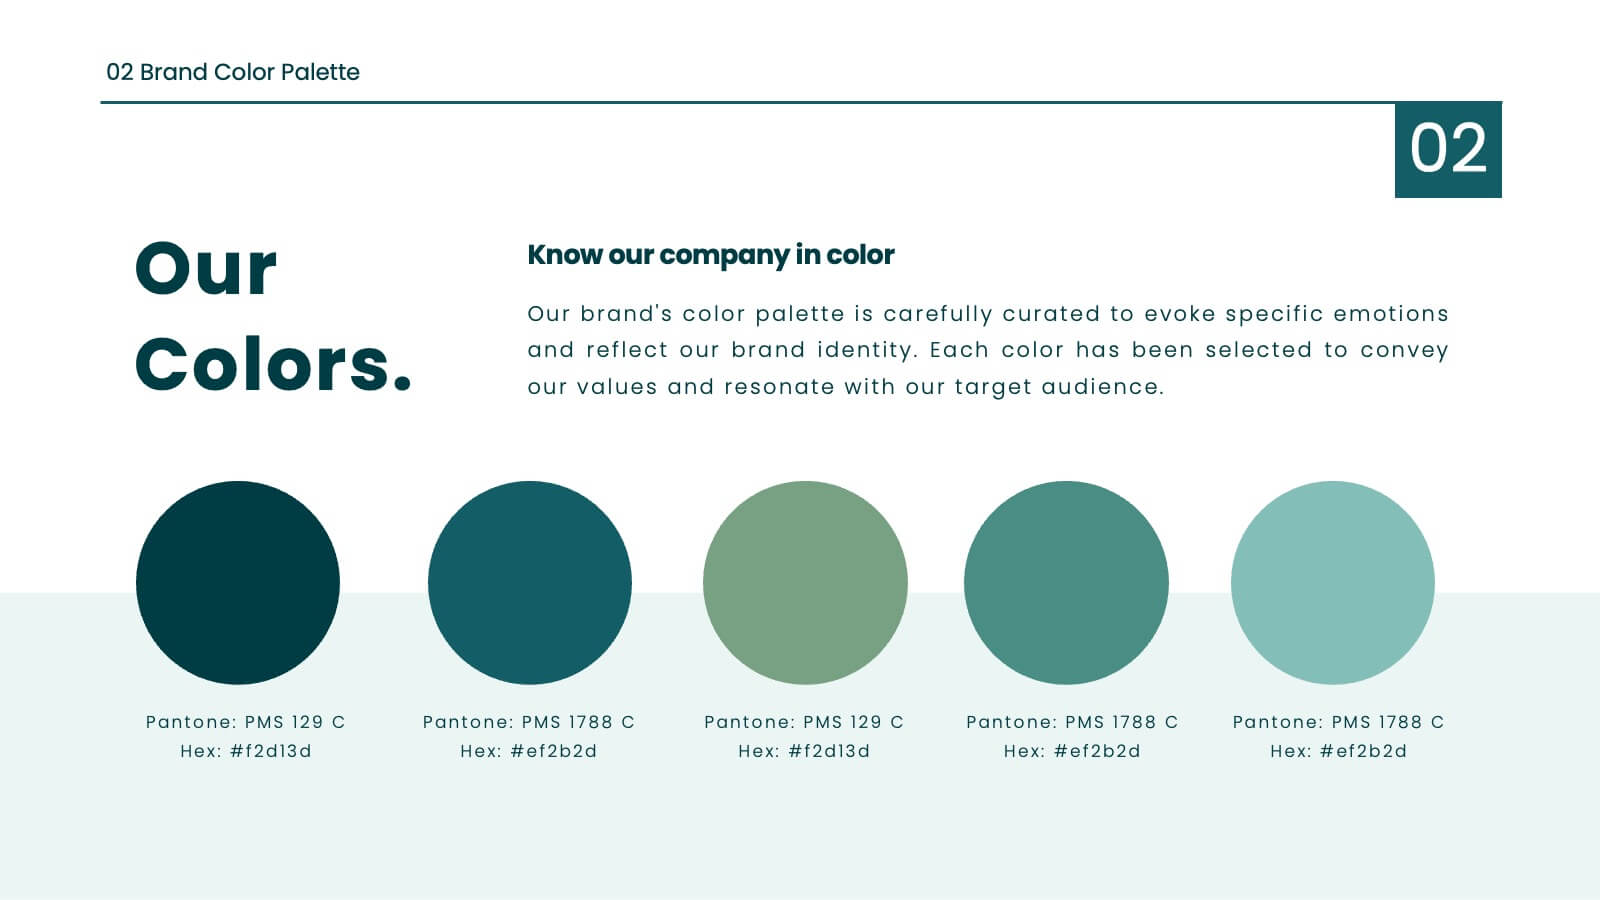
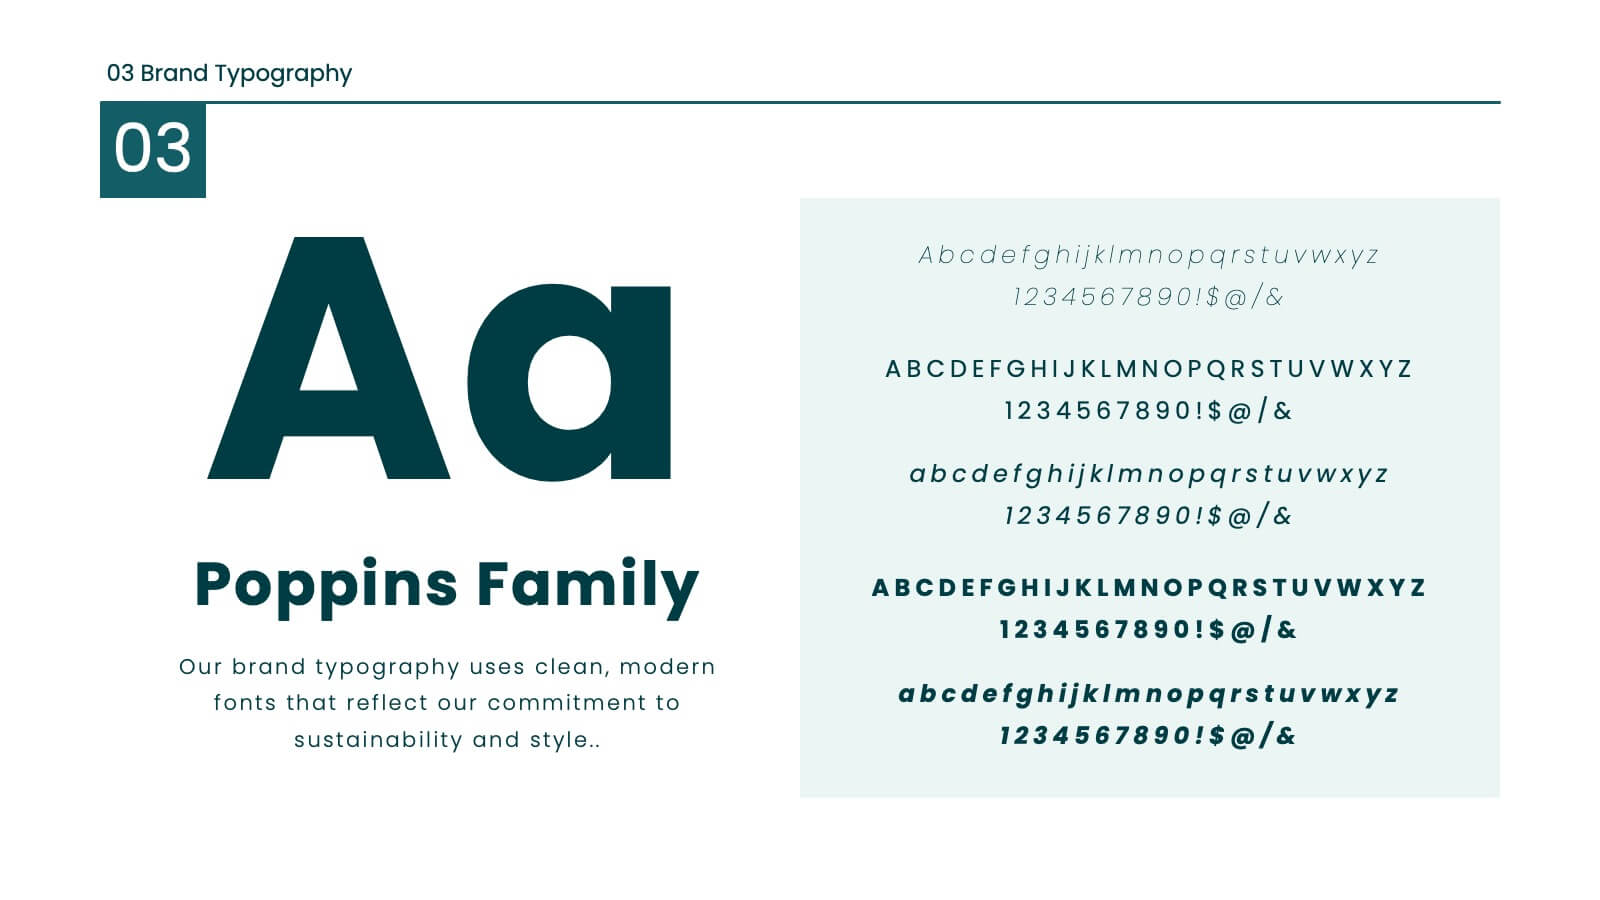
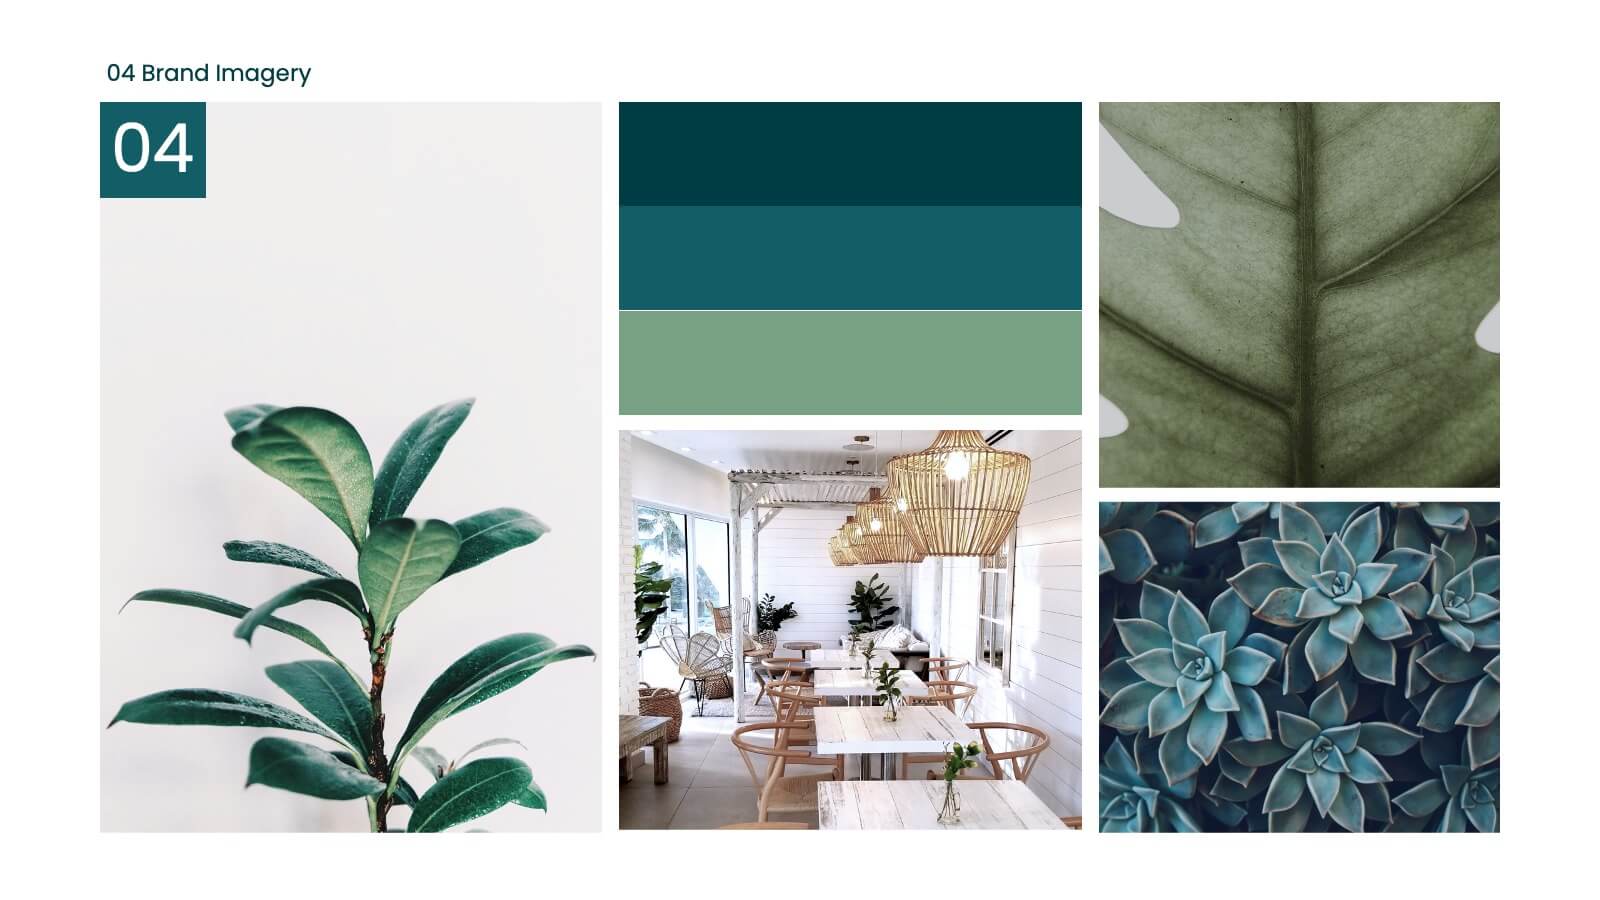
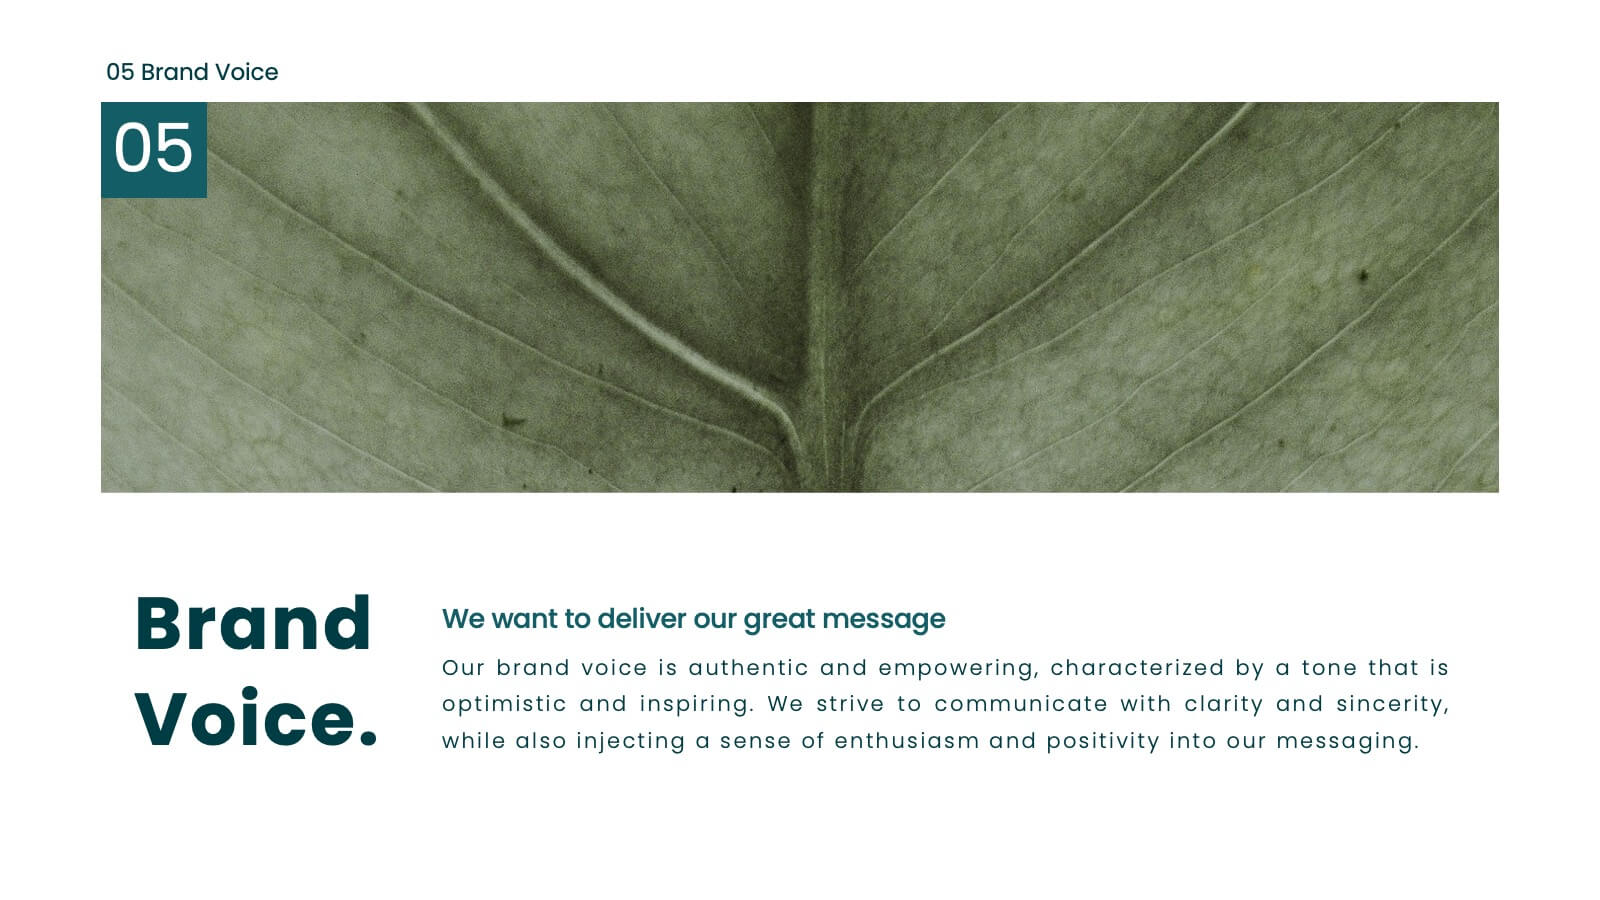
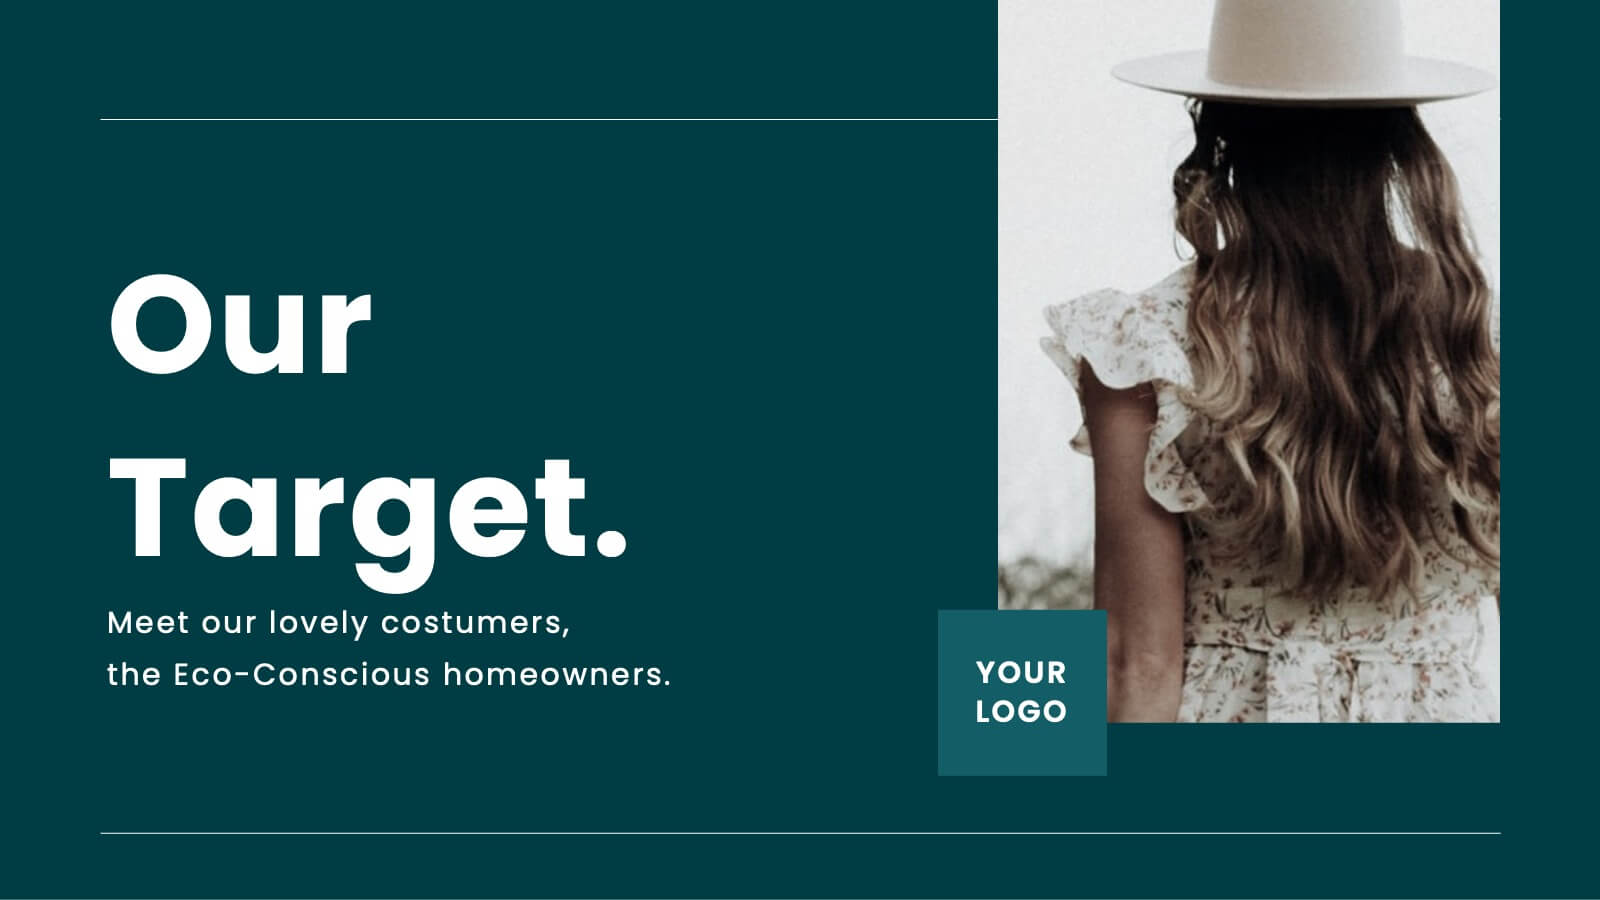
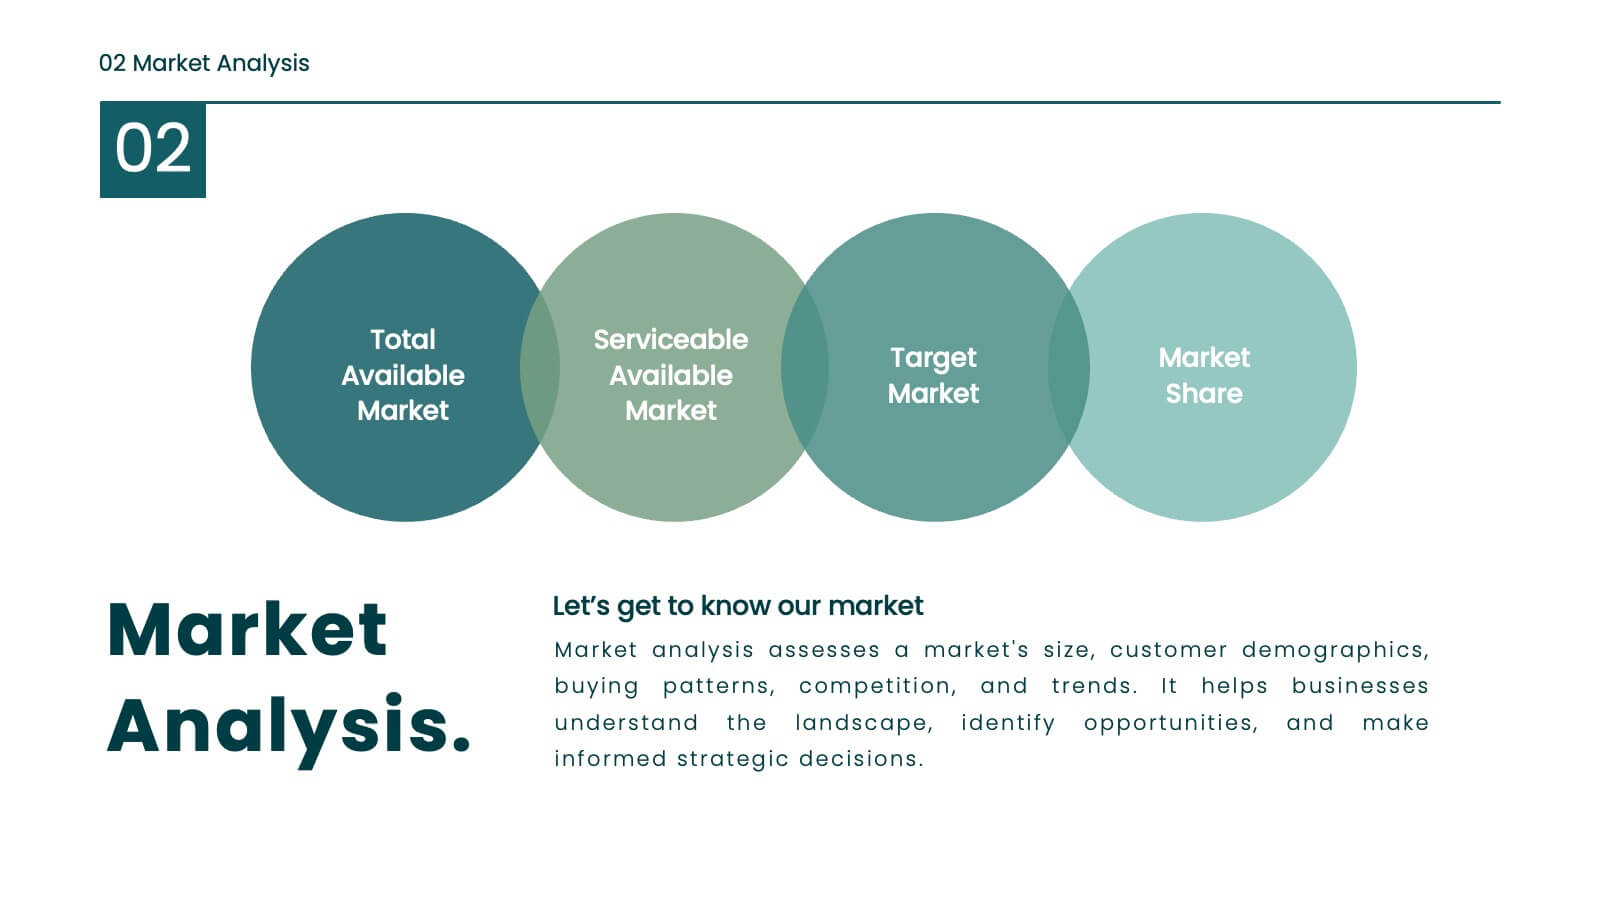
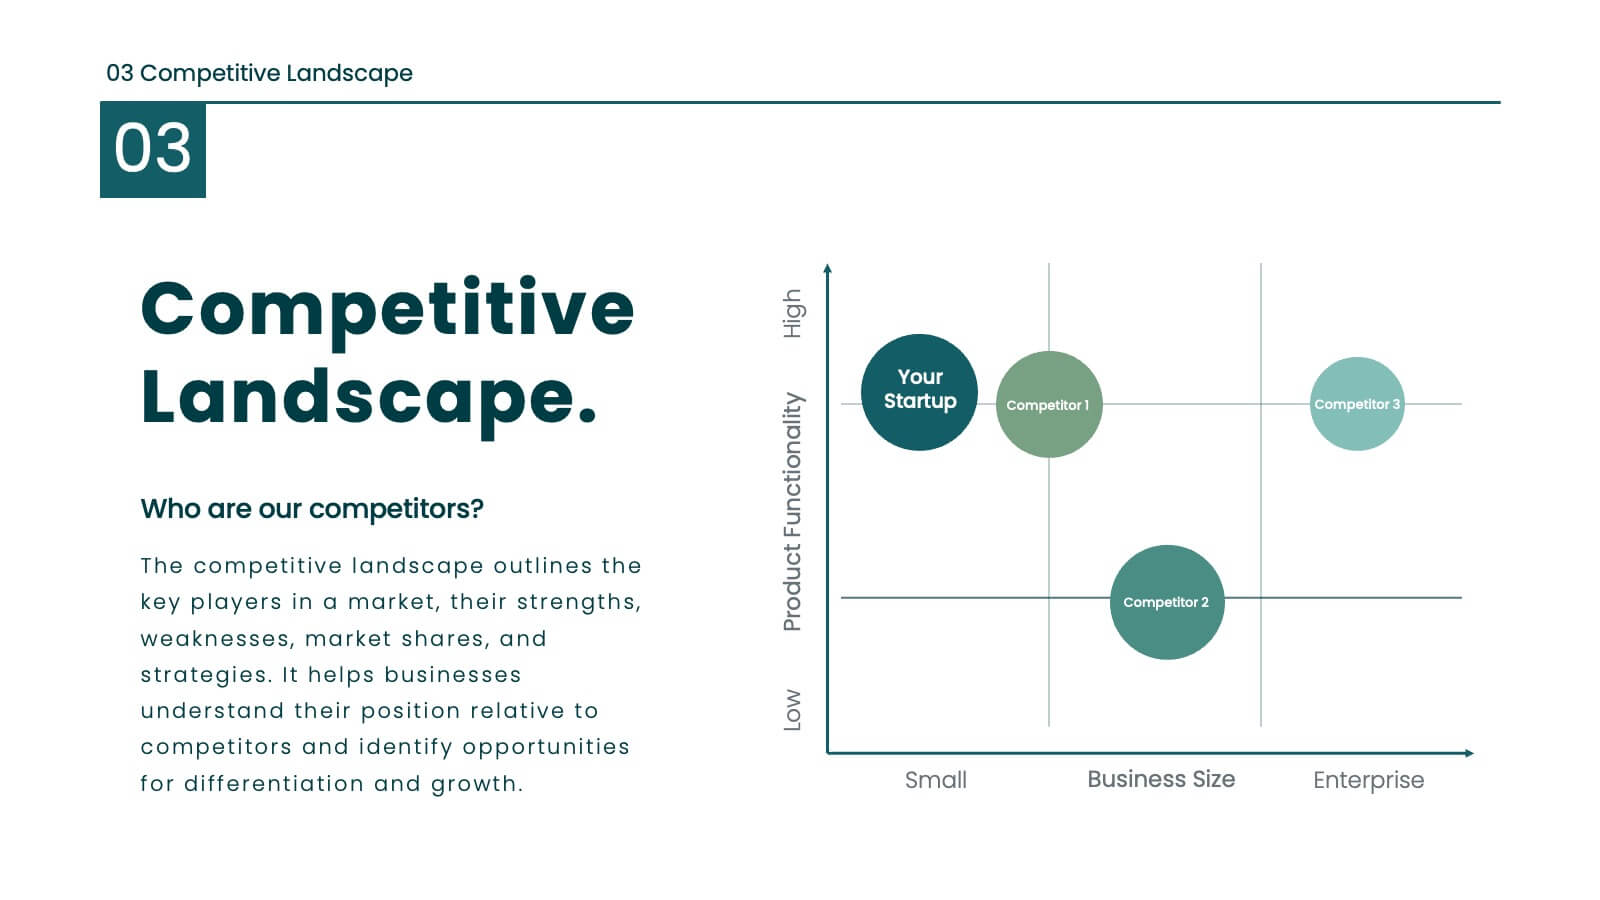
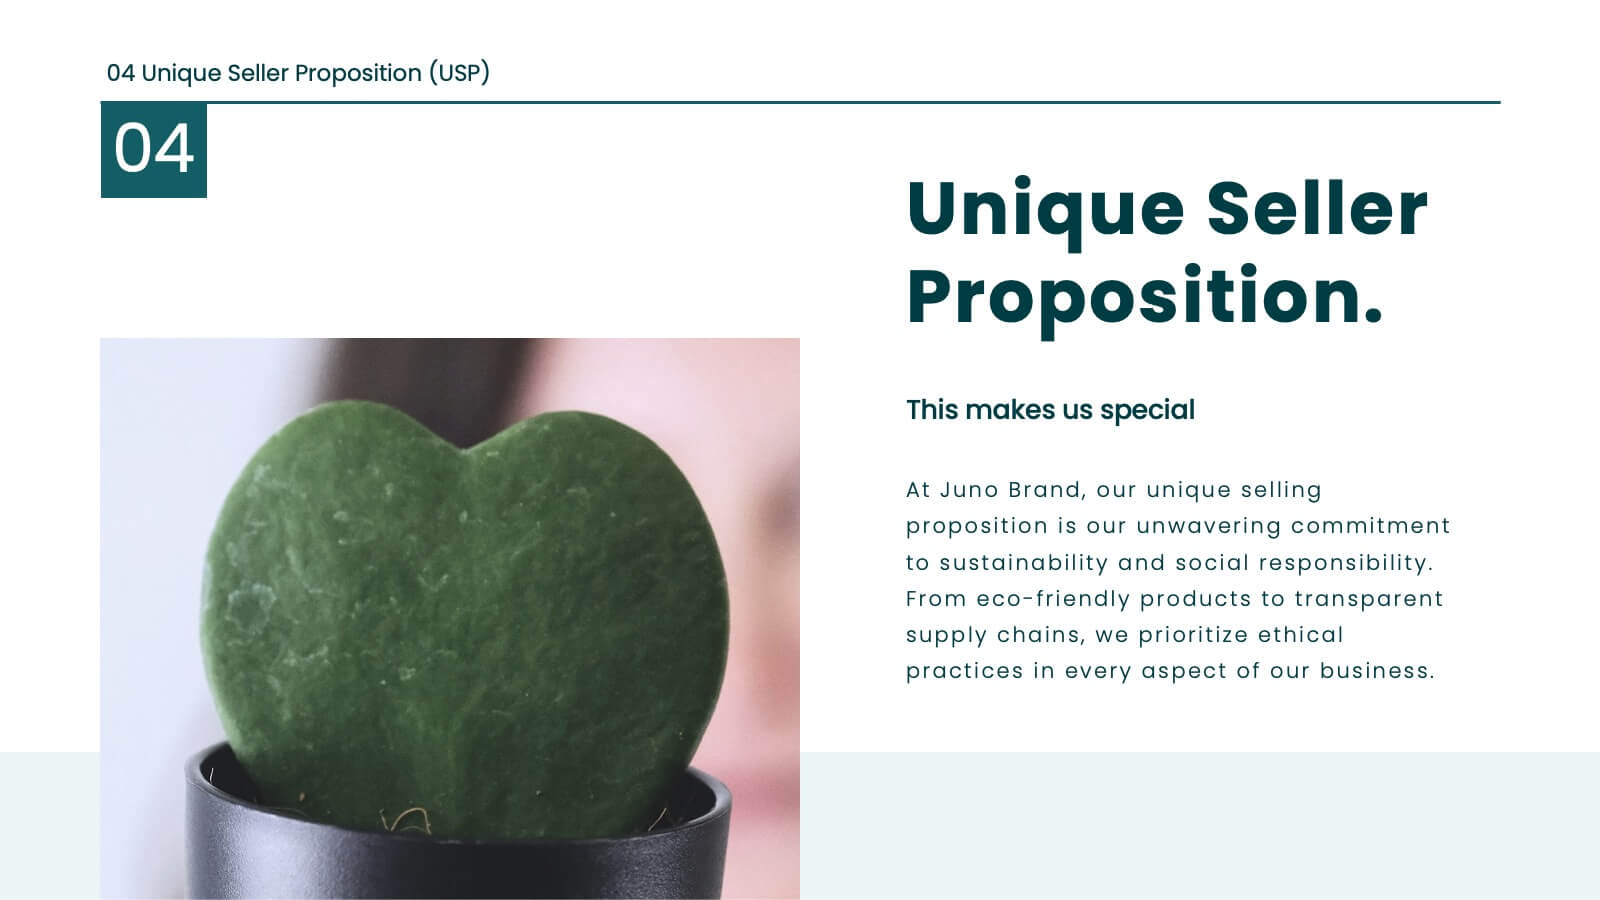
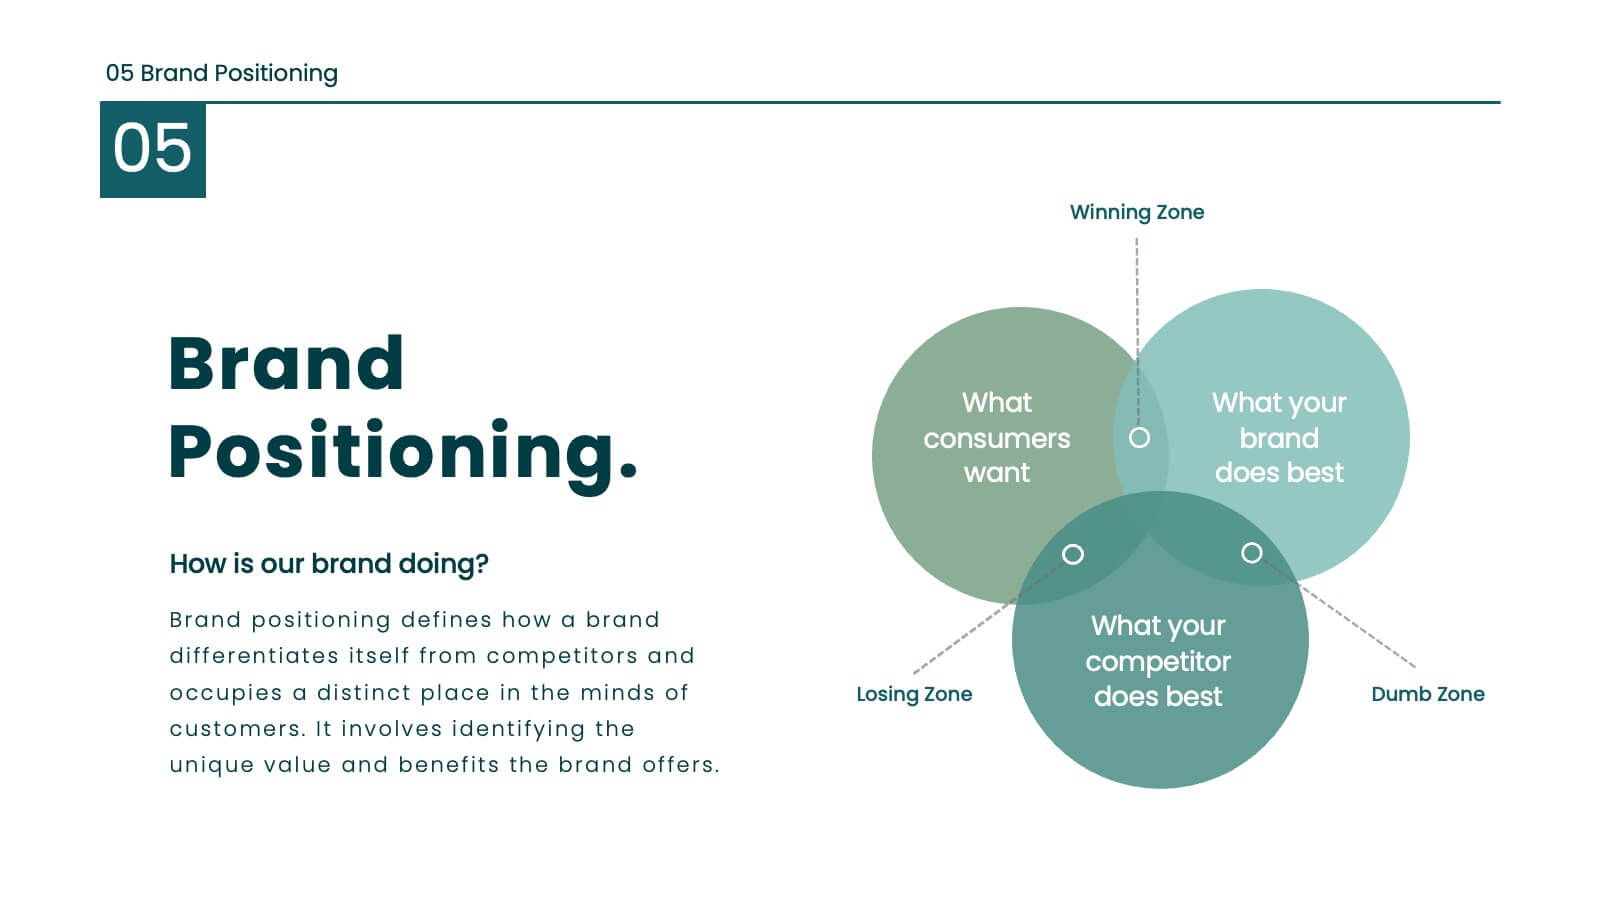
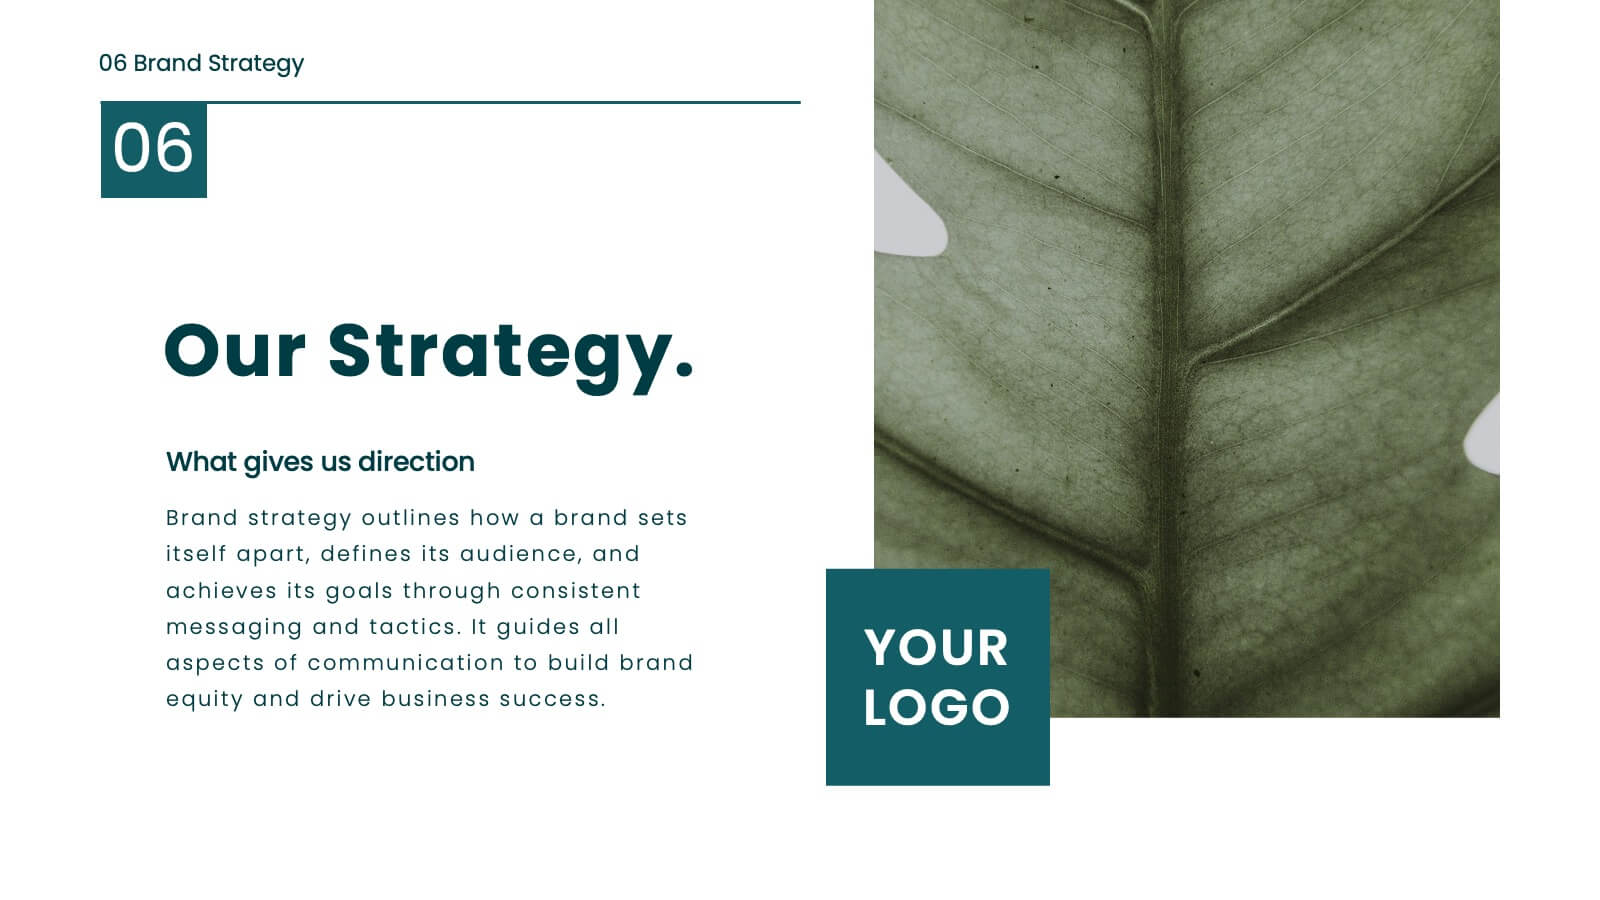
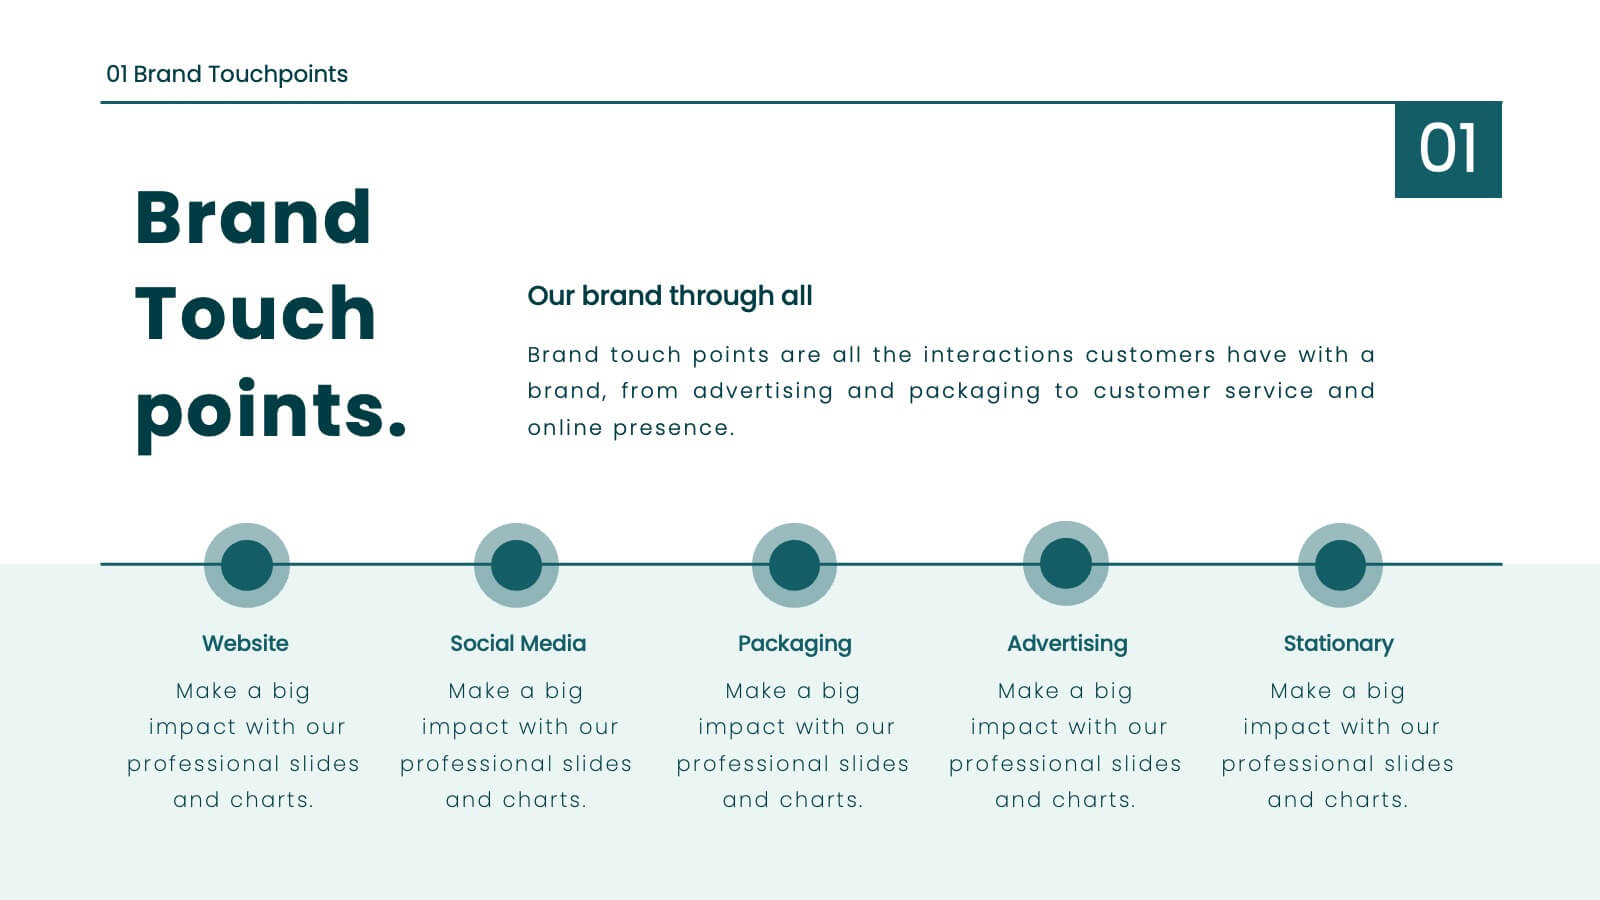
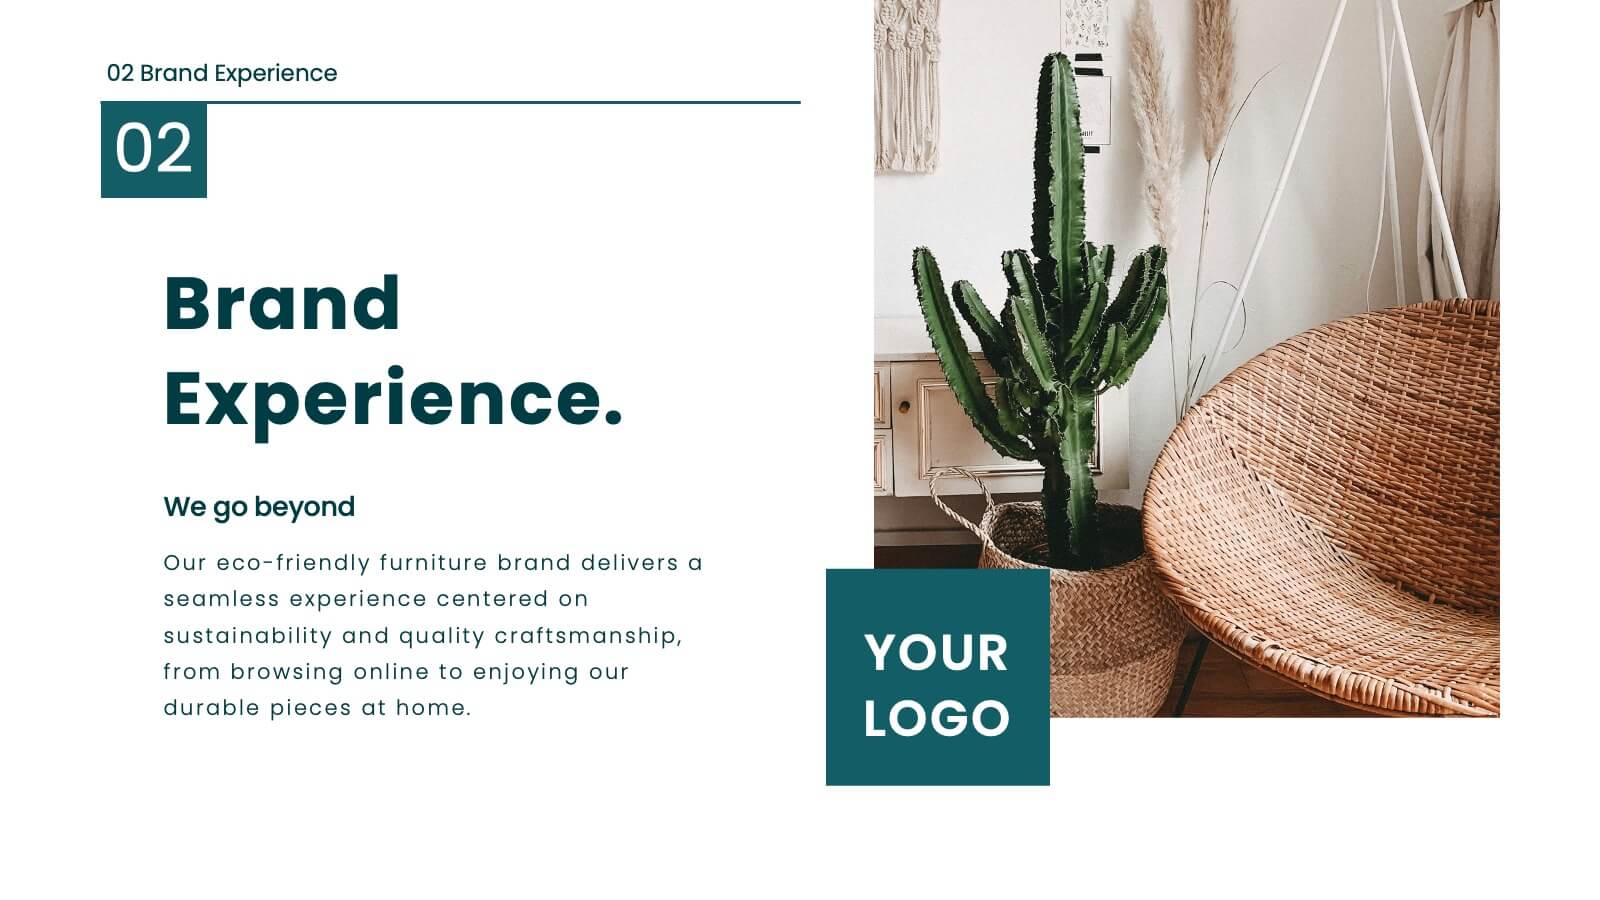
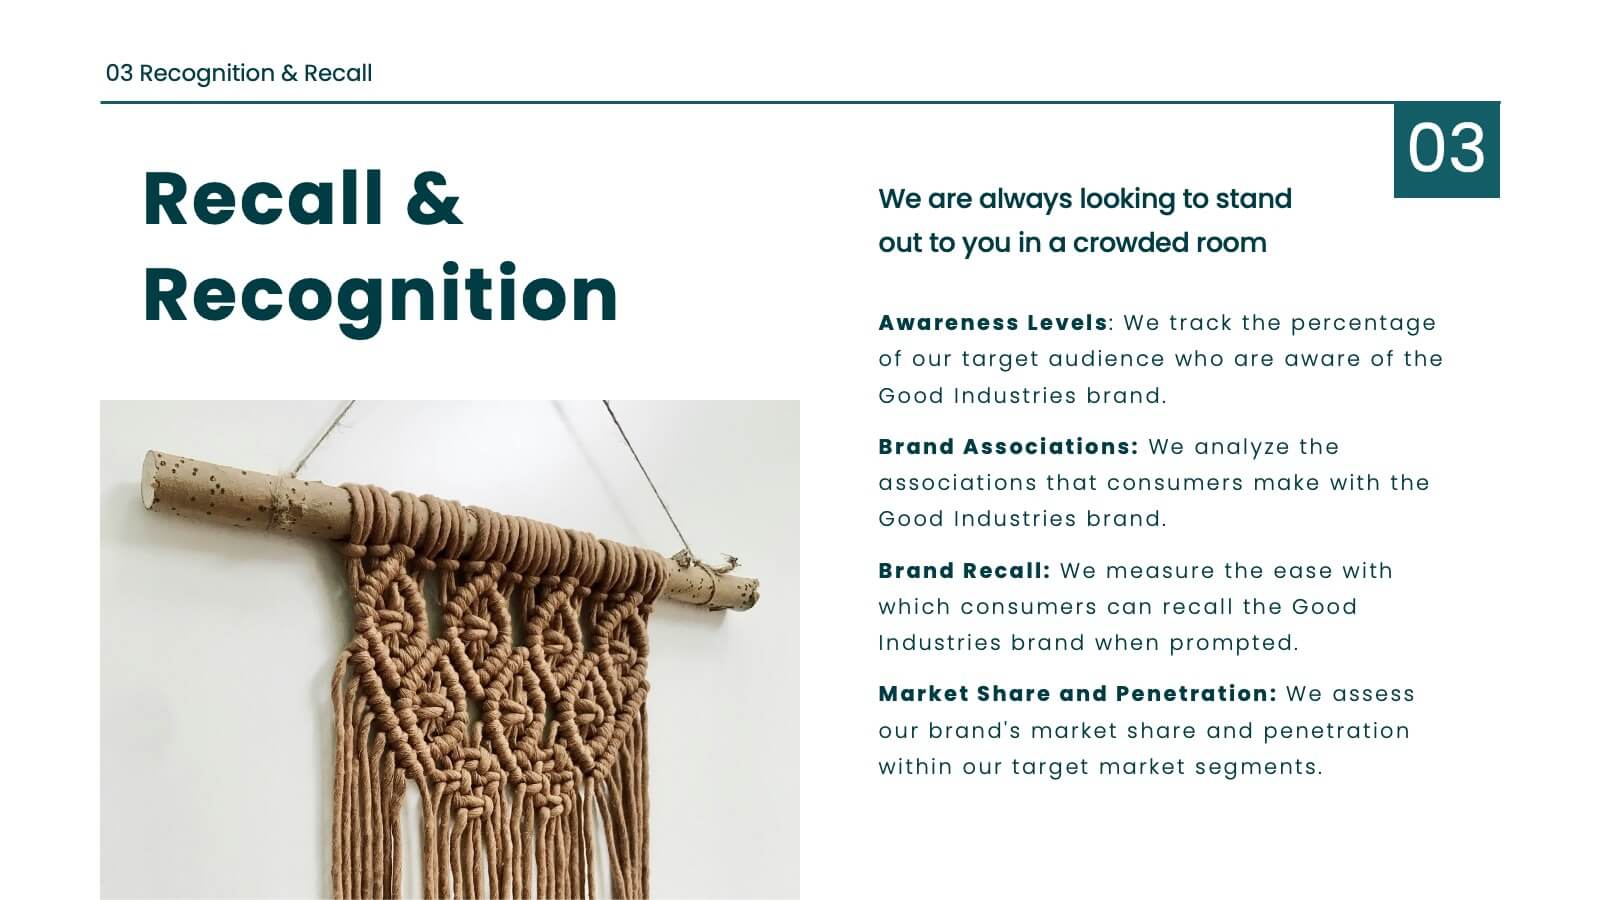
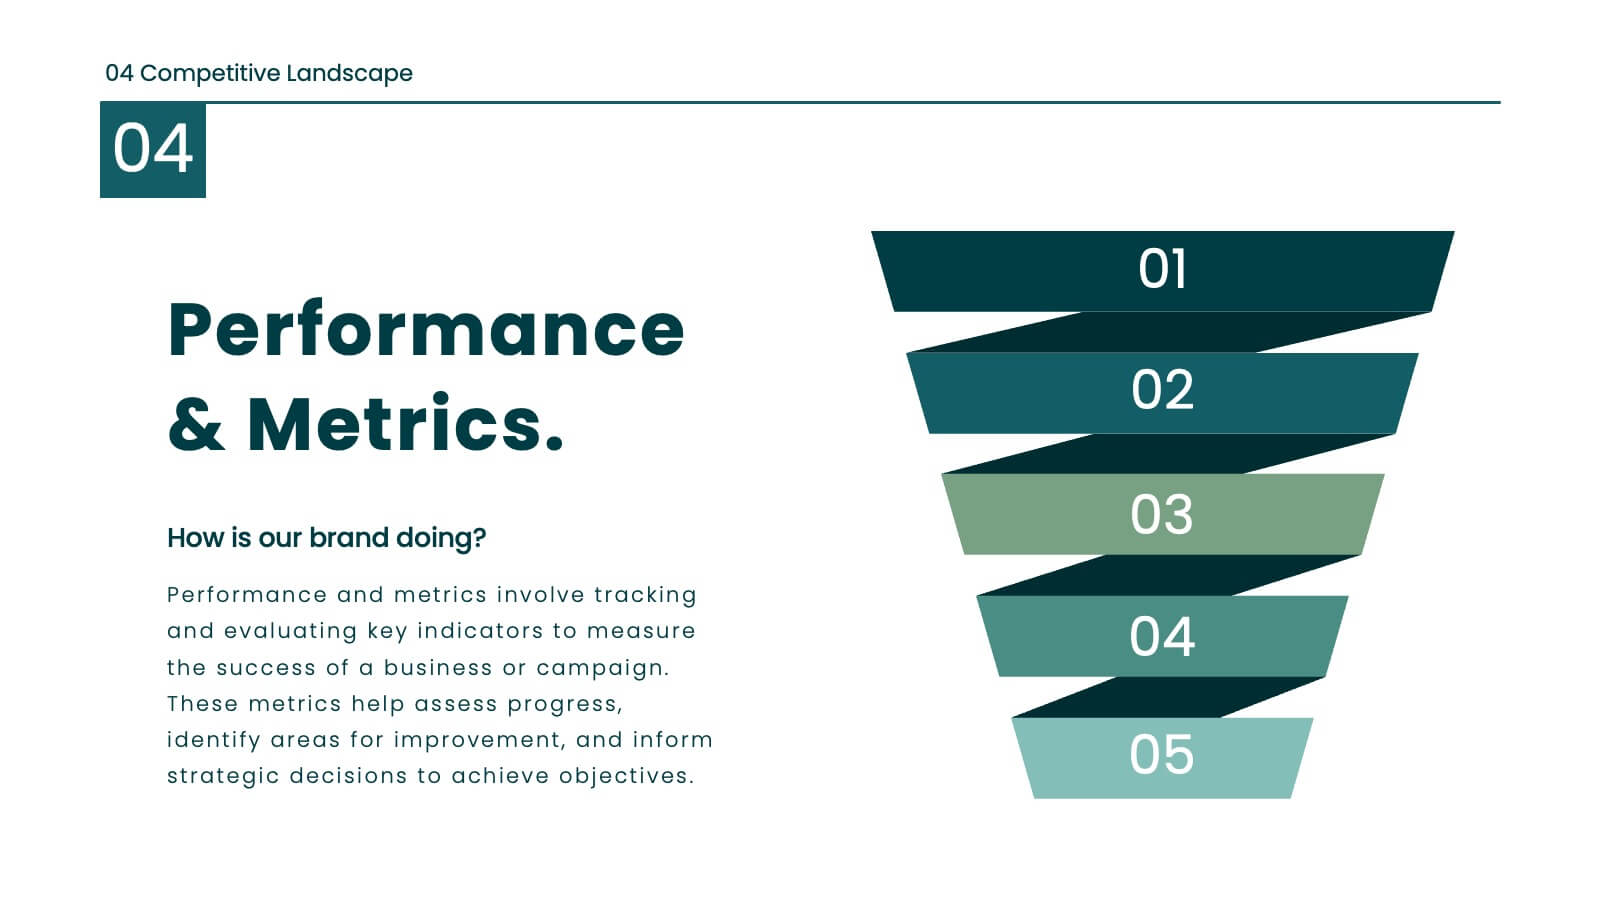
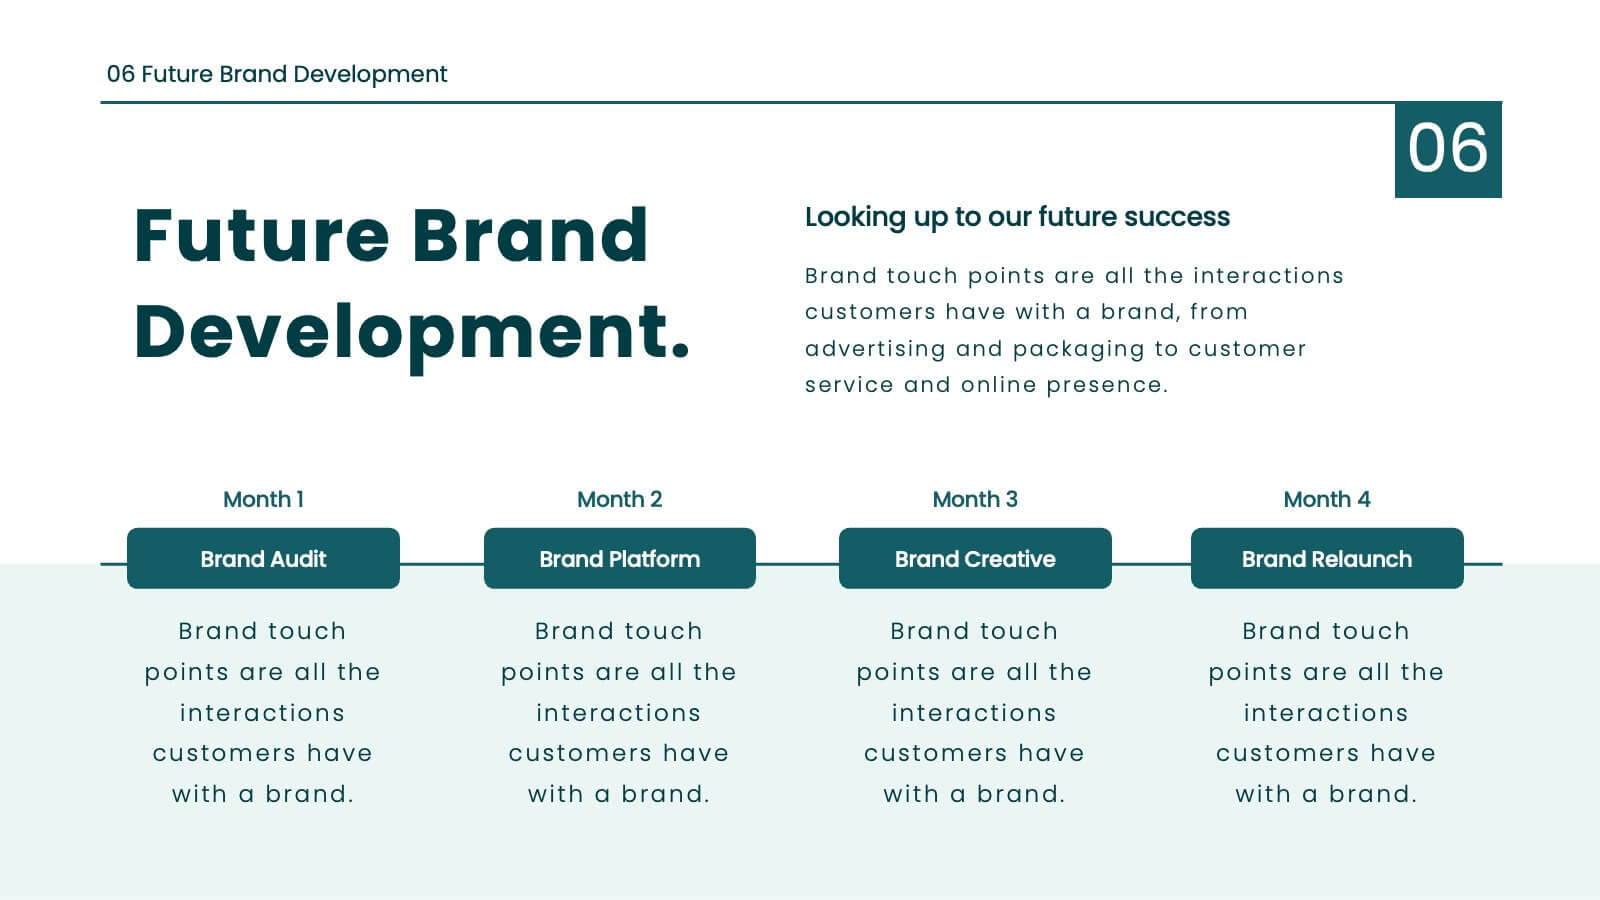
Juno Brand Guidelines Proposal Presentation
Define your brand's identity with this comprehensive, stylish presentation template. Perfect for detailing brand guidelines, vision, mission, and market analysis, it features a clean design with a professional layout. Highlight key elements like color palettes, typography, and unique selling propositions to ensure consistency and clarity. Compatible with PowerPoint, Keynote, and Google Slides, it’s ideal for any platform.


4 slides
Competitive Strategy Framework Presentation
Visualize your market position with this competitive strategy framework. Featuring a 2x2 matrix layout, this template is ideal for analyzing key strategic areas. Use the chess-themed icons and editable labels to highlight strengths, risks, and opportunities. Fully customizable in PowerPoint, Keynote, or Google Slides for strategic planning or business analysis.


4 slides
Strategic Planning Gap Assessment
Visualize growth opportunities with this Strategic Planning Gap Assessment template. Perfect for showcasing the gap between actual progression and potential performance over time. Ideal for risk evaluation, diversification, and product development planning. Fully editable for PowerPoint, Keynote, and Google Slides.


6 slides
Ideas Connection Venn Presentation Design
Present interconnected ideas with creativity and impact using the Ideas Connection Venn Presentation Design. This colorful, lightbulb-themed 5-section layout helps you visualize related concepts or stages, ideal for brainstorming, innovation mapping, or content planning. Each segment includes icons, titles, and descriptions to showcase your thoughts clearly. Fully customizable in PowerPoint, Keynote, and Google Slides.


6 slides
Business Success Case Study
Showcase your brand's impact with this clean, image-forward case study slide. Designed for storytelling, it outlines the Problem, Solution, and Approach alongside a product image—perfect for client wins, pitch decks, and brand storytelling. Fully customizable in PowerPoint, Keynote, and Google Slides.


6 slides
Vision to Execution Business Strategy Presentation
Bridge the gap between strategic vision and operational execution with this visual funnel-style template. Ideal for mapping high-level goals to tactical outcomes, this slide helps communicate transformation processes, business initiatives, or product strategies. Fully editable in PowerPoint, Keynote, or Google Slides for strategic planning, leadership sessions, or roadmap presentations.