


Features
- 4 Unique slides
- Fully editable and easy to edit in Microsoft Powerpoint, Keynote and Google Slides
- 16:9 widescreen layout
- Clean and professional designs
- Export to JPG, PDF or send by email


Do you have any questions?
Recommend


8 slides
Team Roles & Skills Chart Presentation
Bring your team’s strengths to life with this clean, engaging slide designed to highlight individual roles, skill levels, and key capabilities. It helps teams clearly visualize expertise, compare competencies, and communicate responsibilities with ease. Fully editable and compatible with PowerPoint, Keynote, and Google Slides.


5 slides
SWOT Matrix Diagram Presentation
Showcase key business insights with this SWOT Matrix Diagram Presentation. This clear 4-quadrant layout helps visualize your organization's Strengths, Weaknesses, Opportunities, and Threats, making it ideal for strategic planning, competitor analysis, or internal reviews. Each section includes icons and editable text placeholders for easy customization. Fully compatible with PowerPoint, Keynote, and Google Slides.


21 slides
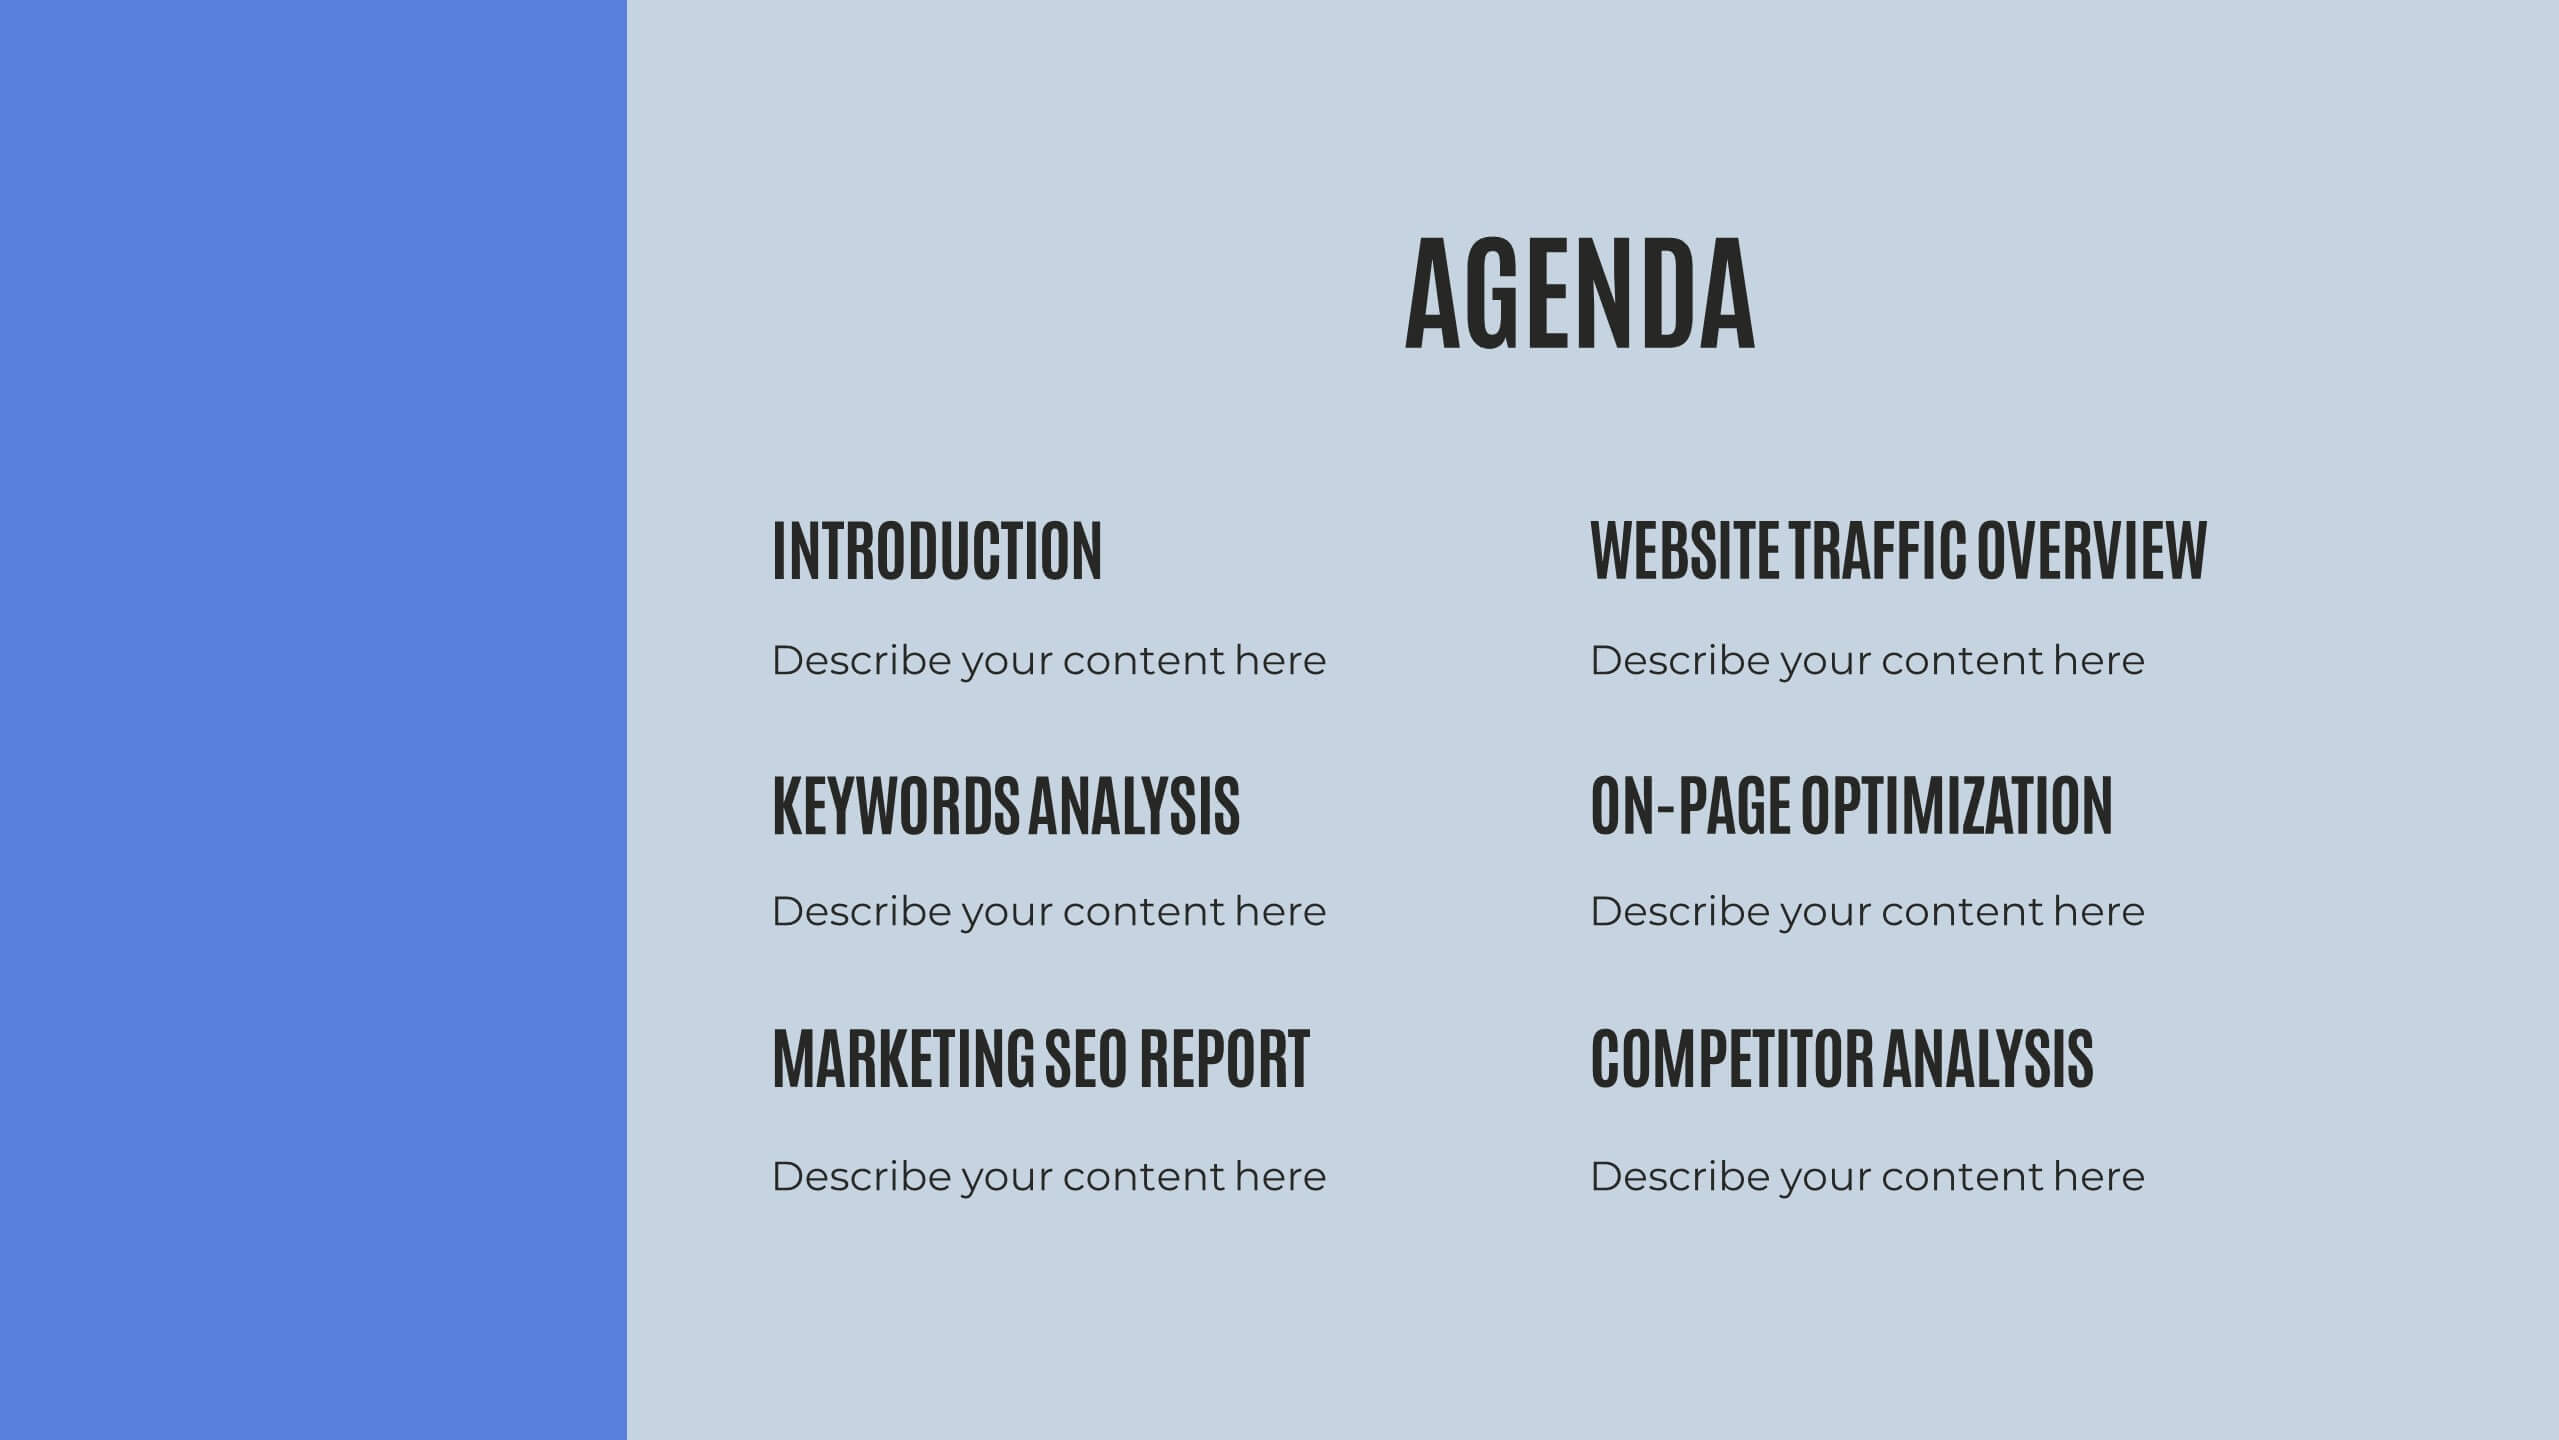
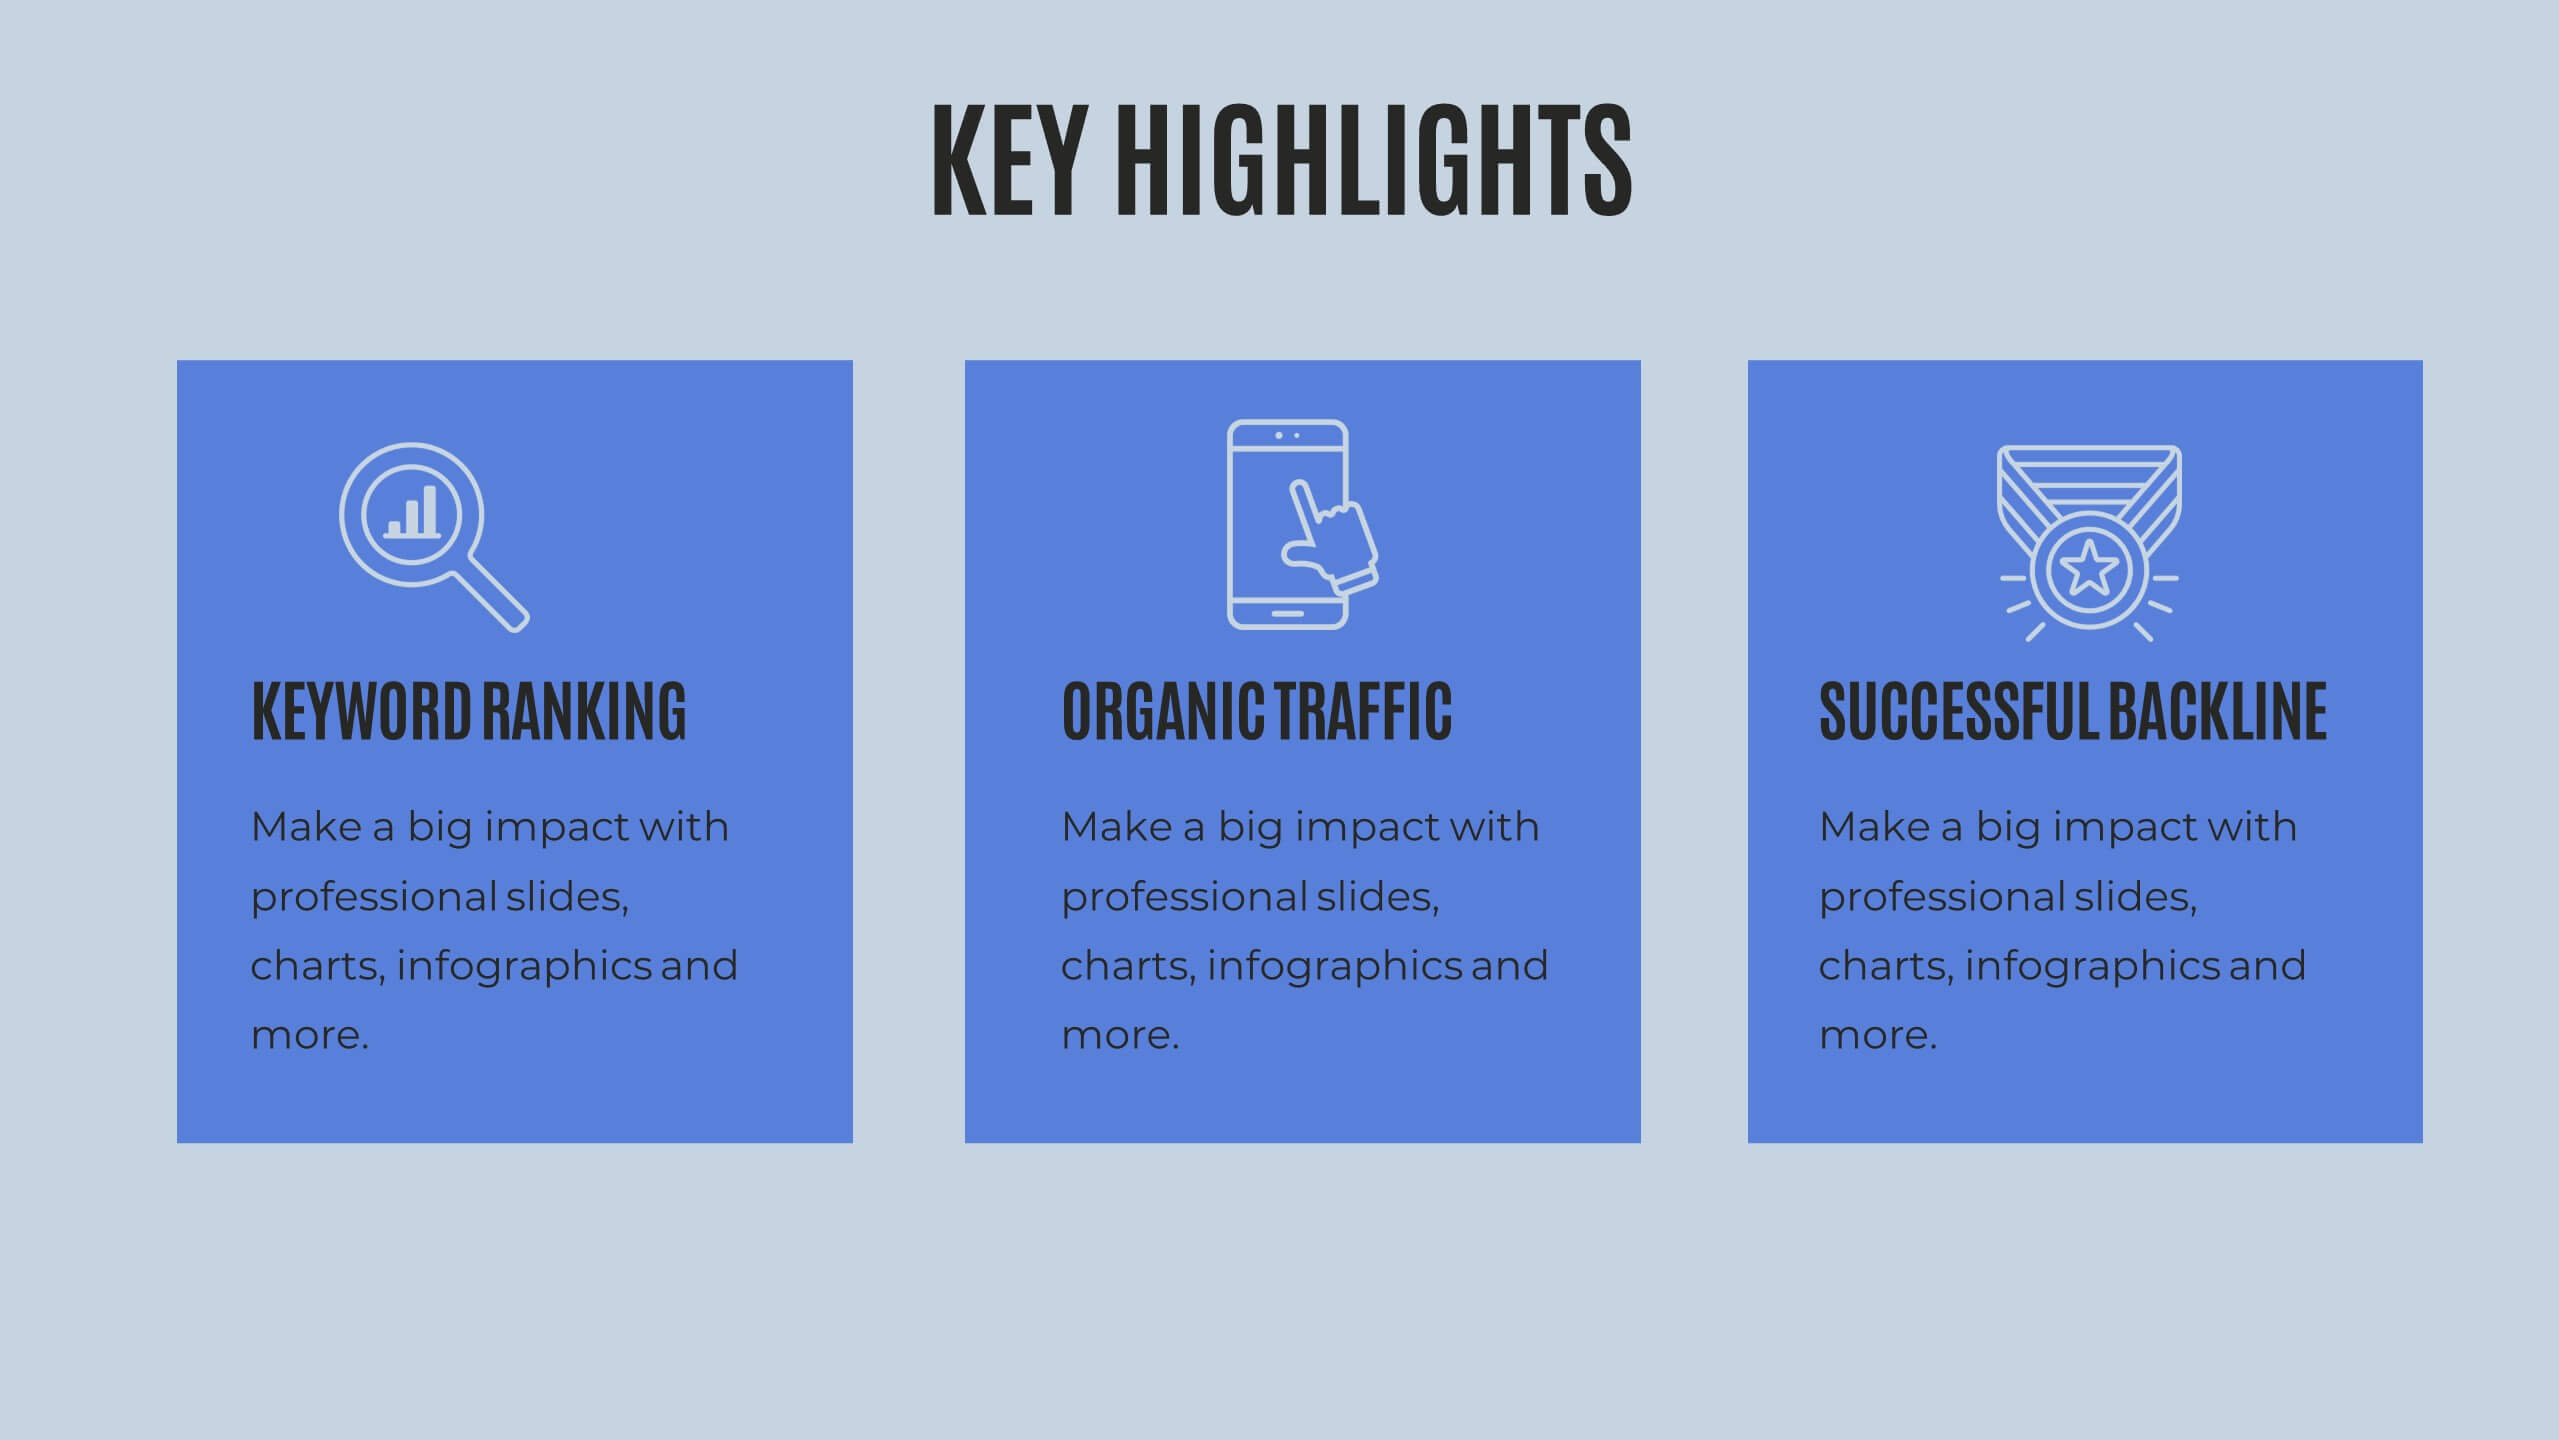
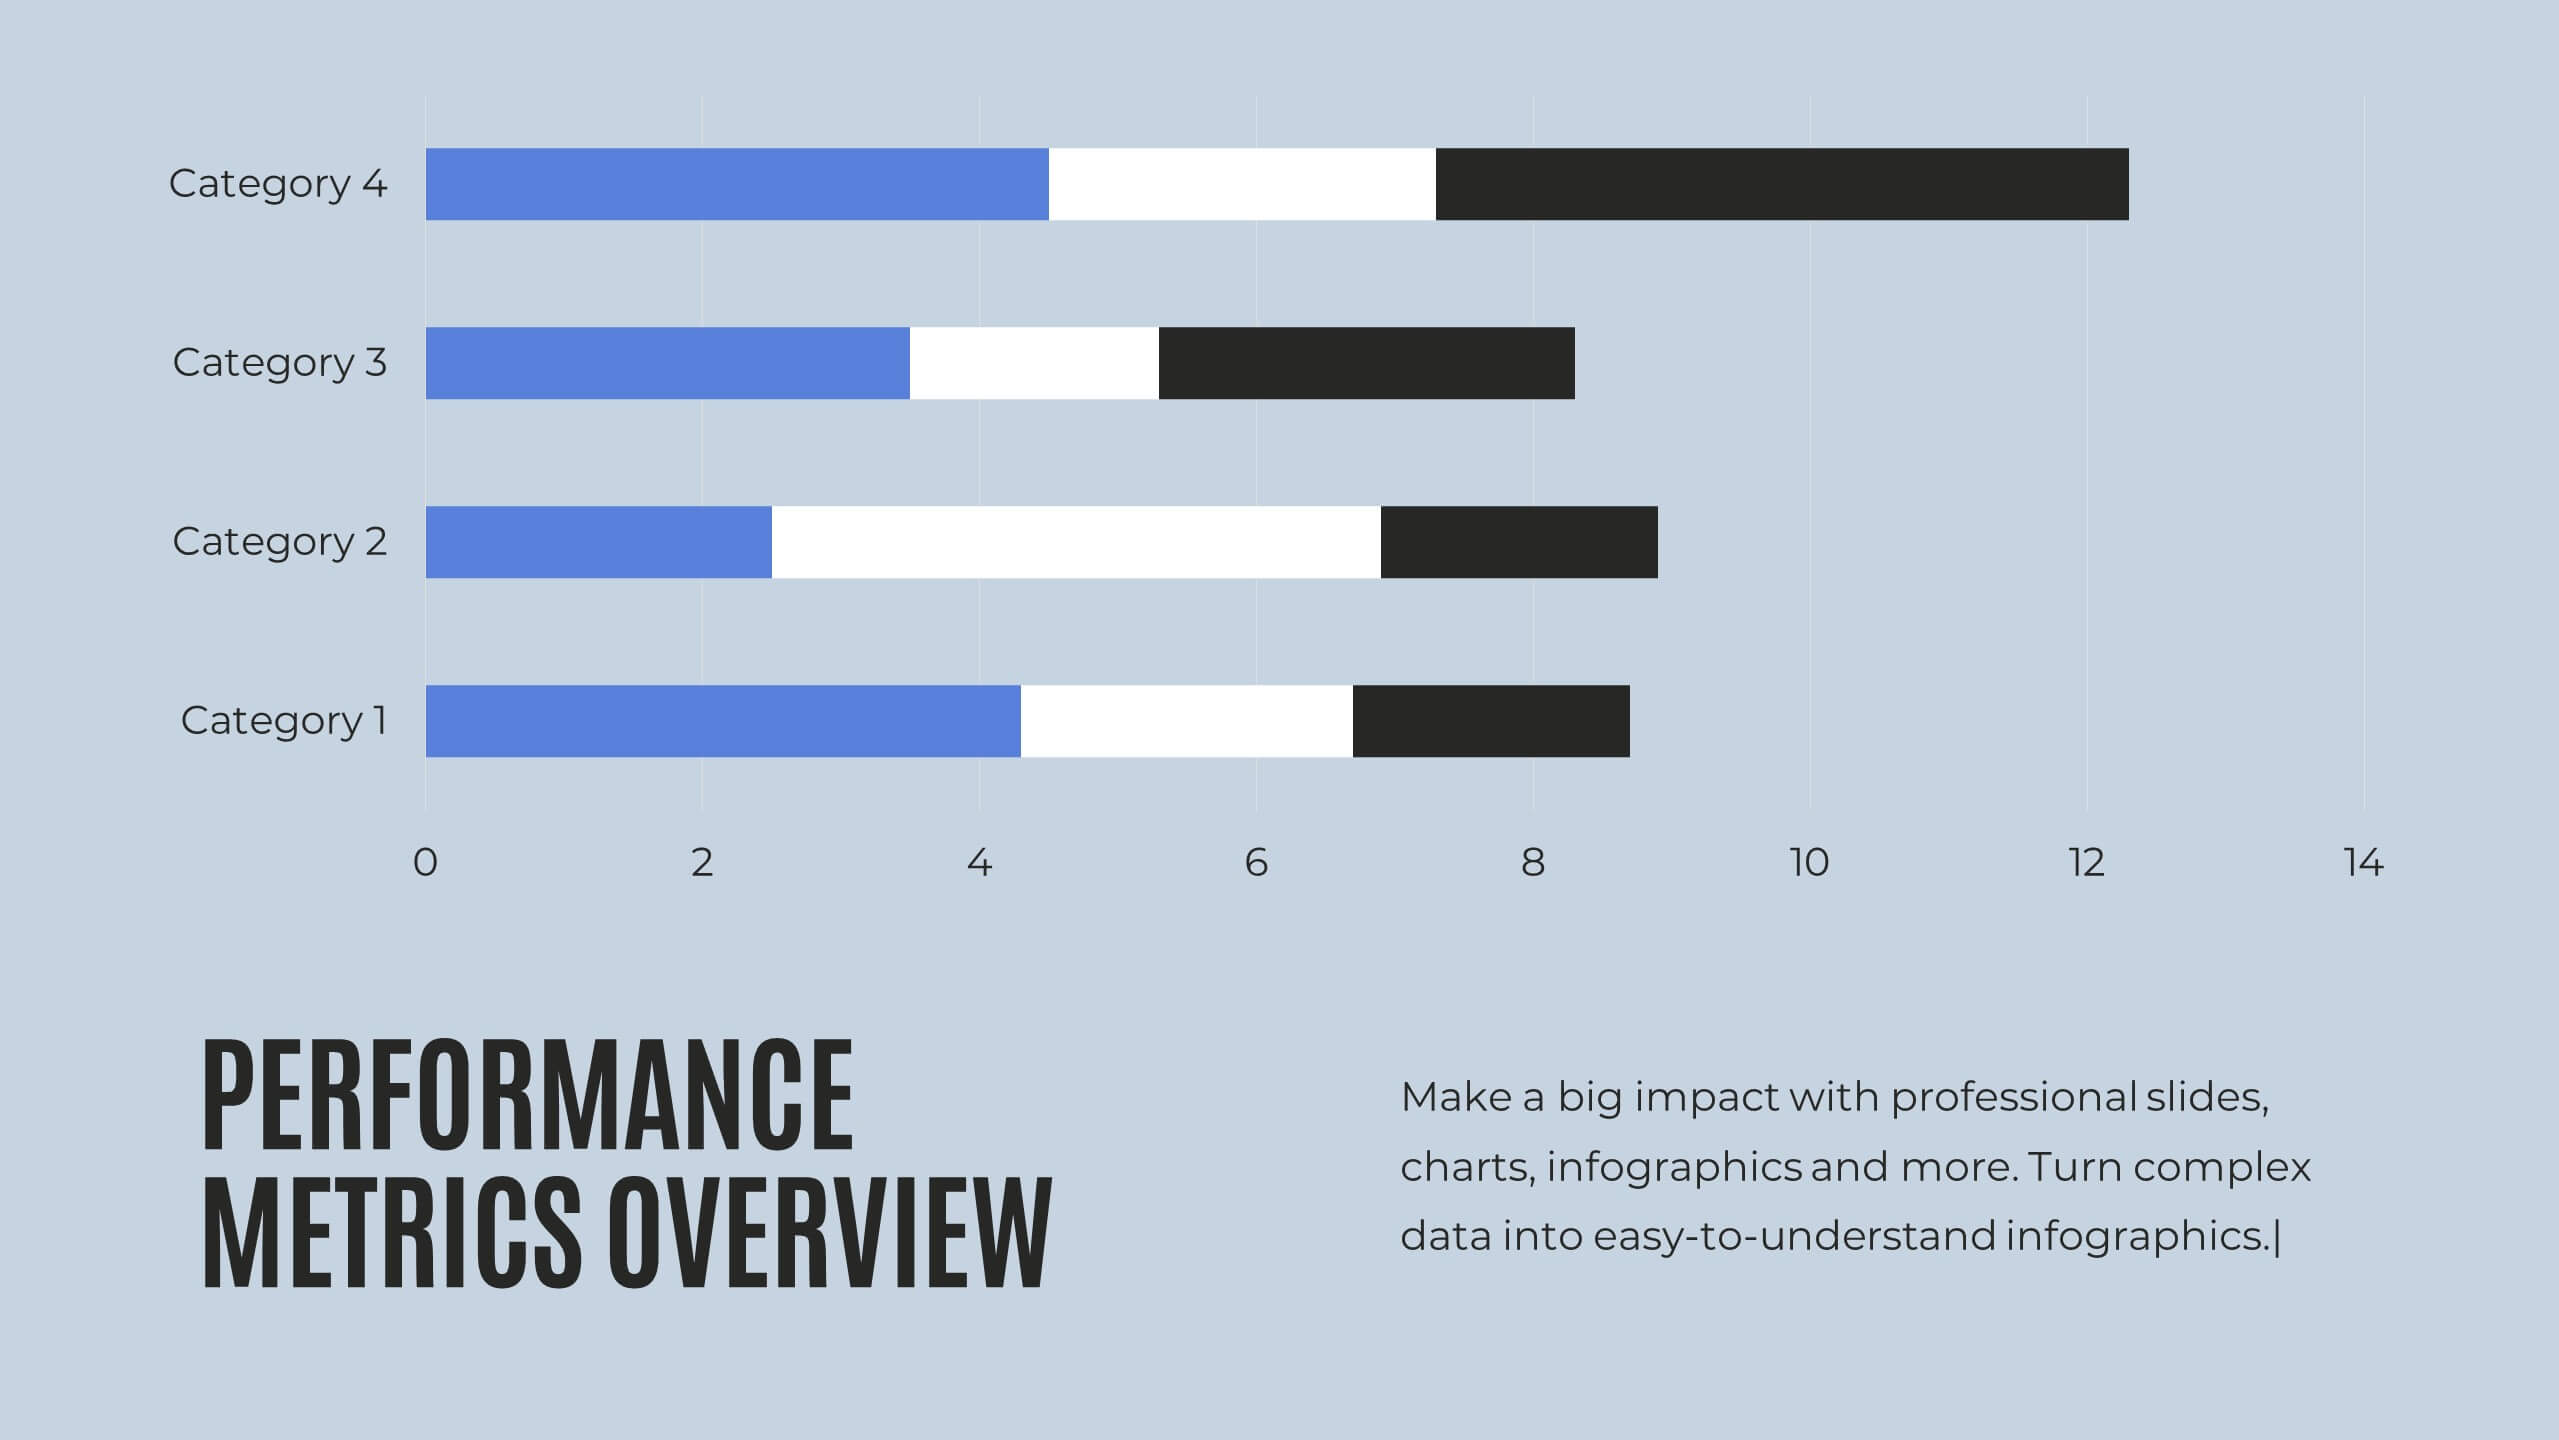
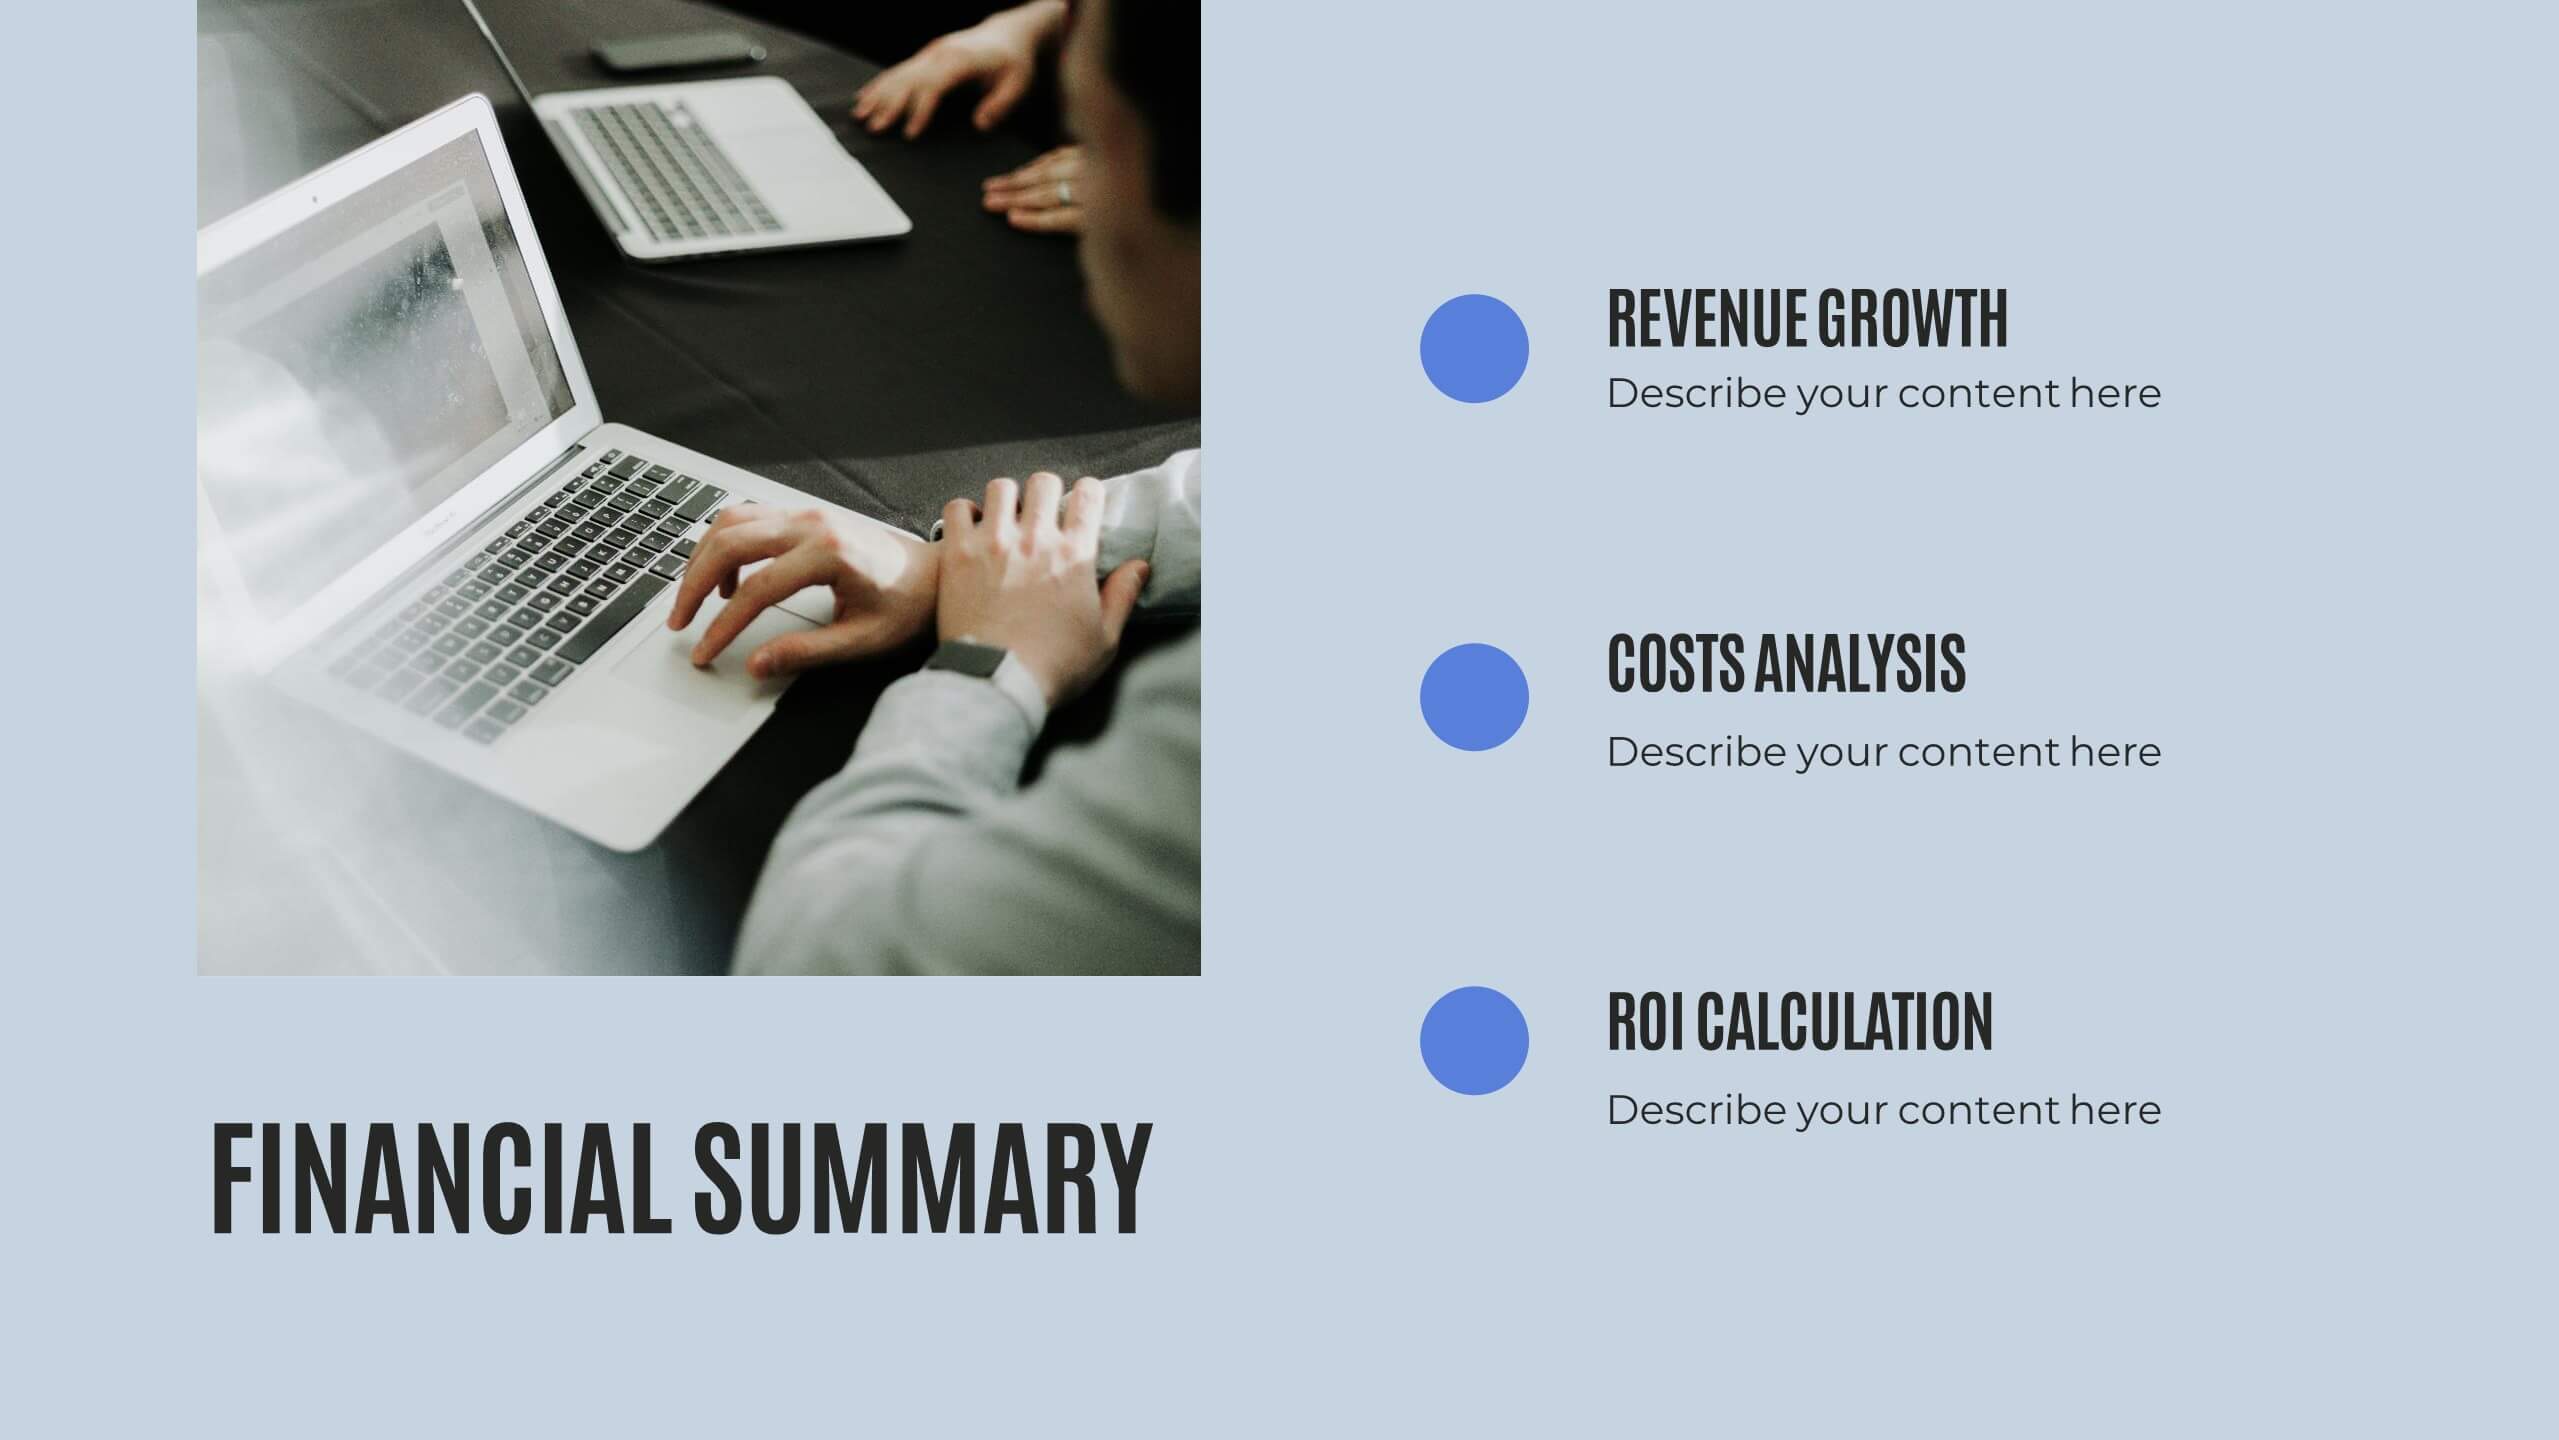
Quill Research Findings Report Presentation
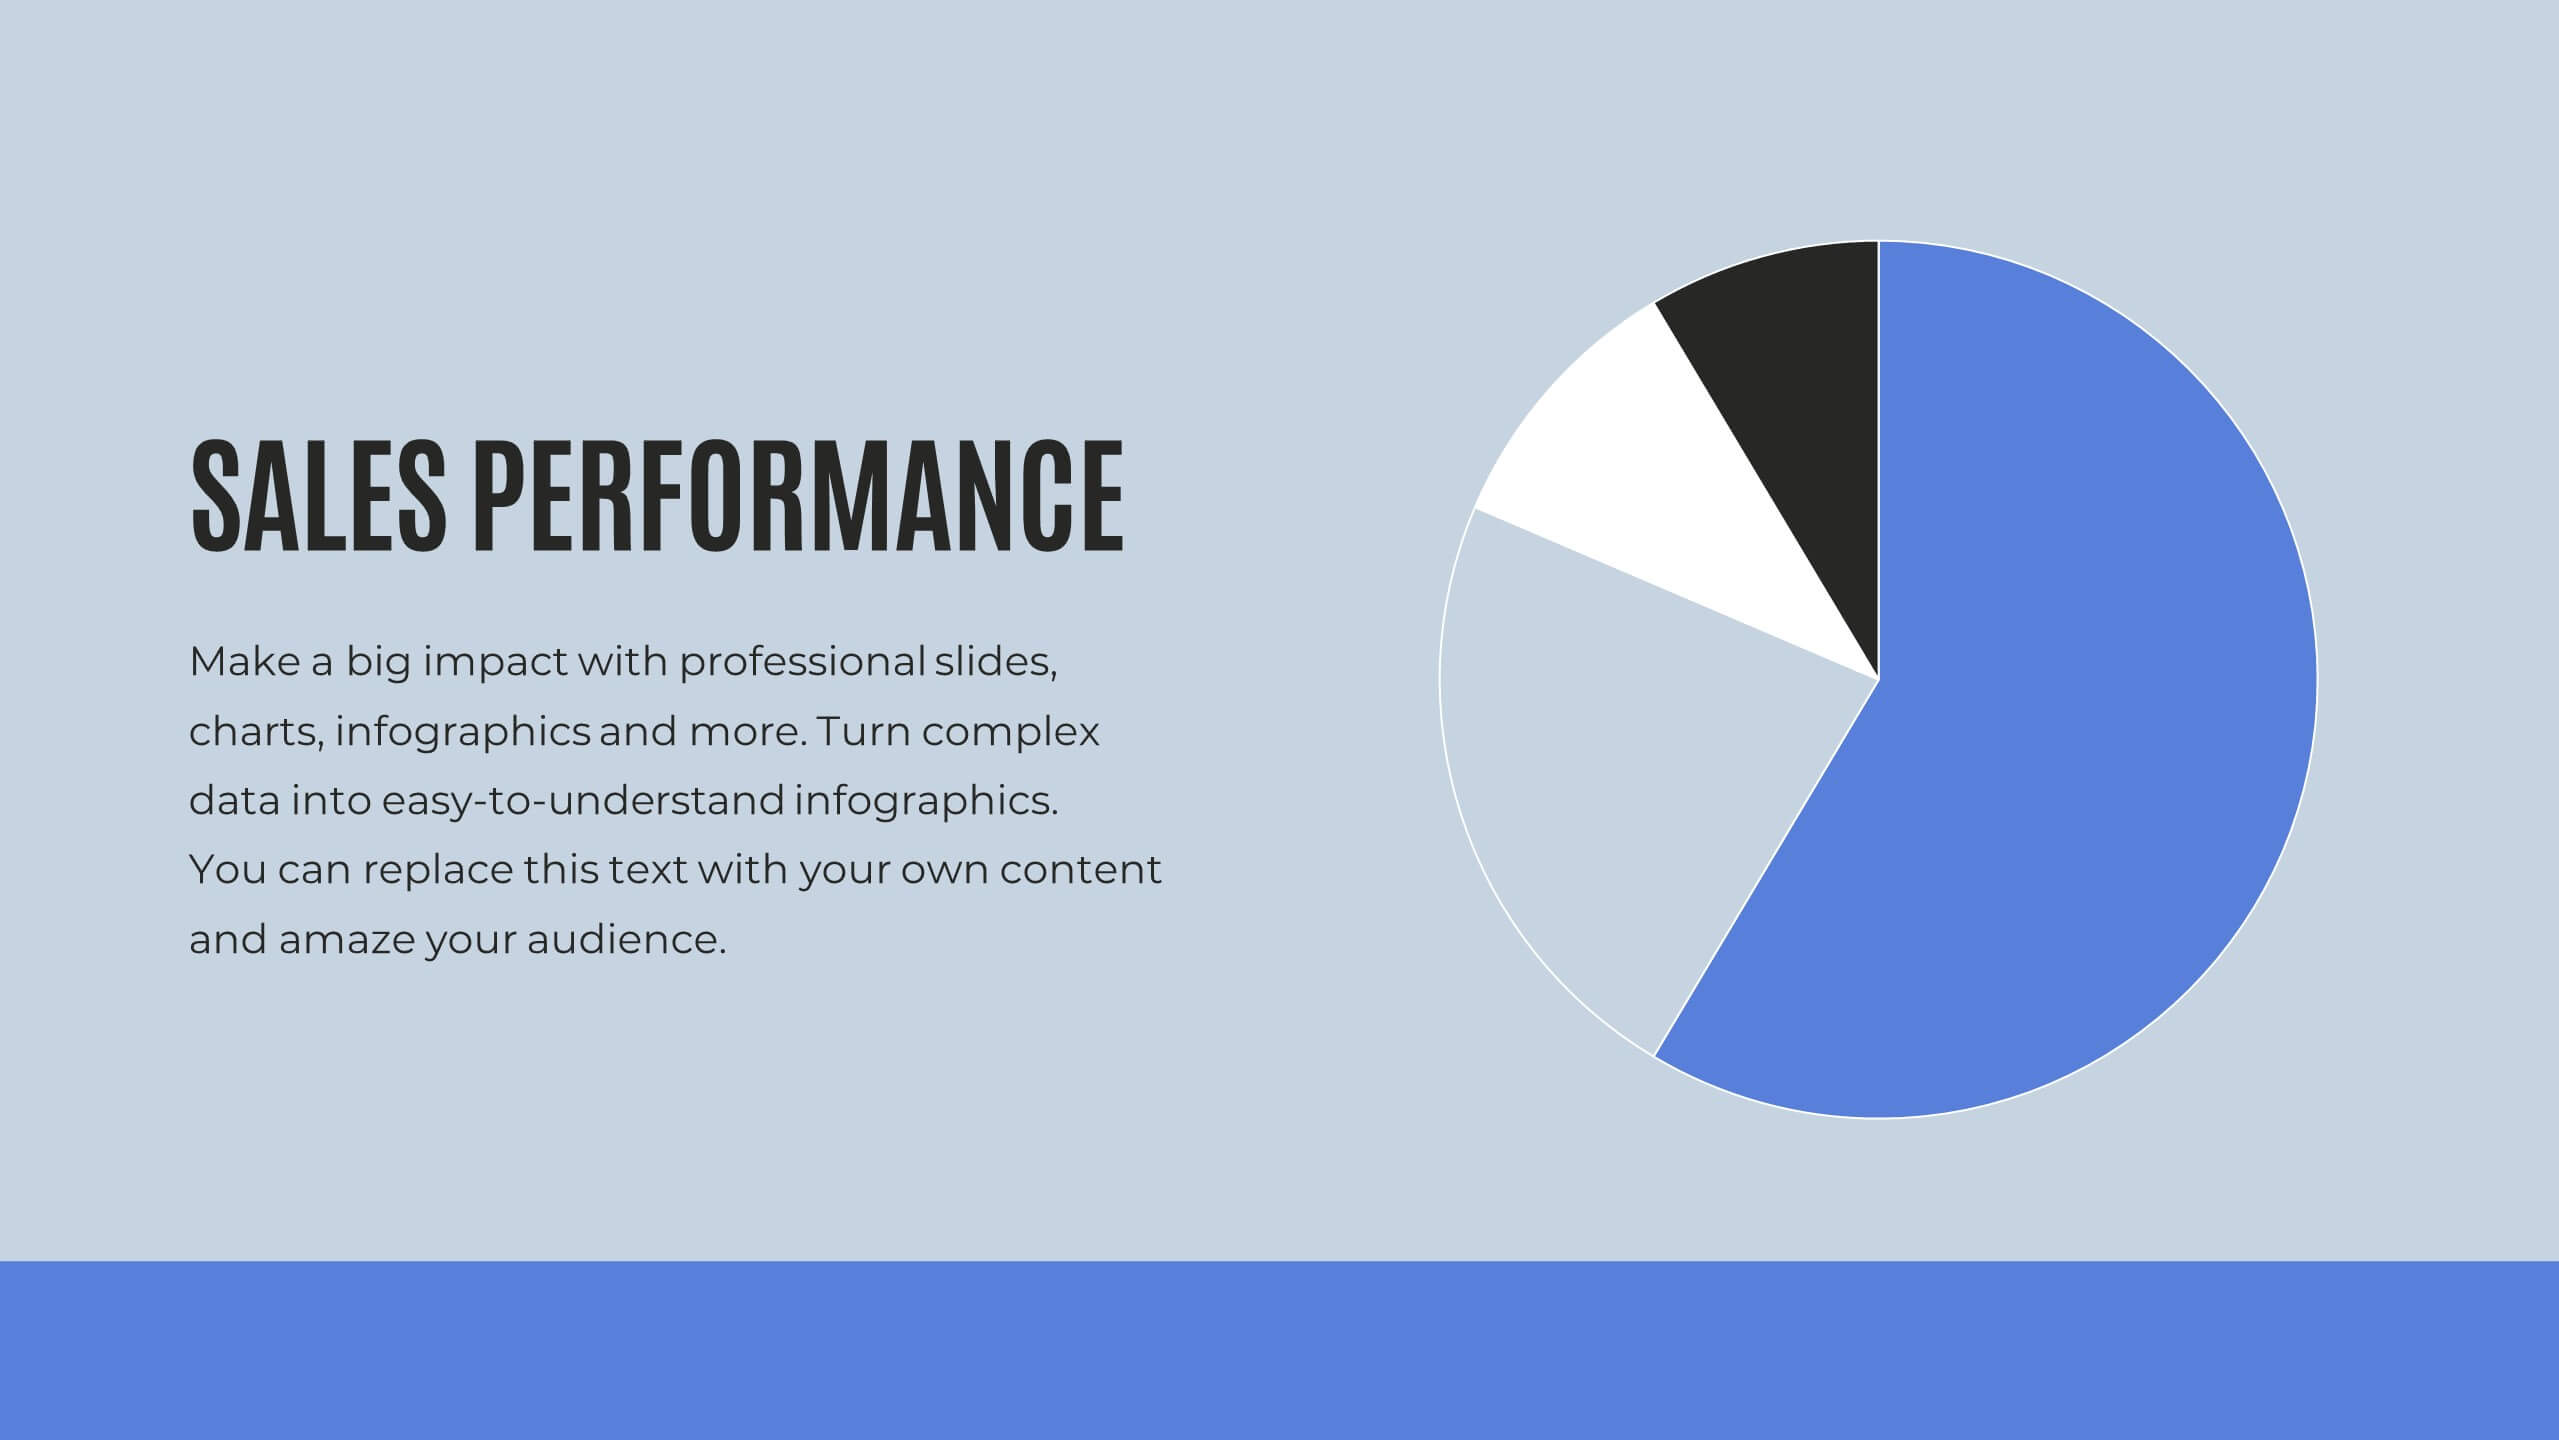
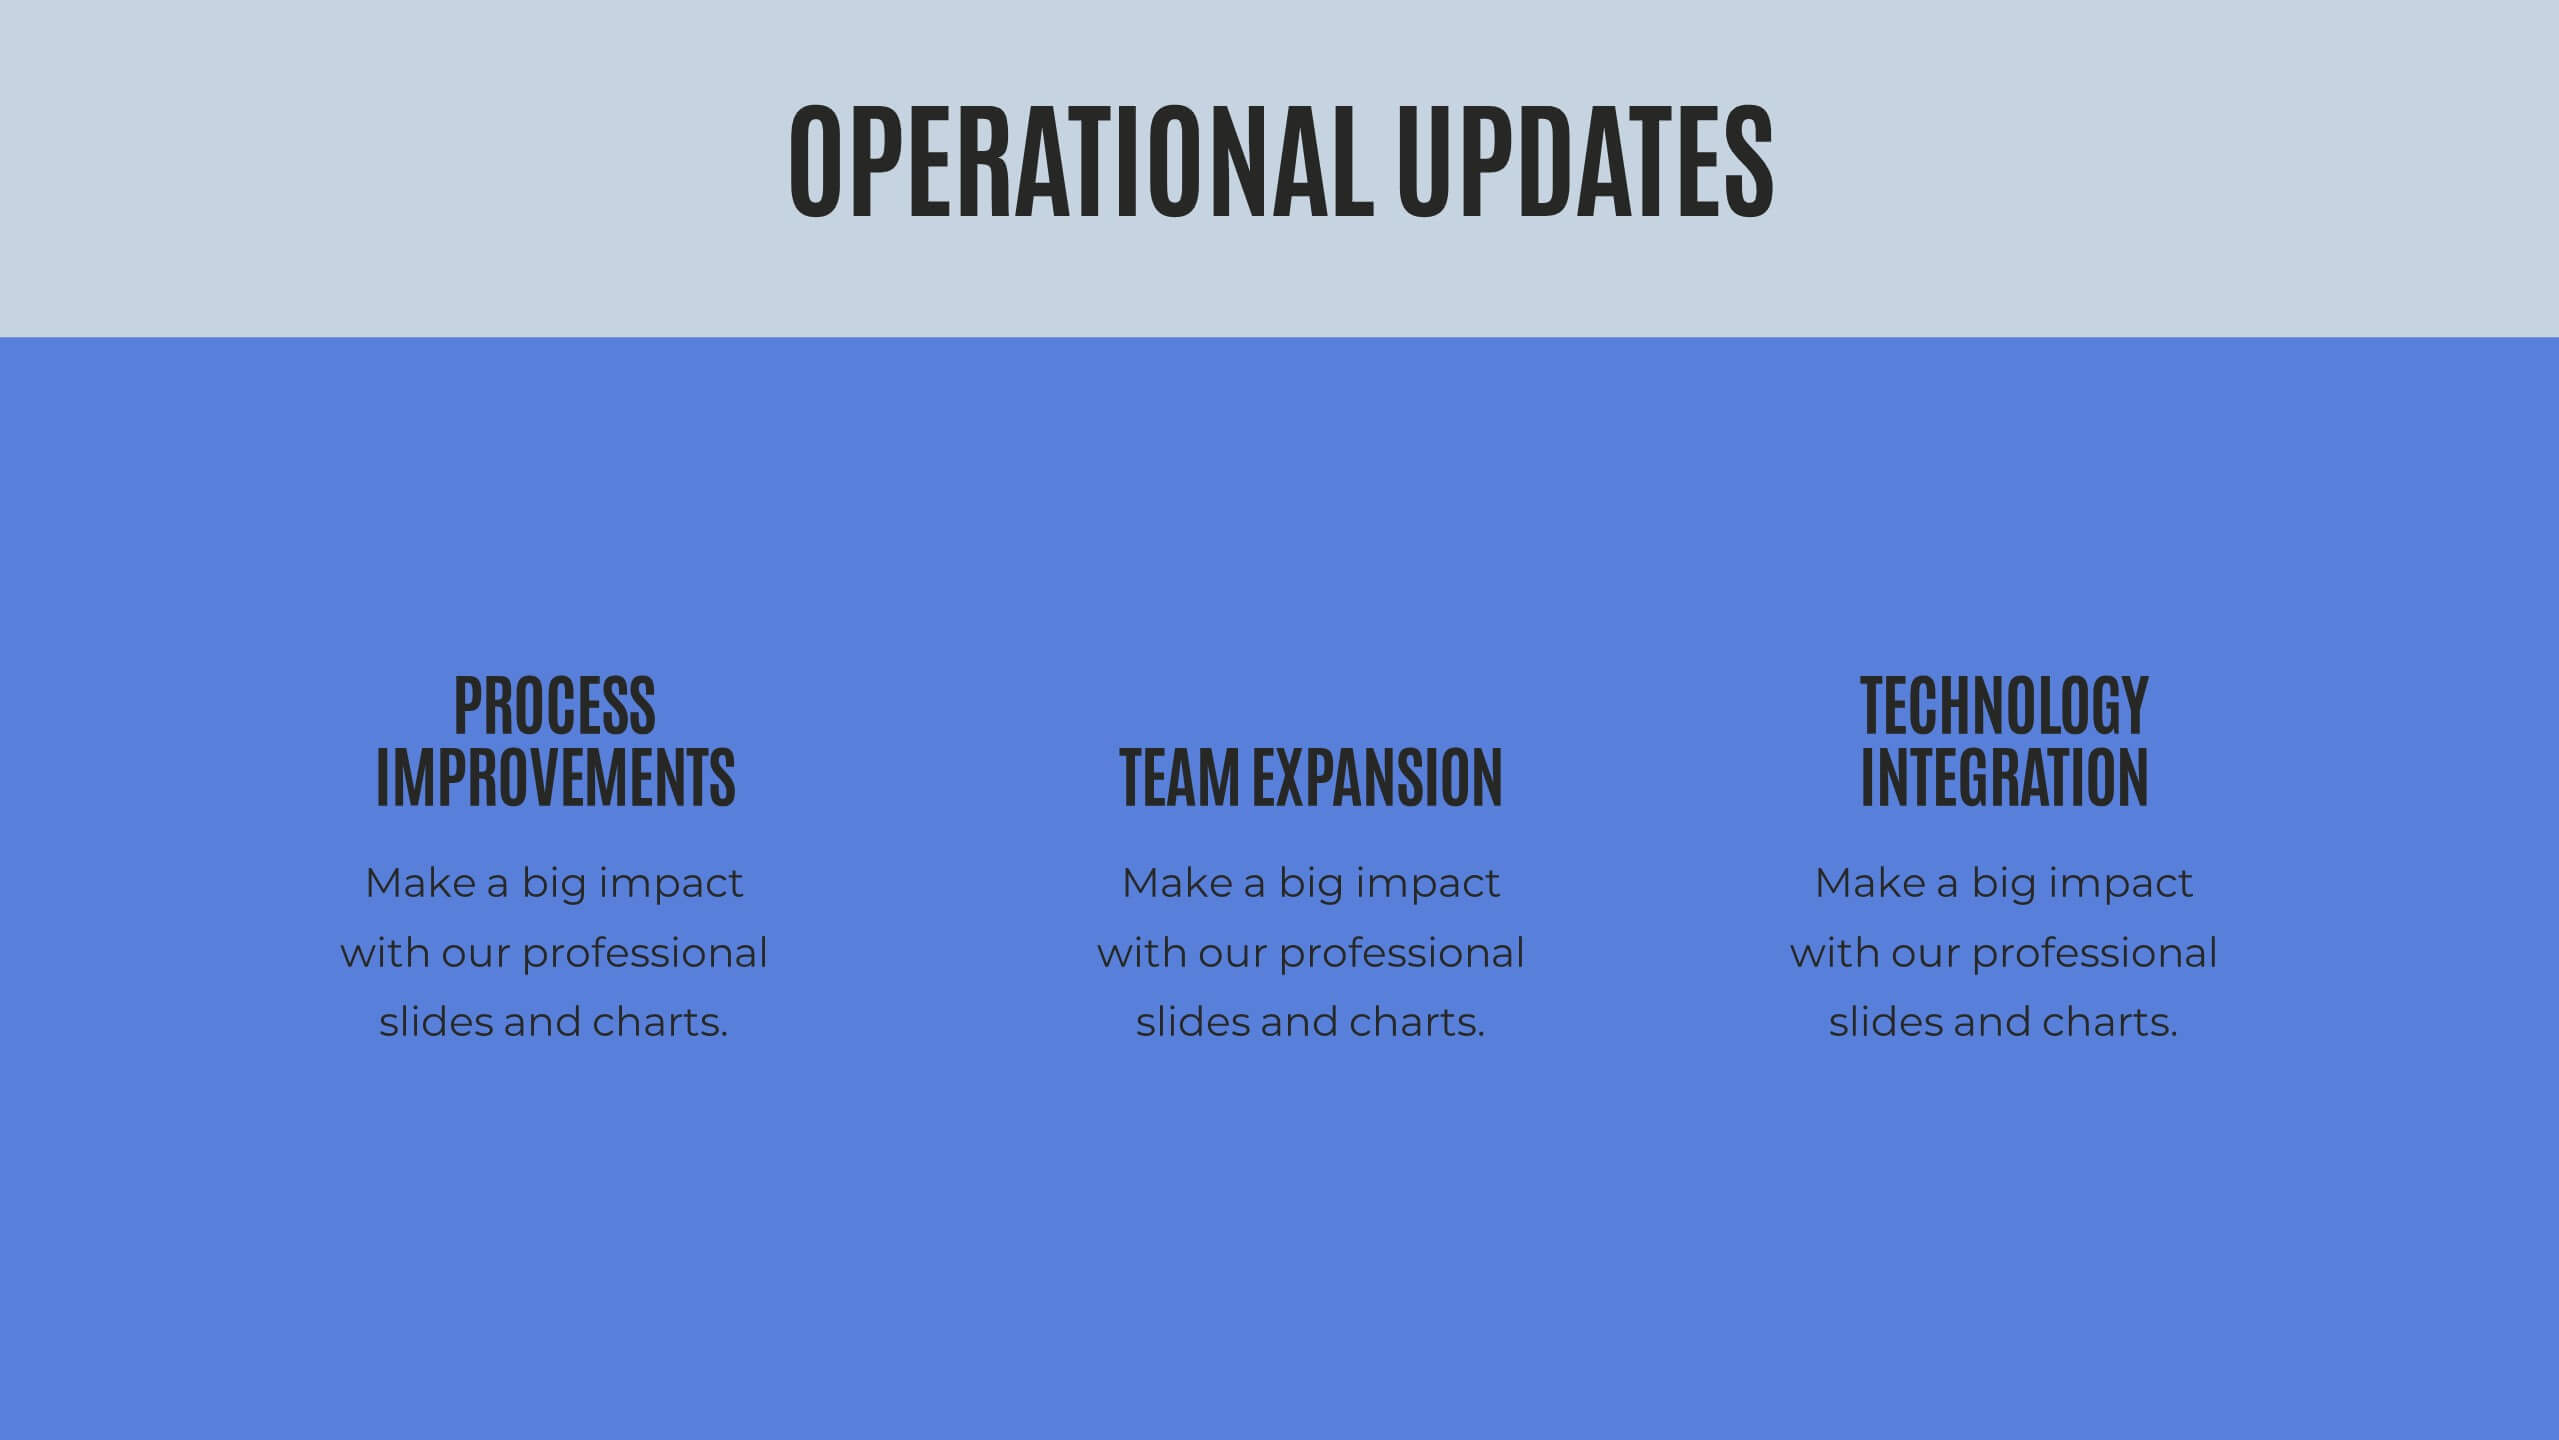
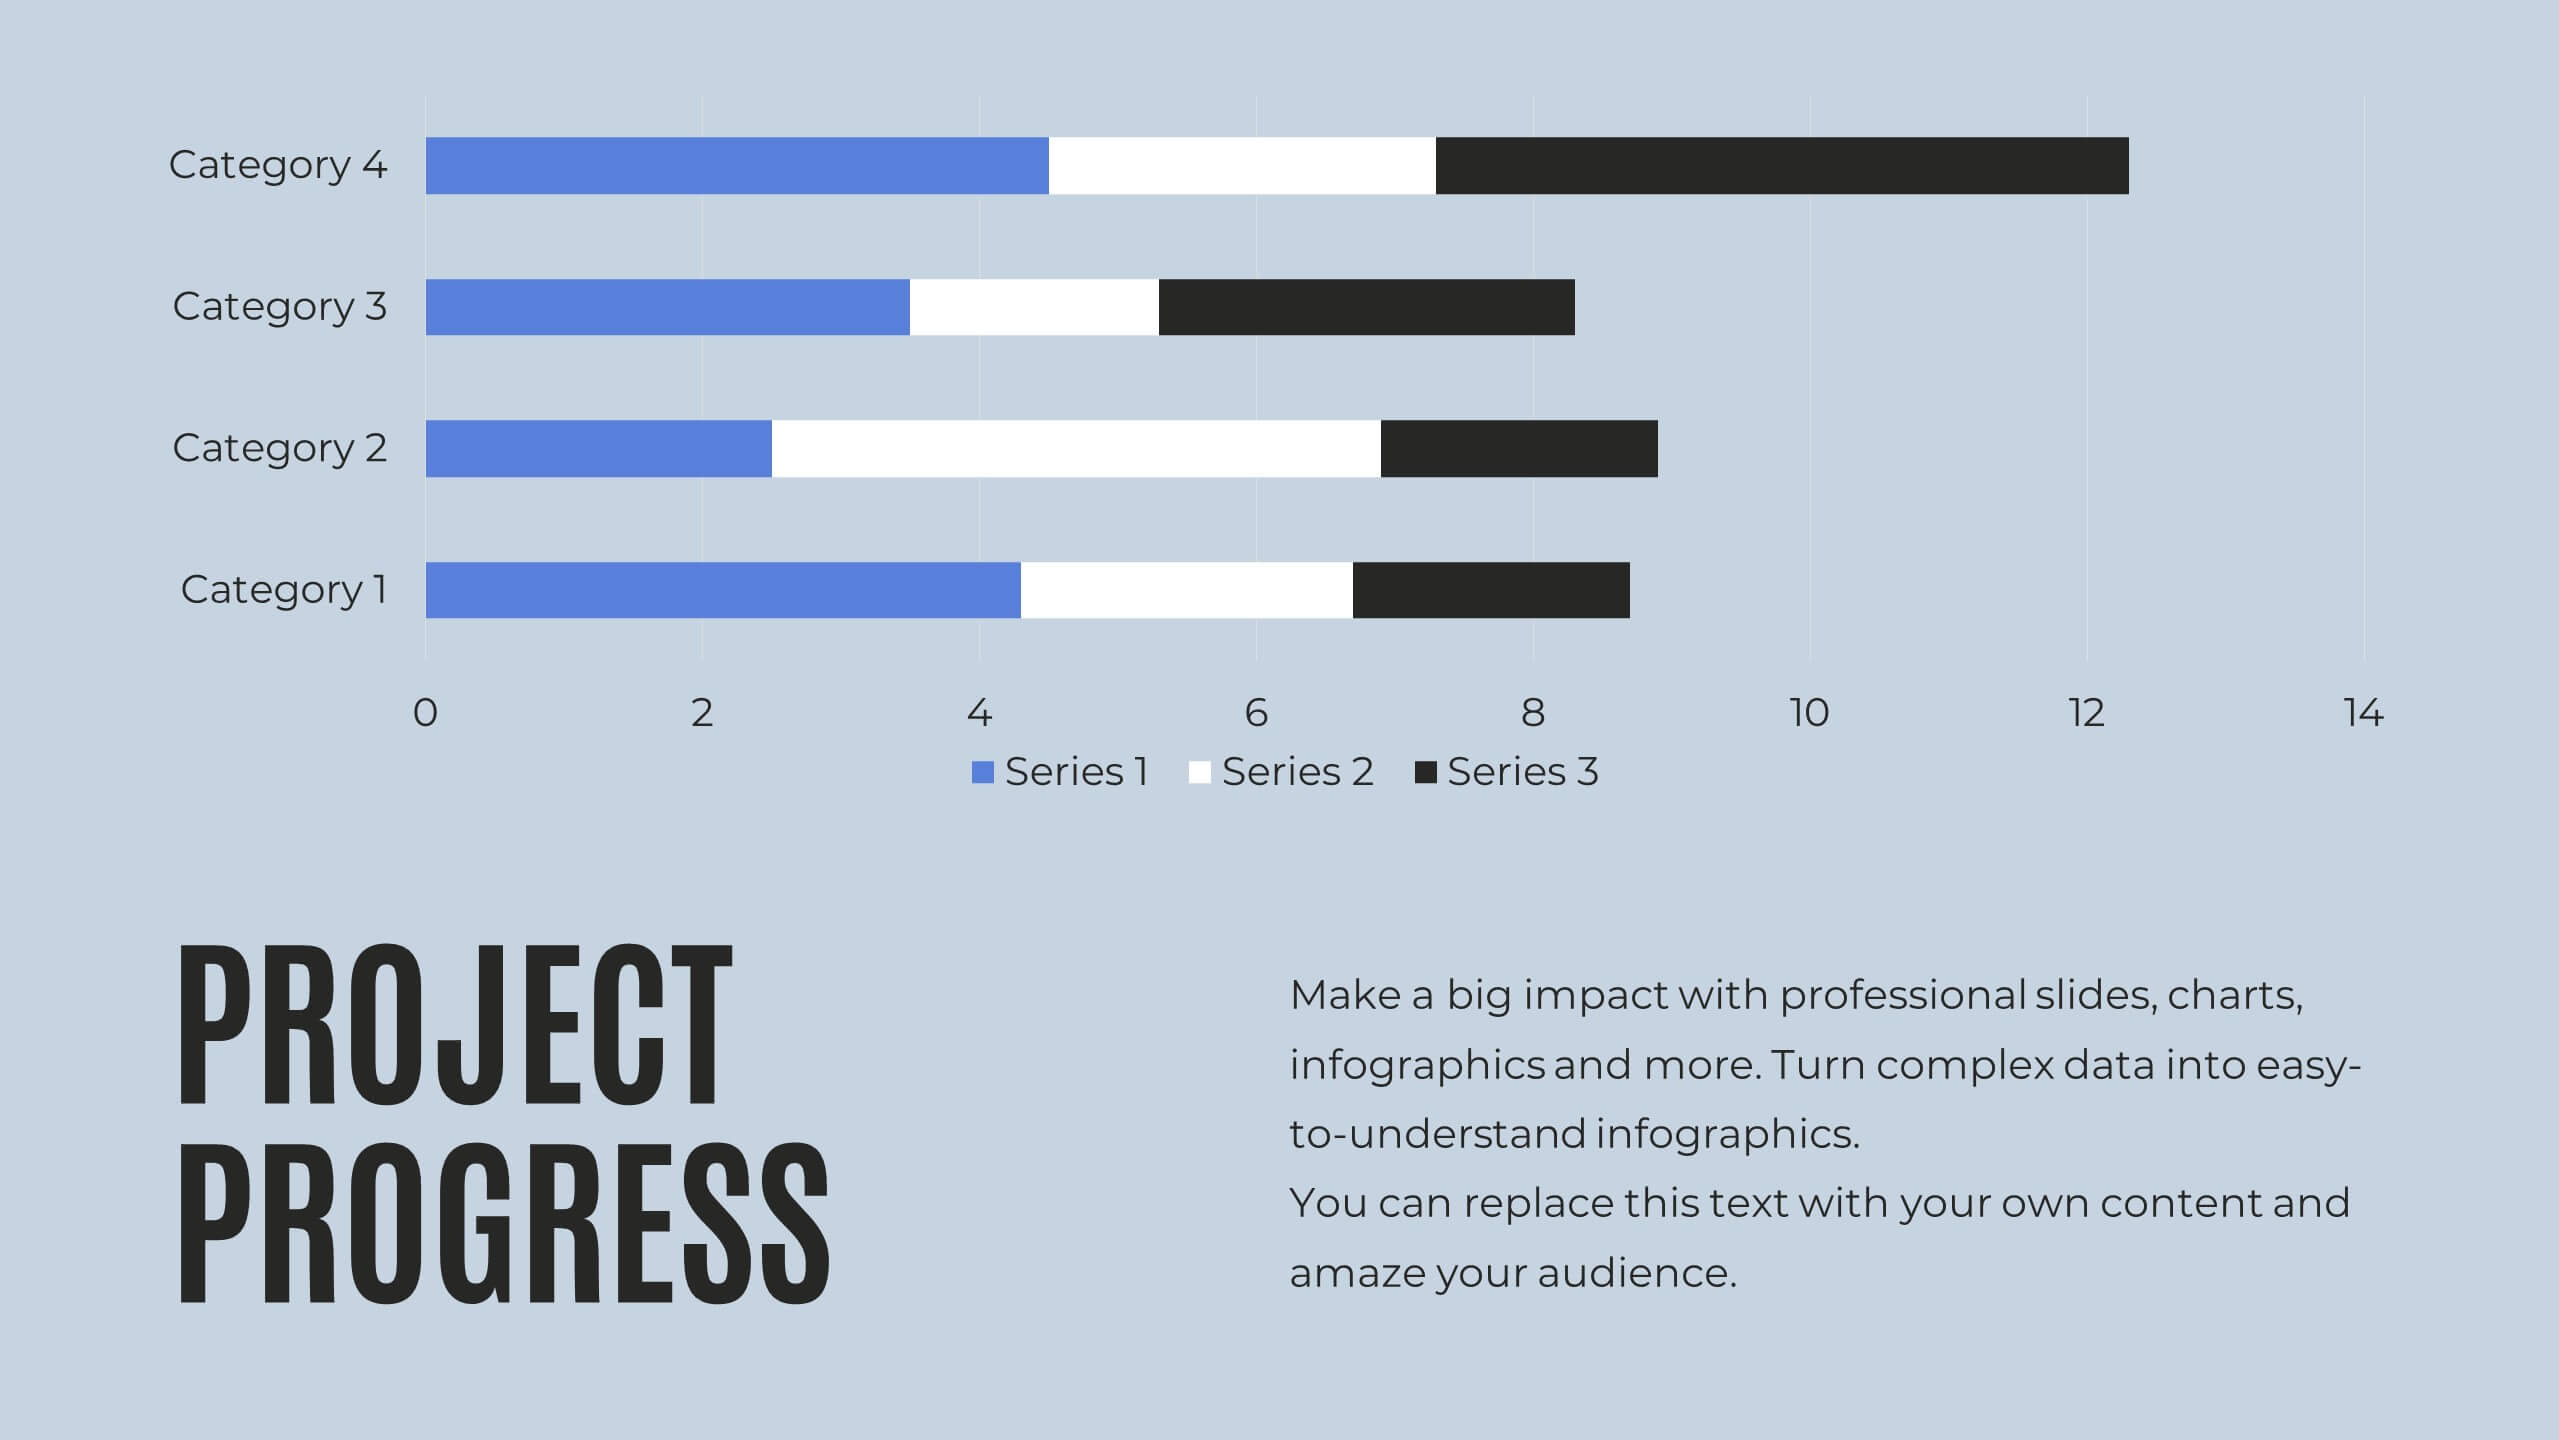
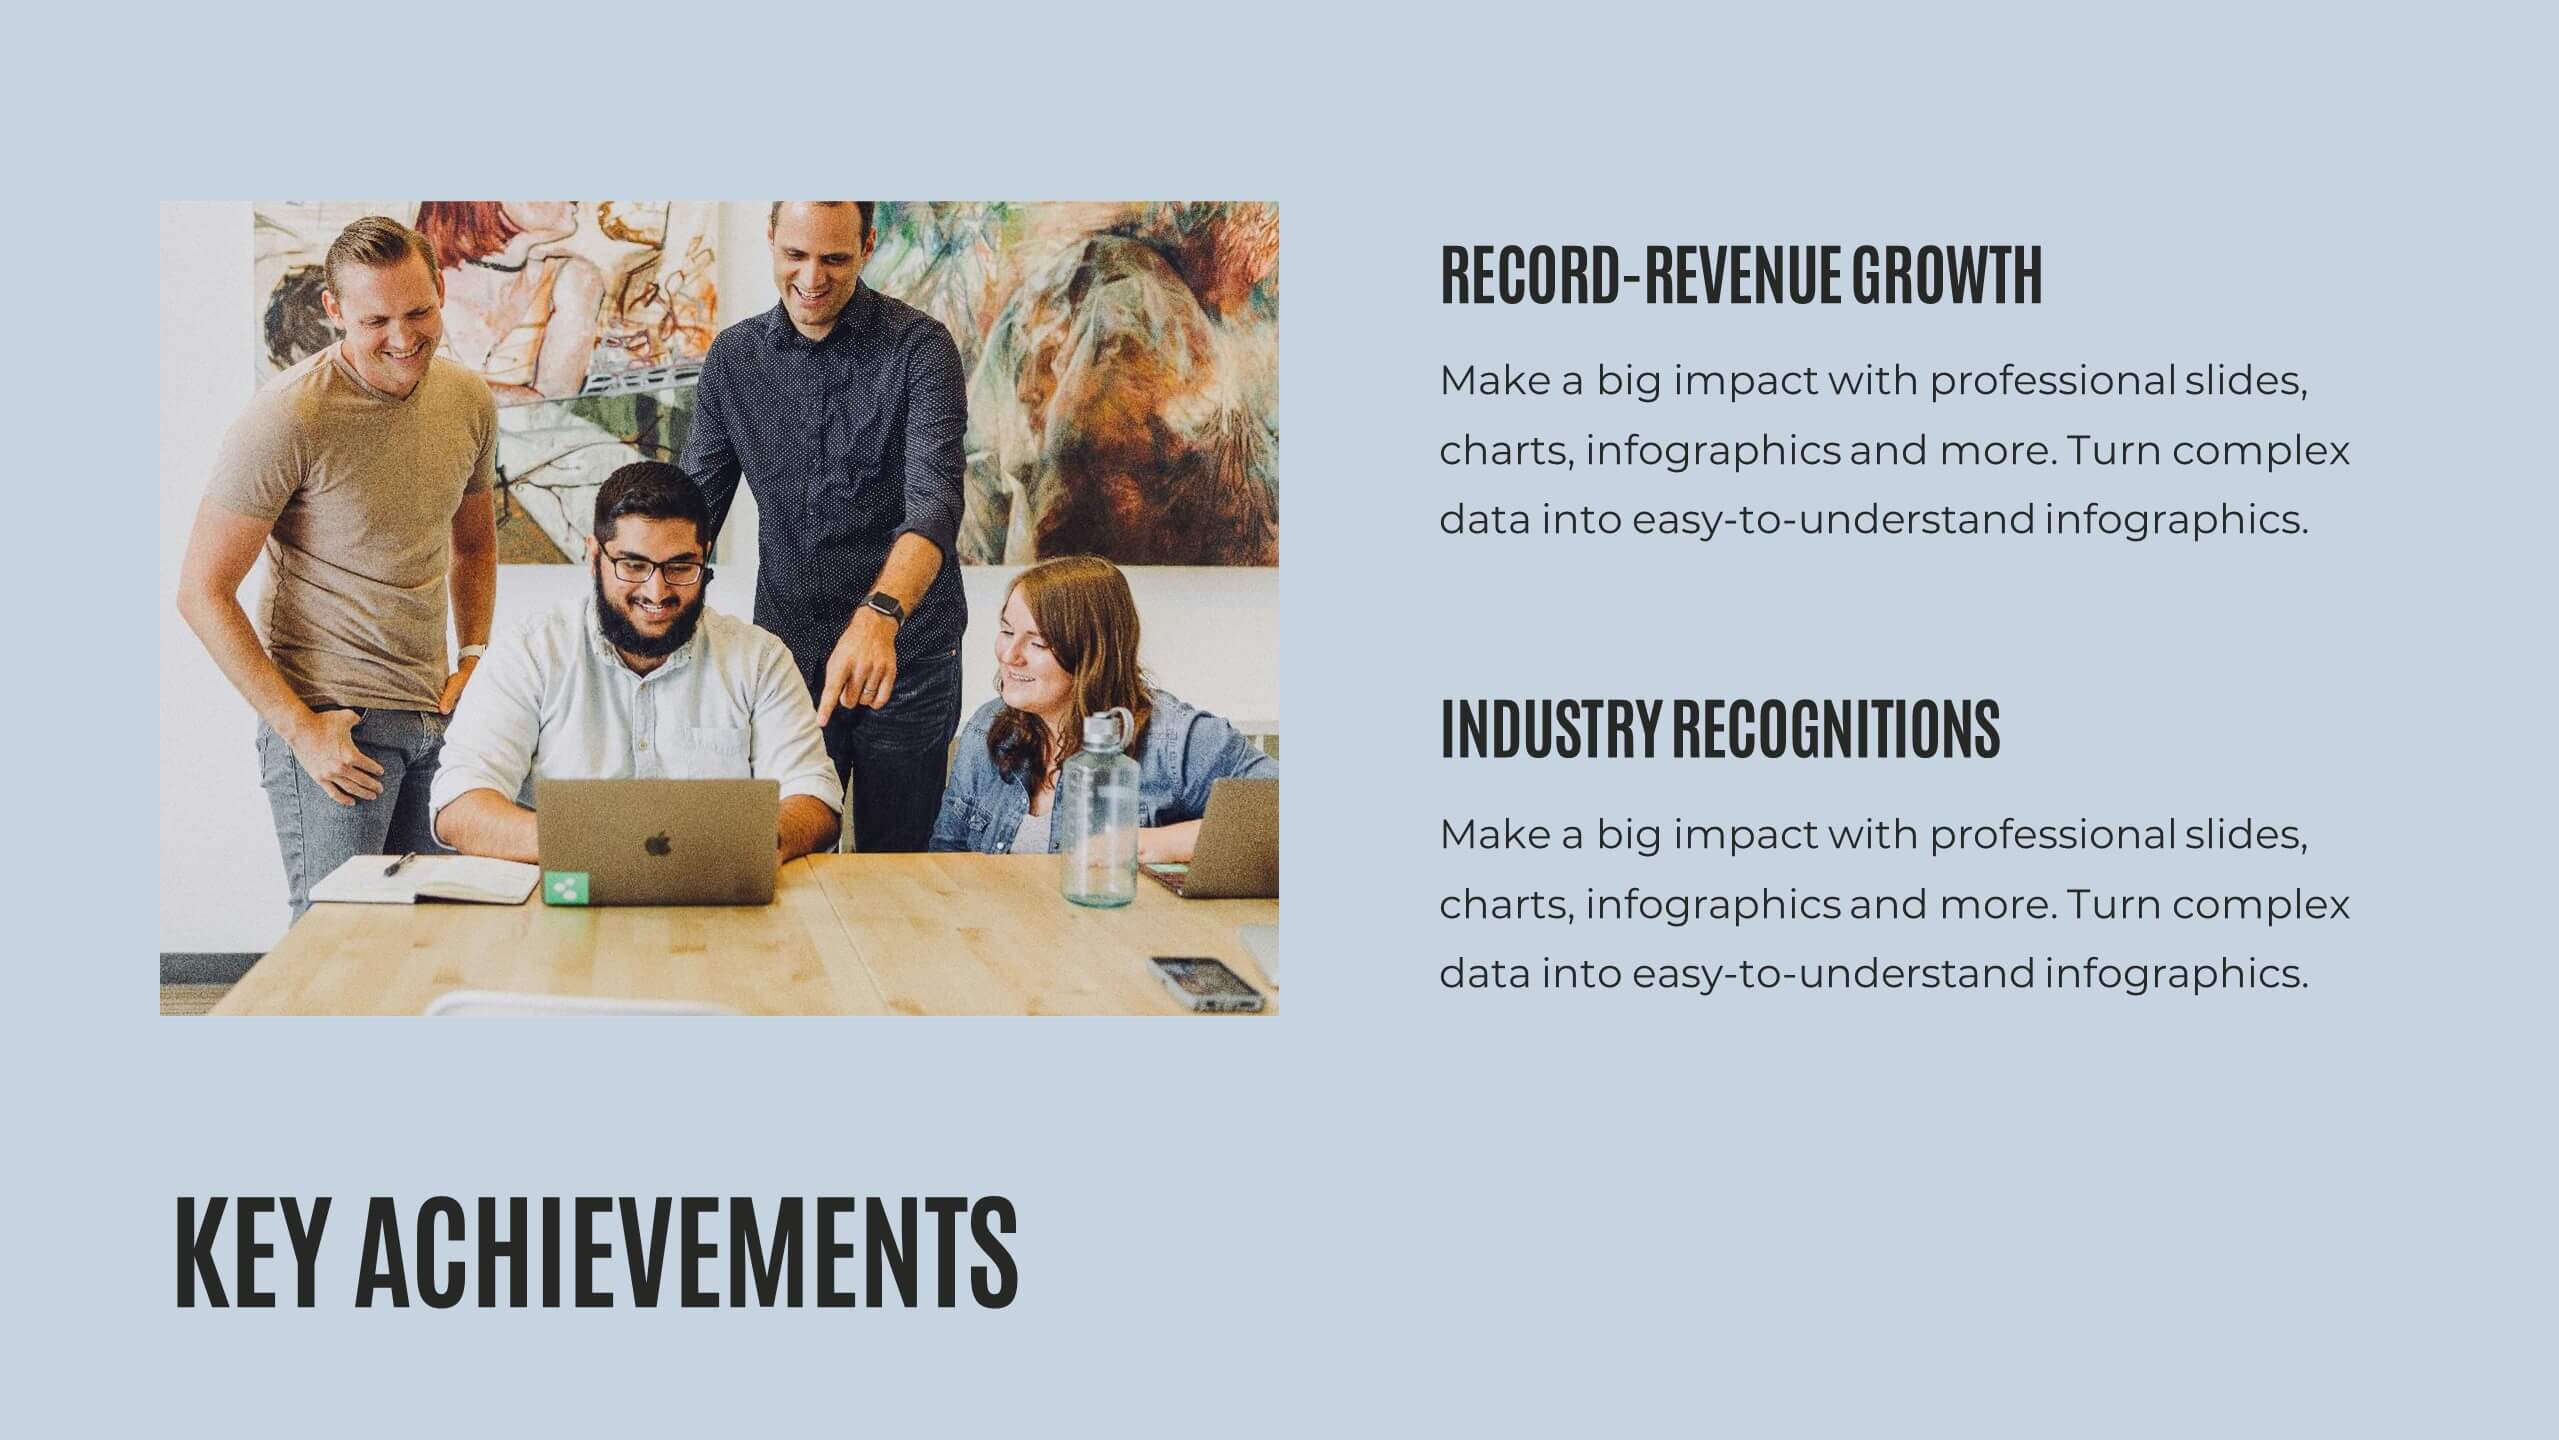
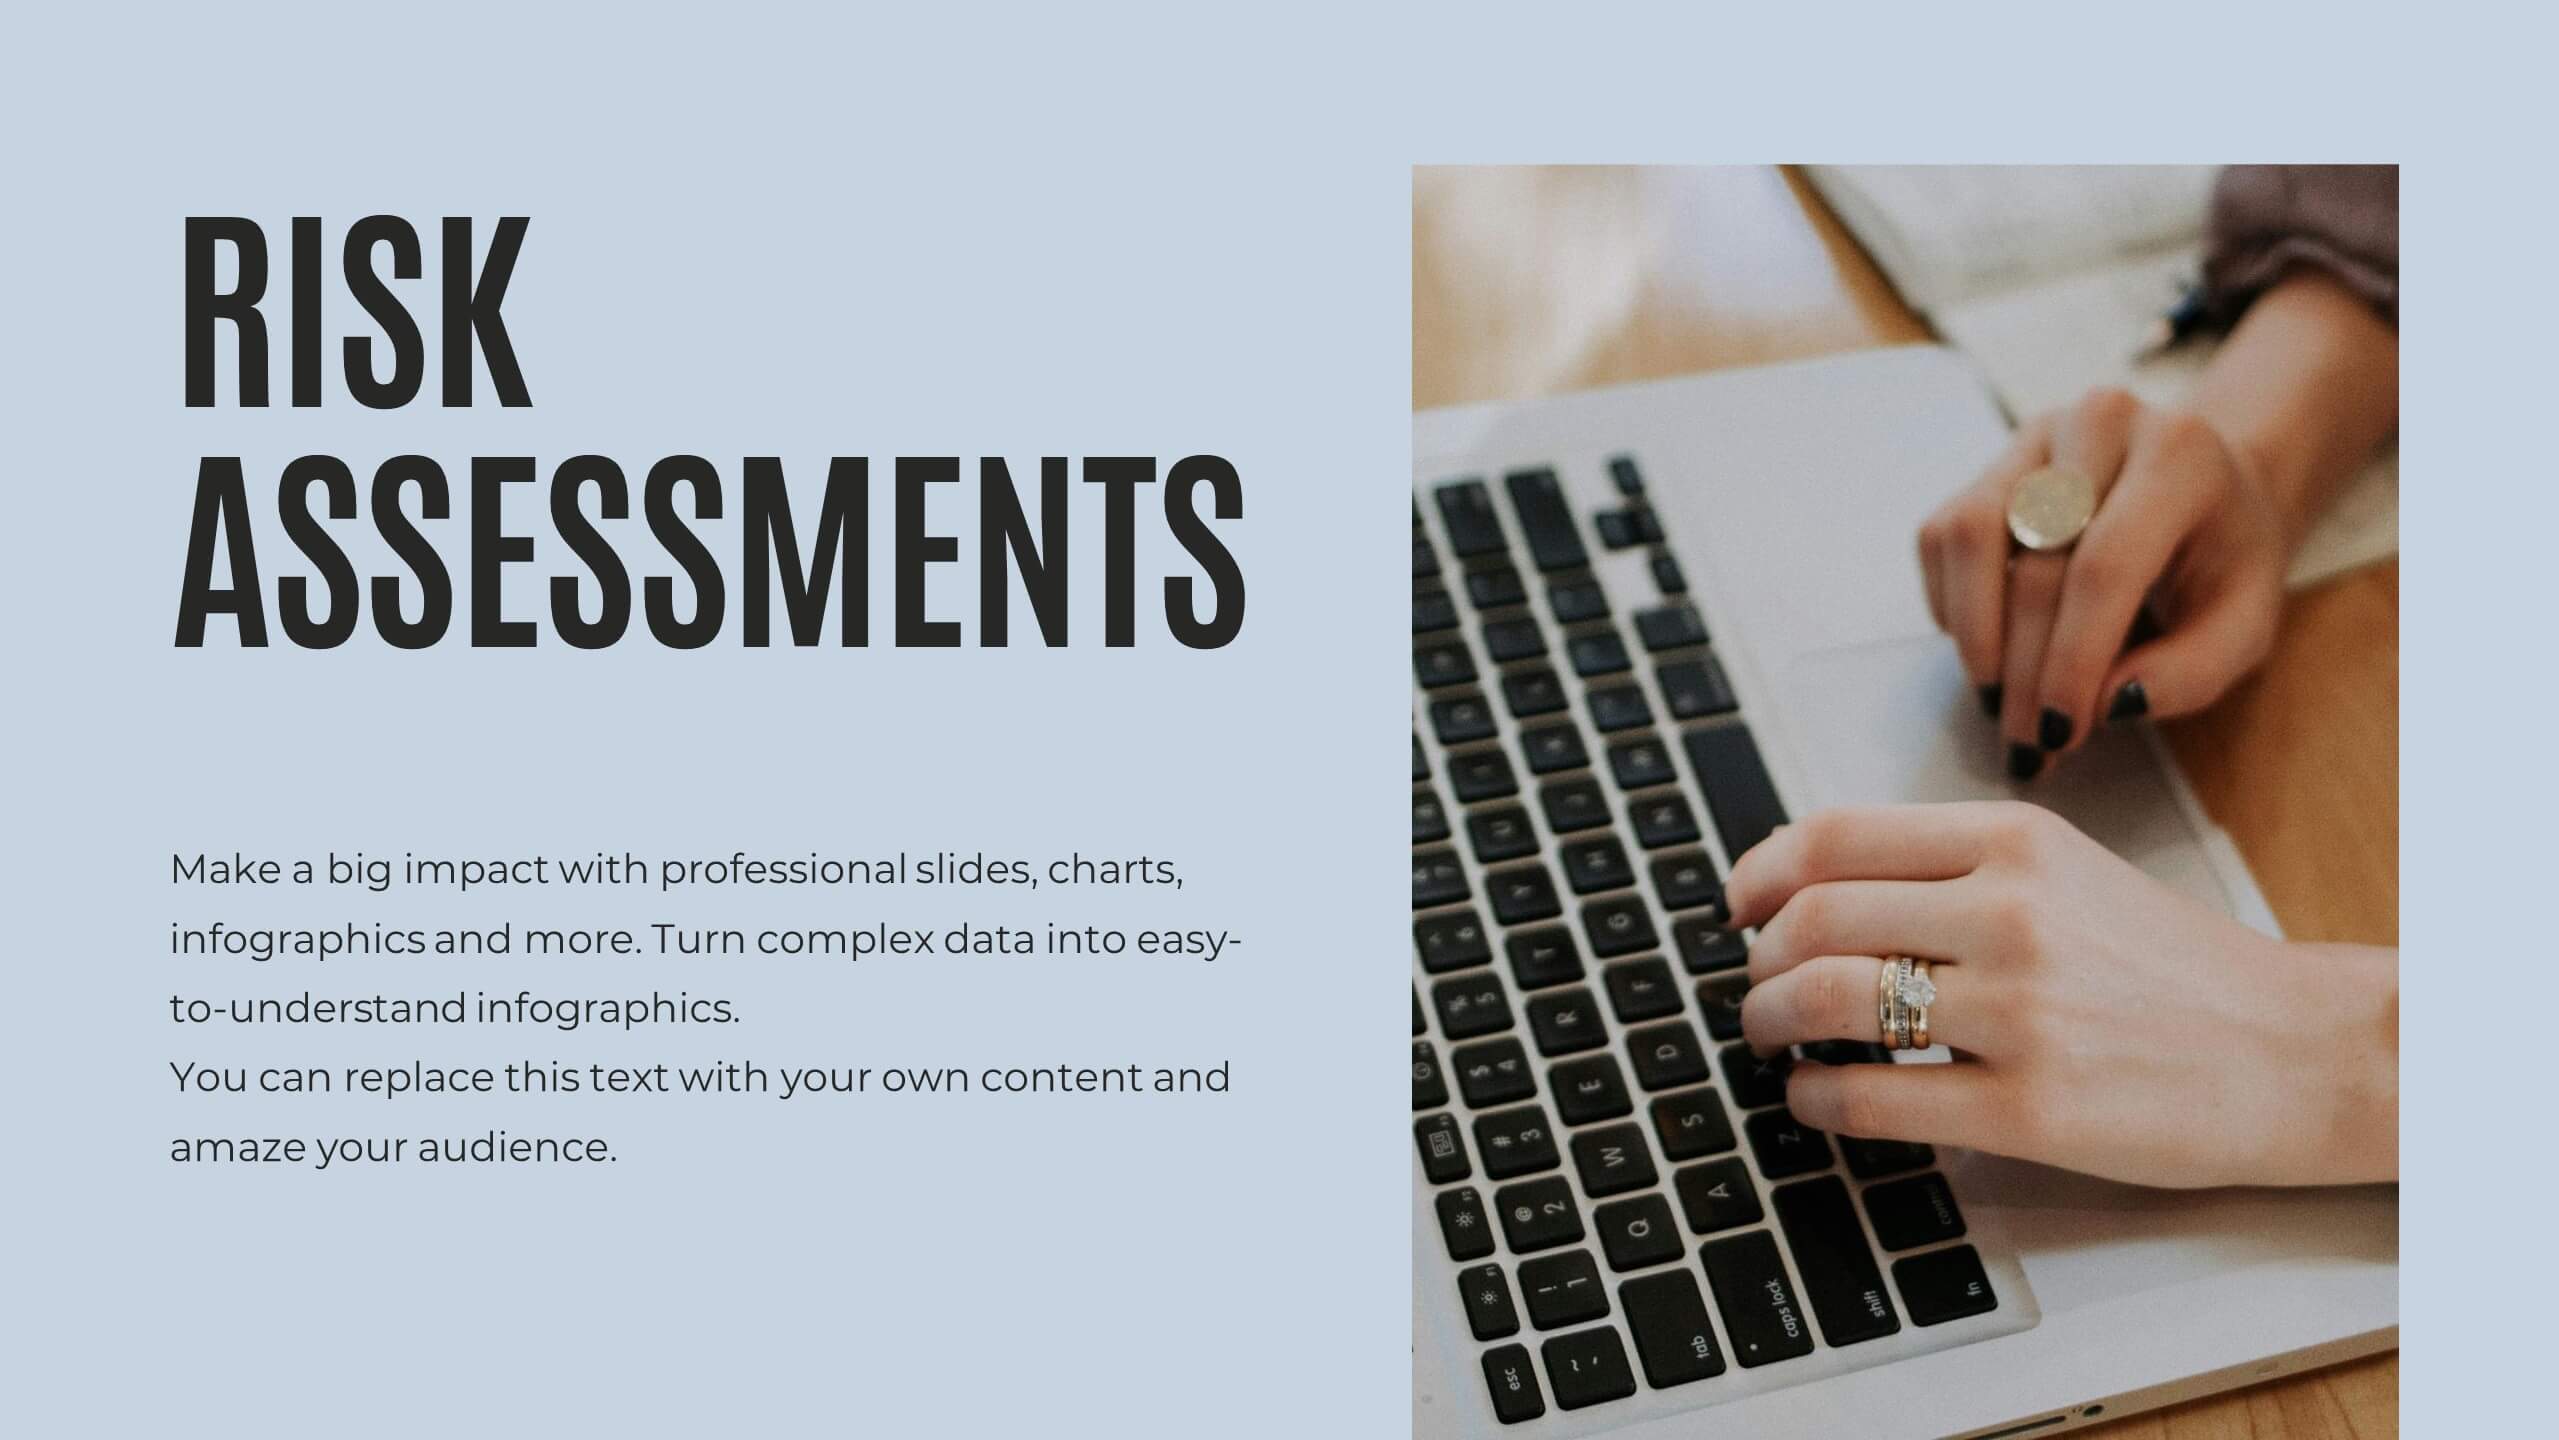
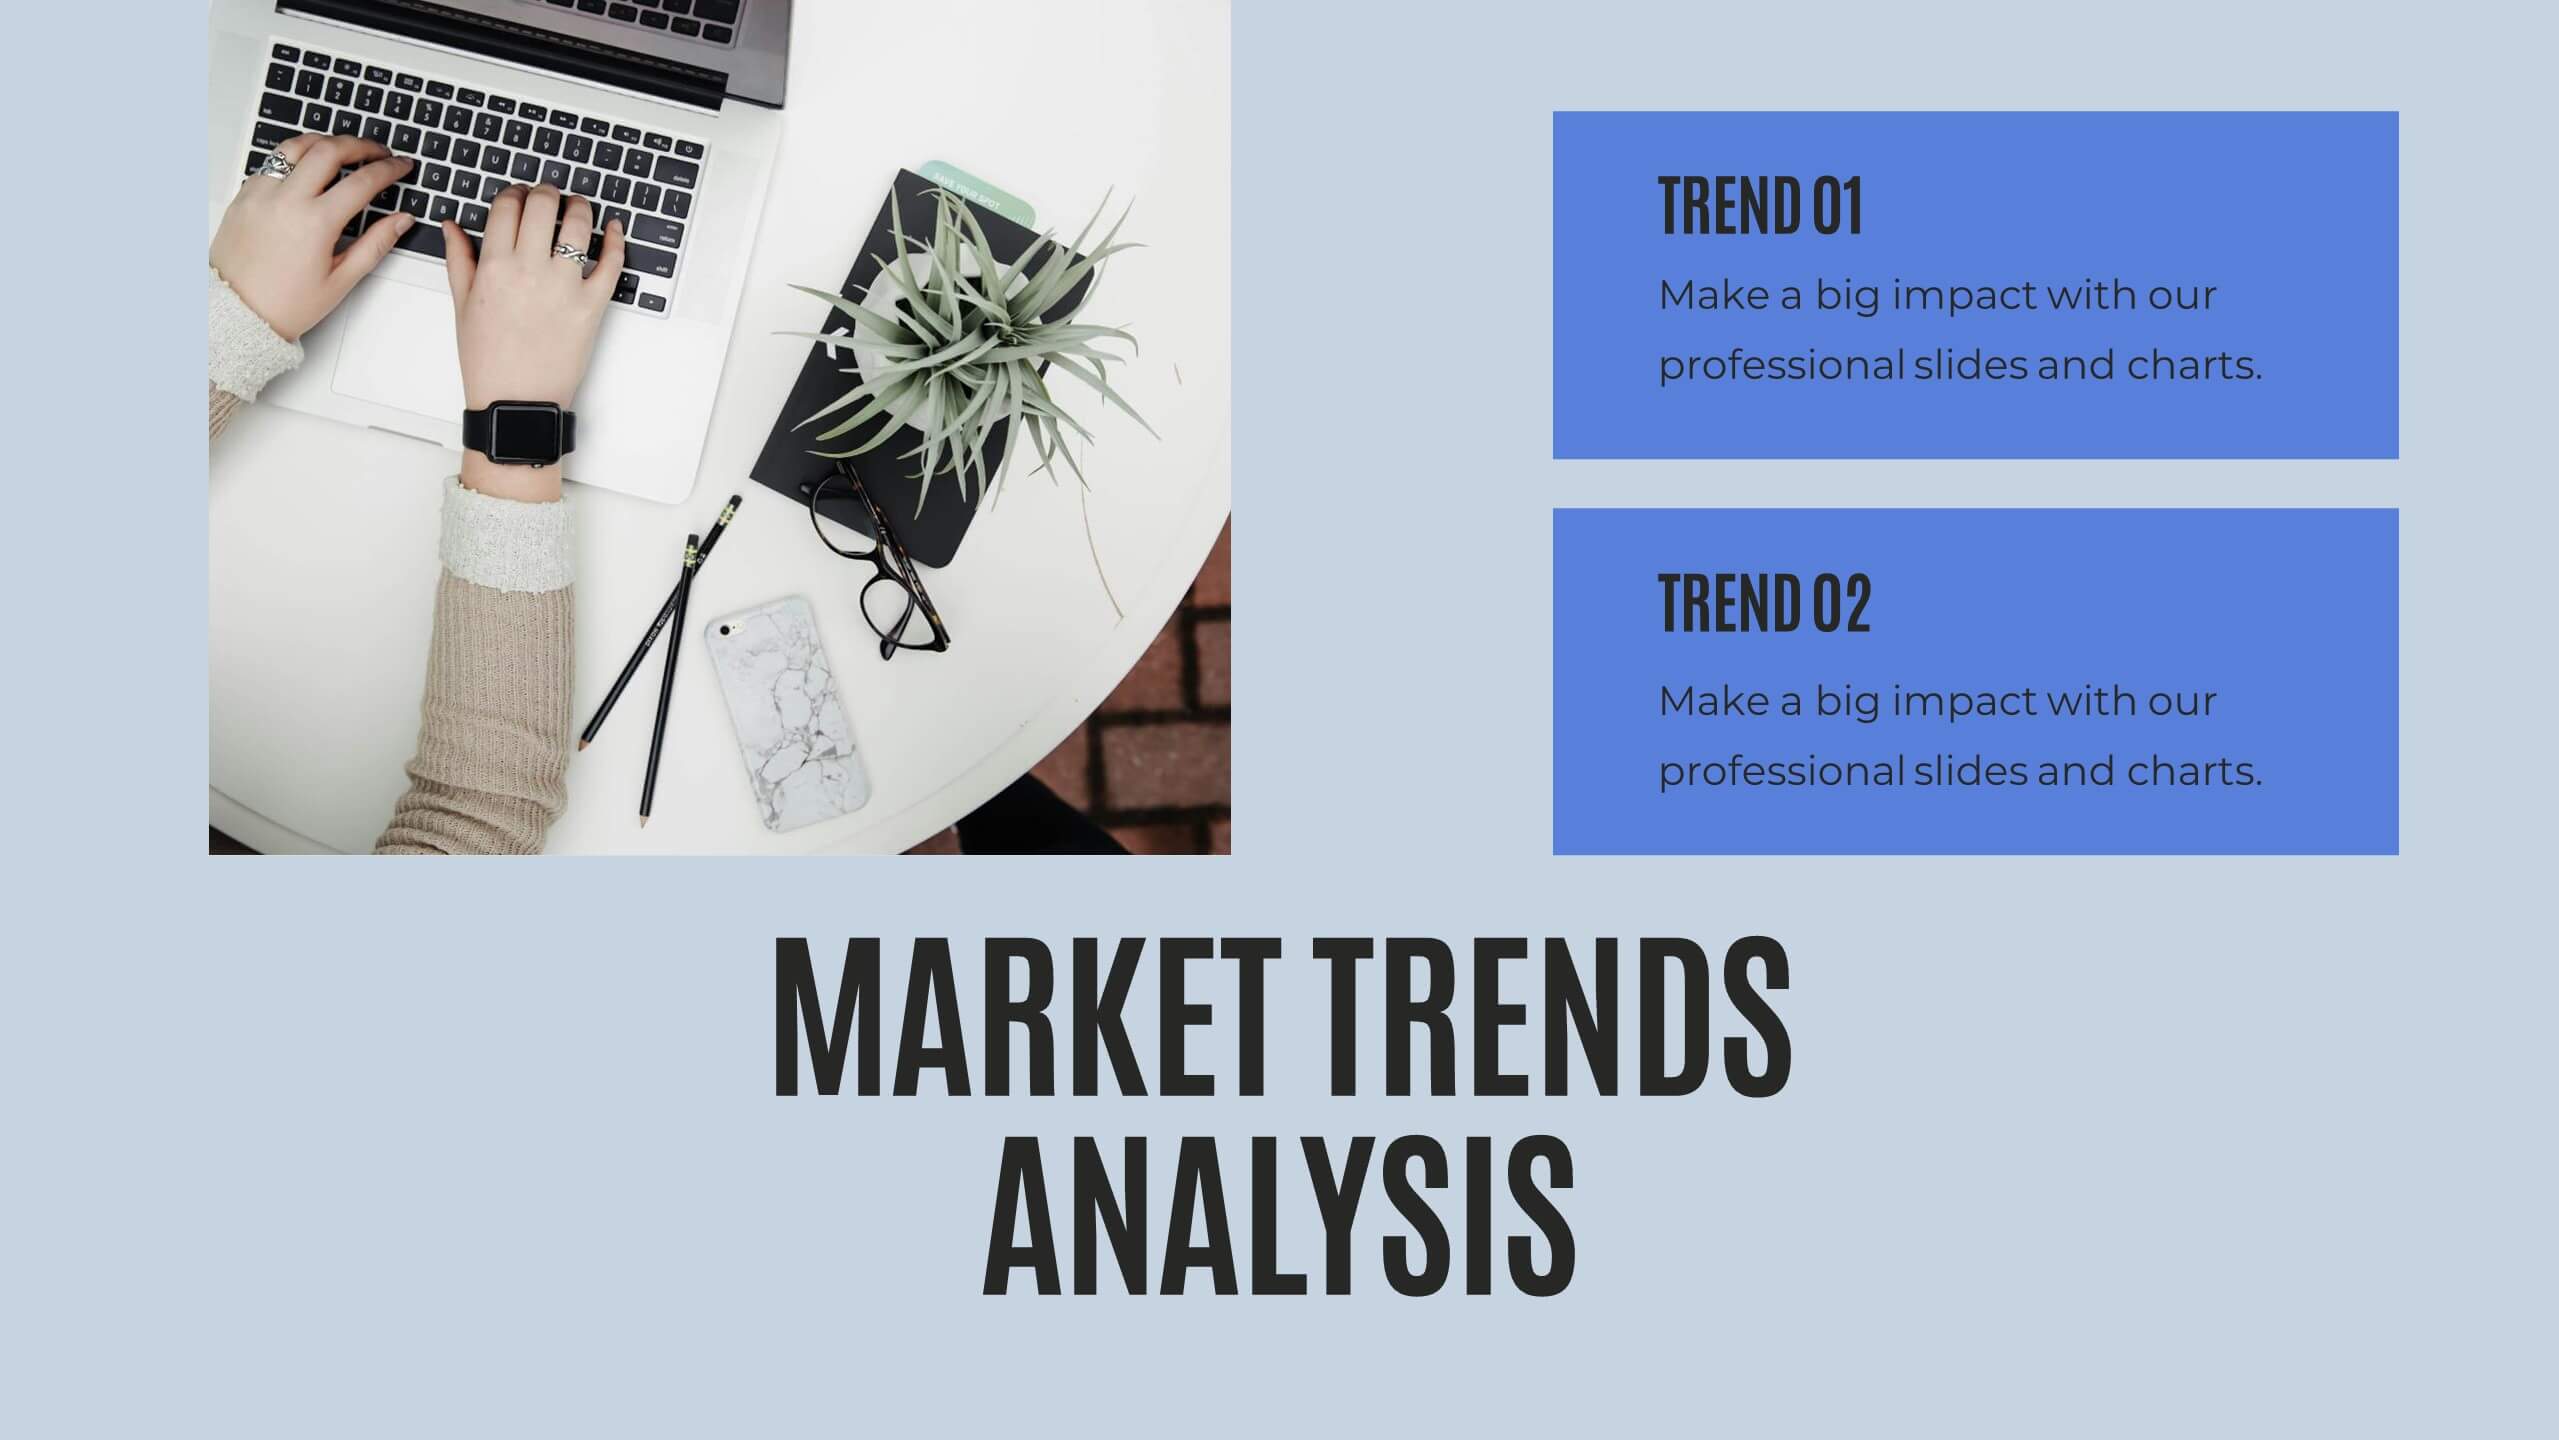
Illuminate your findings with this comprehensive research report template! Perfect for presenting key highlights, performance metrics, and financial summaries, it features professional slides for project progress, risk assessments, and market trends analysis. Engage your audience with clear visuals and detailed content. Compatible with PowerPoint, Keynote, and Google Slides for seamless presentations on any platform.


6 slides
Market Trends and Risk Analysis with PESTEL Presentation
Present strategic insights with clarity using this Market Trends and Risk Analysis with PESTEL slide. Ideal for business consultants, marketers, and strategic planners, this slide helps dissect external factors—Political, Economic, Sociocultural, Technological, Environmental, and Legal—into clearly labeled segments using a modern hexagonal layout. Each section offers dedicated space for brief analysis or key data points, making it perfect for risk assessment, market evaluation, and forecasting discussions. Easily customizable in PowerPoint, Keynote, and Google Slides.


7 slides
Service Finance Infographic
Service finance refers to the management of financial resources, transactions, and strategies within the service industry. This infographic template ensures that the services provided are financially sustainable, meet customer needs, and contribute to the overall growth and success of the organization. Fully customizable and compatible with Powerpoint, Keynote, and Google Slides. Showcase the dynamics that drive the financial world, uncovering the core elements of the ecosystem. This infographic will encourage action and invite your audience to embrace a financial renaissance, soaring towards their prosperous future.


4 slides
Sales Strategy 30-60-90 Day Plan
Accelerate your sales team’s performance with this 30-60-90 Day Strategy template. Designed with clean circular progress visuals and clear milestone stages, it helps you outline sales goals, track onboarding, and align strategic efforts. Ideal for new hires, quarterly planning, or sales enablement. Fully editable in PowerPoint, Keynote, and Google Slides.


6 slides
Geometric Distribution Infographic
The geometric distribution is a probability distribution that models the number of trials needed for a specific event to occur for the first time in a sequence of independent and identically distributed Bernoulli trials. This Infographic template is a visual representation of the geometric distribution, which is a probability distribution that models the number of Bernoulli trials required for a success to occur. This is can be used in scenarios where you're interested in the number of trials needed for a specific event to occur. This template can help explain the geometric distribution concept, formula, and application in a clear and visually appealing manner.


8 slides
Workforce Skills Gap Analysis Presentation
Identify and Bridge Workforce Skill Gaps! This Workforce Skills Gap Analysis template provides a structured approach to assess, compare, and close competency gaps within an organization. Designed with interactive bar chart visuals, it enables HR professionals, managers, and training specialists to track employee skill levels, identify gaps, and align workforce development strategies. Fully customizable in PowerPoint, Keynote, and Google Slides, this template ensures a clear and data-driven approach to workforce planning and professional growth.


5 slides
Organic Search Growth Plan Presentation
Grow your visibility the natural way with this sleek and easy-to-follow organic strategy slide. Perfect for outlining SEO goals, keyword clusters, and growth tactics, this visual layout makes your presentation clean and compelling. Fully compatible with PowerPoint, Keynote, and Google Slides for flexible editing across platforms.


7 slides
Skills Gap Analysis Tool Infographic
Optimize workforce potential with our Skills Gap Analysis Tool Infographic, designed for HR professionals, team leaders, and organizational development experts. This infographic provides a visual representation of the skills present within a team and identifies areas requiring development. Our infographic lays out a systematic approach to assessing competency levels across various skill sets, highlighting strengths and gaps in your team's abilities. It includes segments for rating proficiency, mapping skill distribution, and planning for training or recruitment to bridge any gaps. With this tool, you can create a clear and actionable skills inventory that supports strategic workforce planning and personal development. This SEO-optimized infographic is crafted to guide you in aligning your team's skills with organizational goals. Leverage this infographic to conduct comprehensive skills gap analyses, ensuring your team has the capabilities to meet current and future challenges effectively.


5 slides
DMAIC Six Sigma Framework
Visualize process improvement with this clear and structured DMAIC Six Sigma slide. Perfect for business analysts, quality teams, and project managers, it highlights each phase—Define, Measure, Analyze, Improve, and Control—in a streamlined format. Fully editable in PowerPoint, Keynote, and Google Slides.


4 slides
Social Media Content Strategy Presentation
Engage your audience with this Social Media Content Strategy Presentation. Featuring side-by-side thumbs-up icons, this template visually contrasts two key focus areas—ideal for comparing campaign goals, content pillars, or platform strategies. Each section includes editable text blocks to outline insights clearly. Fully customizable and compatible with PowerPoint, Keynote, and Google Slides.


7 slides
Rotational Process Flow in Wheel Layout Presentation
Showcase continuous workflows, lifecycle stages, or strategic loops with the Rotational Process Flow in Wheel Layout Presentation. This visually engaging circular diagram breaks down processes into six distinct segments, each with editable icons, colors, and titles—ideal for marketing funnels, product development stages, or team cycles. Fully compatible with PowerPoint, Keynote, and Google Slides.


5 slides
3D Element Infographics for Impact Presentation
Add a bold visual twist to your data with the 3D Element Infographics for Impact Presentation. Featuring eye-catching 3D dice-style cubes, this template is perfect for showcasing four key concepts, comparisons, or stages. Ideal for business strategies, risk breakdowns, or decision-making visuals. Fully editable and compatible with PowerPoint, Keynote, and Google Slides.


5 slides
Financial Plan Infographics
A financial plan provides a roadmap for achieving financial goals, managing income and expenses, mitigating risks, building wealth, and preparing for the future. These infographic templates are designed to help individuals and businesses present their financial plans and strategies in a clear and concise manner. Use this to create a financial report, a business presentation, or to provide financial guidance, this template will help you communicate key financial information effectively. Compatible with Powerpoint, Keynote, and Google Slides, this makes is easy to customize with your information.


24 slides
Fictara UX Research Report Presentation
Present your UX research findings effectively with this modern and professional template. Covering essential topics such as user personas, wireframes, usability guidelines, and feedback iteration, it’s designed to showcase insights clearly. Fully editable and compatible with PowerPoint, Keynote, and Google Slides.


6 slides
Business Plan Steps Infographic
A business plan is a written document that outlines the goals, strategies, and financial projections of a business. This infographic template is designed to serves as a roadmap for the organization, providing a comprehensive overview of how the business will operate and achieve its objectives. This infographic outlines the key steps involved in creating a comprehensive business plan. The template provides tips on presenting the business plan in a professional and visually appealing manner. It incorporates visuals to support key points, and organizing the document with headings, subheadings, and bullet points for readability.