


Features
- 4 Unique slides
- Fully editable and easy to edit in Microsoft Powerpoint, Keynote and Google Slides
- 16:9 widescreen layout
- Clean and professional designs
- Export to JPG, PDF or send by email


Do you have any questions?
Recommend


4 slides
Strategic Triangle Model Slide
Visualize your core pillars with this Strategic Triangle Model Slide Presentation. Featuring a clean triangular layout with three editable segments, this template is perfect for showcasing frameworks such as mission-vision-values, policy-strategy-impact, or key business objectives. Each point of the triangle is paired with an icon and customizable text, making complex concepts easy to digest. Ideal for strategy planning, leadership discussions, or consulting proposals. Fully editable in PowerPoint, Google Slides, and Keynote.


21 slides
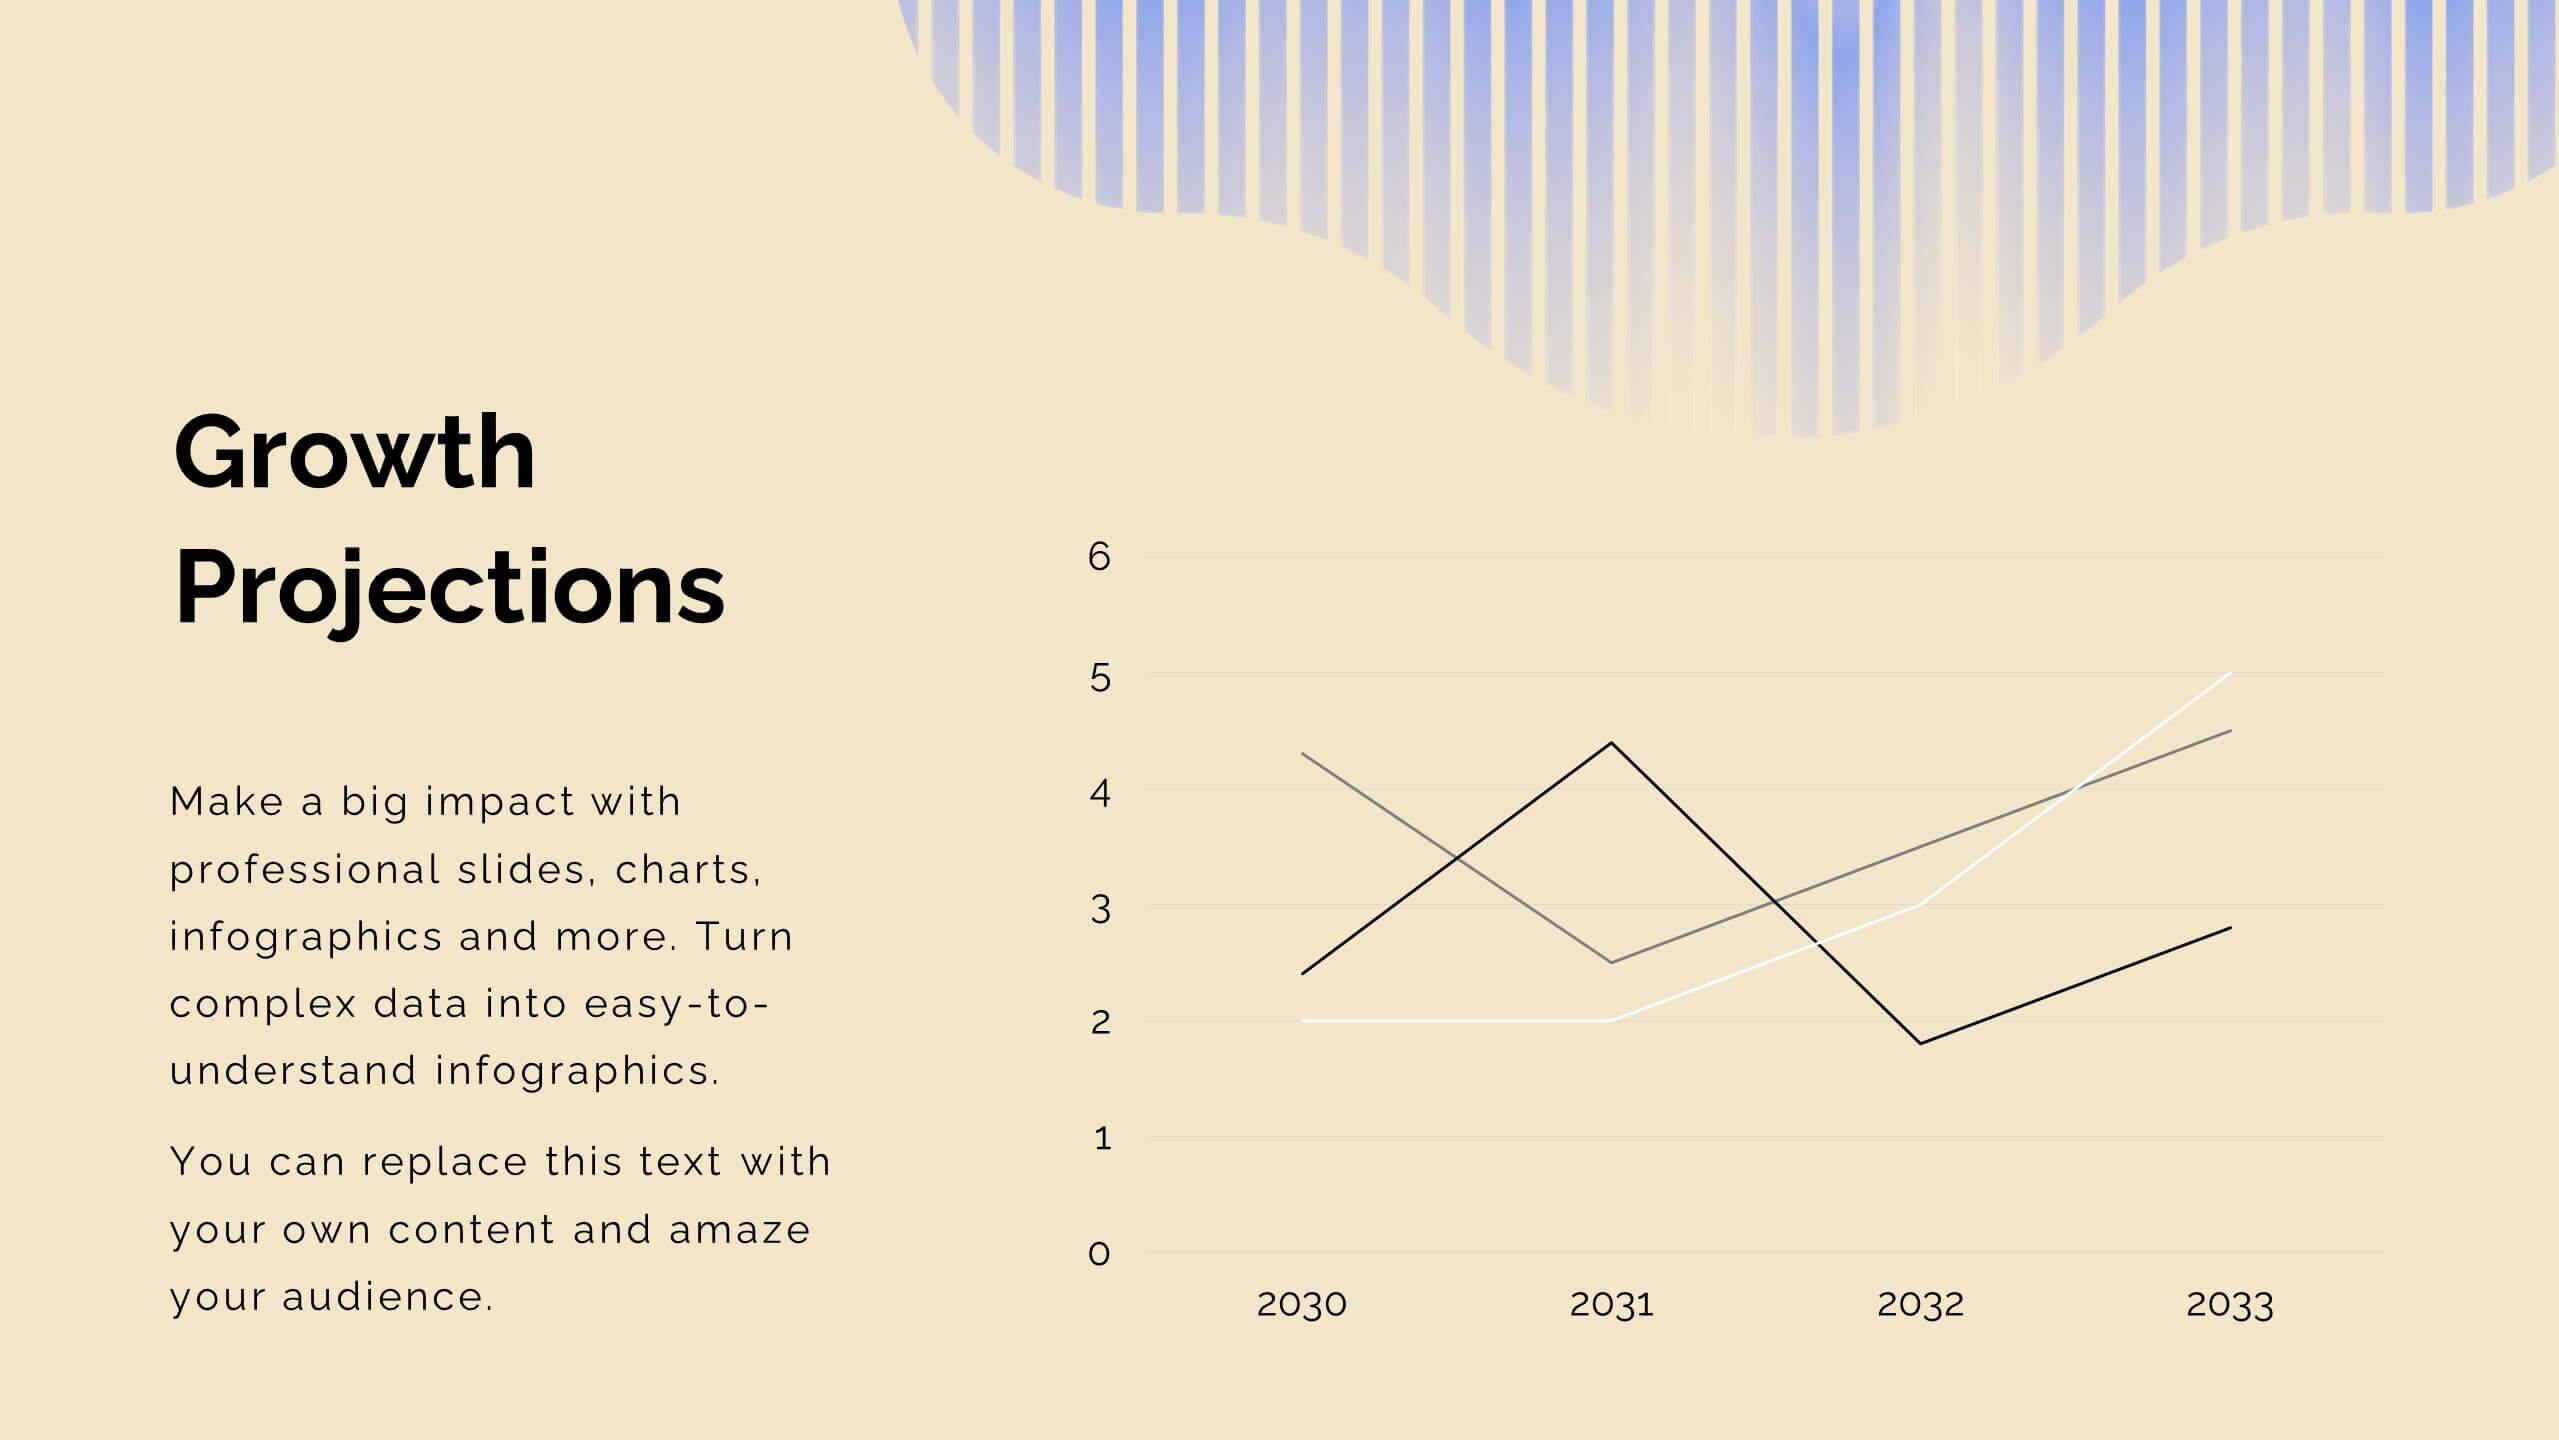
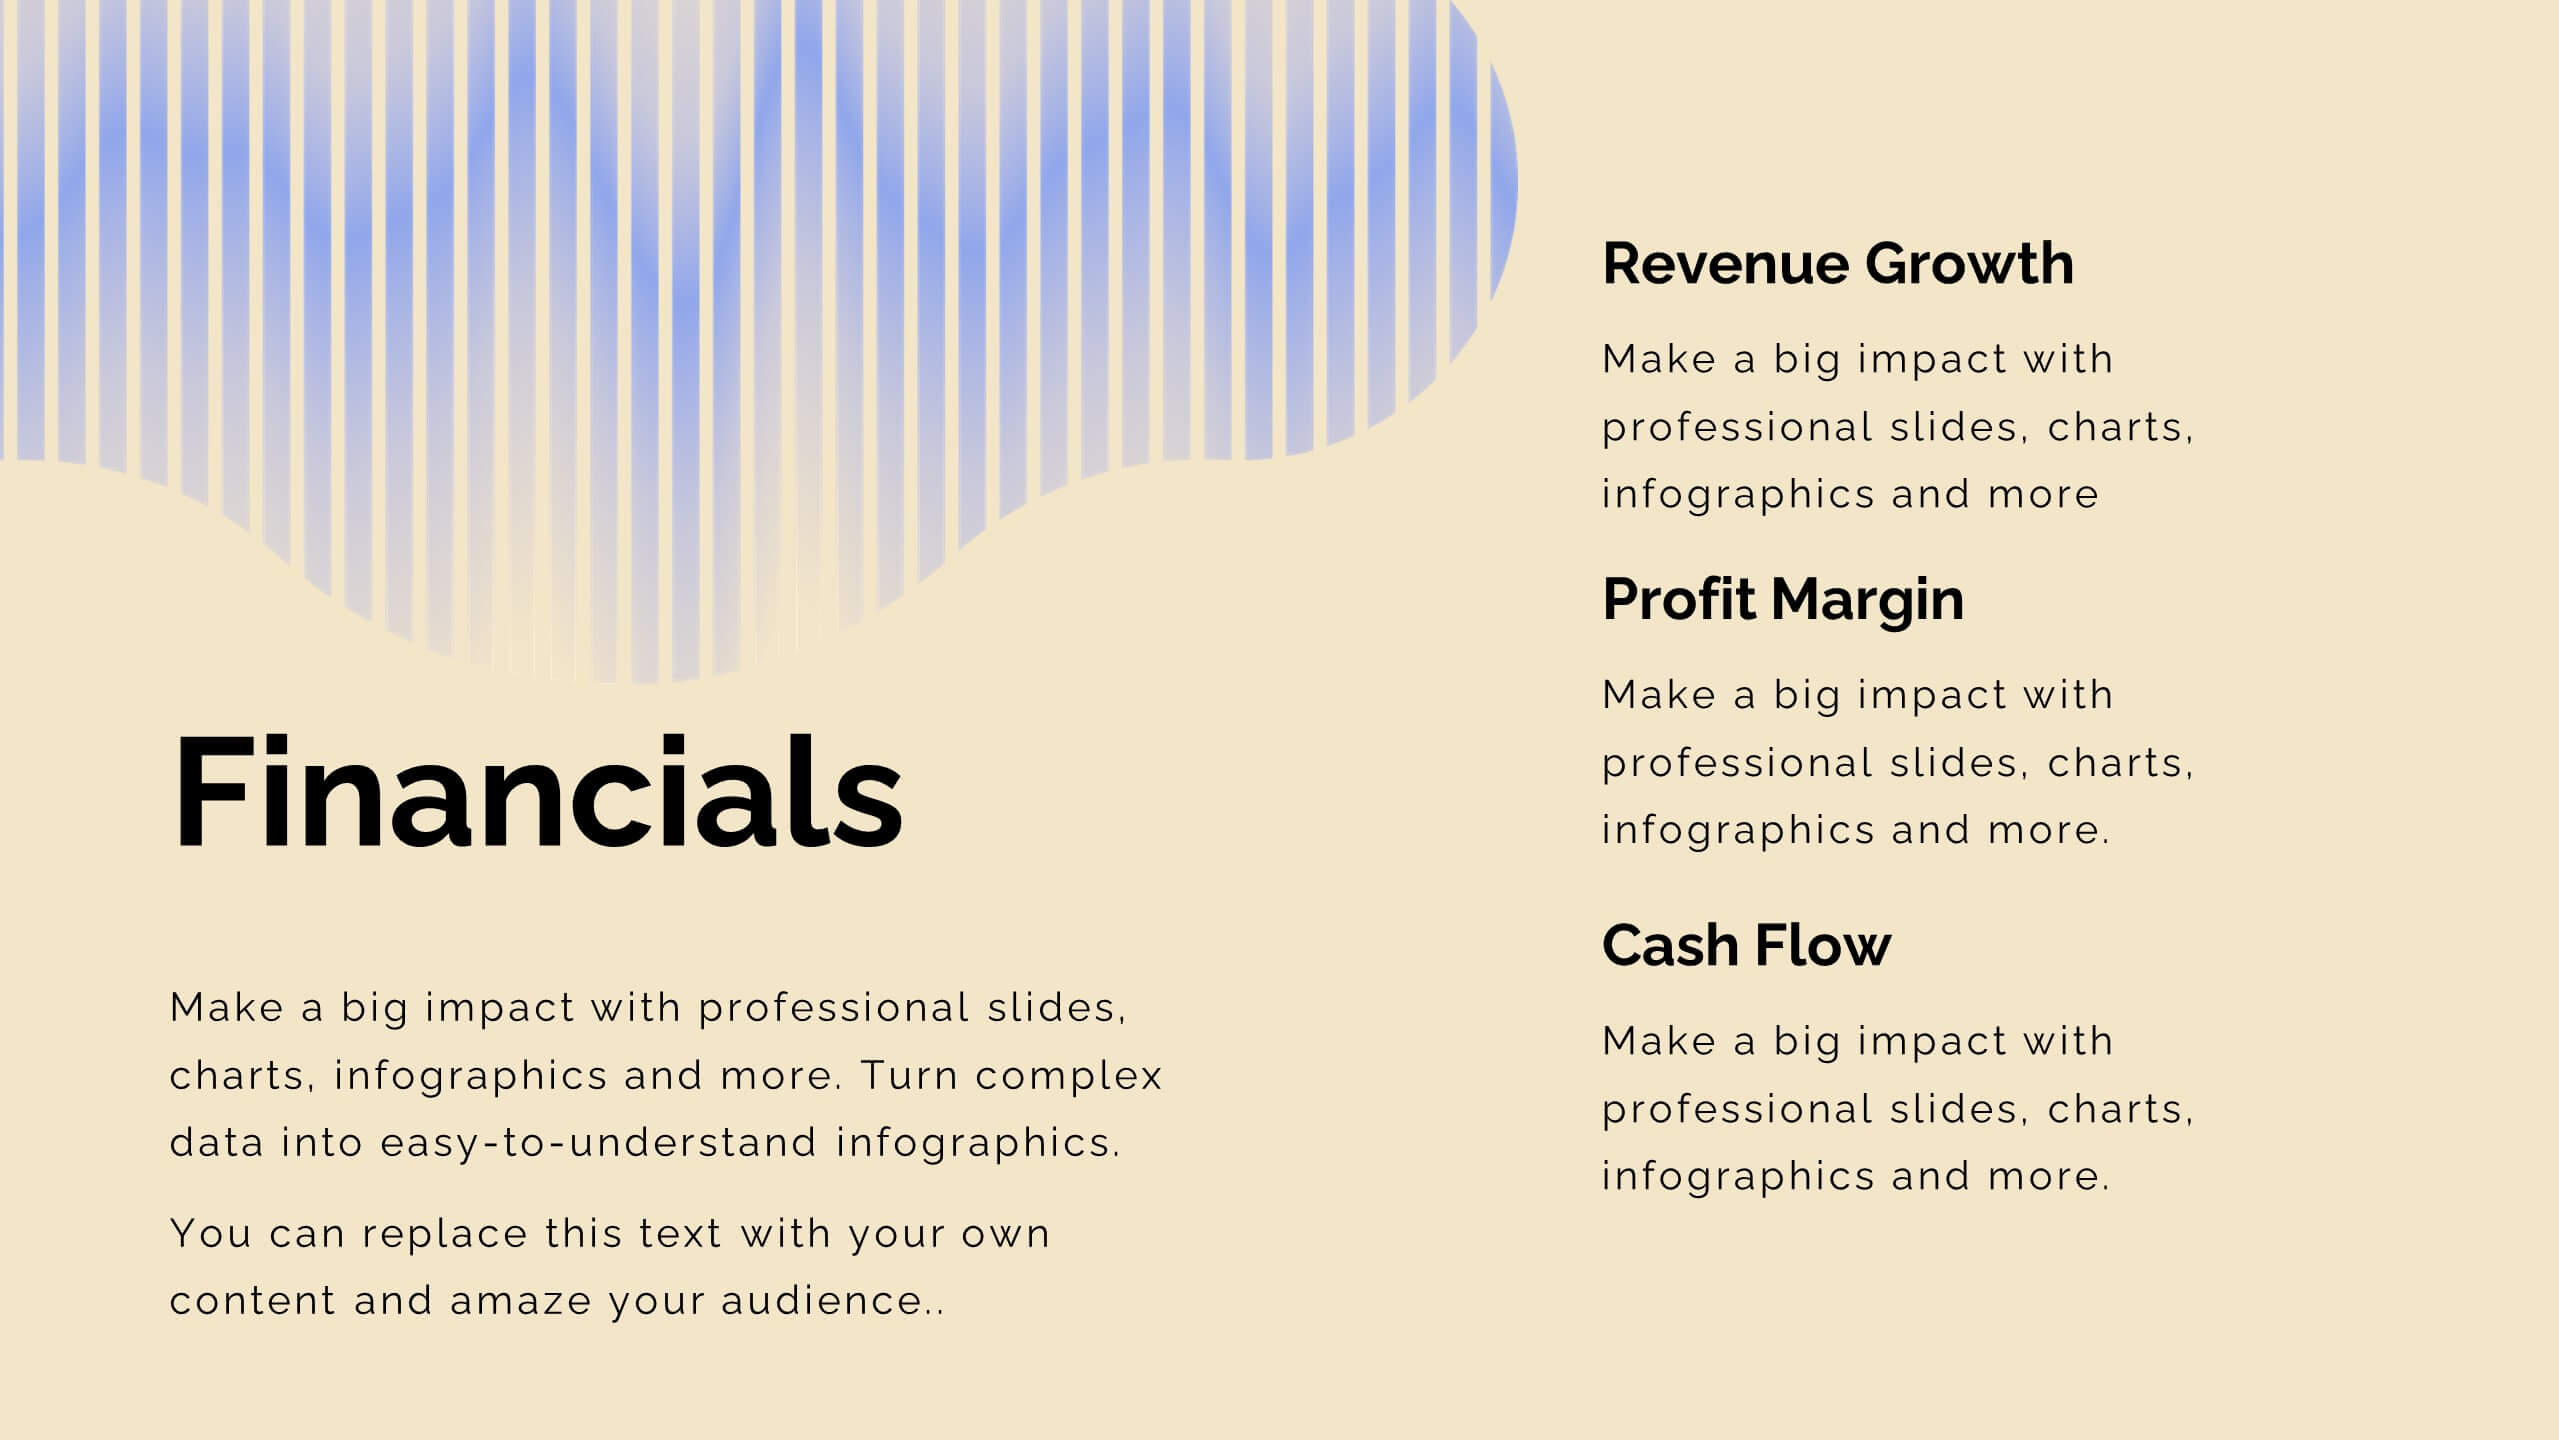
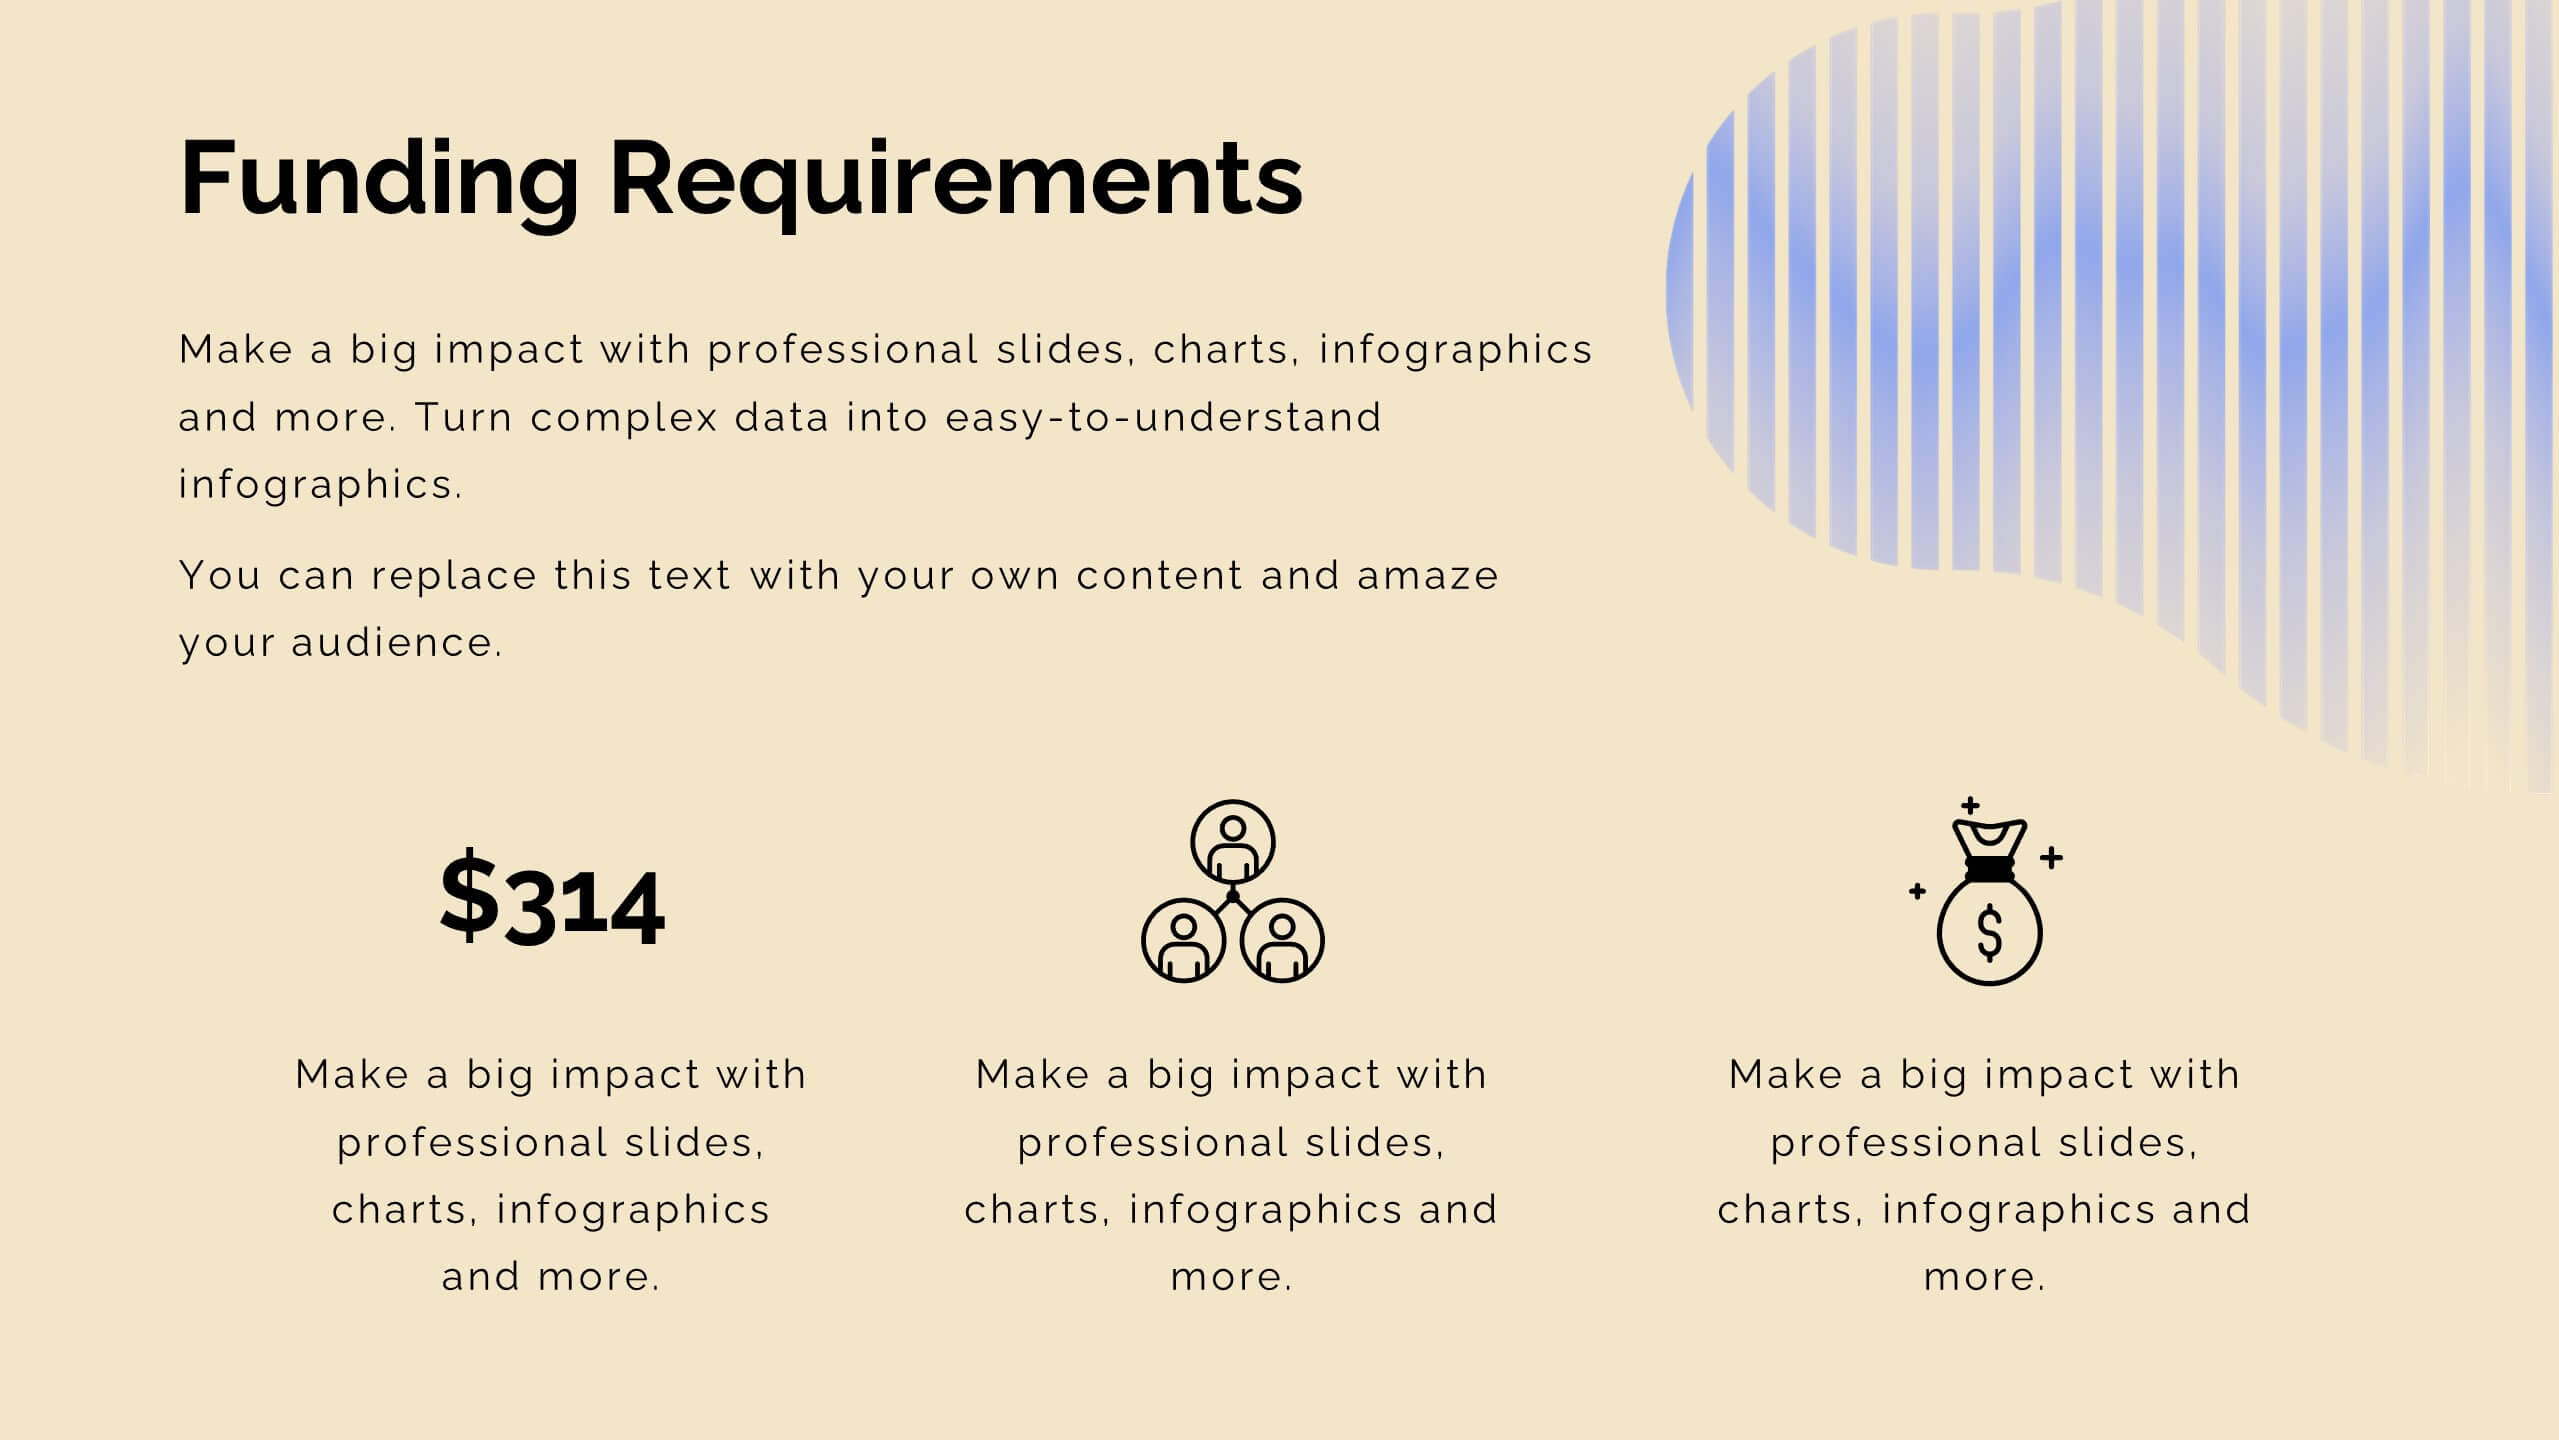
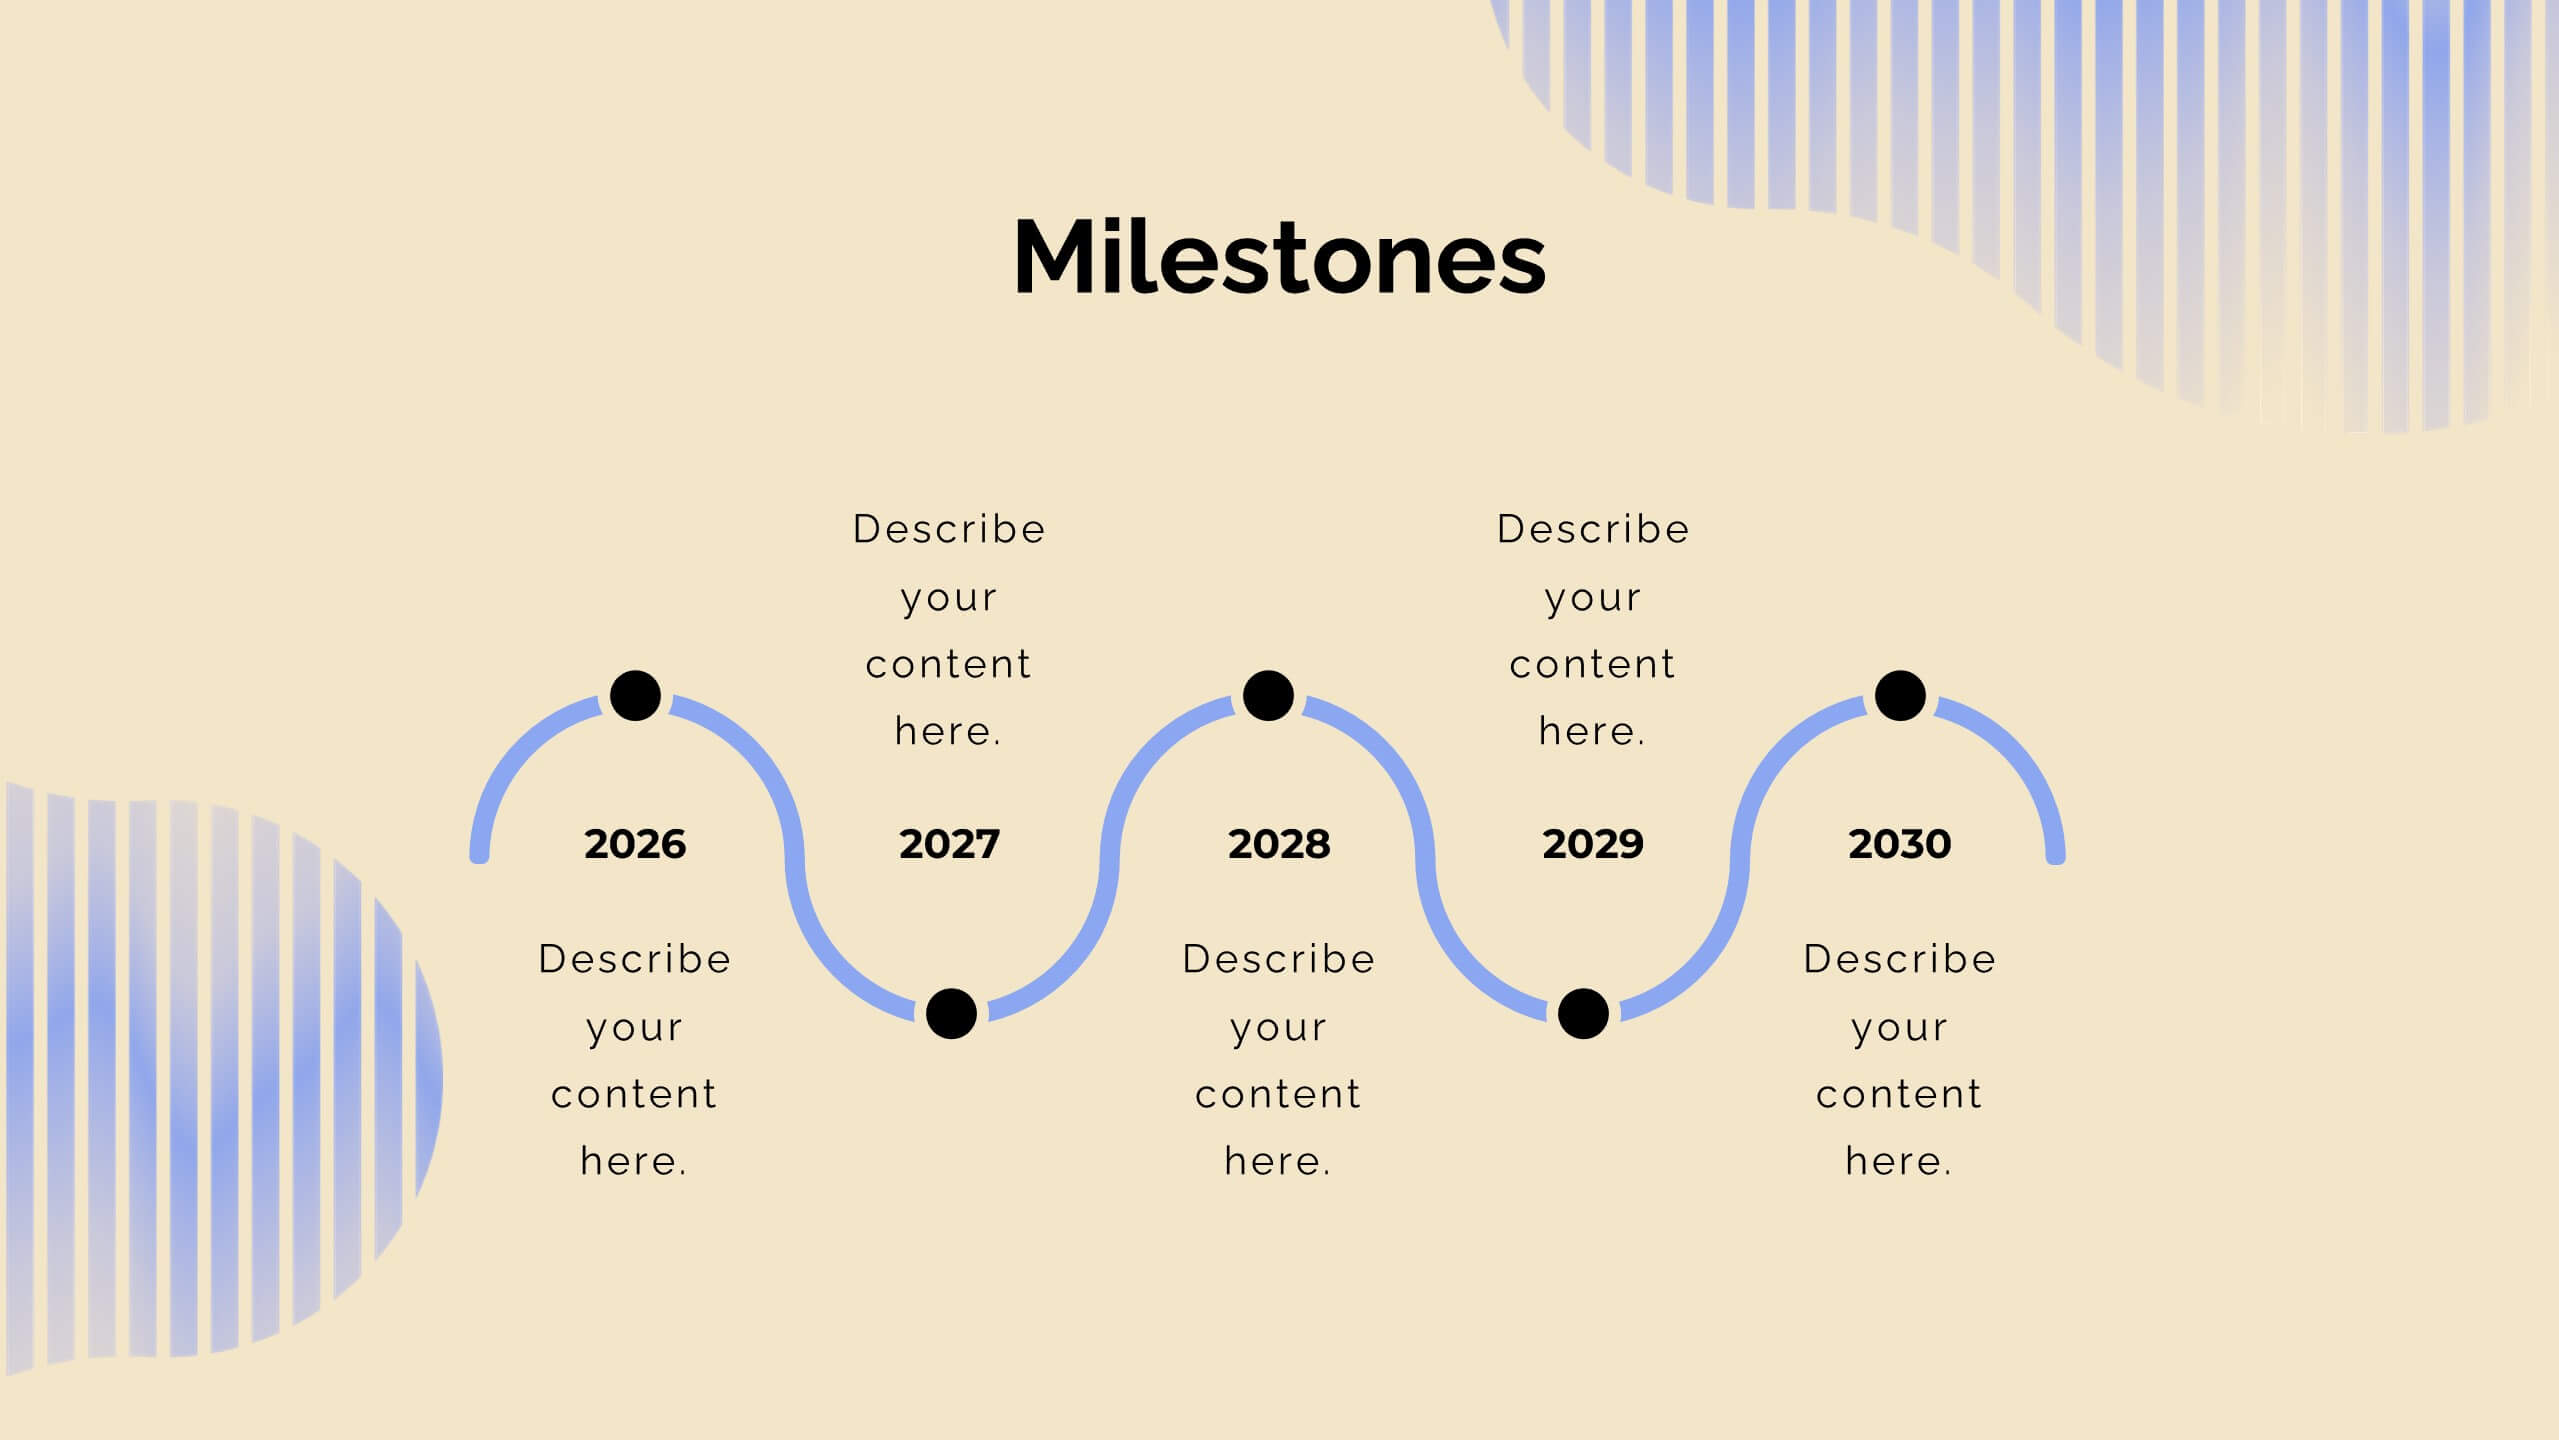
Planetar Startup Strategy Presentation
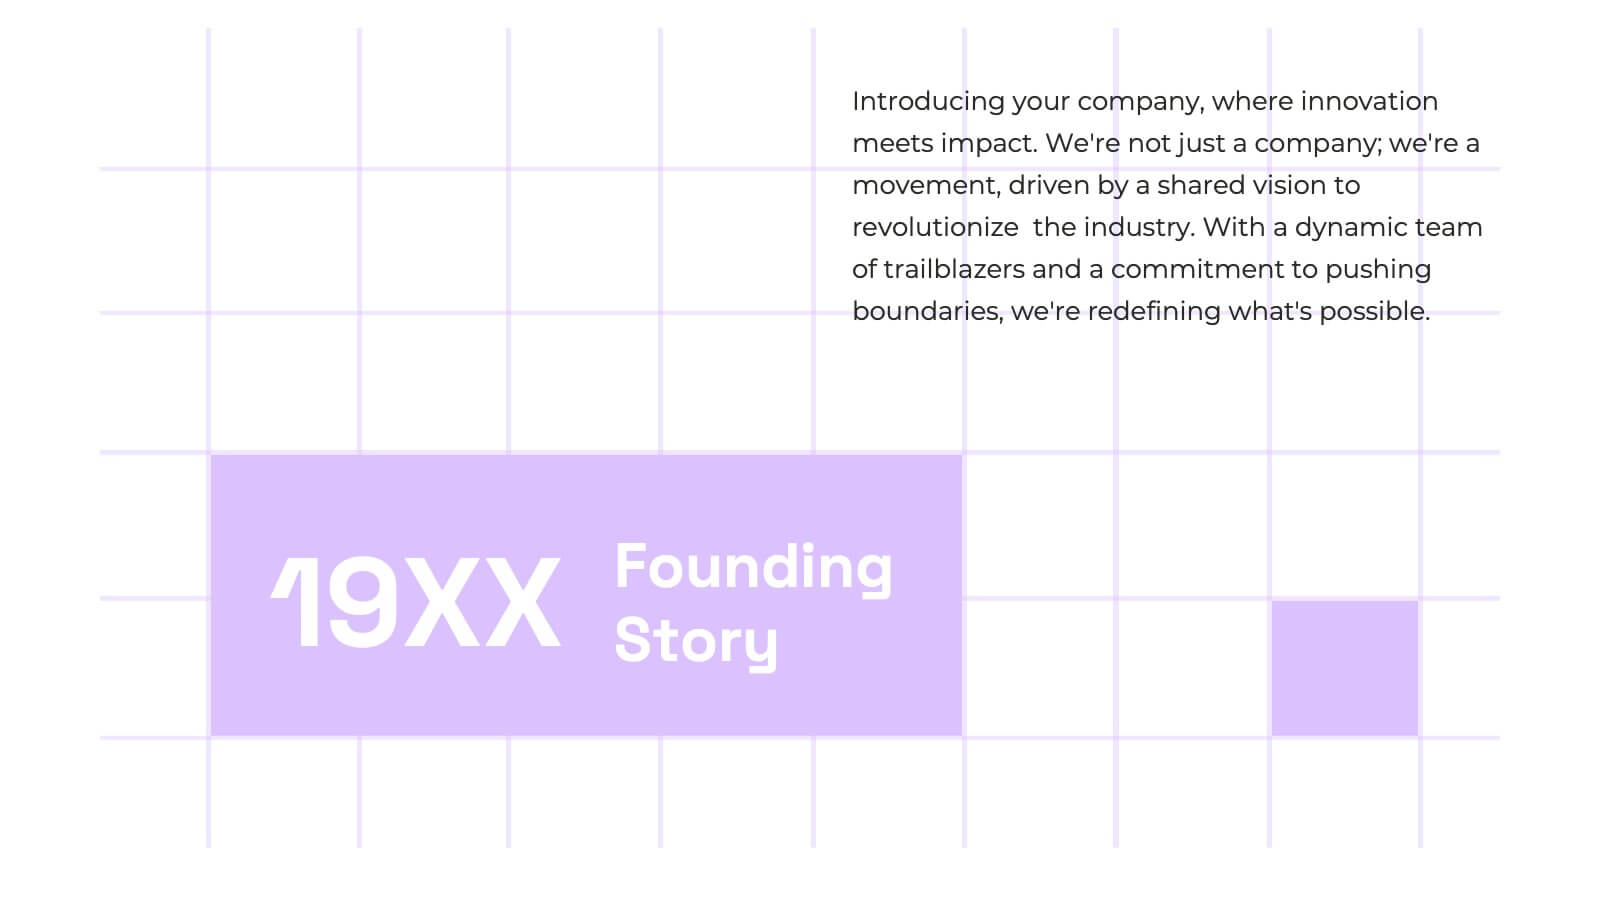
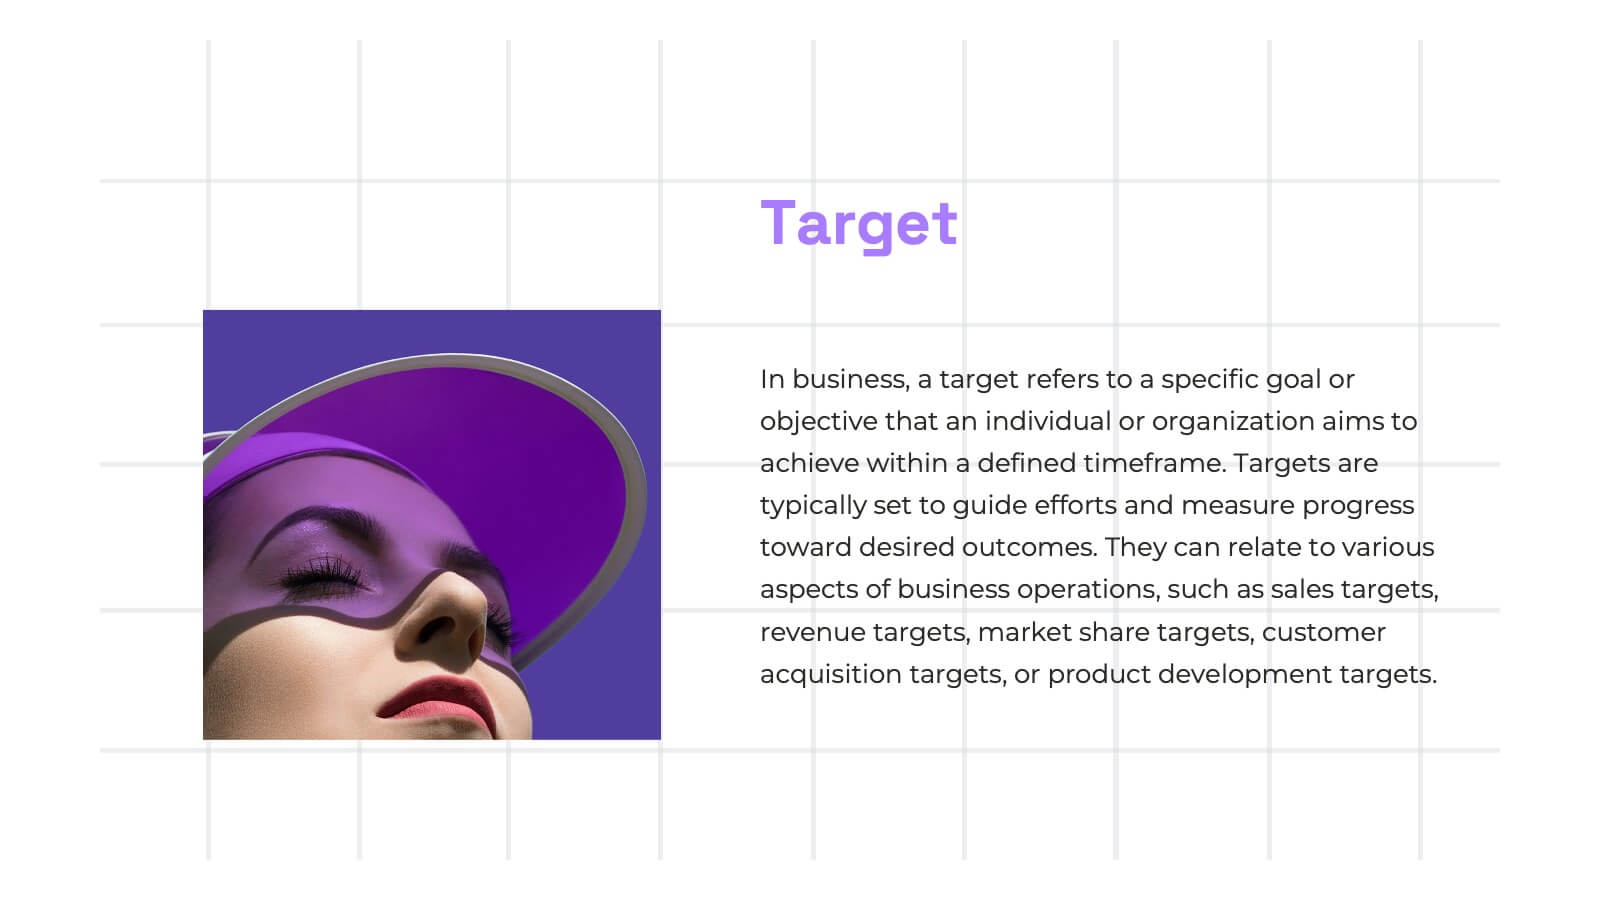
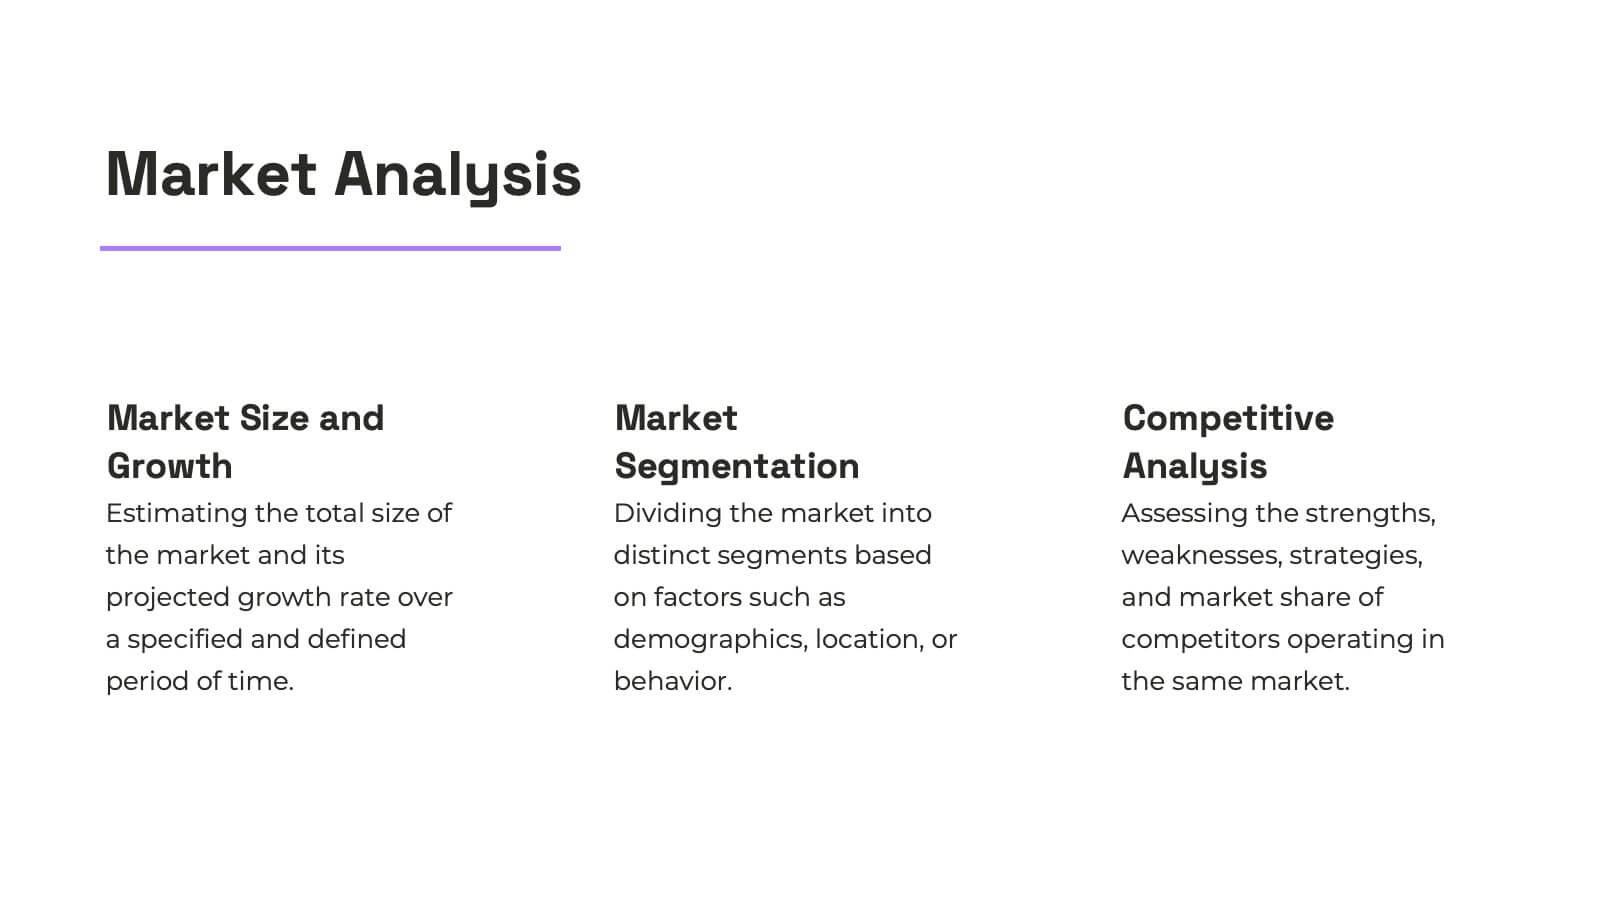
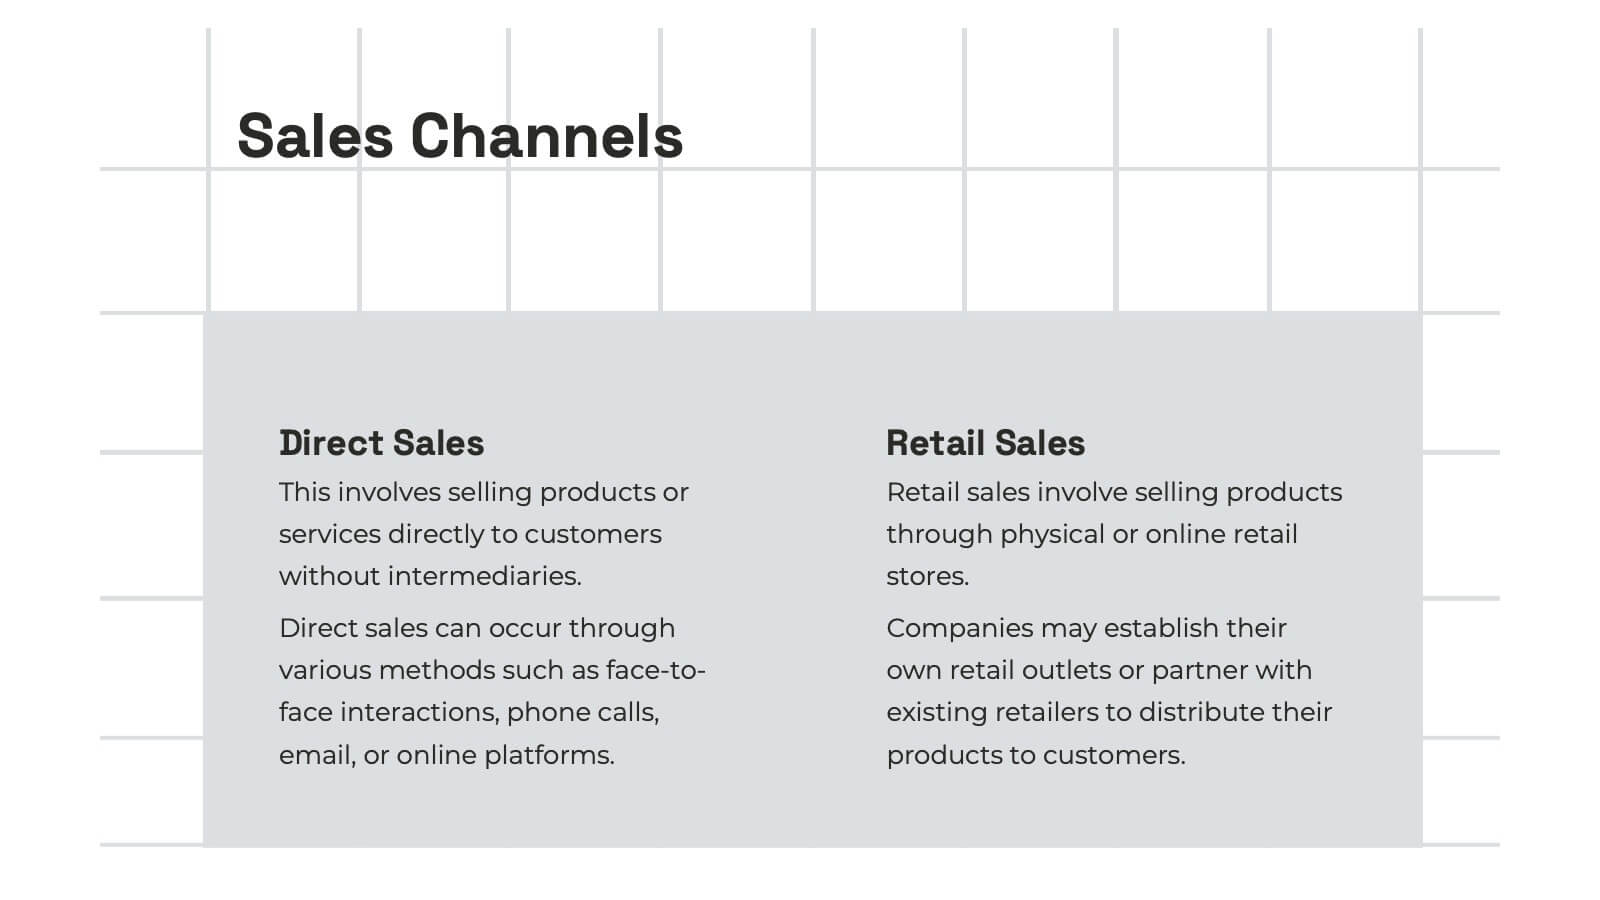
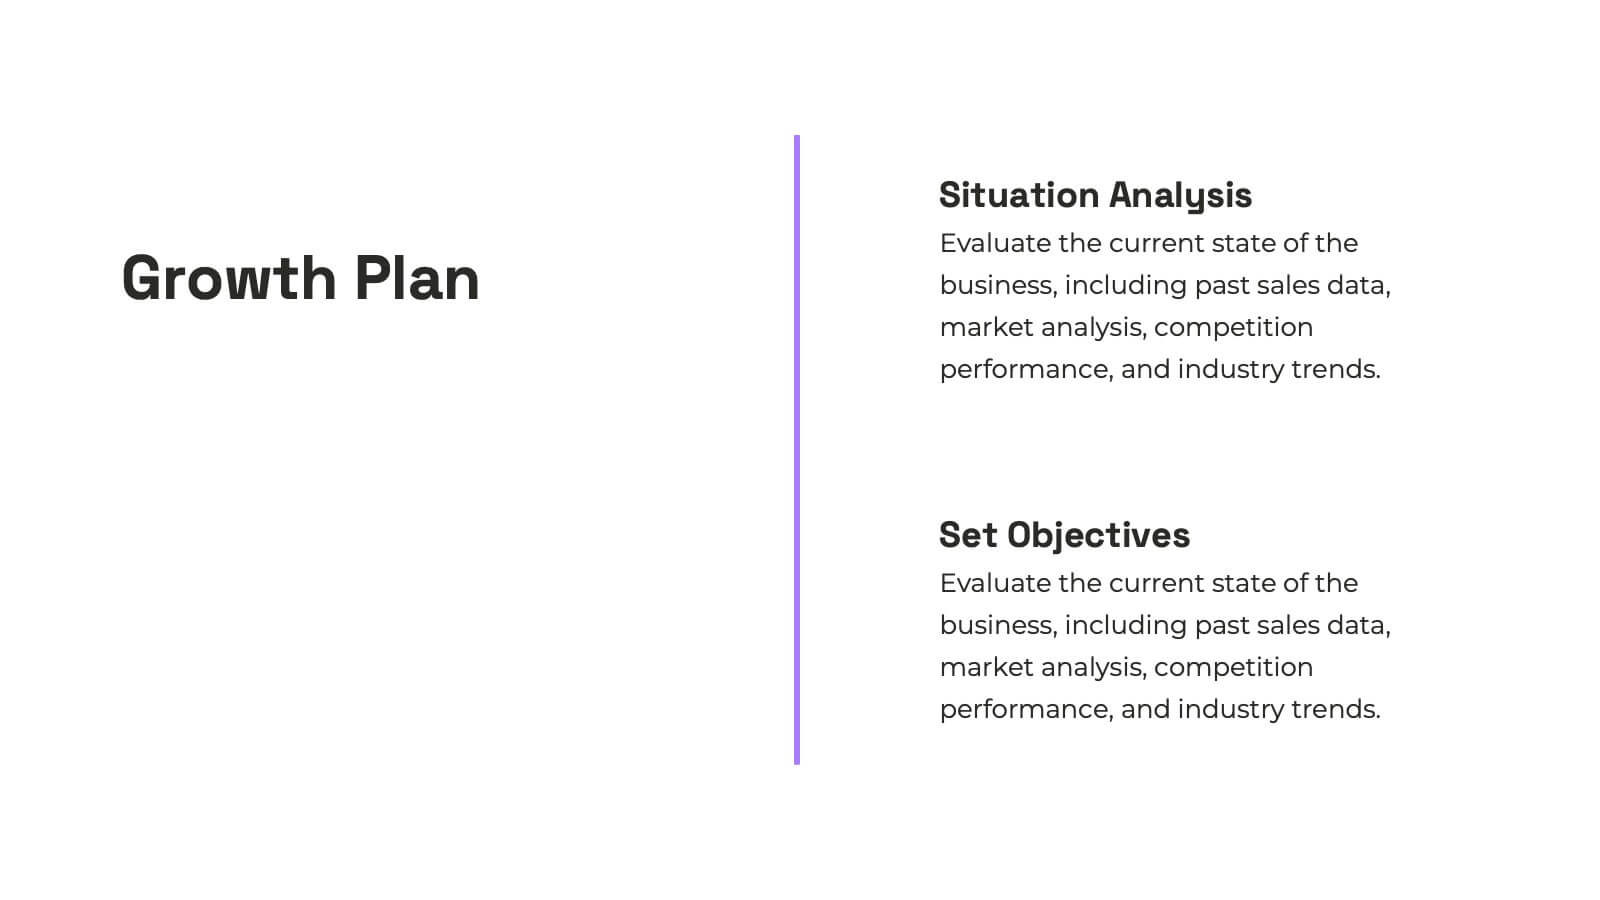
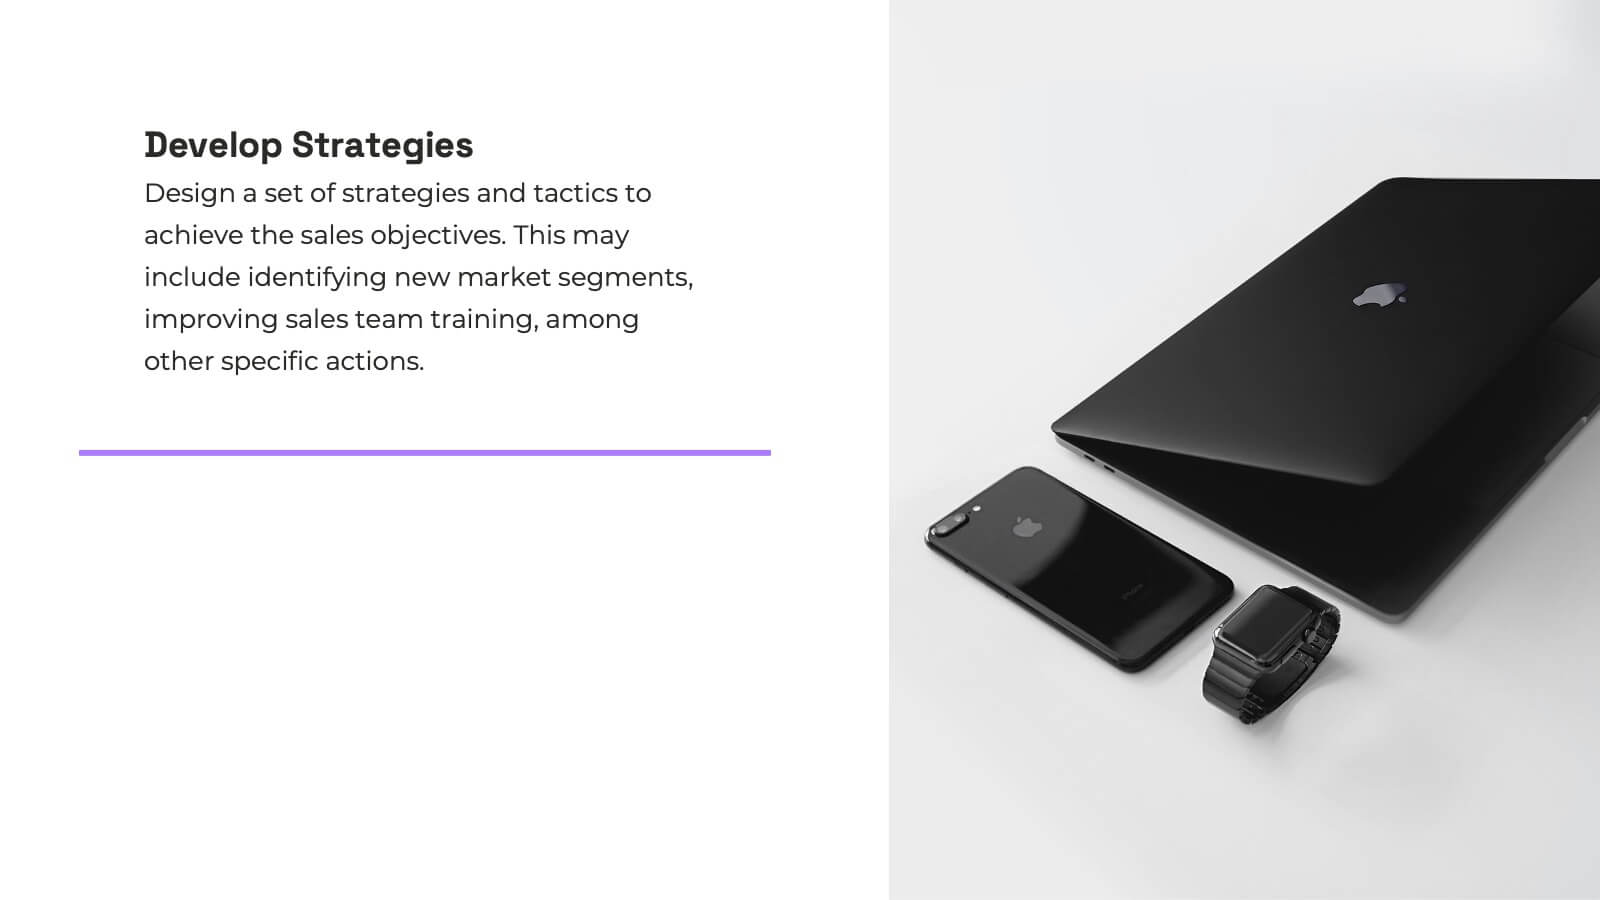
This Startup Strategy Presentation offers a modern and structured layout to showcase your startup’s mission, vision, market analysis, and financial projections. Designed for entrepreneurs and investors, it includes sections on customer needs, growth plans, and milestones. Fully customizable and compatible with PowerPoint, Keynote, and Google Slides.


23 slides
Journey Product Roadmap Presentation
Embark on a seamless journey through your product’s lifecycle with this comprehensive roadmap template! Perfect for illustrating key milestones, business models, and market opportunities, it’s your go-to for clear and engaging presentations. Dive into competitive analysis, showcase your unique selling proposition, and outline your growth projections with style. Compatible with PowerPoint, Keynote, and Google Slides.


7 slides
RACI Matrix Infographic Presentation Template
A RACI Matrix Infographic is a visual representation of the RACI model, which is used to clarify roles and responsibilities in an organization. The RACI model stands for Responsible, Accountable, Consulted, and Informed, and is a framework for defining the relationships between individuals and tasks in a project. This infographic displays a visual representation of the RACI matrix, showing the roles and responsibilities of each topic in a clear and organized manner. This Infographic can serve as a useful tool for managers and teams, as it can help to ensure clear communication and organization.


6 slides
Internal and External Communication Plan
Visualize your communication strategy with this dual-channel megaphone infographic, perfect for showcasing internal and external messaging flows. Ideal for corporate updates, PR plans, or stakeholder communications. Fully editable in PowerPoint, Keynote, and Google Slides.


23 slides
Blade Corporate Strategy Proposal Presentation
Prepare to captivate your audience with the Blade Corporate Strategy Proposal template! This sleek and modern design is perfect for professionals looking to present their strategic objectives with clarity and impact. The template features a balanced color palette of blue and white, exuding professionalism while ensuring your content stands out. From analyzing the current landscape to outlining key challenges and growth opportunities, each slide is meticulously crafted to convey your strategic vision effectively. The clean layout ensures that complex data, such as SWOT analysis, performance metrics, and competitive analysis, is easily digestible. With dedicated sections for team roles, resource allocation, and timelines, this template helps you guide your audience through every step of your strategic plan. Fully compatible with PowerPoint, Keynote, and Google Slides, the Blade template is your go-to choice for delivering presentations that resonate with decision-makers and stakeholders alike.


22 slides
Nexus Startup Growth Plan Presentation
Jumpstart your business journey with this dynamic presentation template! Ideal for outlining your startup growth plan, it covers mission, vision, market analysis, and financial projections with sleek, professional slides. Capture investor interest and articulate your strategy effortlessly. Compatible with PowerPoint, Keynote, and Google Slides, ensuring seamless presentation across all platforms.


26 slides
Jenzen Presentation Template
Jenzen is a modern multi-purpose template with warm tones for coaching and investing. Jenzen is suitable for all types of businesses Its slide designs can be used in conjunction with each other, making it perfect for sharing information about the various services available to customers. It's easy to use, resulting in high quality presentations. Its slide designs can be used with each other to create more elaborate presentations complete with charts, images and text boxes. It's simple yet stylish design makes it easy for anyone to use and is for both personal use as well as professional use.


5 slides
Student Progress Report Presentation
Track academic milestones with this Student Progress Report Presentation. Featuring a stair-step puzzle layout topped with a graduation cap, it visually represents growth across four key areas. Ideal for educators, counselors, or school administrators. Fully editable in PowerPoint, Keynote, and Google Slides.


5 slides
Division List Infographics
A Division List is a list of items or numbers that have been divided or categorized based on a certain criterion or set of criteria. These Infographics are visual representation of data that allows you to divide and categorize information into smaller groups or categories. These can be used to display any kind of data that requires grouping, such as military ranks, airlines, religion or virus symptoms. This template is designed using bold colors, various shapes, and icons to make the data more engaging and visually appealing. These are perfect for business presentations, marketing campaigns, and educational materials.


7 slides
Project Proposal Infographic
Enhance your project presentations with our Project Proposal Templates, designed to outline your project comprehensively and engage stakeholders effectively. These templates provide a structured way to present every aspect of the project, from the scope and objectives to the resources and timelines, ensuring all key elements are covered. Each slide is crafted with a professional design, featuring a cohesive green color scheme that not only adds visual appeal but also aids in the organization of information. The templates include various sections such as project background, key objectives, project scope, implementation steps, and projected benefits, which are essential for outlining a clear and detailed project plan. Ideal for project managers, business analysts, and team leaders, these templates can be fully customized to match the specifics of your project, allowing for the addition of text, charts, and graphics as needed. Whether for internal reviews or external pitches, these slides will help you articulate your vision and strategy effectively, fostering clarity and facilitating decision-making.


10 slides
Corporate Business Plan Strategy Presentation
Present your strategy with professionalism using this Corporate Business Plan slide. Designed with a handshake graphic and clean icon-labeled sections, this layout is ideal for showcasing four key pillars—such as partnerships, operations, goals, and performance. Each title is fully editable, helping you keep your message clear and concise. Compatible with PowerPoint, Keynote, and Google Slides.


7 slides
Demographic Segmentation Infographic Presentation
A Demographic Infographic is designed to provide a quick and easy-to-understand snapshot of the key demographic trends and insights. This Template is easy to edit and intuitive, so you can create a stunning presentation in minutes. With this template, you can focus on your content and the design. It's a multipurpose template which means it can be used for different topics: business, education, marketing, and more. You can use this as a template to explain concepts related to your studies, statistics or market research. This template is compatible with Powerpoint, Keynote and Google Slides.


21 slides
Sonata Product Roadmap Presentation
Navigate the future of your product with a structured and compelling roadmap presentation template. Designed for product managers, entrepreneurs, and teams, this layout provides a clear framework to outline product goals, strategies, and timelines effectively. The template includes sections for product overviews, customer pain points, unique value propositions, competitive analysis, pricing strategies, and user experience mapping. It also features slides for stakeholder communication, marketing rollouts, and technical specifications to ensure every aspect of your product journey is covered. Fully compatible with PowerPoint, Google Slides, and Keynote, this template is easy to customize with your brand’s colors, fonts, and visuals. Present your product's roadmap confidently, engaging stakeholders and aligning your team towards success.


7 slides
Africa Map Infographic Presentation Template
The African continent is home to a great deal of linguistic and cultural diversity. Africa has approximately one-third of the world's languages. There are at least seventy-five African languages with more than one million speakers. The diversity of Africa's languages is evidenced by their populations. This template features fully editable vector shapes of countries, national flags and lines to highlight routes across this diverse continent. Use this Africa map template to illustrate the countries of Africa and their borders. You can easily add information, such as other icons in the blank spaces.


8 slides
Customer Feedback and Review
Highlight real user opinions with this Customer Feedback and Review presentation. Designed to showcase testimonials, star ratings, and satisfaction percentages, each slide offers a clean, card-style layout perfect for product reviews, client testimonials, or user surveys. Fully customizable in PowerPoint, Keynote, and Google Slides.


7 slides
Transportation & Logistics Infographic PowerPoint Template and Google Slides Theme
A transportation & logistics infographic is a visual representation of information and data related to the movement of goods and people from one place to another. This template can be used to convey complex information about a variety of topics in the transportation and logistics industry. This template includes many graphics, images, and charts to help illustrate your data, and allows you to Input your shipping routes, delivery times, and flow of goods. This template can be used for various purposes, such as educating the public and promoting efficient transportation and logistics practices.