


Features
- 26 Unique slides
- Fully editable and easy to edit in Microsoft Powerpoint, Keynote and Google Slides
- 16:9 widescreen layout
- Clean and professional designs
- Export to JPG, PDF or send by email


Do you have any questions?
Recommend


20 slides
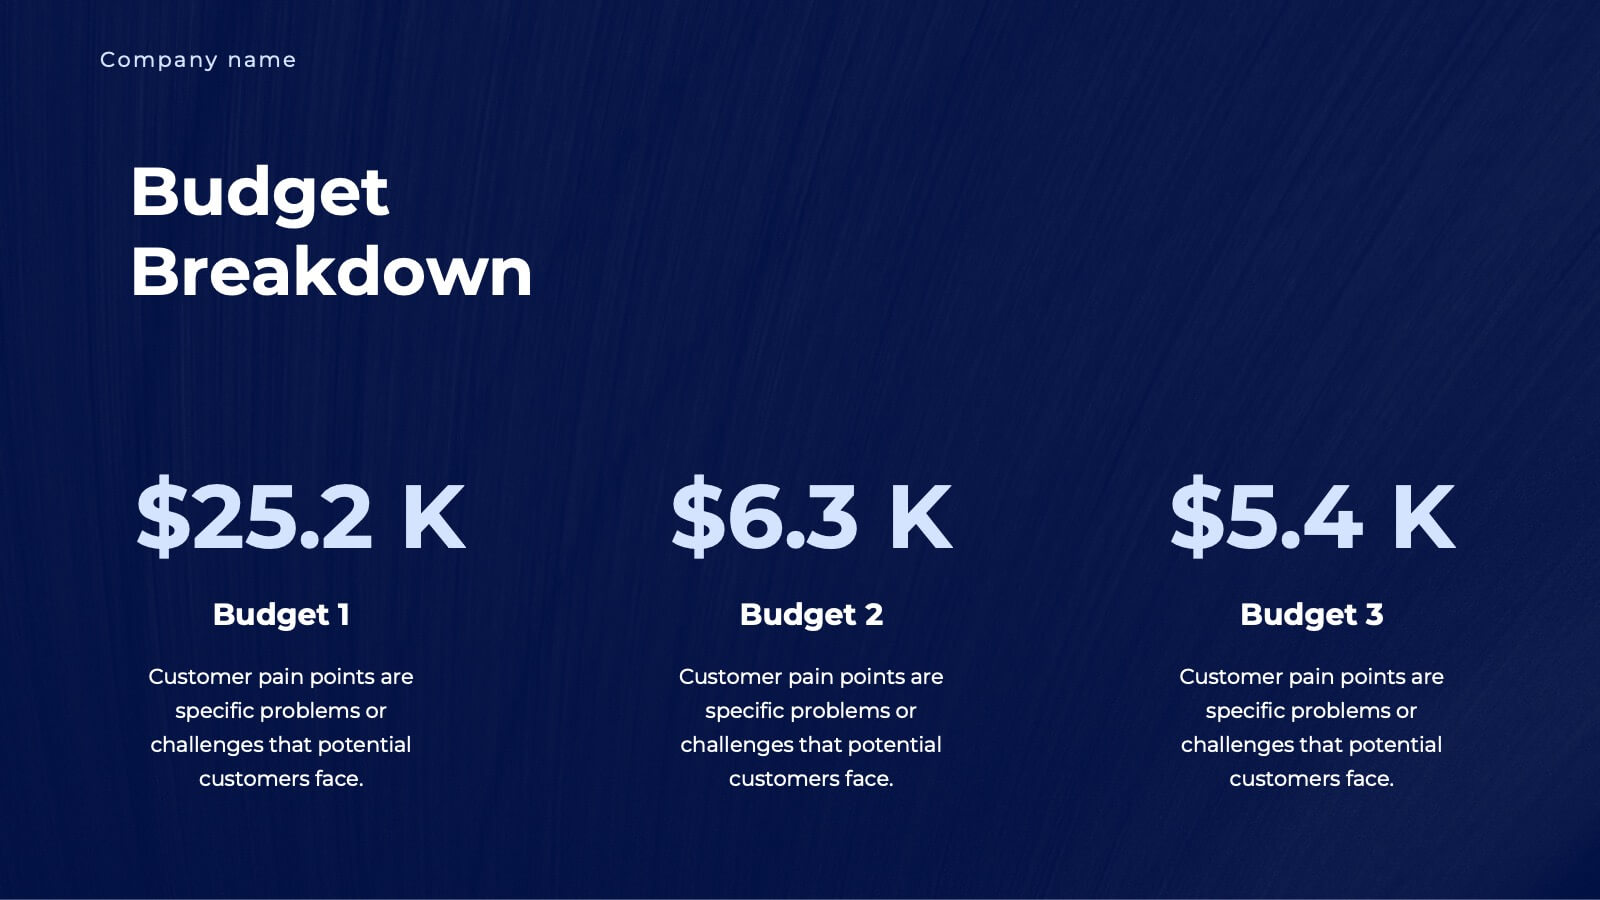
Museara Sales Pitch Deck Presentation
Create a compelling sales pitch with this dynamic and modern presentation template. It includes key sections like company overview, competitive analysis, pricing strategy, and future opportunities to help you showcase your value proposition effectively. Ideal for startups and enterprises alike. Compatible with PowerPoint, Keynote, and Google Slides for easy editing.


4 slides
Social Campaign Planning Presentation
Bring clarity to your outreach goals with a bold, funnel-style layout that makes every campaign step easy to visualize. This presentation helps you outline stages, objectives, and audience actions in a clean, structured format ideal for marketing teams. Fully editable and compatible with PowerPoint, Keynote, and Google Slides.


22 slides
Chromatic Academic Research Report Presentation
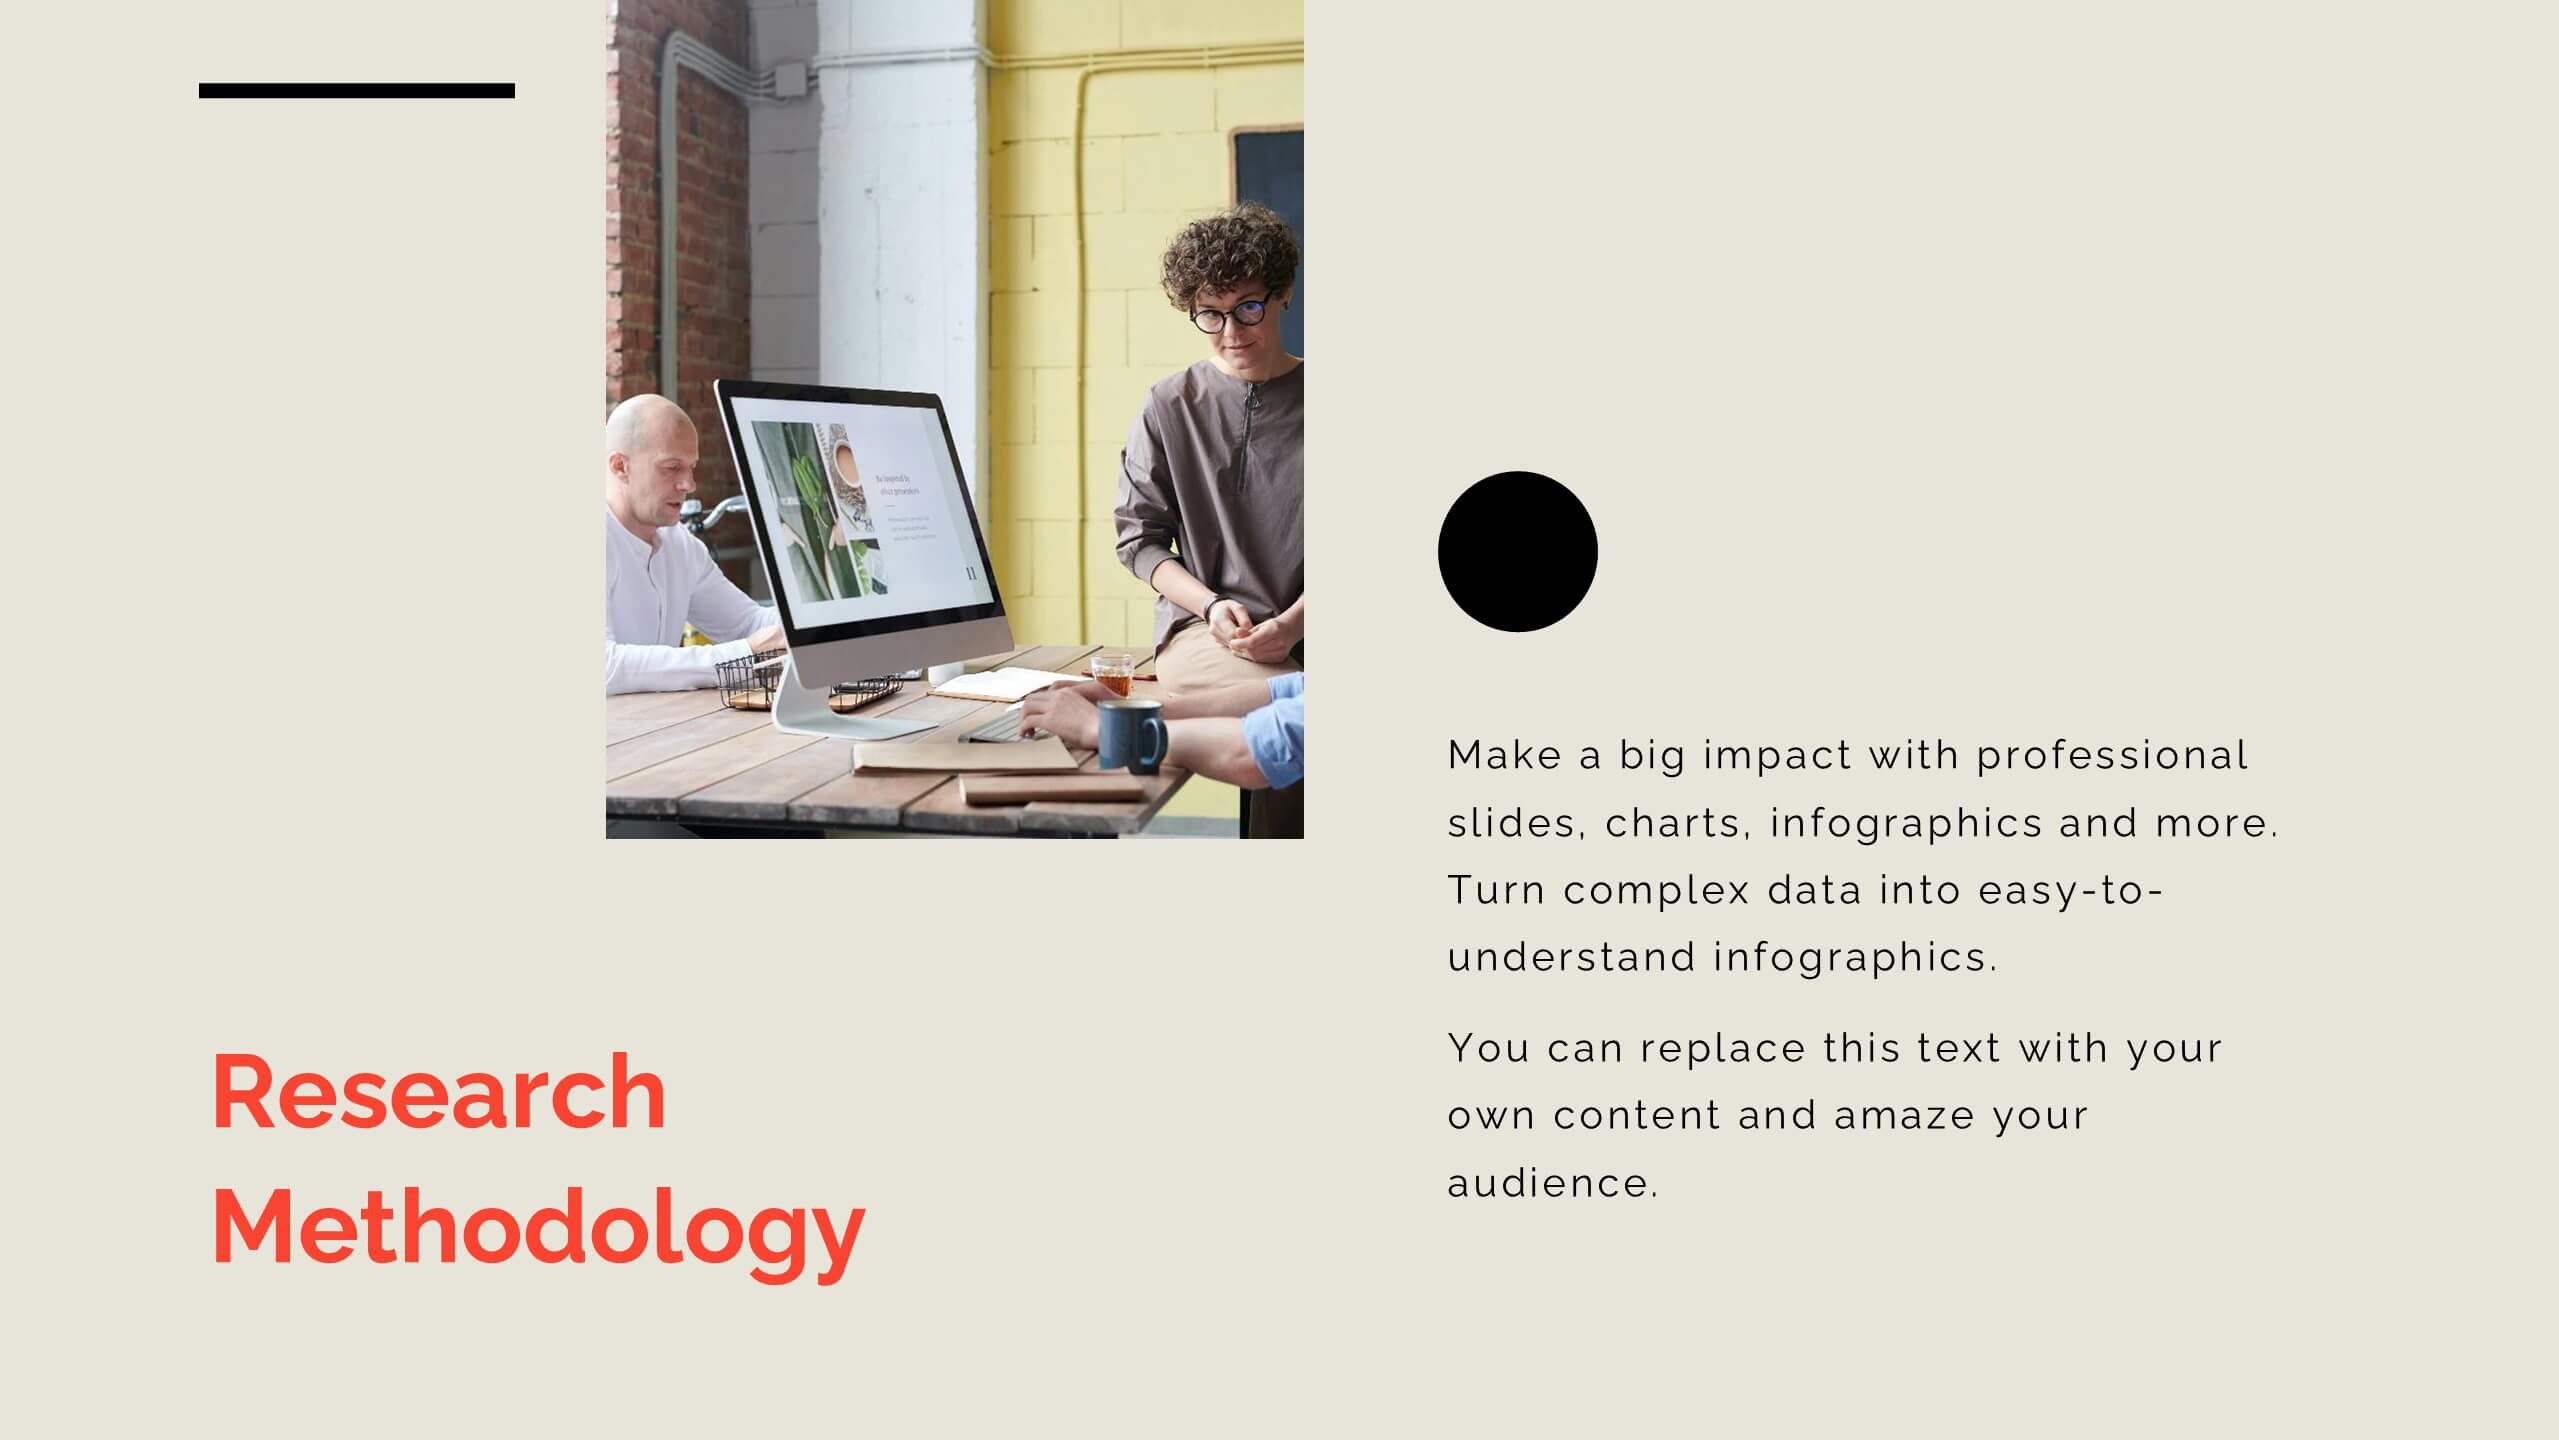
A structured template for academic research proposals, covering objectives, methodology, findings, and implications. Ideal for detailed presentations of data, analysis, and future research directions. Compatible with PowerPoint, Keynote, and Google Slides, it offers a professional layout for academic, scientific, or market research presentations.


8 slides
Business Gap Analysis Framework Presentation
Identify key business gaps with this Business Gap Analysis Framework presentation template! Featuring a structured layout that highlights the current state, desired state, and actionable steps to bridge the gap, this template is perfect for strategic planning, performance reviews, and business growth discussions. Fully customizable and compatible with PowerPoint, Keynote, and Google Slides.


22 slides
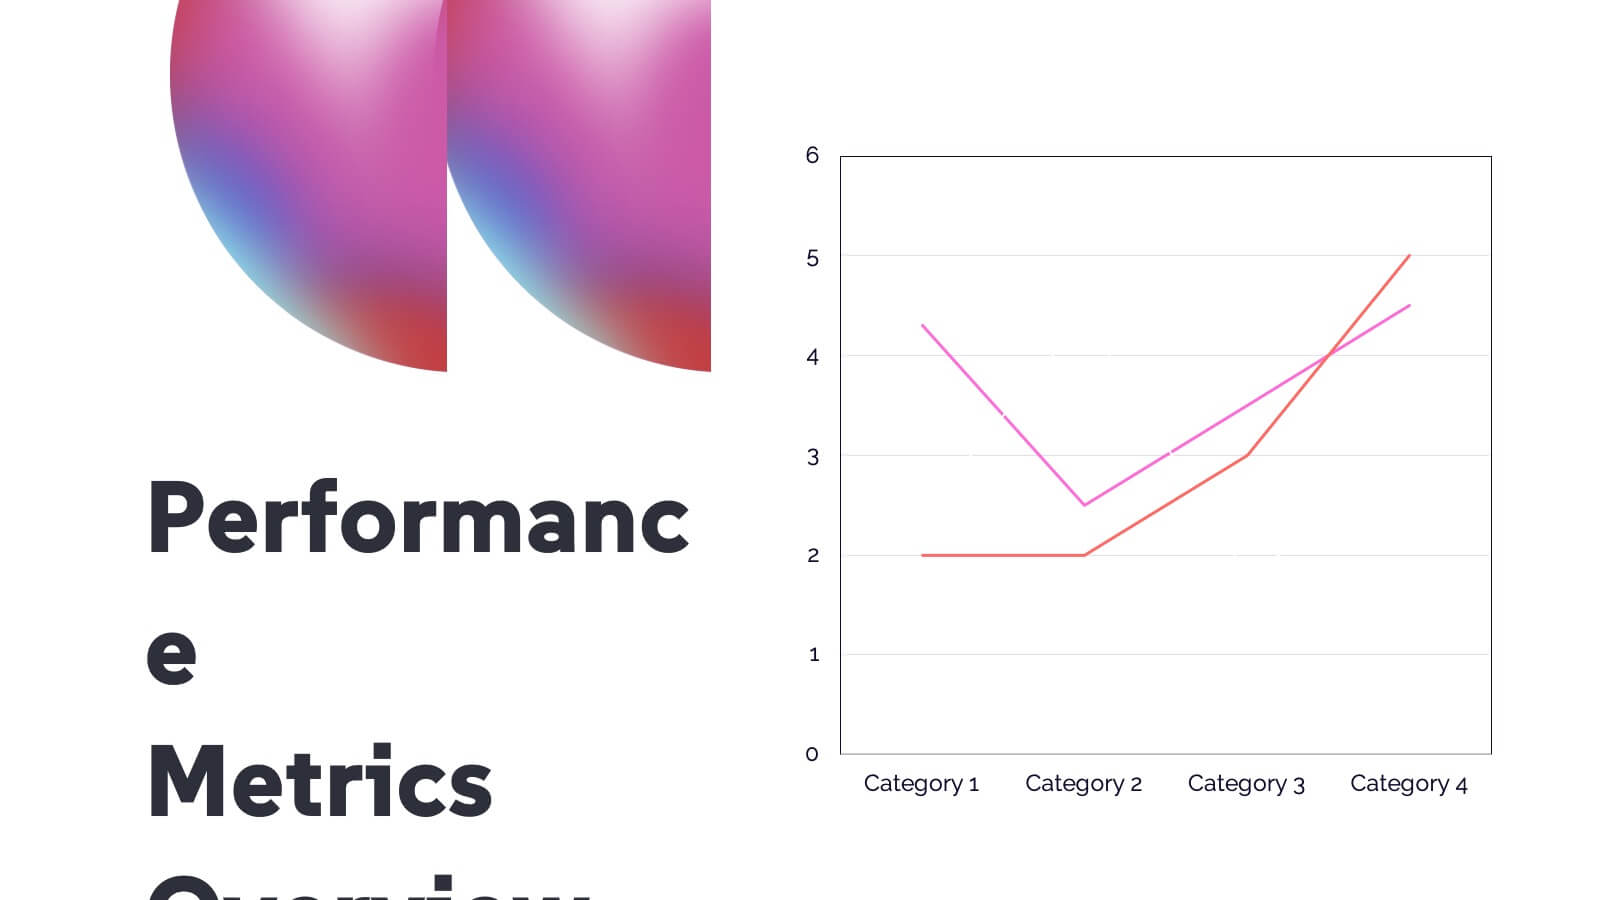
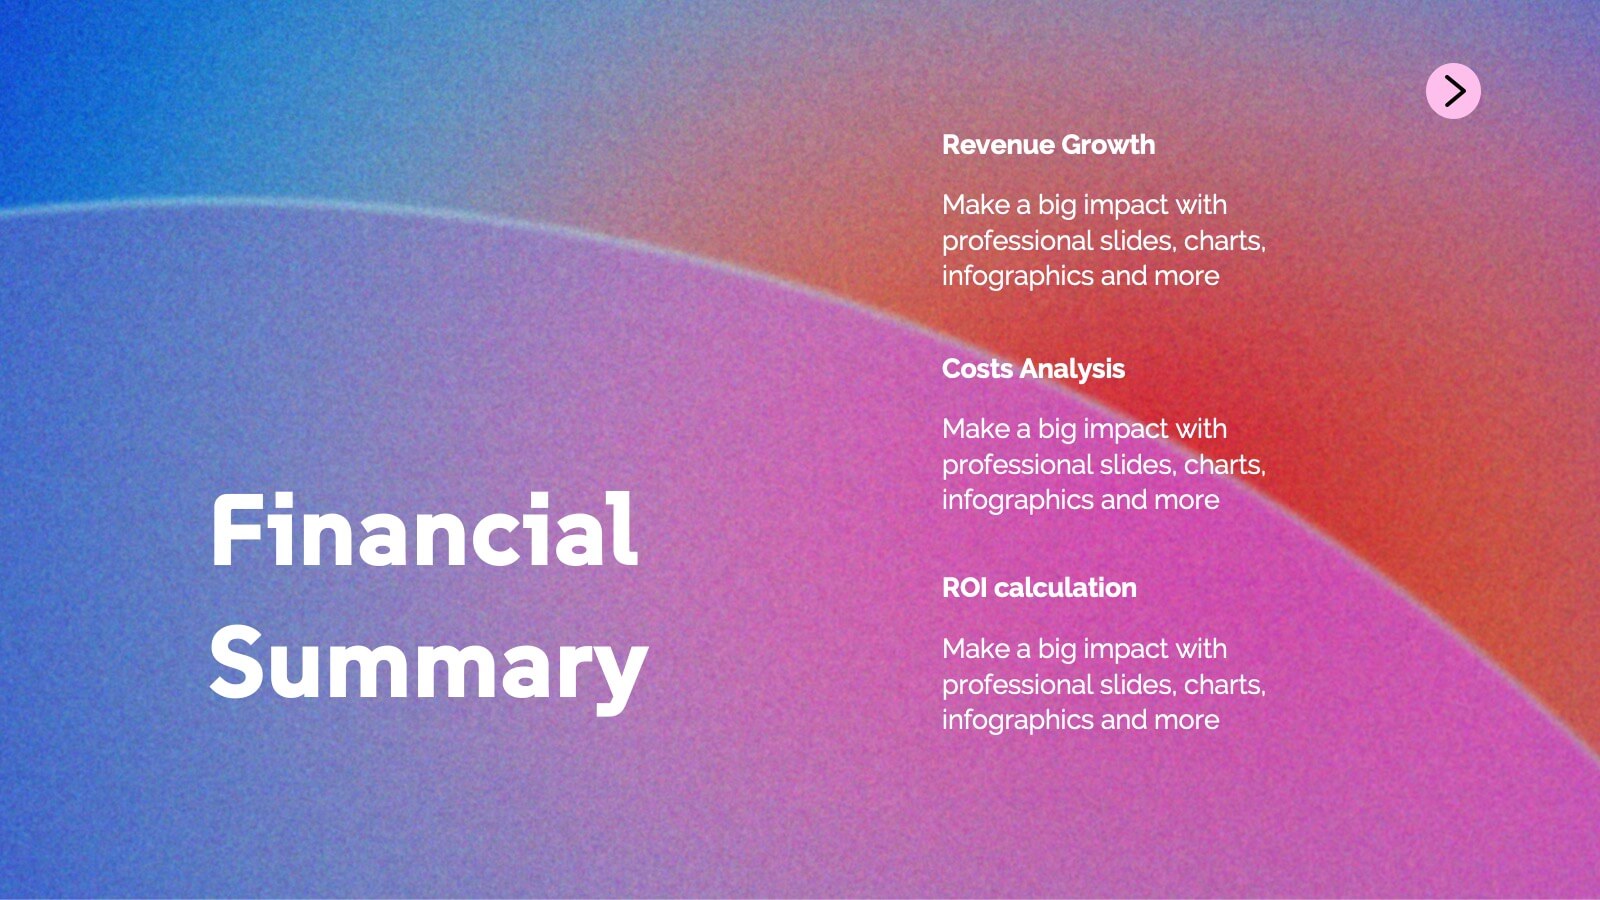
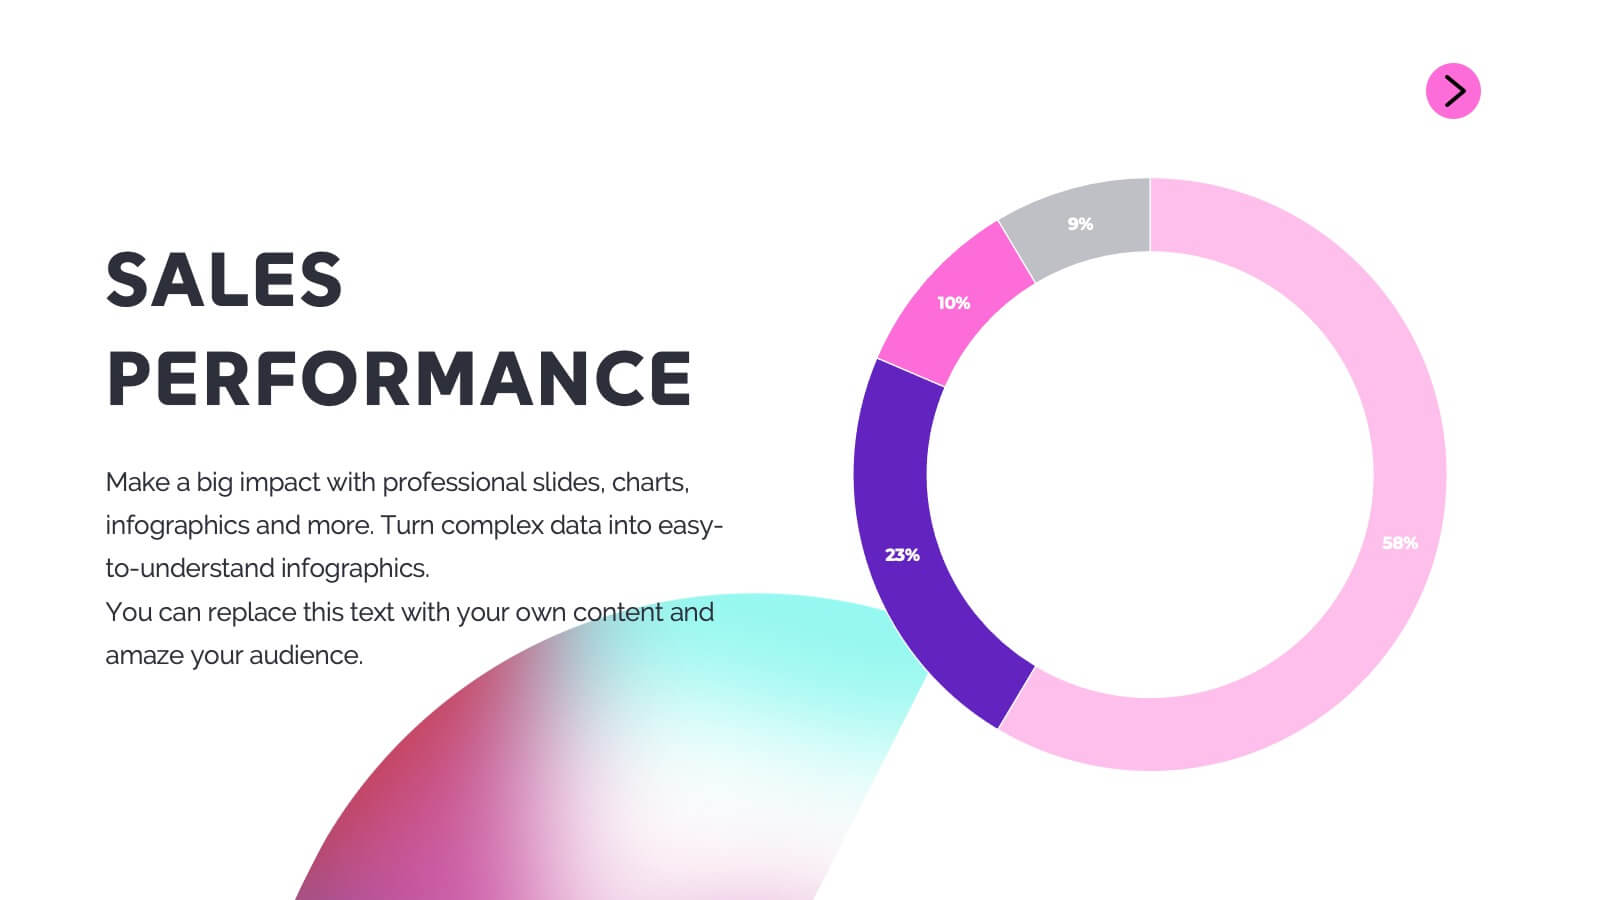
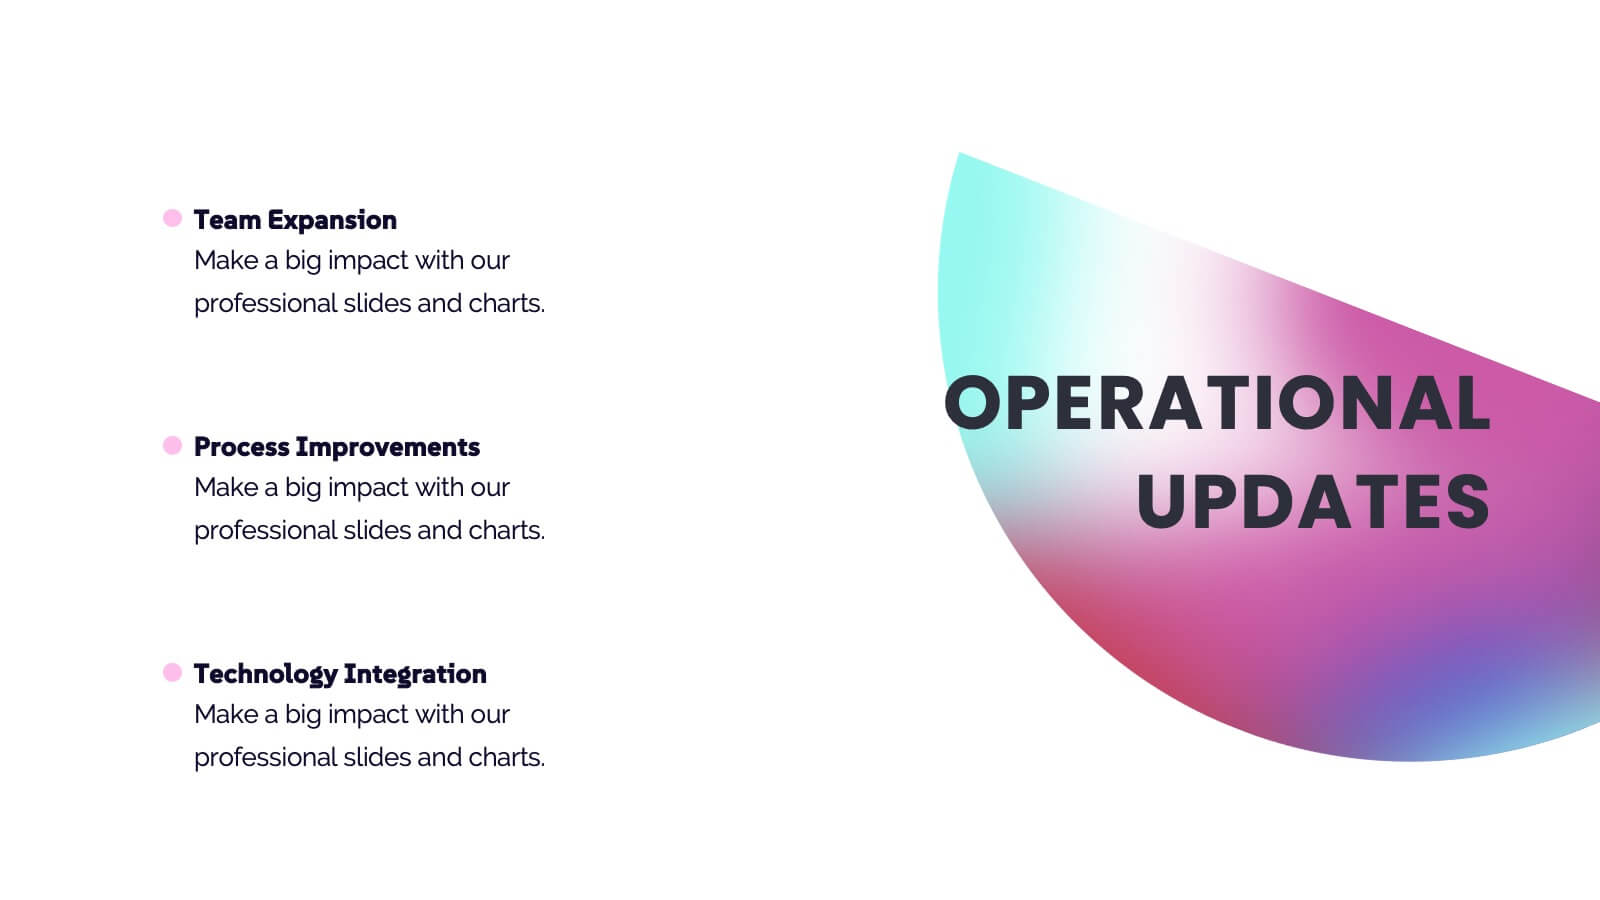
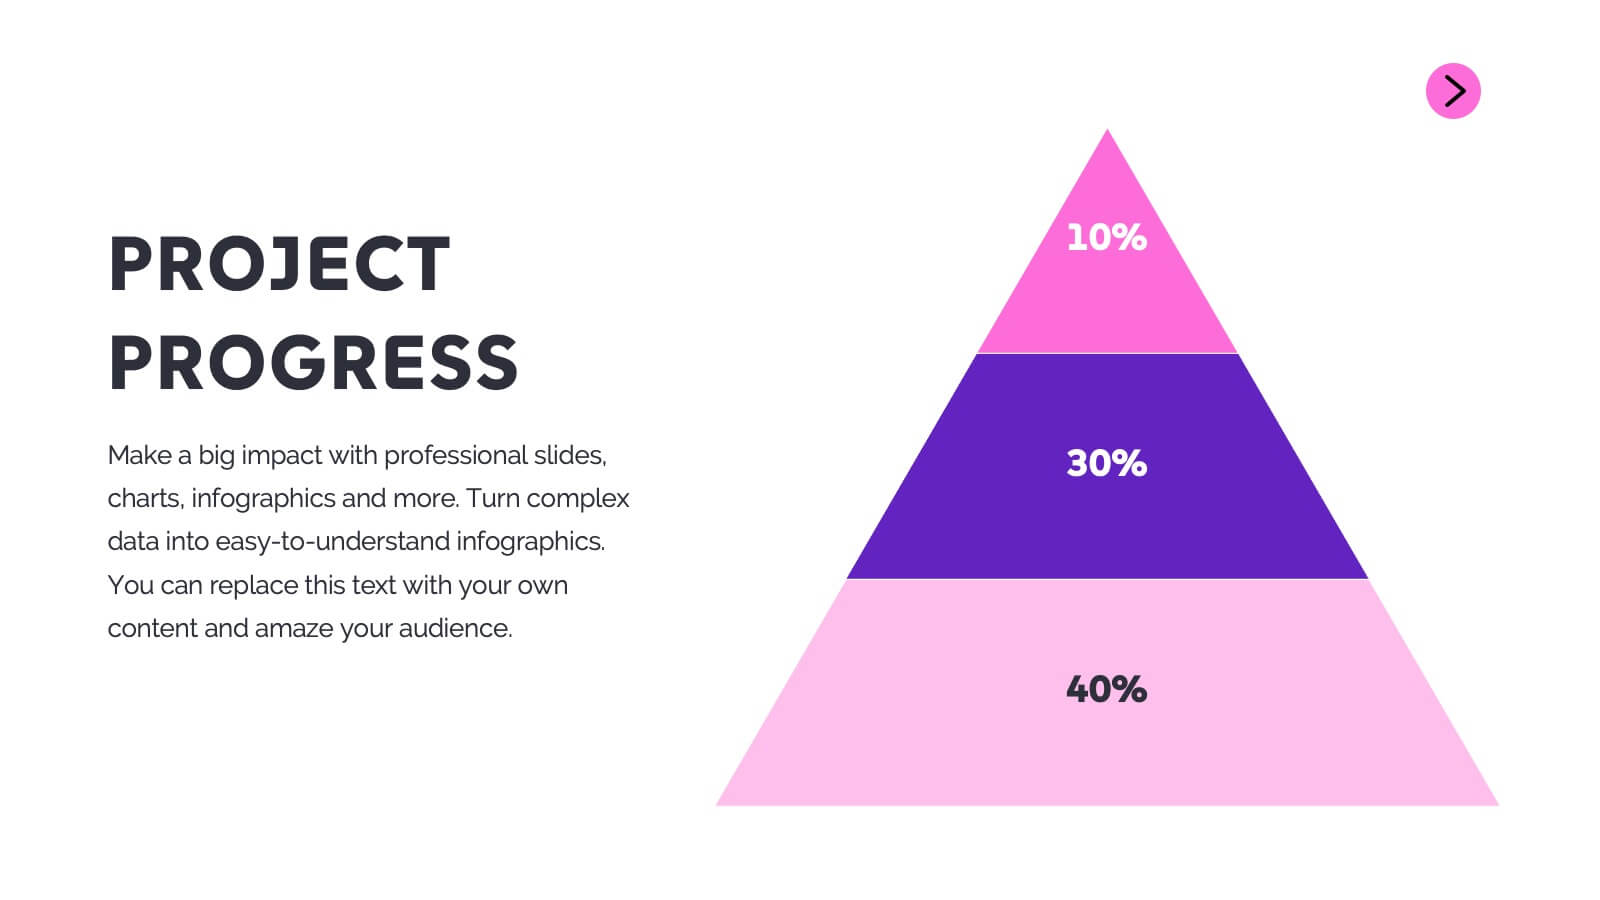
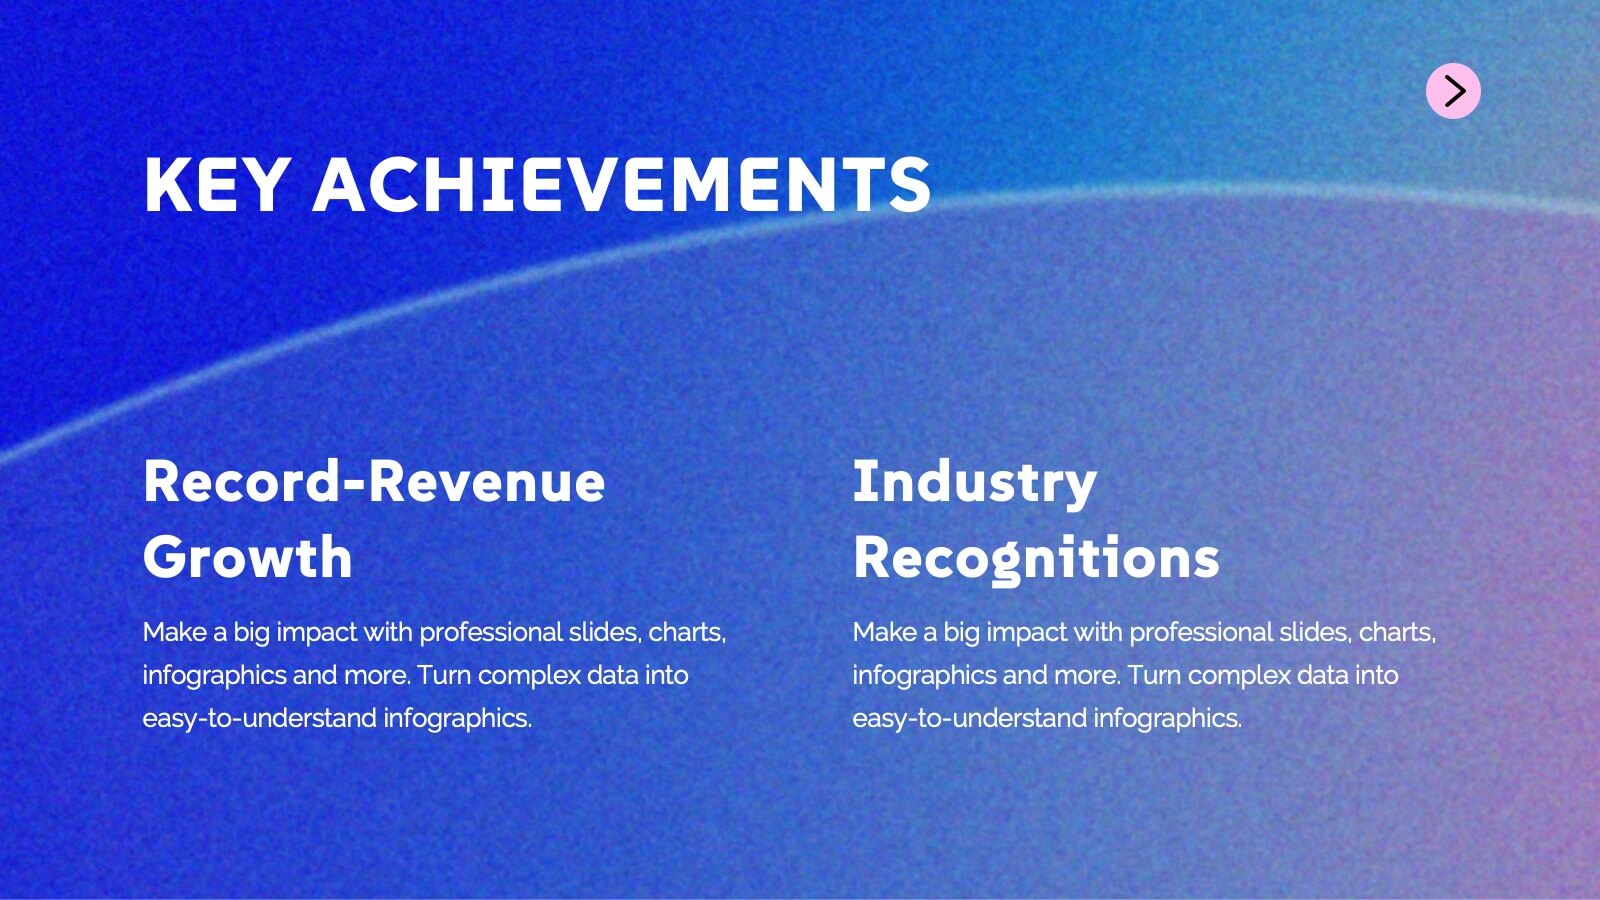
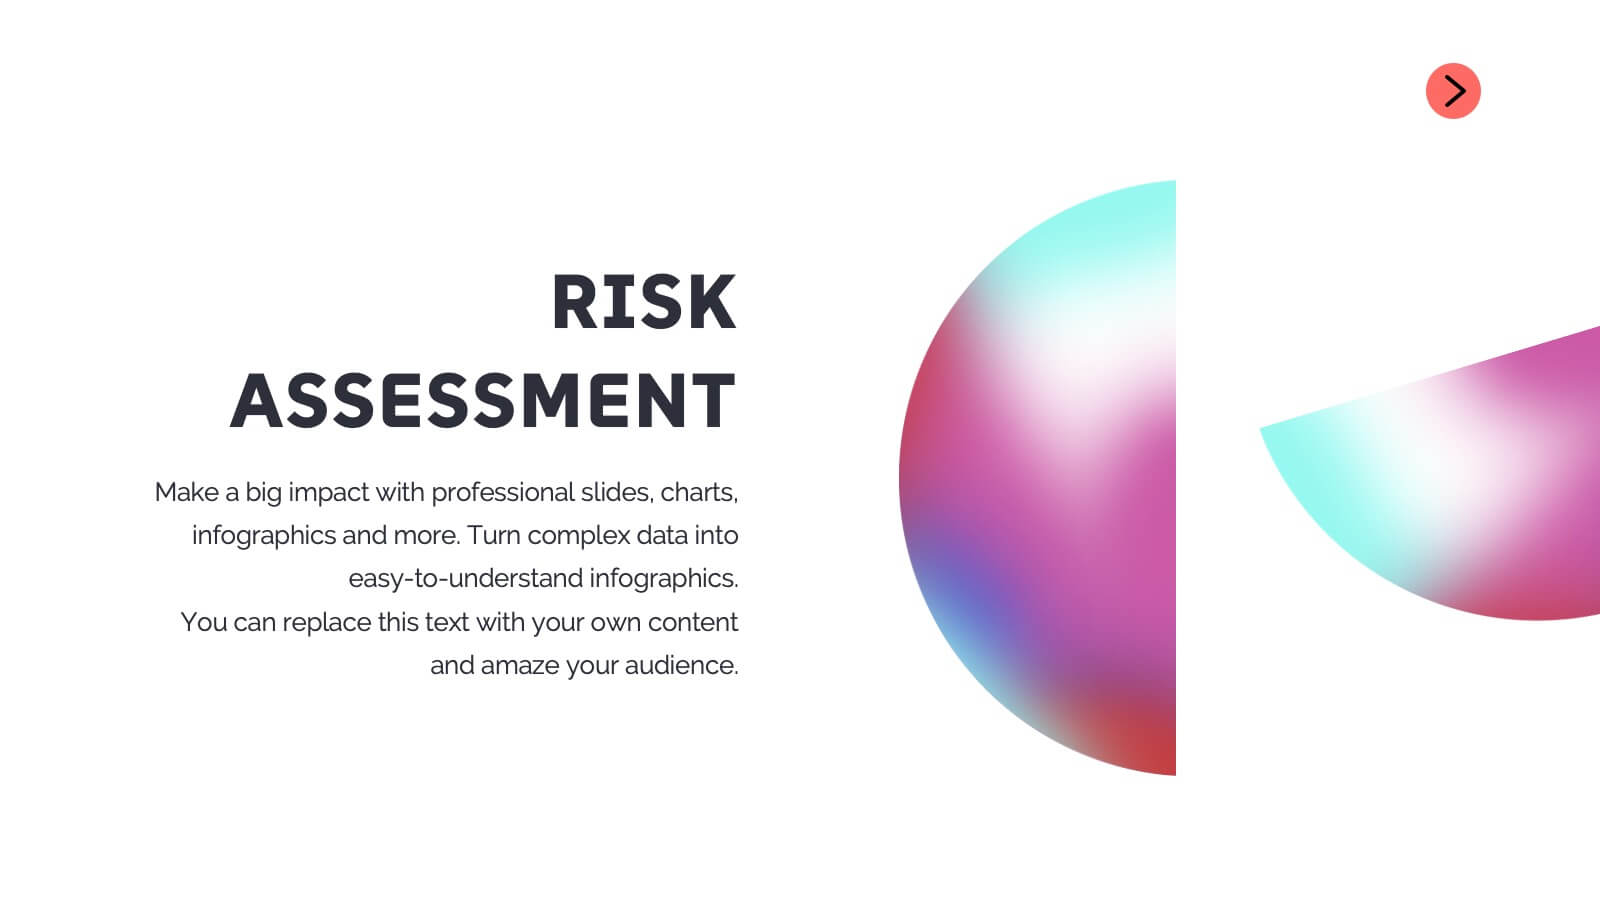
Sphinx Project Status Report Presentation
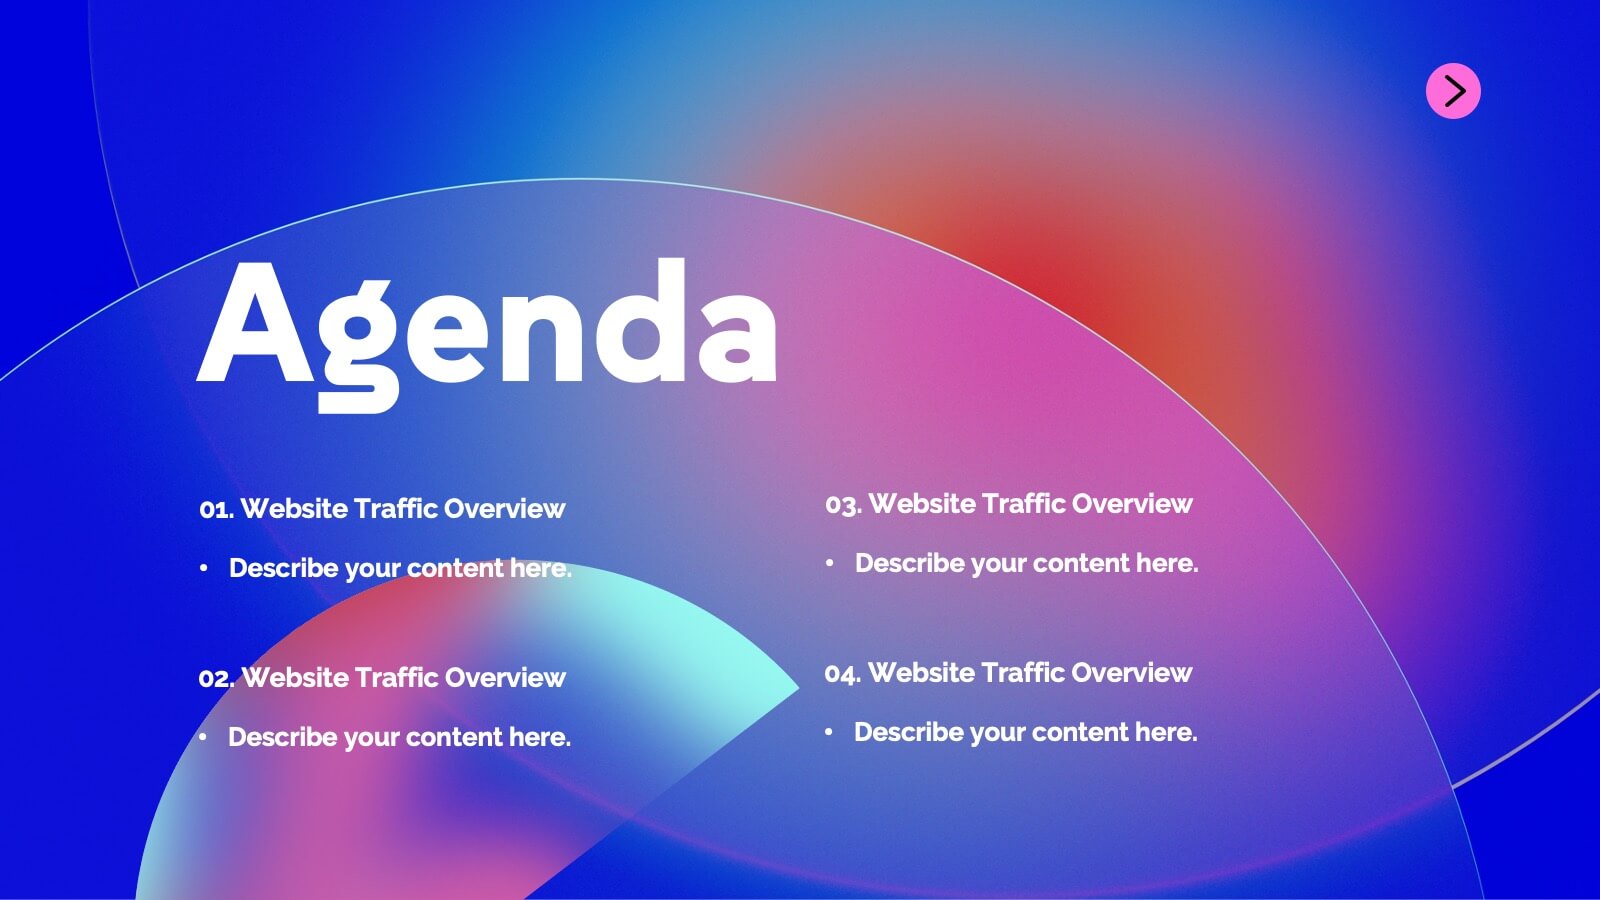
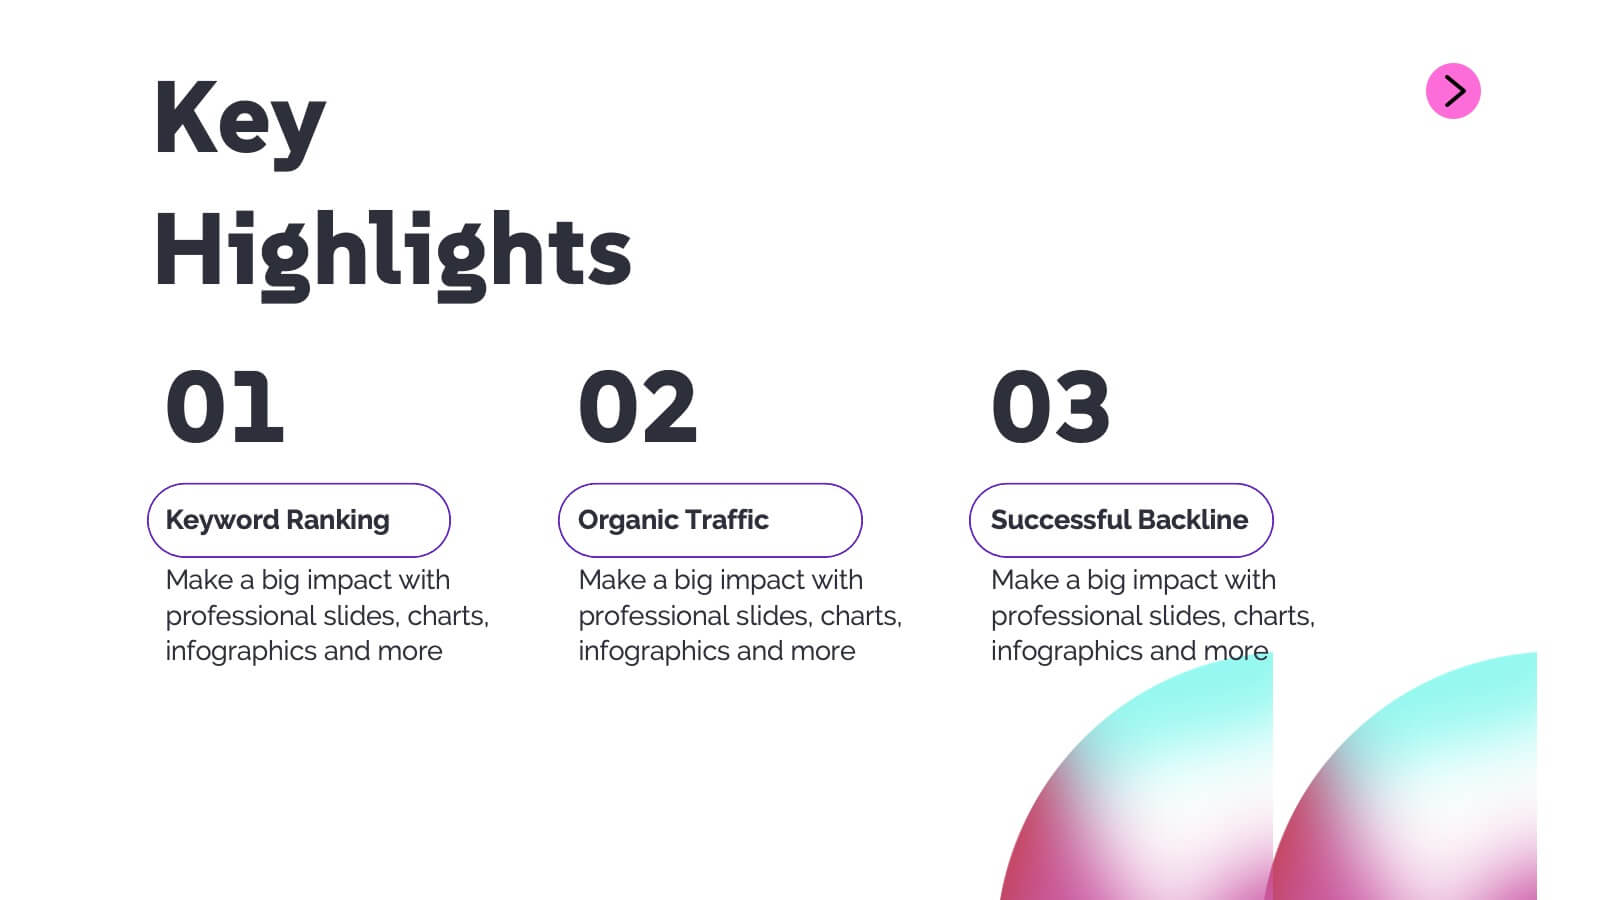
This modern project status report template is perfect for tracking progress and highlighting key achievements. It includes sections for performance metrics, financial summaries, challenges, and strategic initiatives. Keep stakeholders informed with clear, concise updates. Compatible with PowerPoint, Keynote, and Google Slides for easy customization and presentation.


6 slides
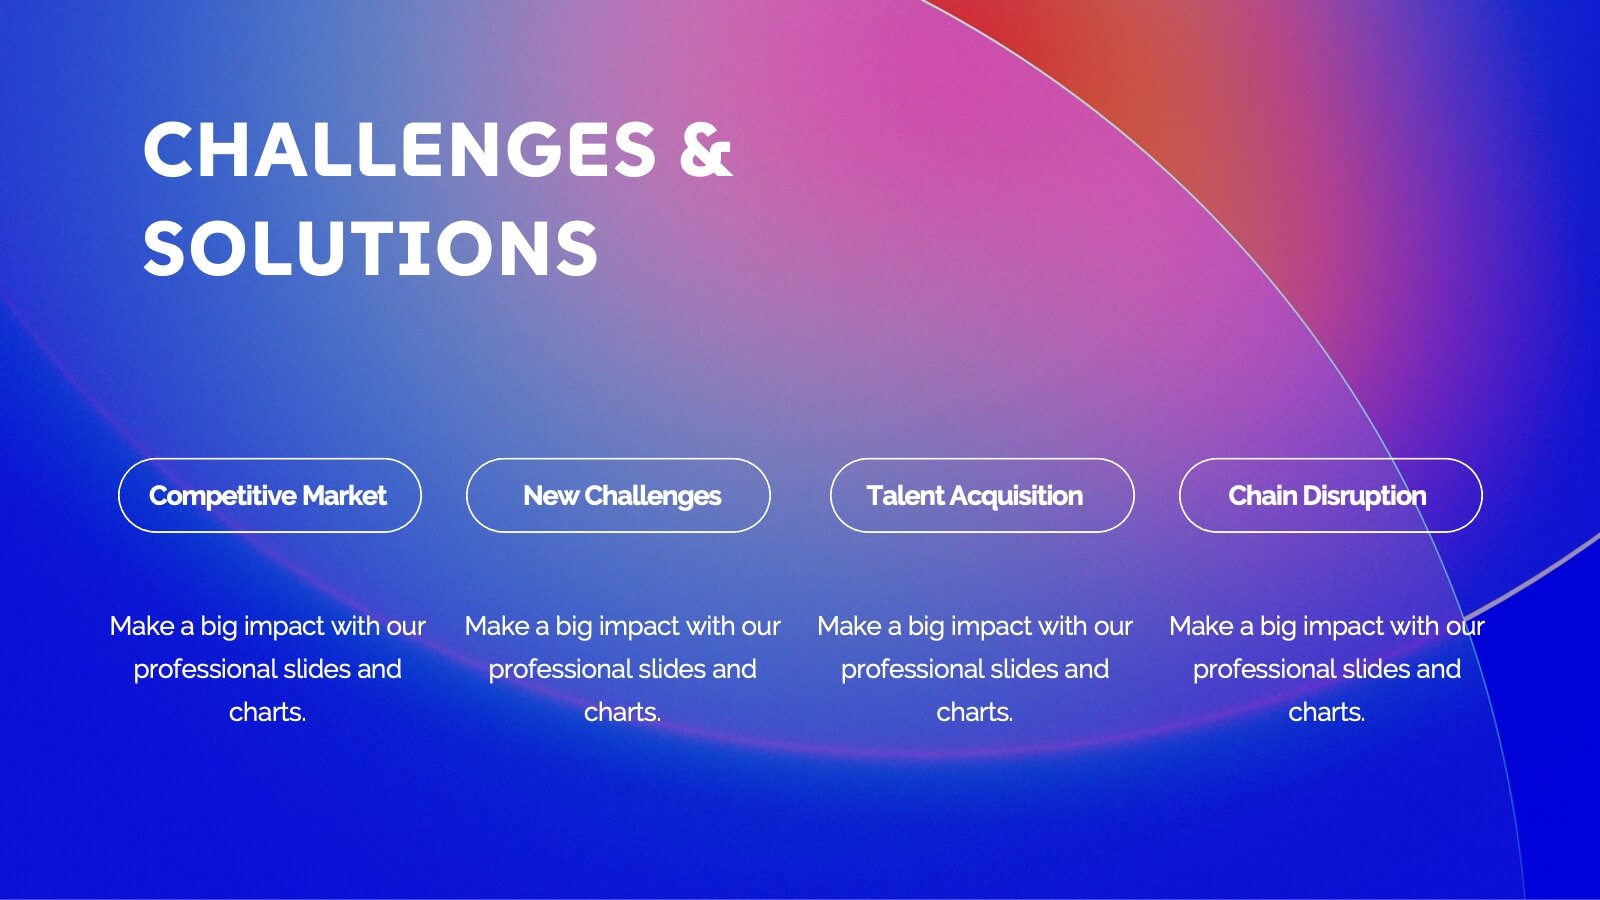
Business Challenges and Solutions Presentation
Address challenges with strategic solutions using this Business Challenges and Solutions template. Featuring a clear side-by-side layout, this design helps visualize business obstacles and their corresponding solutions for effective decision-making. Perfect for problem-solving discussions, strategy meetings, and brainstorming sessions, this template ensures your content remains structured and impactful. Fully customizable for PowerPoint, Keynote, and Google Slides.


4 slides
Decision Making with Option Comparison Presentation
Illuminate your choices with the Decision Making with Option Comparison Presentation. This slide uses a bold lightbulb illustration surrounded by icons to visually break down multiple options or solutions. Ideal for showcasing pros and cons, strategic alternatives, or scenario evaluations. Each option includes space for a clear title and supporting insights, making it easy to compare ideas side-by-side. Fully editable in PowerPoint, Keynote, and Google Slides—perfect for business strategy sessions, team decisions, or client pitches.


5 slides
Messaging Strategy and Flow Presentation
Communicate with clarity using this streamlined messaging strategy and flow presentation template. Designed to visualize the stages of message planning—from audience segmentation to final delivery—this layout helps teams align communication goals and channels. Ideal for marketing, PR, or internal comms presentations. Fully compatible with PowerPoint, Keynote, and Google Slides.


5 slides
Role Assignment Matrix Framework Presentation
Simplify task delegation with the Role Assignment Matrix Framework Presentation. Ideal for defining roles and responsibilities in a clear, table-based layout, this matrix helps organize who does what across departments or project phases. Perfect for RACI charts or team alignment. Fully editable in PowerPoint, Google Slides, Keynote, and Canva.


7 slides
Organizational Structure with 7S Model Presentation
Bring your organizational framework to life with a clean, modern layout that makes complex relationships easy to understand. This presentation helps you explain key elements, show how they connect, and guide strategic discussions with clarity and structure. Fully editable and compatible with PowerPoint, Keynote, and Google Slides.


7 slides
Implementation Models and Frameworks Slide Presentation
Visualize your entire process clearly with the Implementation Models and Frameworks Slide Presentation. This sleek arrow-based timeline features six distinct stages, each with icons and text placeholders to highlight key milestones, actions, or phases. Ideal for showcasing workflows, strategic initiatives, or rollout plans, this slide ensures your audience follows the journey from start to finish. Fully editable in PowerPoint, Keynote, and Google Slides, it’s perfect for project managers, consultants, and team leads aiming for clarity and impact.


4 slides
Creative Brush Stroke Theme Design Presentation
Bring a bold, artistic flair to your presentation with this Creative Brush Stroke Theme Design. Featuring layered paint-like strokes in vibrant tones, this layout blends creativity with clarity—perfect for design pitches, brainstorming sessions, or visual storytelling. Fully customizable in PowerPoint, Google Slides, and Canva for seamless editing.


8 slides
Airline Business Strategy Presentation
Leverage key insights into the aviation sector with the "Aviation Industry Market Analysis" presentation template. This design allows professionals in the aviation industry to effectively communicate market trends and forecasts. Its compatibility with PowerPoint, Keynote, and Google Slides ensures a versatile use across different platforms, making it ideal for industry analyses, investor meetings, or internal strategy discussions.


23 slides
Soundburst Business Idea Pitch Deck Presentation
The Pitch Deck Presentation Template delivers a professional, modern design with 23 slides tailored for startups and businesses. Covering company overview, solutions, market opportunities, and financials, it's fully customizable for your unique vision. Compatible with PowerPoint, Keynote, and Google Slides, this template ensures impactful, investor-ready presentations.


20 slides
Amethyst Marketing Proposal Template Presentation
Bring your marketing ideas to life with this eye-catching amethyst-themed presentation! Tailored for presenting your marketing proposals, this template helps you outline key strategies, campaigns, and target audiences in a sleek, professional design. Its bold layout ensures your message shines through. Compatible with PowerPoint, Keynote, and Google Slides.


5 slides
Optimized Process Flow Diagram Presentation
Streamline workflows with the Optimized Process Flow Diagram. This professional template visualizes key business processes for efficient decision-making and execution. Designed for project managers, analysts, and strategists, it ensures a clear, structured overview of sequential steps. Fully editable and compatible with PowerPoint, Keynote, and Google Slides.

20 slides
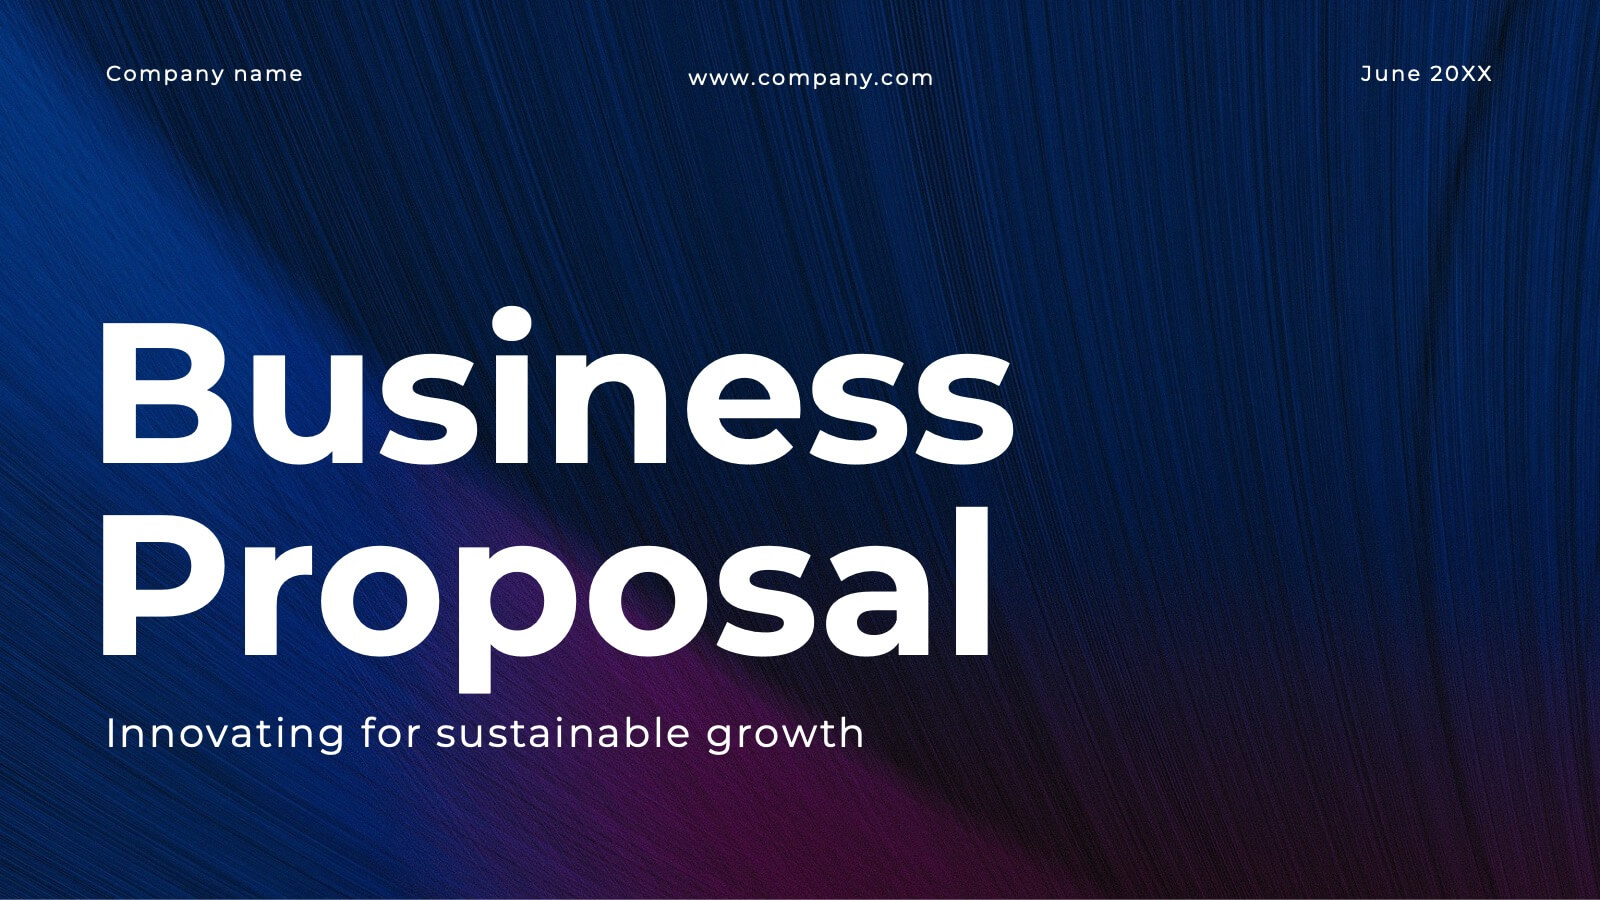
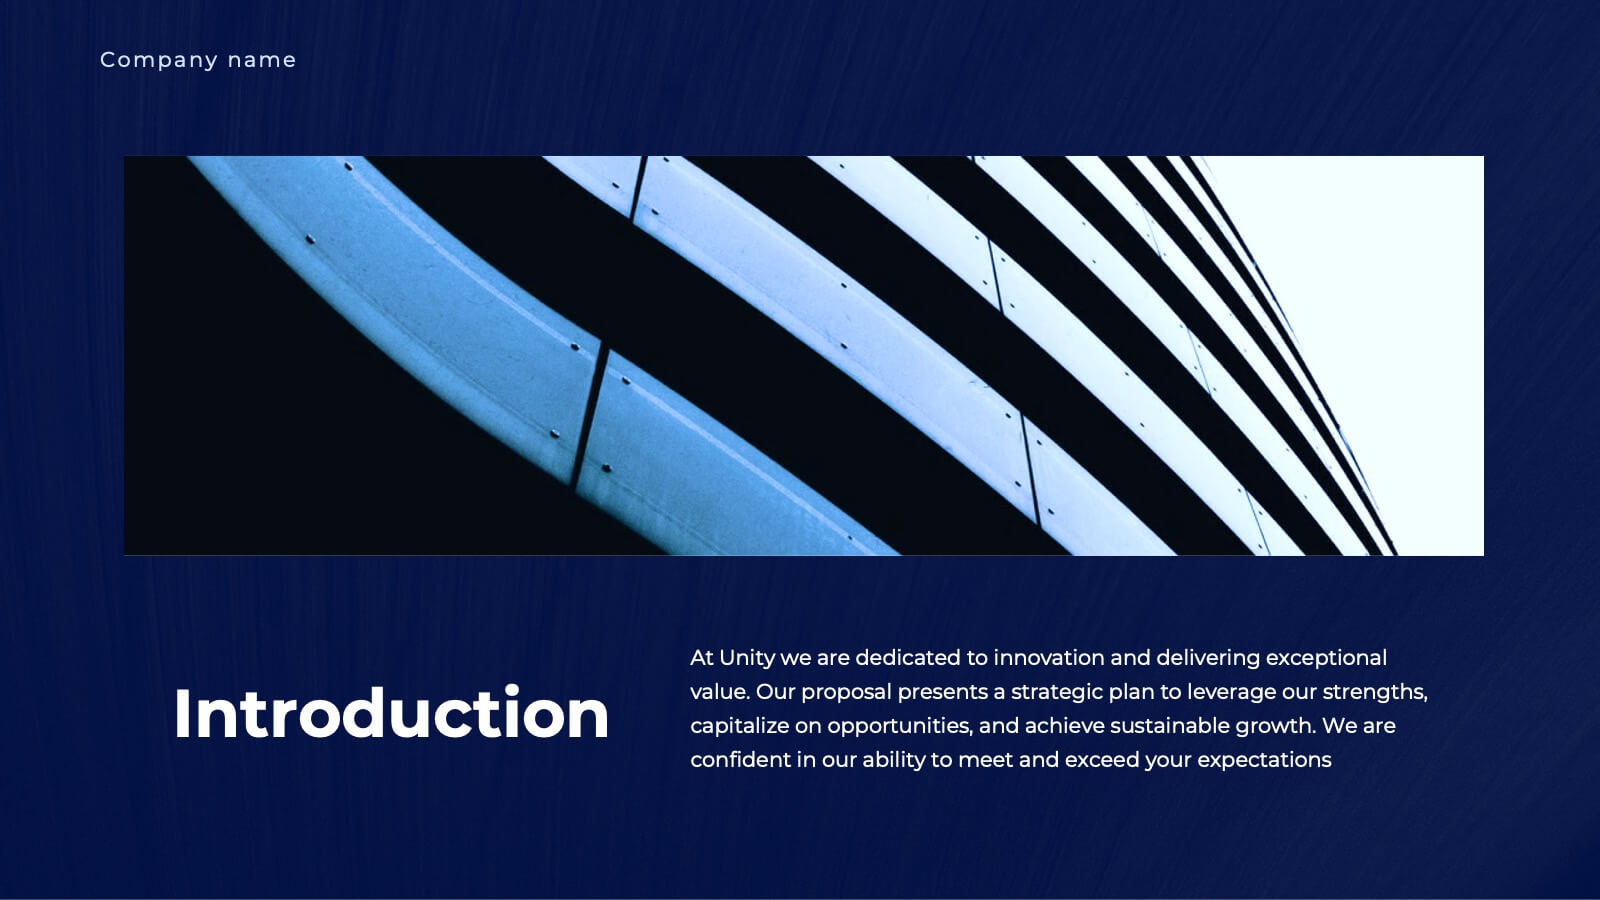
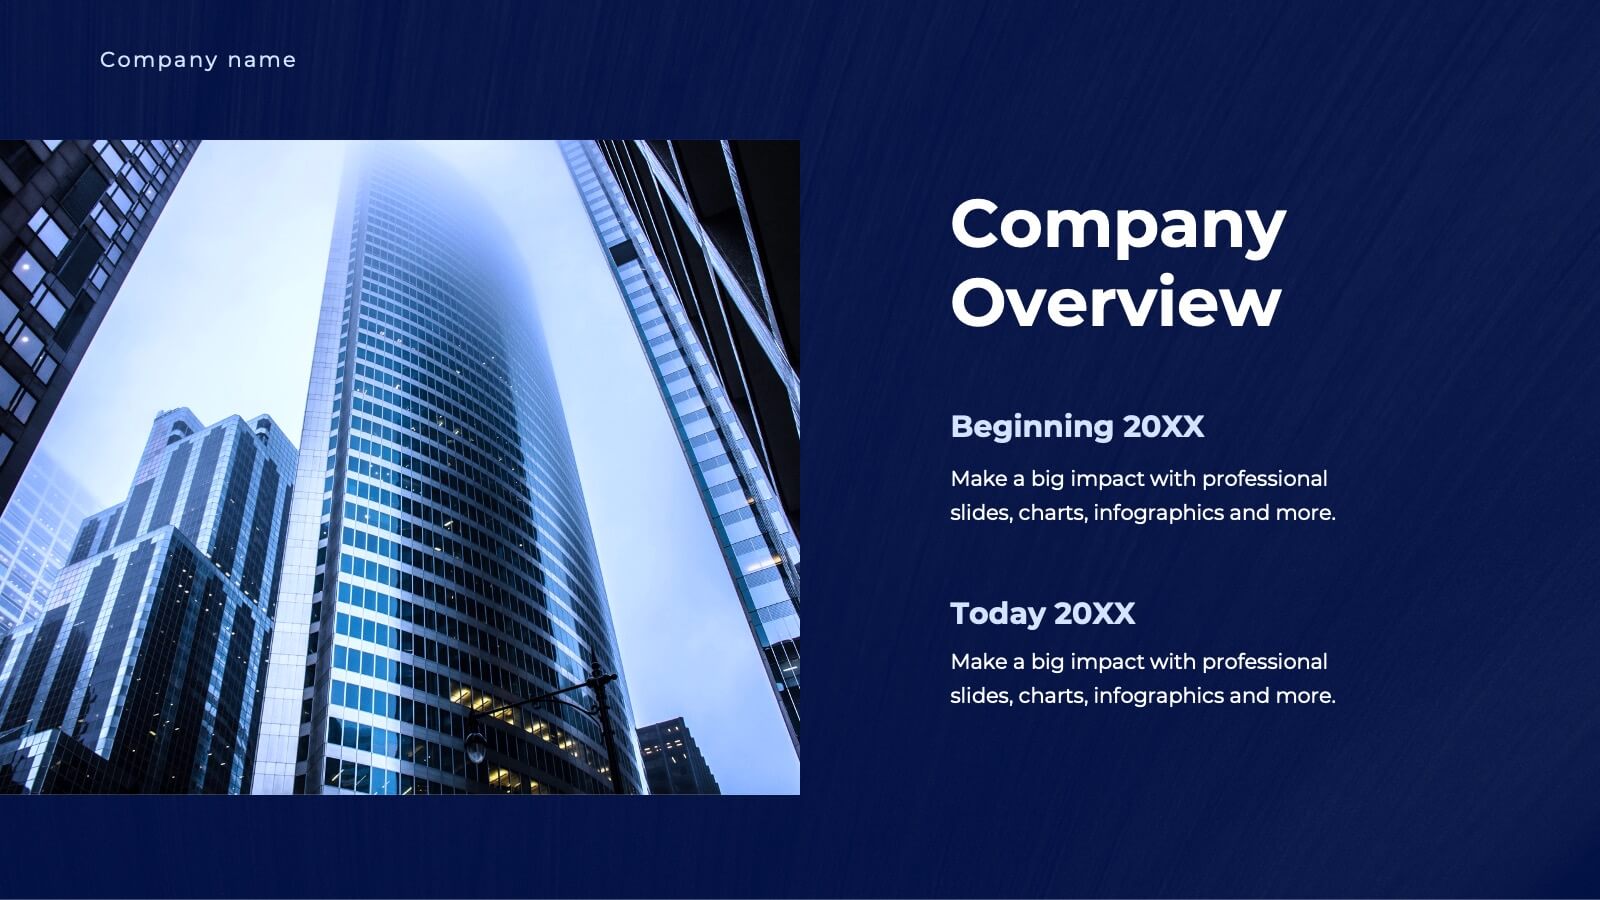
Unity Business Proposal Presentation
Take your business proposals to the next level with this elegant and comprehensive template! Perfect for presenting company overviews, project summaries, and detailed solutions. Ideal for business professionals looking to impress clients and stakeholders. Compatible with PowerPoint, Keynote, and Google Slides, this template ensures your proposals are impactful and professional.