


Features
- 6 Unique slides
- Fully editable and easy to edit in Microsoft Powerpoint, Keynote and Google Slides
- 16:9 widescreen layout
- Clean and professional designs
- Export to JPG, PDF or send by email


Do you have any questions?
Recommend


6 slides
Product Development Cycles Presentation
A great product starts with a clear, engaging story—this presentation brings that journey to life. It outlines each stage of the development cycle in a simple, visual flow that helps teams communicate progress, milestones, and next steps. Perfect for strategy, planning, and updates. Fully compatible with PowerPoint, Keynote, and Google Slides.


10 slides
Customer Conversion Funnel Presentation
Optimize your customer journey presentations with our "Customer Conversion Funnel Presentation" template. This infographic elegantly depicts the conversion process across distinct stages, using a funnel design that visually narrows from awareness to action. Each segment is clearly labeled, simplifying the task of presenting strategies to enhance each phase of the customer experience. Ideal for marketers, sales teams, and strategists, this template helps clarify customer behavior and improve conversion rates. It’s a vital tool for any business focused on customer engagement and optimization. Fully compatible with PowerPoint, Keynote, and Google Slides, this template is crucial for effective communication and strategic planning.


6 slides
E-Learning Company Infographics
The "E-Learning Company" infographic template is a contemporary and dynamic tool, designed for PowerPoint, Keynote, and Google Slides. It's an excellent resource for e-learning companies, educational technology firms, and online educators looking to showcase their services and methodologies. This template includes key elements such as online course offerings, interactive learning tools, and student engagement strategies. Its layout is specifically tailored to highlight the features and benefits of e-learning, making it perfect for presentations that aim to showcase the effectiveness and innovation of digital education. The design is vibrant and tech-savvy, with an energetic color scheme that reflects the lively nature of digital learning environments. This not only makes the template visually appealing but also aligns with the modern and interactive nature of e-learning. Whether you're presenting to potential clients, educators, or investors, this template ensures that your e-learning services and strategies are displayed in a clear, engaging, and professional manner.


4 slides
SaaS Pricing Comparison Chart Presentation
Make pricing comparisons exciting with this bold, side-by-side layout designed to instantly spotlight key differences. Whether you’re showcasing SaaS plans or product tiers, this chart template lets you present value and features clearly. Fully editable and easy to customize in PowerPoint, Keynote, and Google Slides for polished pricing presentations.


34 slides
Founder Startup
A Founder Startup, is a newly established business venture that is typically founded by one or more individuals or groups with an innovative idea, concept, or product. This template is designed to help you create a professional and compelling presentation that showcases your startup and its founders in a impactful way. Compatible with PowerPoint, Keynote, and Google Slides. Included in this template are a variety of pre-designed slides that will help cover different aspects of your startup, such as team introduction, overview, vision and mission, product or service description, market analysis, financials, and more.


6 slides
Statistics and Figures Report Presentation
Present complex data with clarity using the Statistics and Figures Report Presentation template. Featuring scatter plots, radar charts, and key metric highlights, this template is perfect for performance tracking, analytics reports, and business reviews. Fully customizable for PowerPoint, Keynote, and Google Slides, it ensures professional and insightful data visualization.

22 slides
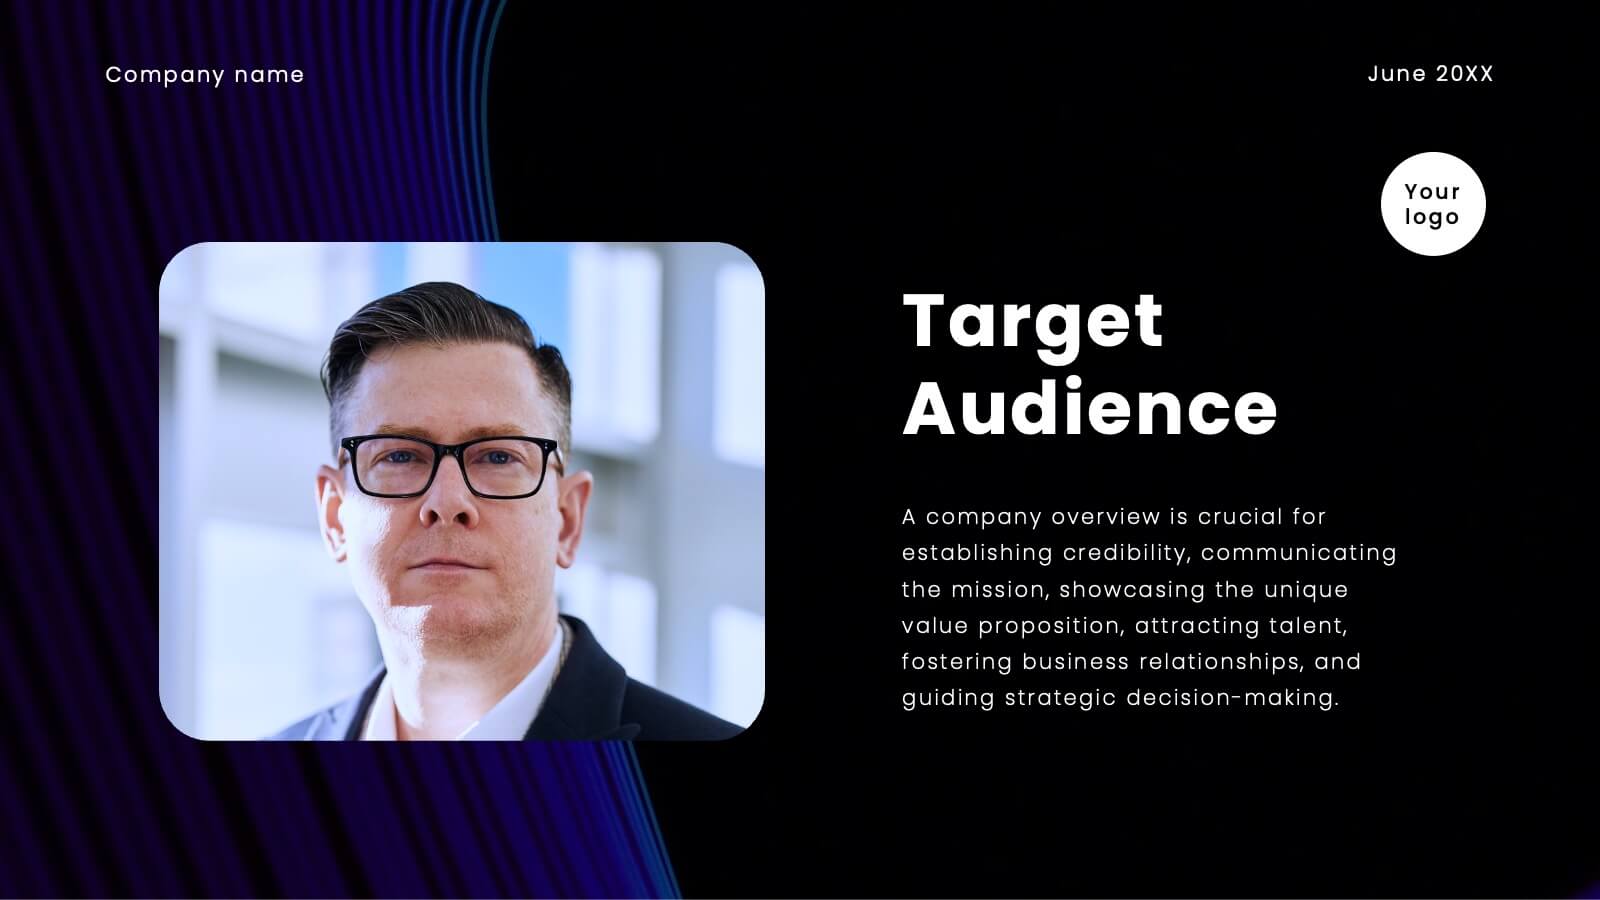
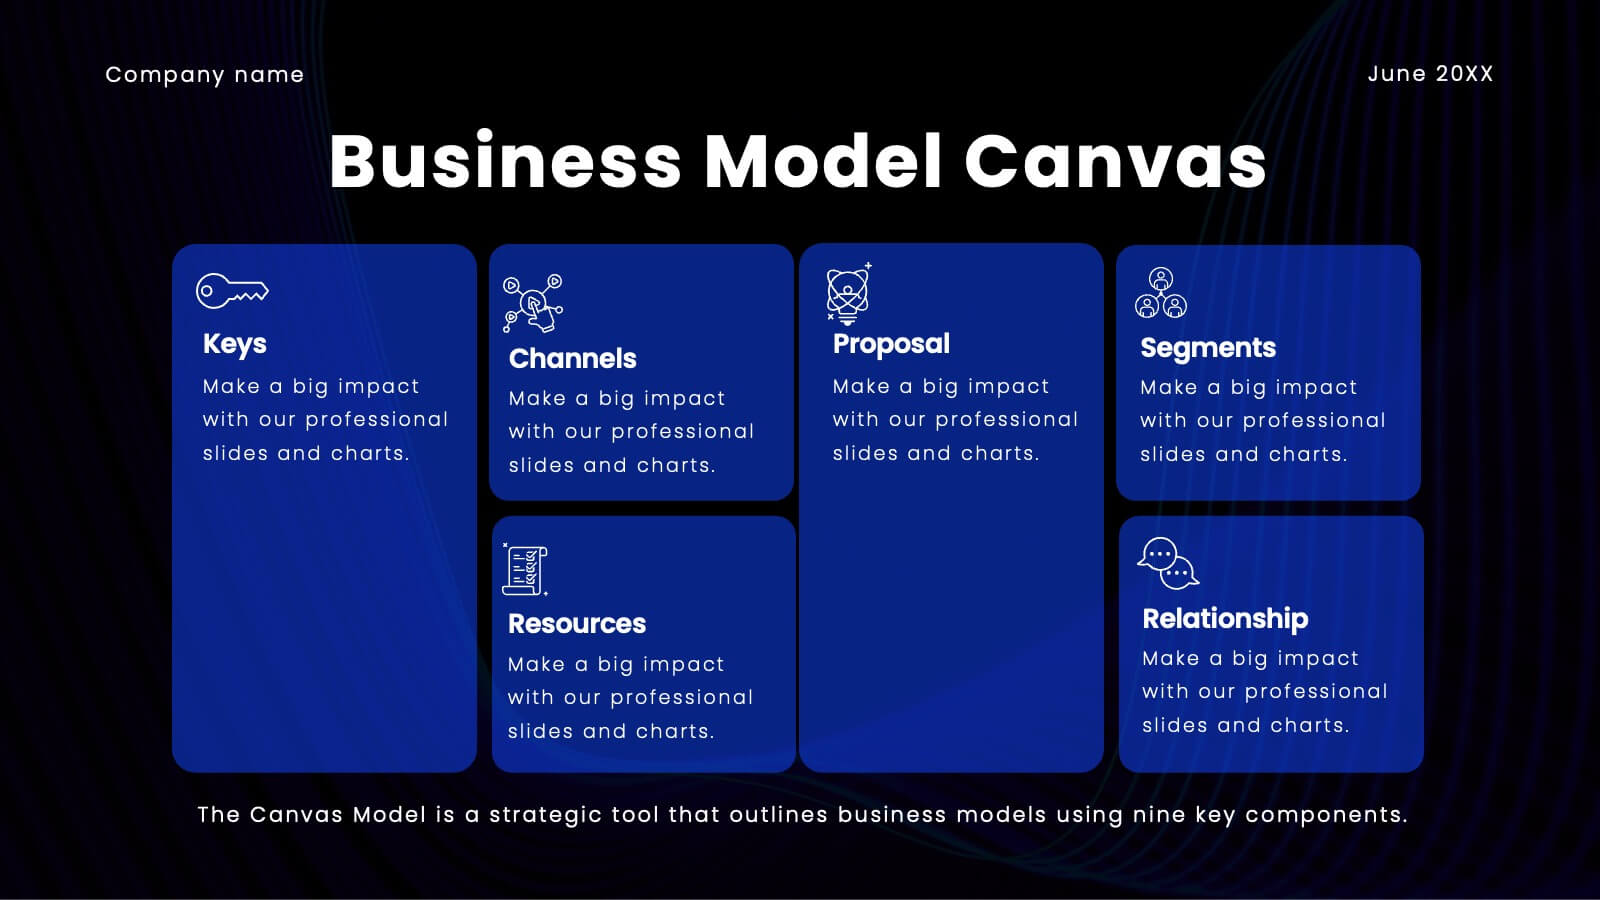
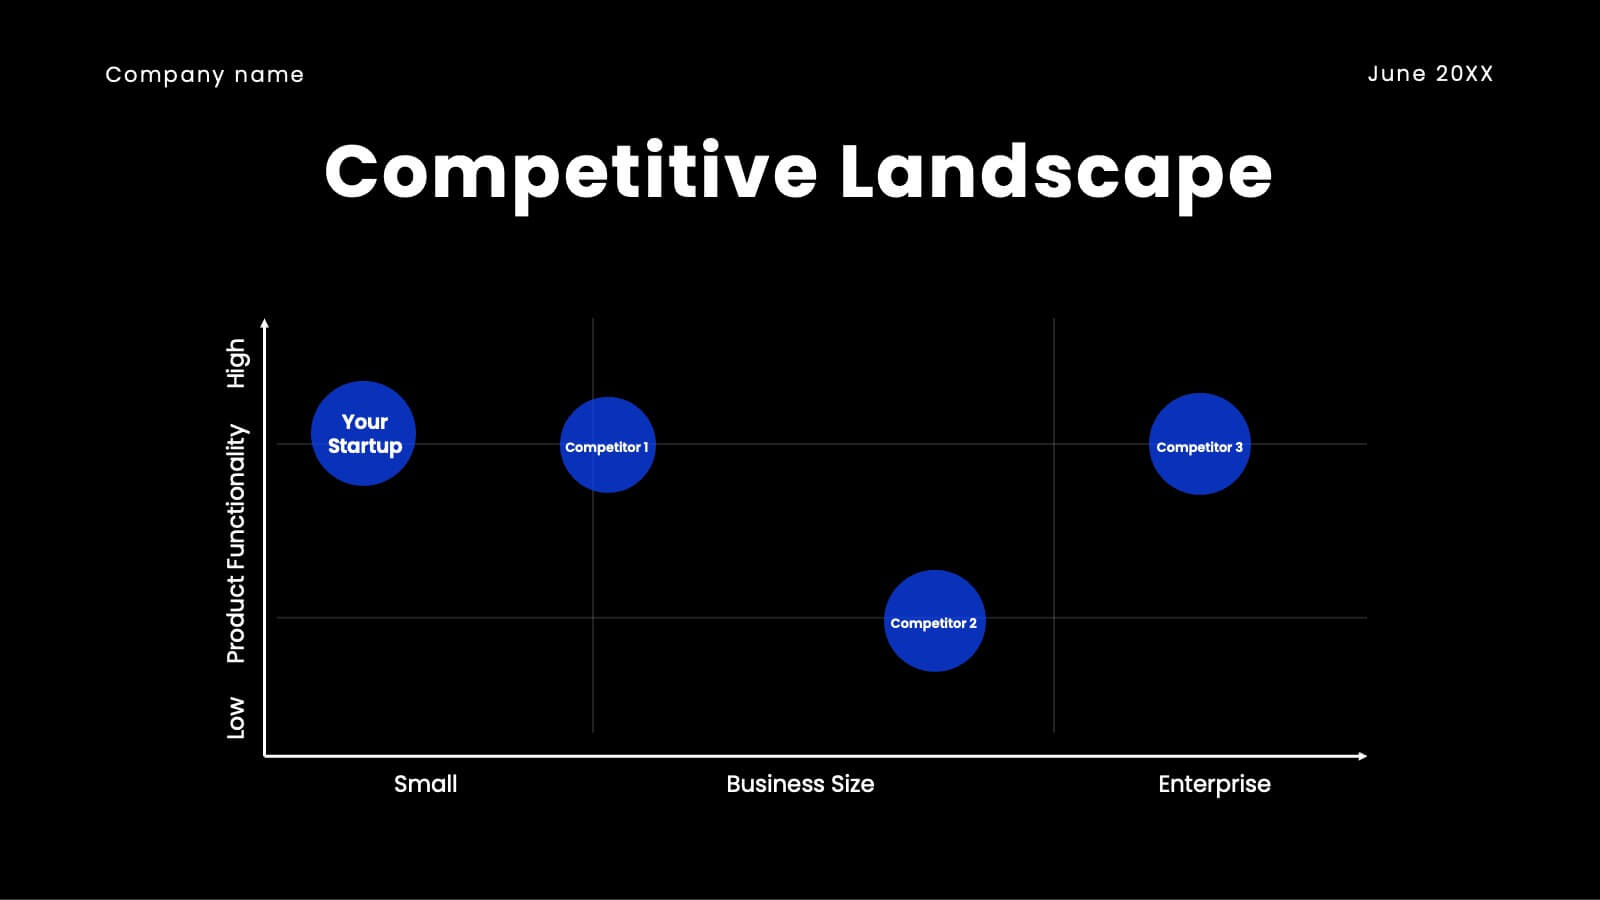
Jolt Business Idea Pitch Deck Presentation
Prepare to electrify your audience with a pitch deck that’s nothing short of spectacular! This high-impact template is designed to captivate, engage, and persuade your stakeholders with every slide. It’s more than just a presentation; it’s your gateway to showcasing your company’s unique value proposition, innovative solutions, and future growth potential in a way that’s visually stunning and incredibly compelling. From the moment you unveil your company overview to the final slide on financials and funding requirements, this template ensures your pitch is memorable, powerful, and impossible to ignore. The sleek, modern design highlights your strategic vision, competitive advantages, and market opportunities, making a bold statement that you’re ready to lead the future. Compatible with PowerPoint, Keynote, and Google Slides, this pitch deck template is your ultimate tool for turning heads and securing buy-in from investors, partners, and clients alike!


6 slides
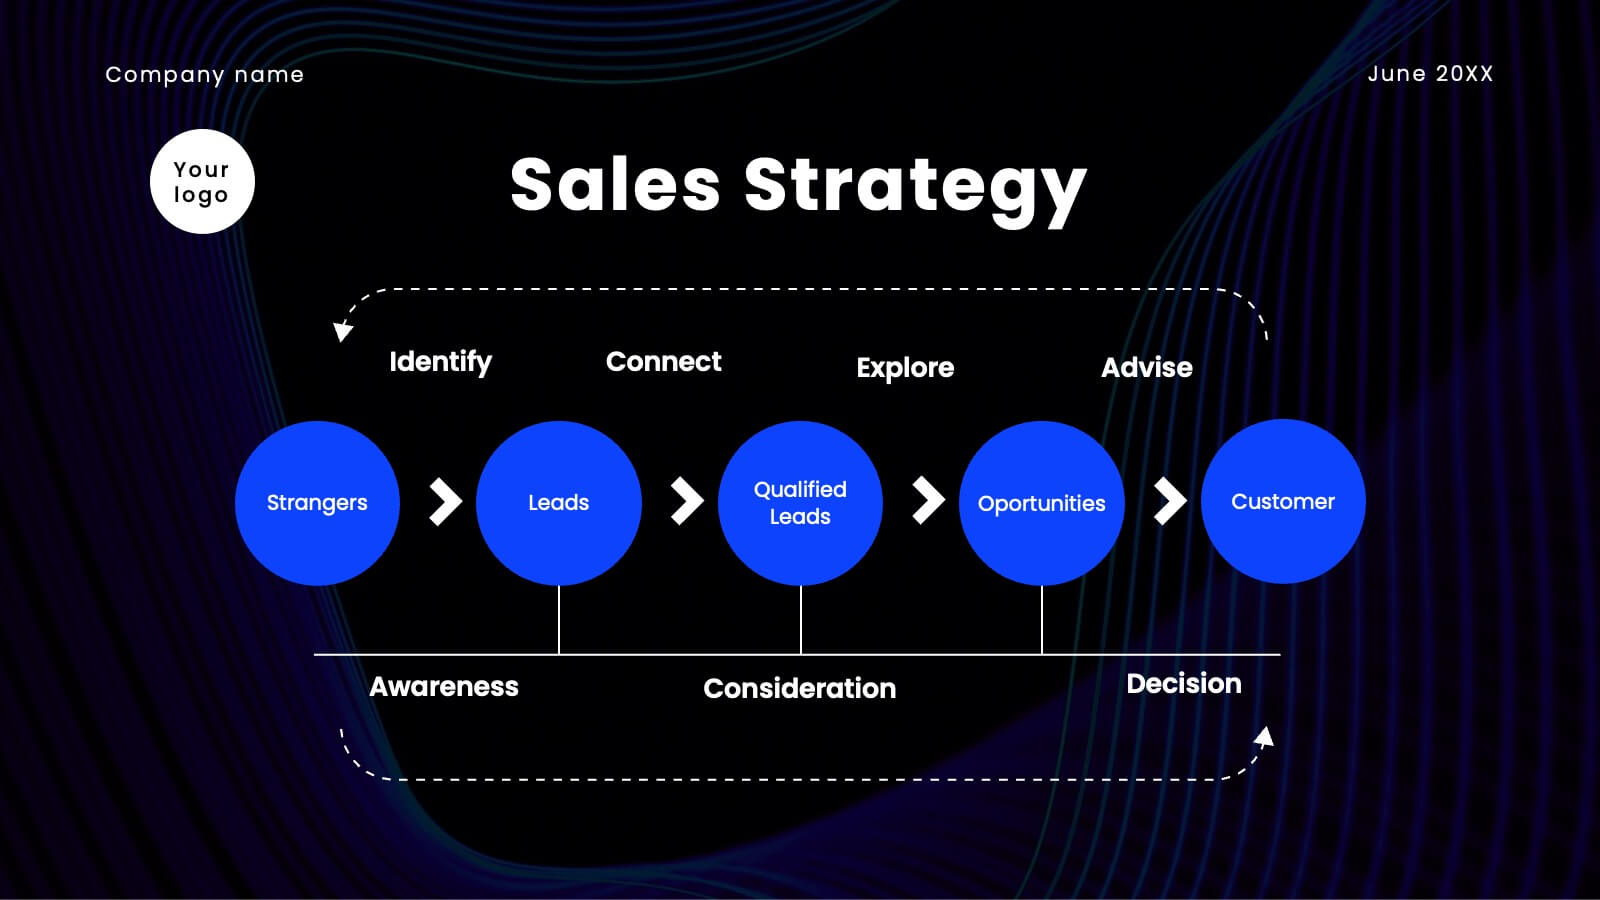
Customer Journey Management Infographic
Map out the customer's path to purchase with our intuitive Customer Journey Management Infographic, perfect for Powerpoint, Google Slides, and Keynote. This visual tool helps businesses understand and enhance the customer experience at every touchpoint. Highlight critical stages from awareness to advocacy with distinct, easy-to-follow layouts. Customize it to fit your brand’s journey, showcasing the interactions and emotions customers encounter. Ideal for marketing strategy sessions and client presentations, it simplifies complex consumer behavior into a clear, actionable pathway.


5 slides
Animal Health and Veterinary Care Presentation
Promote optimal animal health and veterinary practices with our comprehensive presentation template. Designed to facilitate discussions on veterinary care, this template is perfect for educational seminars, veterinary training, or healthcare meetings, ensuring all aspects of animal welfare are covered effectively.
6 slides
Investment Insights and Budget Tracker Presentation
Stay on top of your financial strategy with the Investment Insights and Budget Tracker Presentation. This slide layout organizes six financial metrics or priorities into clear, color-coded blocks—ideal for summarizing investment options, budget breakdowns, or cost categories. Perfect for finance teams, analysts, or consultants. Fully editable in Canva, PowerPoint, Google Slides, and Keynote.


4 slides
Financial Cost Management Strategies Presentation
Effectively plan and monitor financial performance with the Financial Cost Management Strategies Presentation template. This slide provides a clear roadmap for cost optimization, budget allocation, and financial efficiency improvements. Ideal for finance teams, business strategists, and executives aiming for streamlined cost control. Fully editable in PowerPoint, Keynote, and Google Slides for easy customization.


5 slides
Pricing Structure and Cost Allocation Presentation
Show stakeholders how every dollar works with this colorful arc-style financial slide. Explain product tiers, service fees, or project budgets in clear segments that highlight what matters most. Ideal for finance updates, sales decks, or board reviews, and fully compatible with PowerPoint, Keynote, and Google Slides for seamless team collaboration.


5 slides
Renewable Energy Sector Infographics
Illuminate your audience's knowledge with our renewable energy sector infographics. Radiating with vibrant shades of orange, yellow, and blue, this creative, vertical template breathes life into data and trends in the clean energy realm. Compatible with Powerpoint, Keynote, and Google Slides. Whether you're an environmental advocate or an academic researcher, these infographics, embellished with relevant graphics and icons, serve as a catalyst for enlightening discussions. From solar power breakthroughs to wind energy statistics, these visual aids are geared to power impactful presentations and reports in the renewable energy sector.


22 slides
Arachne Digital Marketing Strategy Plan Presentation
Weave a powerful digital marketing strategy with this sleek, Arachne-inspired presentation! Perfect for outlining your digital marketing plans, this template helps you highlight key strategies, analytics, and campaign goals in a structured and visually engaging way. Its modern design keeps your audience focused. Compatible with PowerPoint, Keynote, and Google Slides.


26 slides
Corporate Culture Development Presentation
Embark on a journey to forge a vibrant corporate culture with this expertly designed presentation template, where every slide is a brushstroke in the larger picture of your company’s ethos. Orange and blue hues leap off the screen, infusing each slide with the energy and innovation that are the hallmarks of a thriving workplace. Use this template to paint a vivid narrative of your company’s values, mission, and people. Chart the growth of your organizational climate with data-driven graphics, celebrate the uniqueness of your team with personalized profiles, and map out the future with strategic infographics. This template is not just a collection of slides; it's a canvas for storytelling, perfect for HR visionaries and leaders dedicated to nurturing a workspace that breathes collaboration and creativity. Ready for action in your preferred software, it's the gateway to transforming the abstract concept of company culture into a tangible, inspiring reality.


7 slides
RACI Matrix Manufacturing Infographic
The RACI matrix, an essential tool for defining roles and responsibilities, finds vital applications in the realm of manufacturing. Our RACI matrix manufacturing infographic, bathed in shades of blue against a clean white canvas with tasteful black accents, simplifies the complex choreography of tasks, roles, and accountabilities in manufacturing processes. Designed particularly for manufacturing managers, team leaders, and project coordinators, this template vividly illustrates how tasks are assigned and to whom, ensuring clarity and streamlining operations. Ready-to-use, it integrates seamlessly with PowerPoint, Keynote, and Google Slides.
20 slides
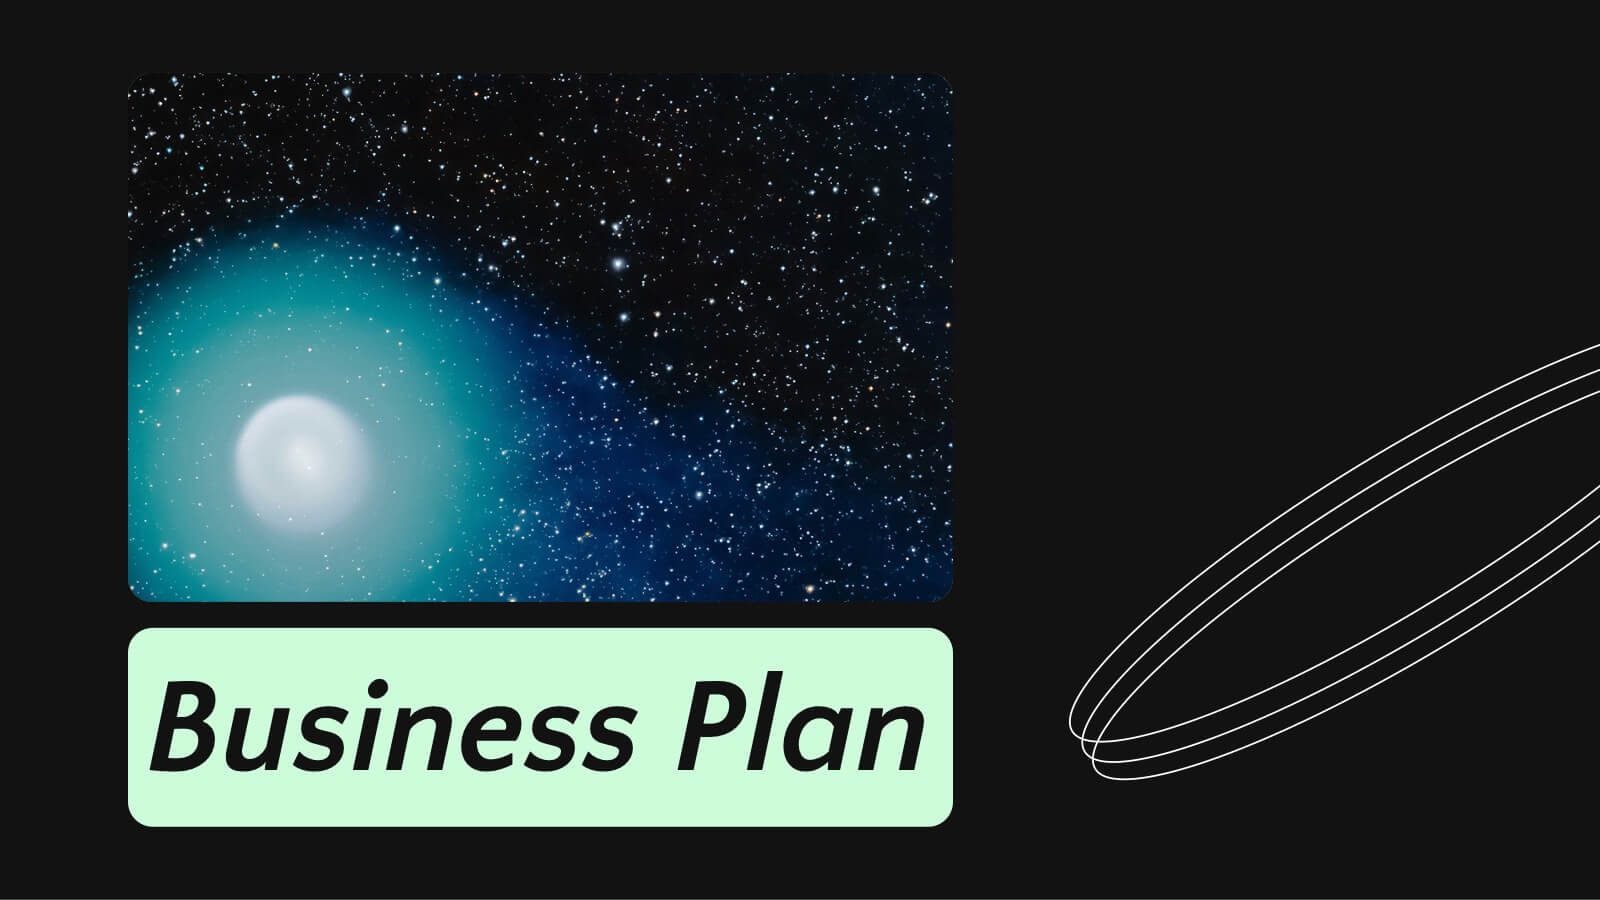
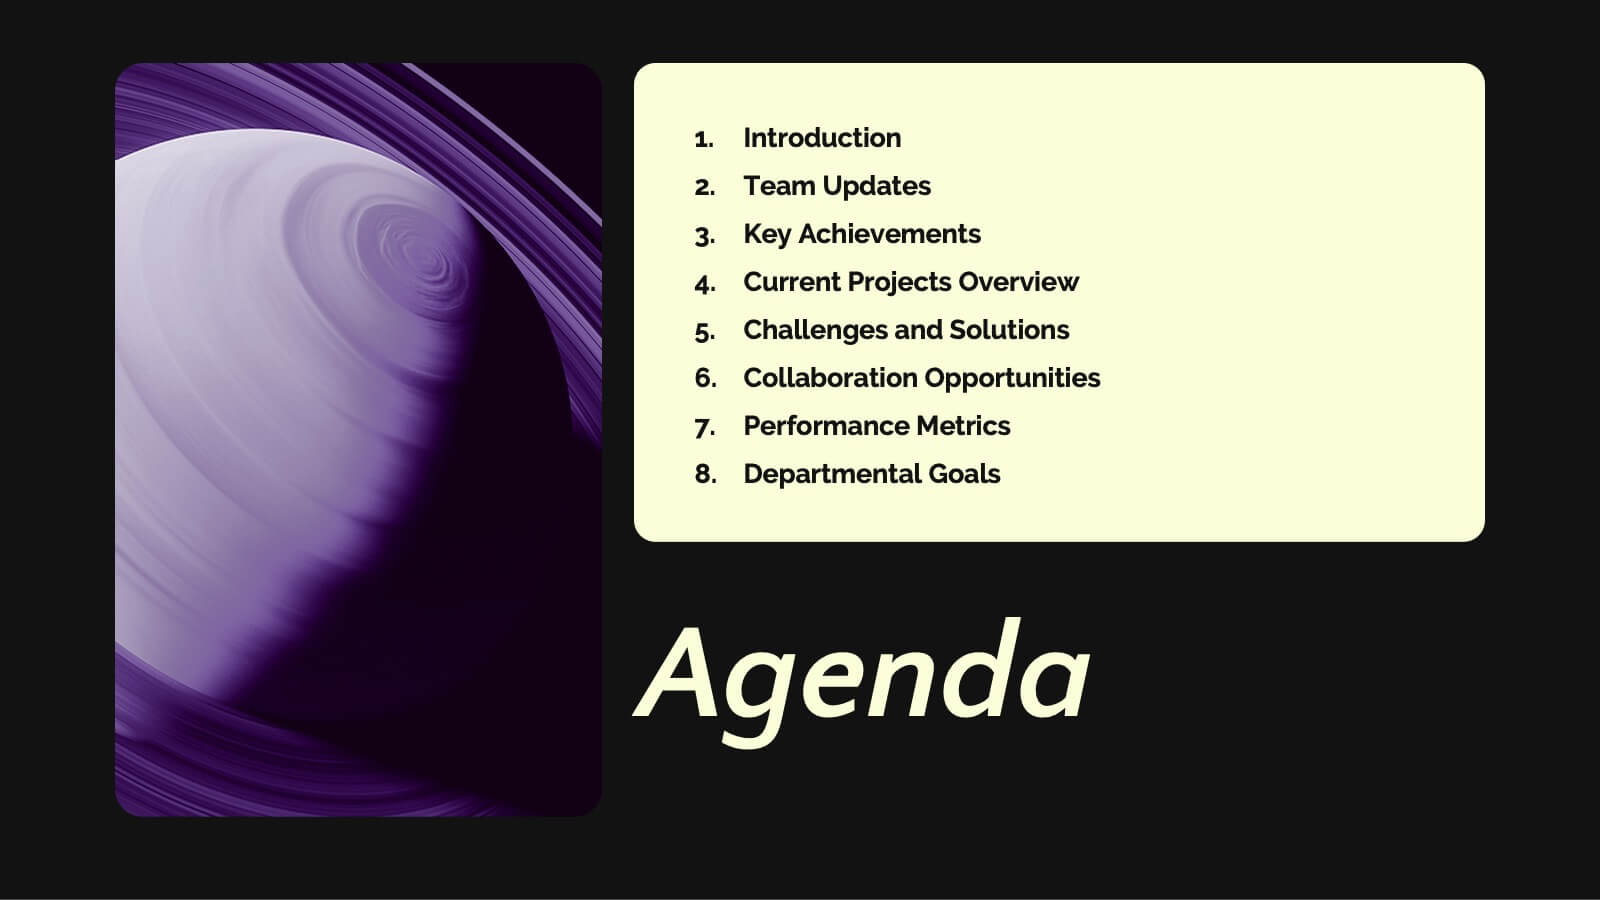
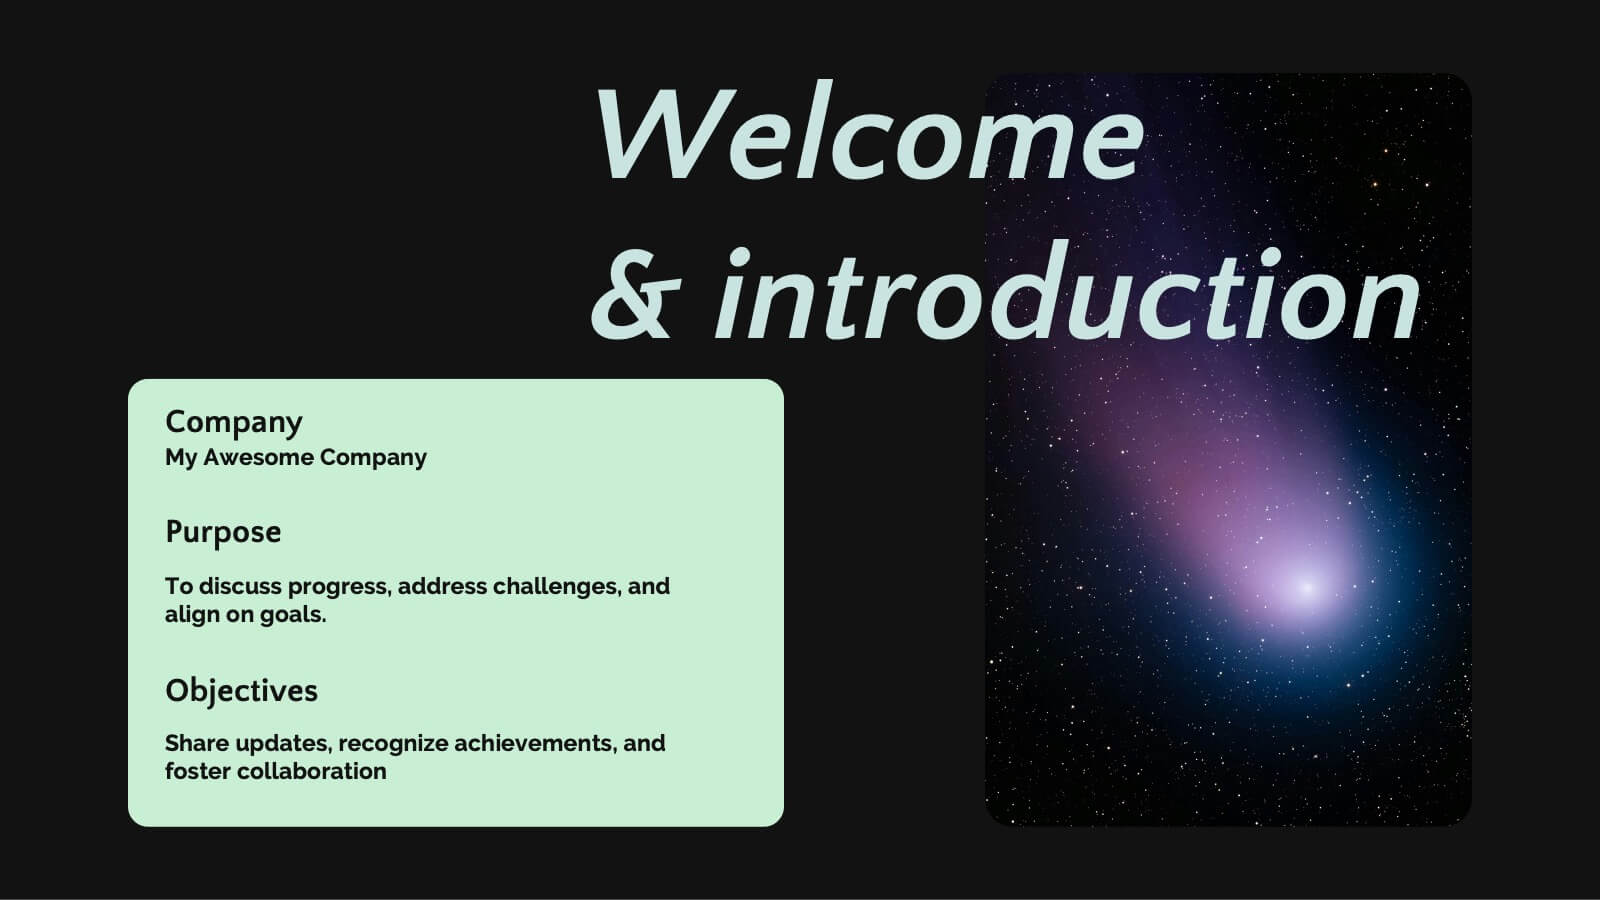
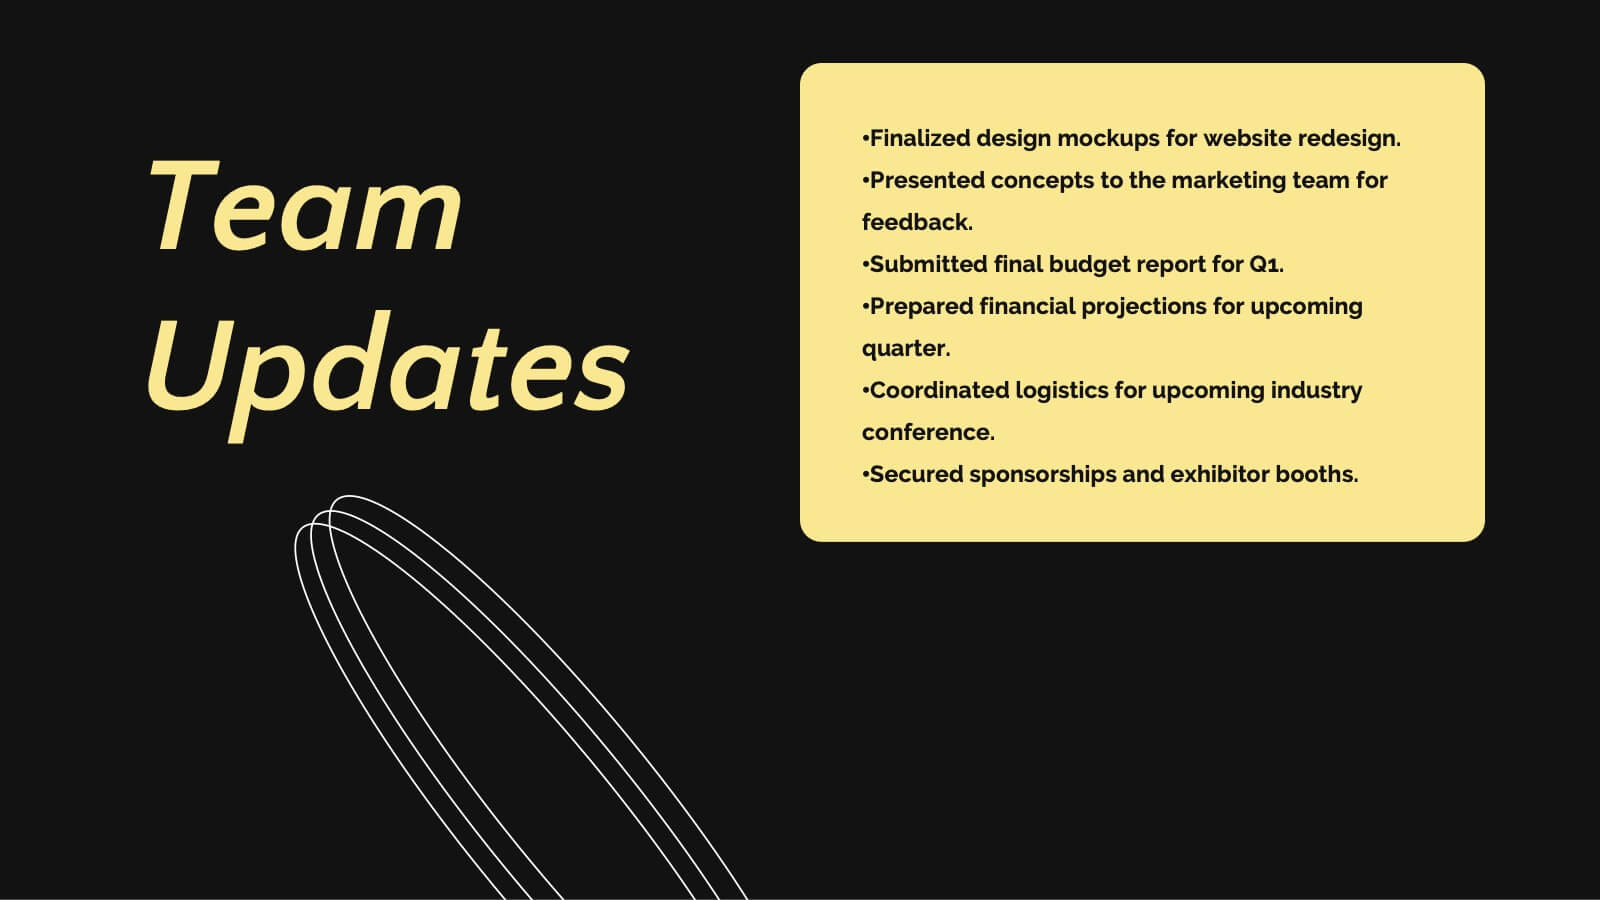
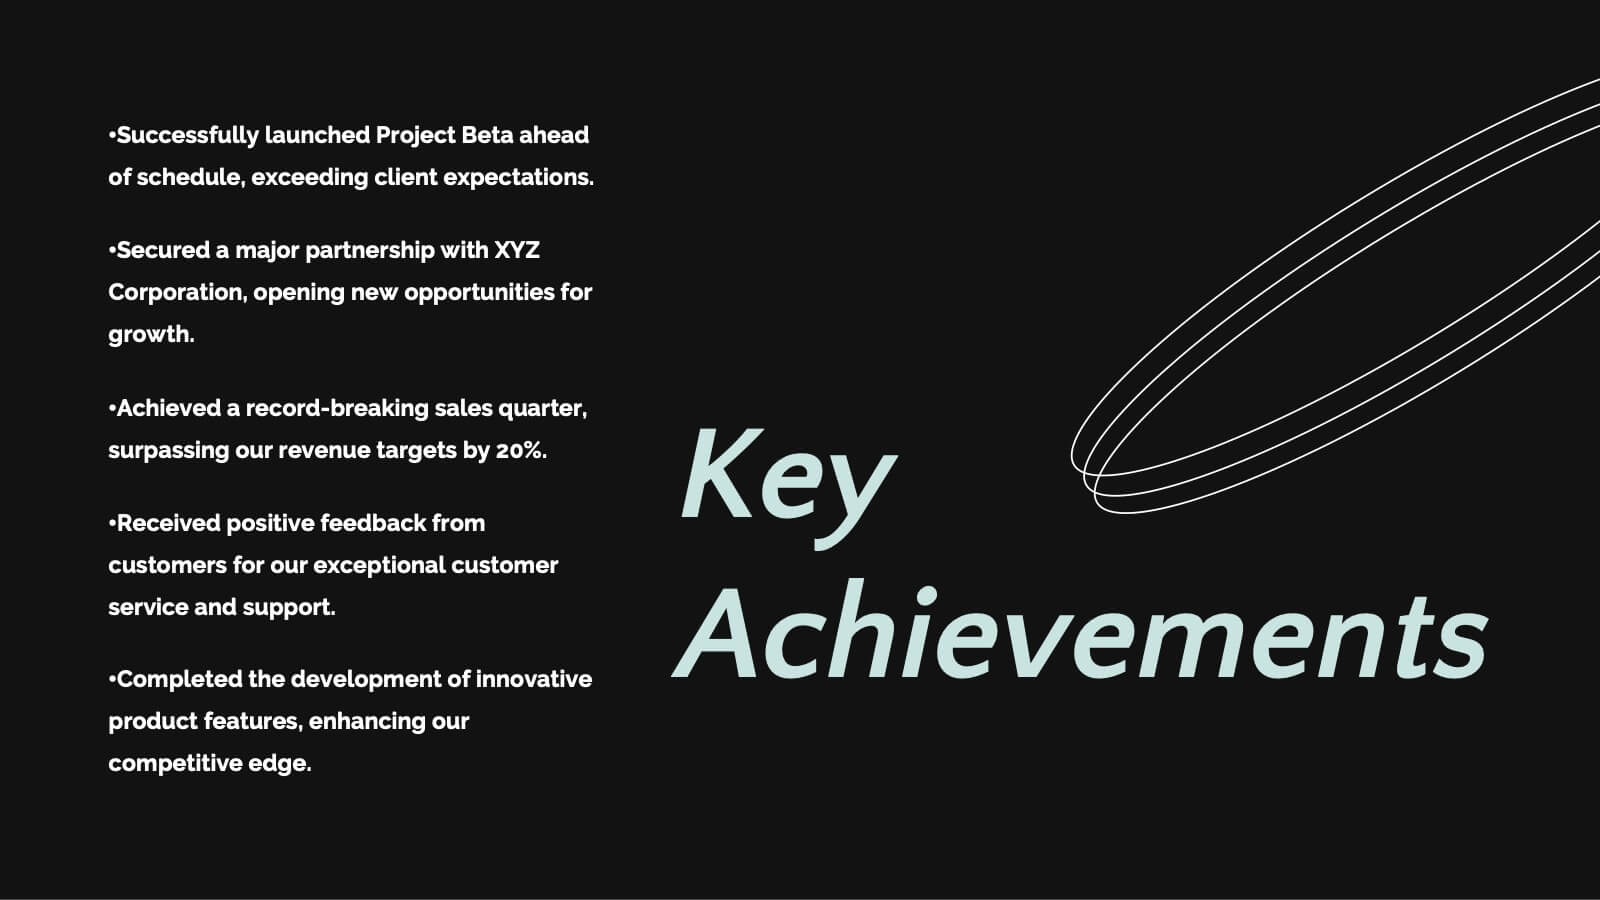
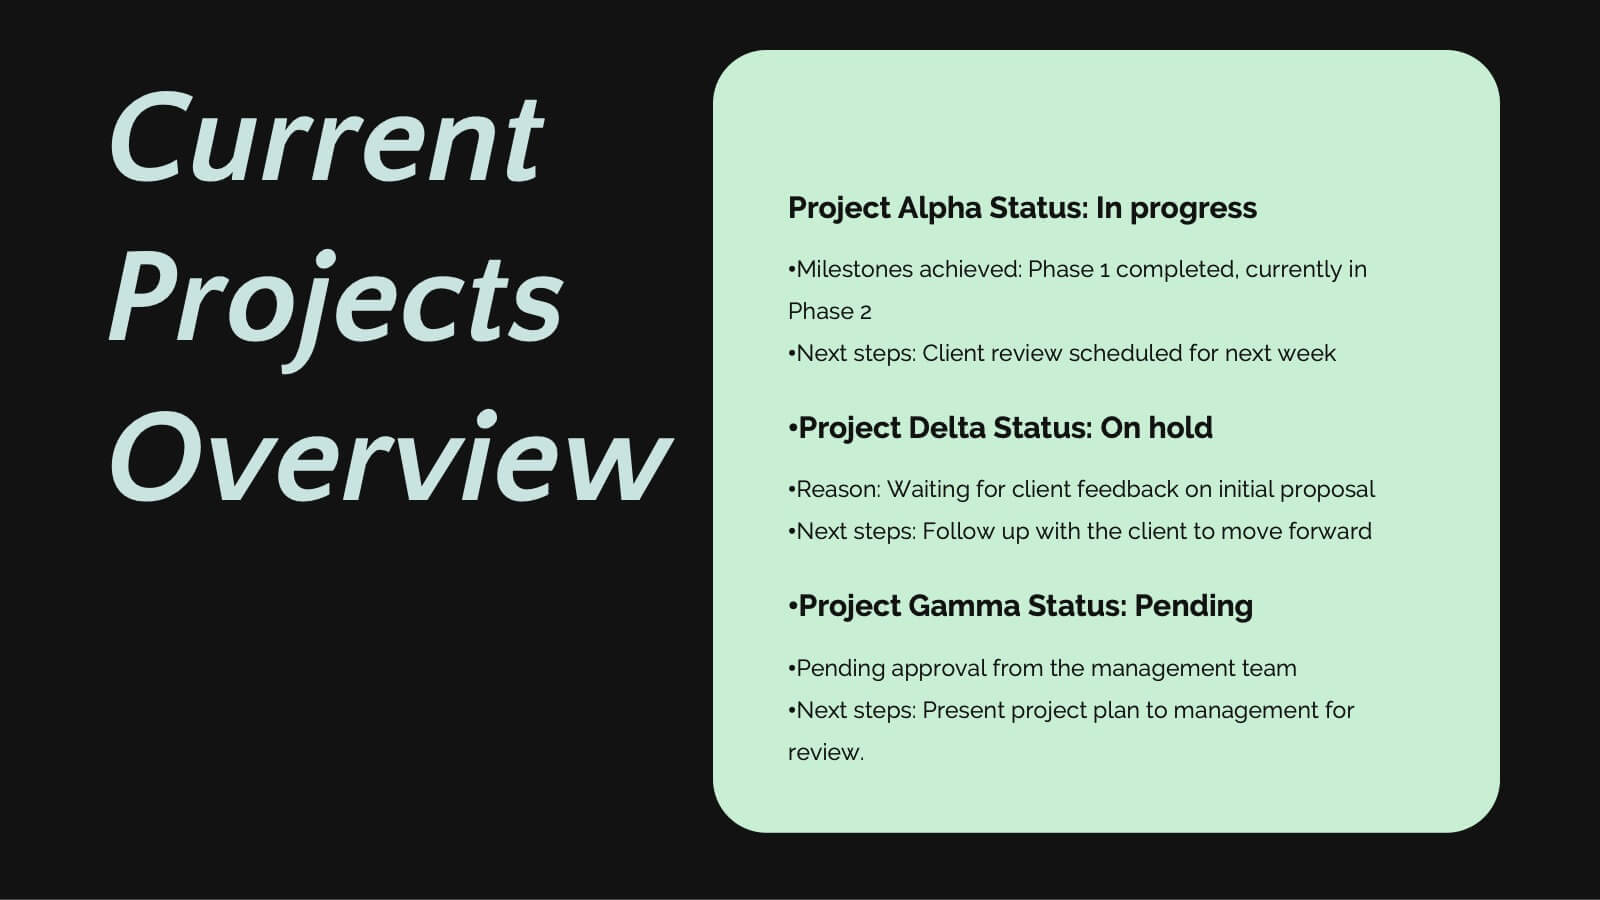
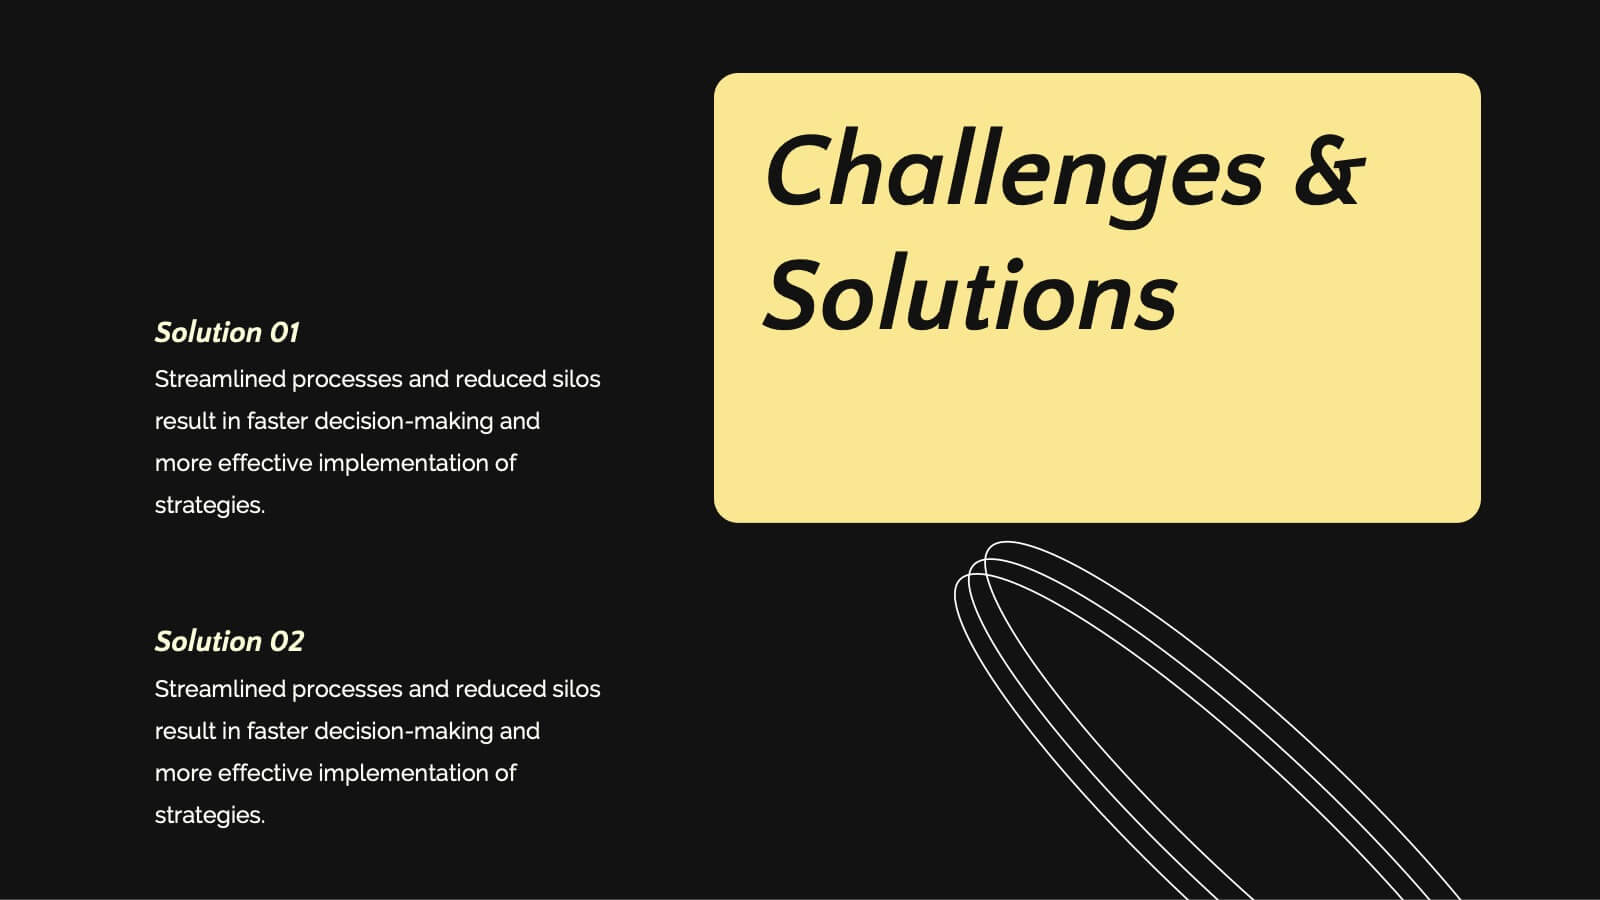
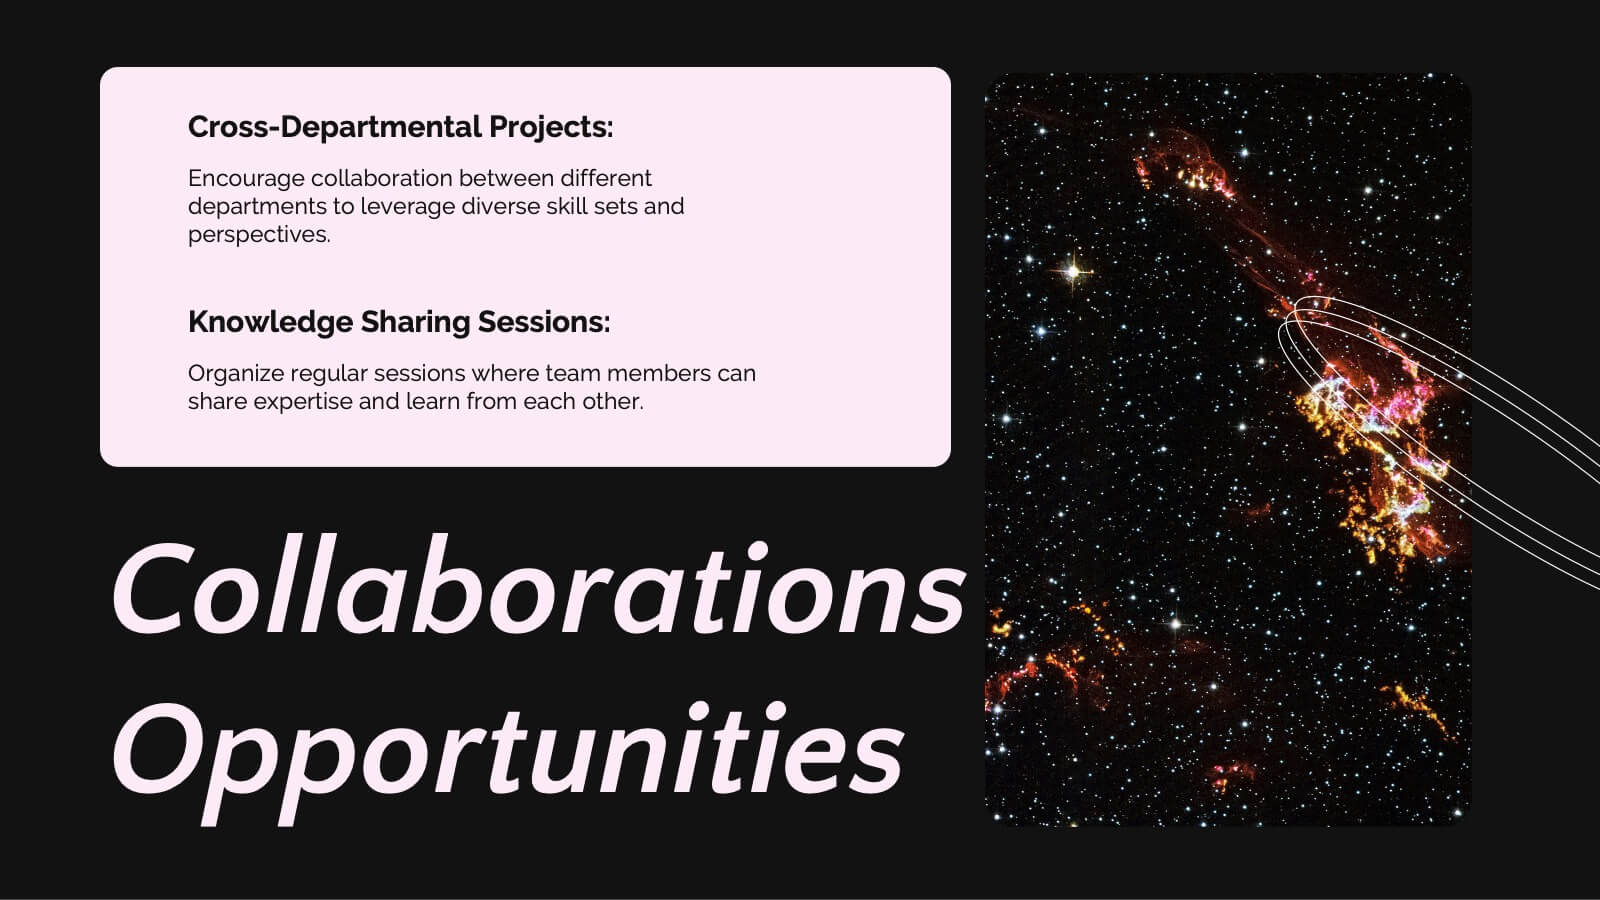
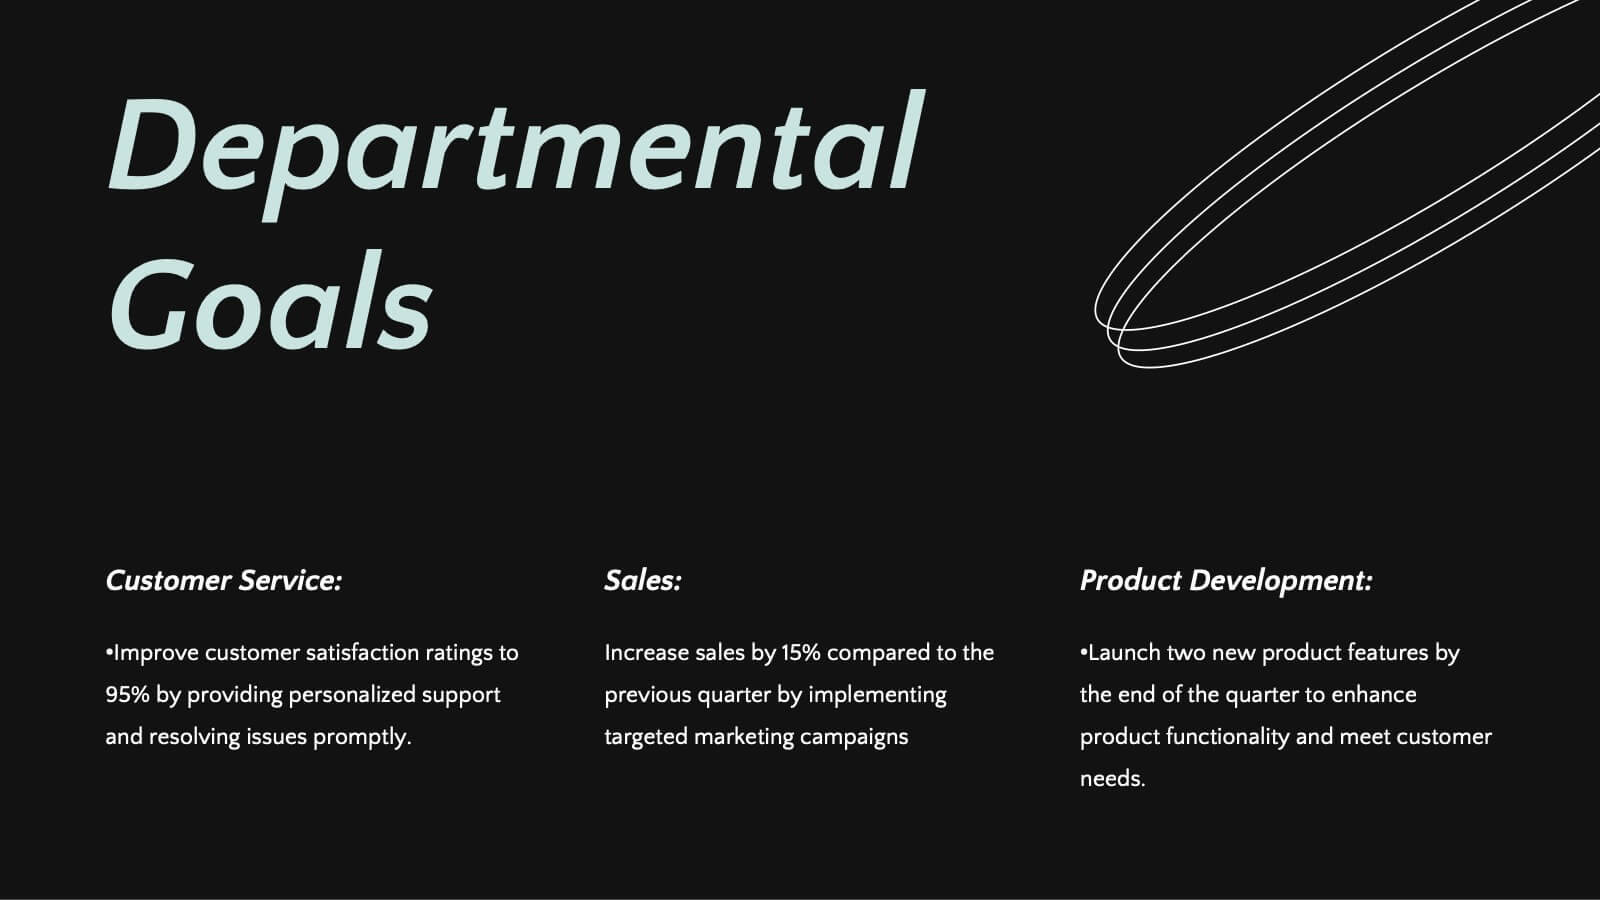
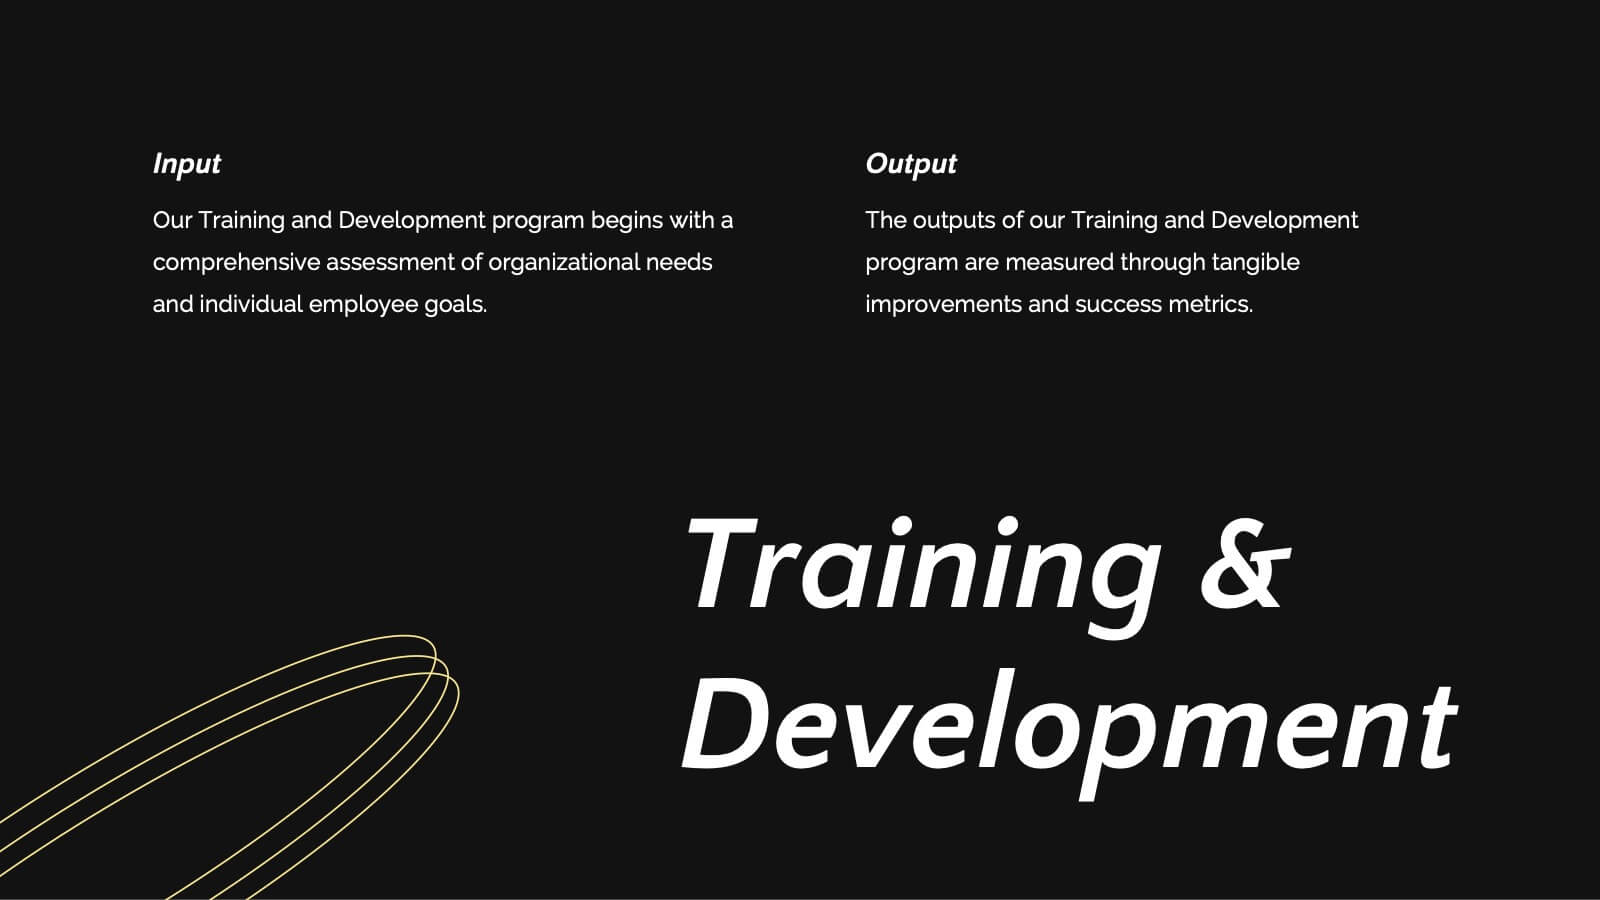
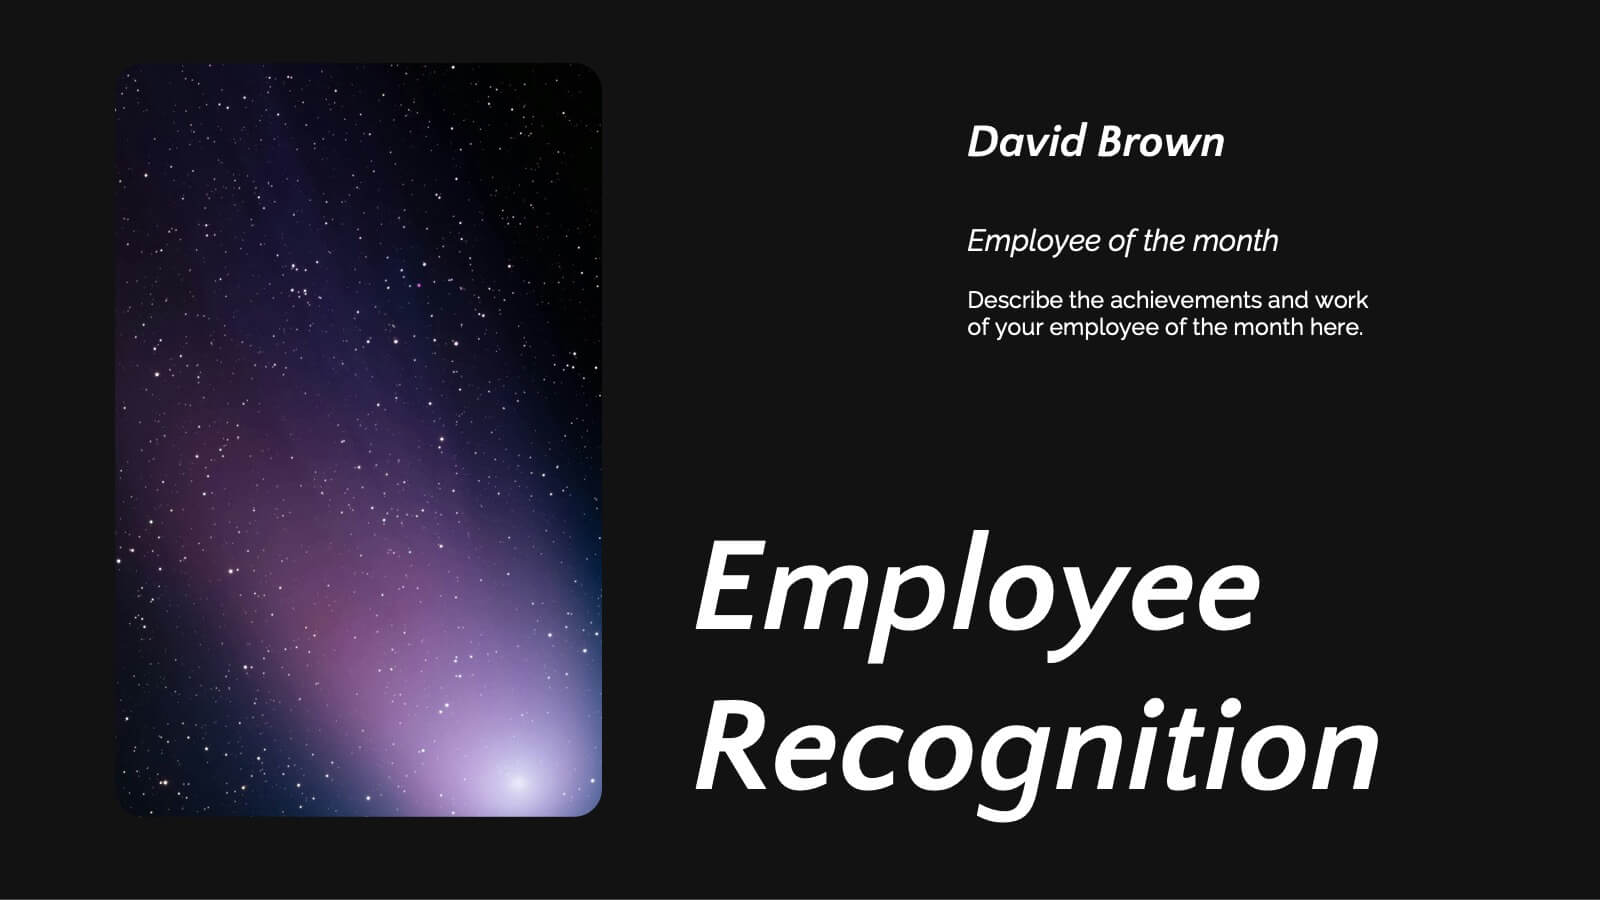
Saturn Business Plan Presentation
Embark on a journey to present your business plan like never before with this stellar presentation template! Perfect for diving deep into key updates, achievements, collaborations, and future goals, it guides your team through essential business strategies and challenges. Compatible with PowerPoint, Keynote, and Google Slides, it offers seamless flexibility and polished professionalism.