


Features
- 5 Unique slides
- Fully editable and easy to edit in Microsoft Powerpoint, Keynote and Google Slides
- 16:9 widescreen layout
- Clean and professional designs
- Export to JPG, PDF or send by email


Do you have any questions?
Recommend


7 slides
Alphabet Letters Infographic
An alphabet infographic is a visual representation or graphic that presents information related to the alphabet, often used for educational purposes or to convey information in a creative and engaging manner. Get ready to embark on a joyful journey through the wonderland of letters and words with our alphabet letters infographic. This infographic template includes various elements like letters, words, examples, pronunciation guides, or related images. This is more than just an infographic—it's a vibrant celebration of language, learning, and pure happiness. Dive into the kaleidoscope of alphabets and spread the cheer!


4 slides
Internal vs External Stakeholder Strategy Presentation
Clarify your stakeholder landscape with the Internal vs External Stakeholder Strategy Presentation. This slide features a clean quadrant design to distinguish internal and external stakeholders by priority or role. Ideal for strategy meetings, corporate communications, and stakeholder planning sessions. Fully customizable in PowerPoint, Keynote, and Google Slides.


20 slides
Chordstream Professional Portfolio Showcase Presentation
The Portfolio Presentation Template offers a modern and creative design, perfect for showcasing your projects, philosophy, and services. With 20 customizable slides, it includes sections for project highlights, pricing, client testimonials, and contact information. Compatible with PowerPoint, Keynote, and Google Slides, this template ensures professional impact for creatives.


7 slides
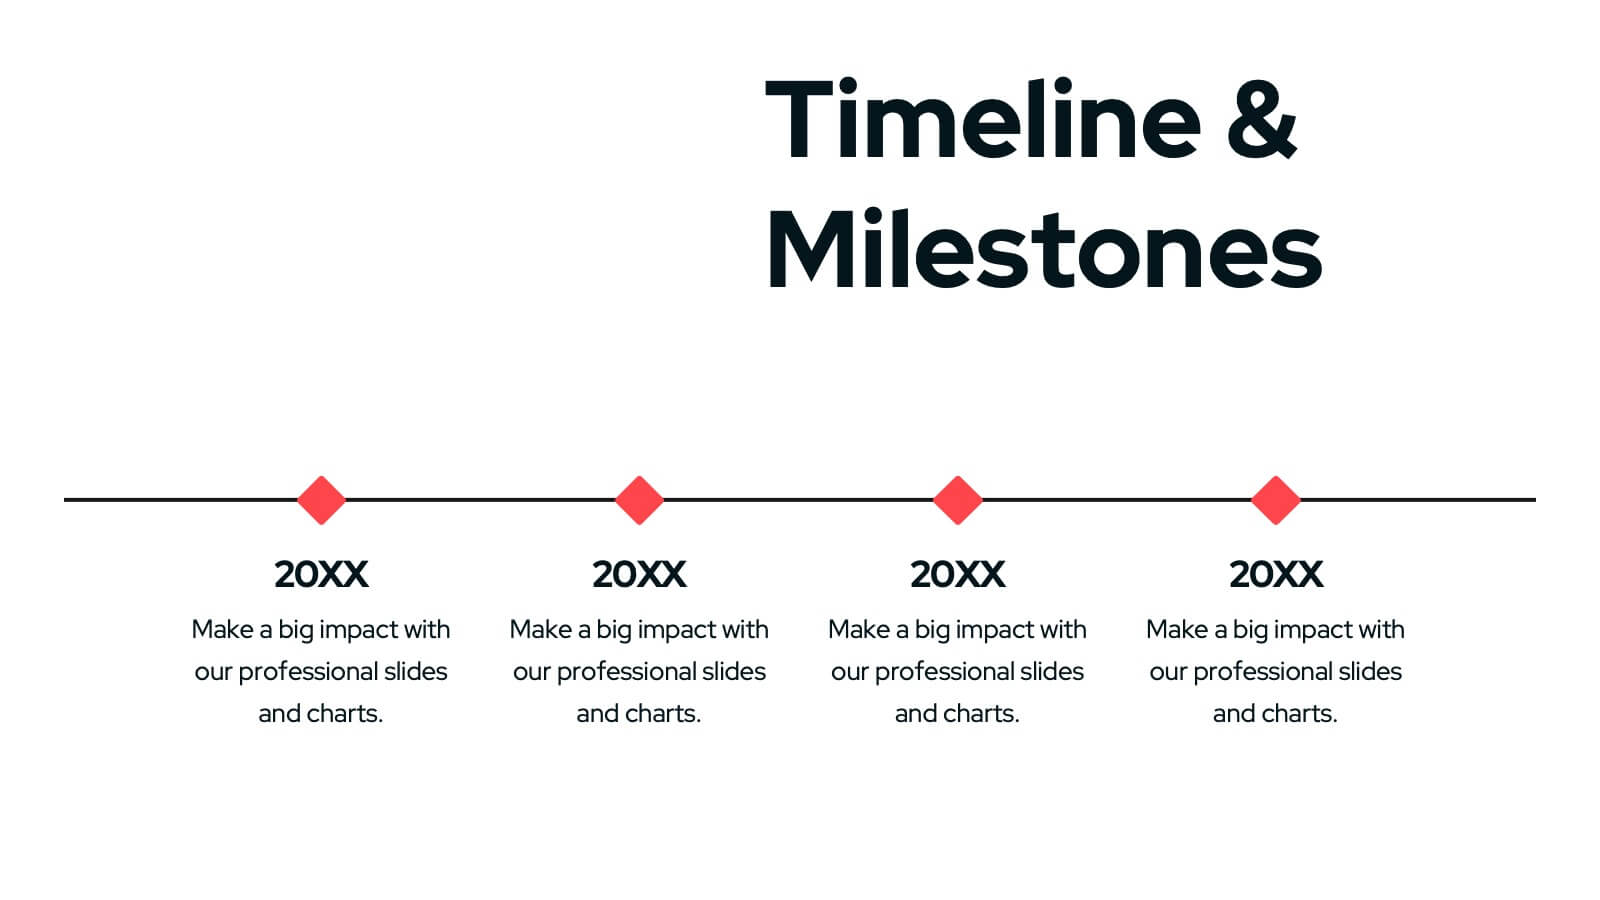
Timeline Logistics Infographic
A timeline infographic is a visual representation of the history of your company, product or service. This infographic template is the perfect way to show off your knowledge of a subject while also making it easy for your audience to digest all the information you've presented on hand. This infographic can be used to show the growth of your business. It’s also a great way to show the growth of your career. This template is simple and easy to use, but it’s also very powerful. You can add any icons you want and customize any text on the infographic. Compatible with Powerpoint, Keynote, and Google Slides. This is perfect for any occasion!


7 slides
Agile Methodology Strategy Infographic
Master the dynamics of Agile with our agile methodology infographic. Set against a crisp white foundation, the design cascades with the professionalism of blue, the urgency of red, the innovation of orange, and the growth of green. Equipped with methodical infographics, pertinent icons, and versatile image placeholders, this template provides a comprehensive depiction of the Agile process, from sprint planning to retrospectives. Tailored impeccably for Powerpoint, Keynote, or Google Slides. A must-have for project managers, scrum masters, product owners, or any Agile enthusiasts aiming to educate, implement, or iterate the Agile way.


6 slides
Travel Itinerary and Budget Planning Presentation
Plan trips with precision using this visually organized circle-based infographic. With six labeled sections and travel-themed icons, this layout helps you outline schedules, expenses, and key milestones clearly. Perfect for tour operators, travel bloggers, or itinerary services, this slide ensures information is both engaging and easy to follow. Fully editable in PowerPoint, Keynote, and Google Slides.


5 slides
Risks Assessment Matrix Presentation
Visualize risk like never before with a clear, color-coded grid that helps you evaluate impact, likelihood, and priority in seconds. Perfect for project planning, compliance reviews, or business strategy sessions, this presentation makes complex assessments simple. Fully compatible with PowerPoint, Keynote, and Google Slides for effortless editing.


8 slides
AI Trends and Future Technology Presentation
Step into the future with this sleek, modern template designed to visualize cutting-edge concepts in artificial intelligence. Featuring futuristic robot graphics and a clean circular flow layout, this design is perfect for showcasing tech trends, automation strategies, or AI-driven innovations. Each section is color-coded and icon-supported for easy customization. Ideal for tech startups, AI researchers, and innovation consultants. Fully editable in PowerPoint, Keynote, and Google Slides.


6 slides
Biological Structure and Function
Visualize anatomical frameworks with this dynamic skeletal structure infographic. Ideal for biology education, health science overviews, or anatomy lessons, this slide clearly marks major bones and allows for quick content customization. Fully editable in PowerPoint, Google Slides, and Keynote for seamless integration into any curriculum or report.

21 slides
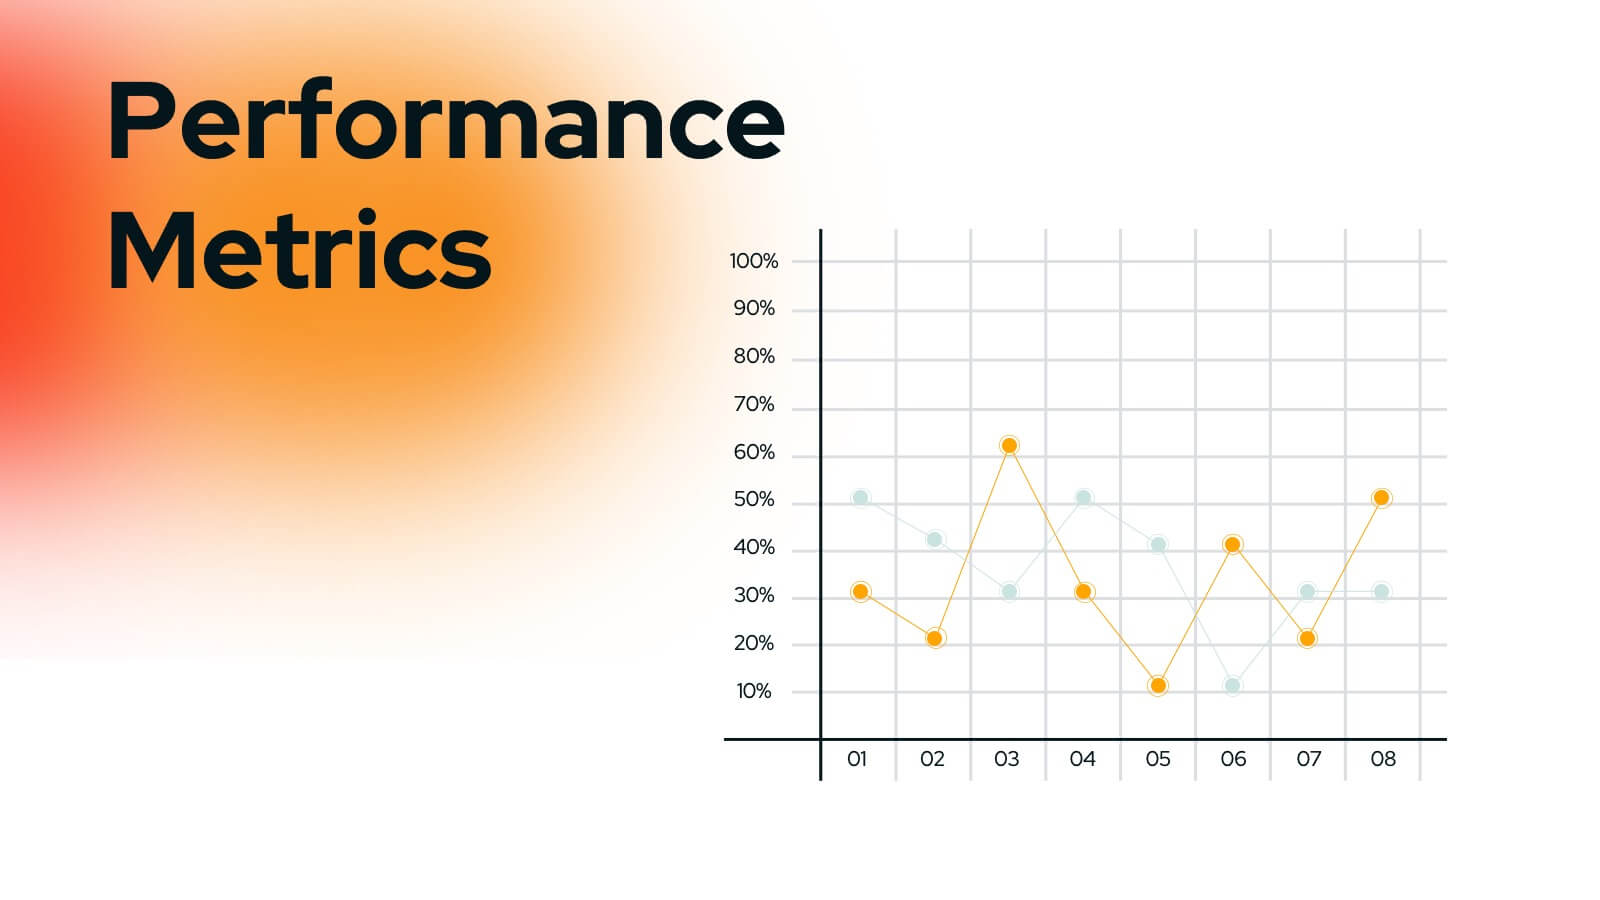
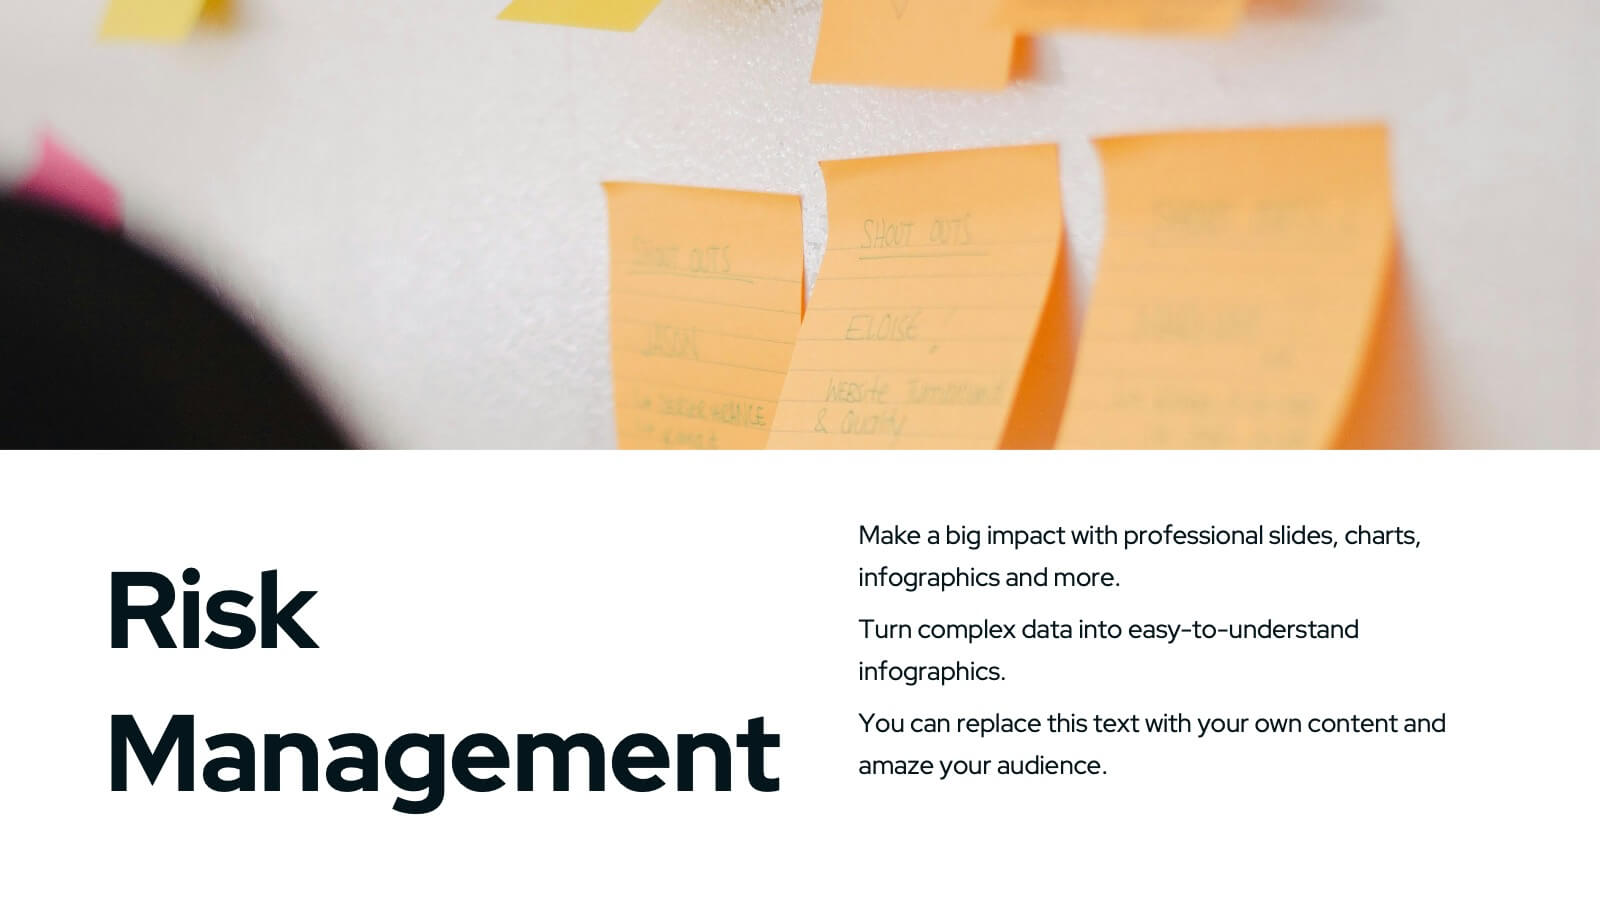
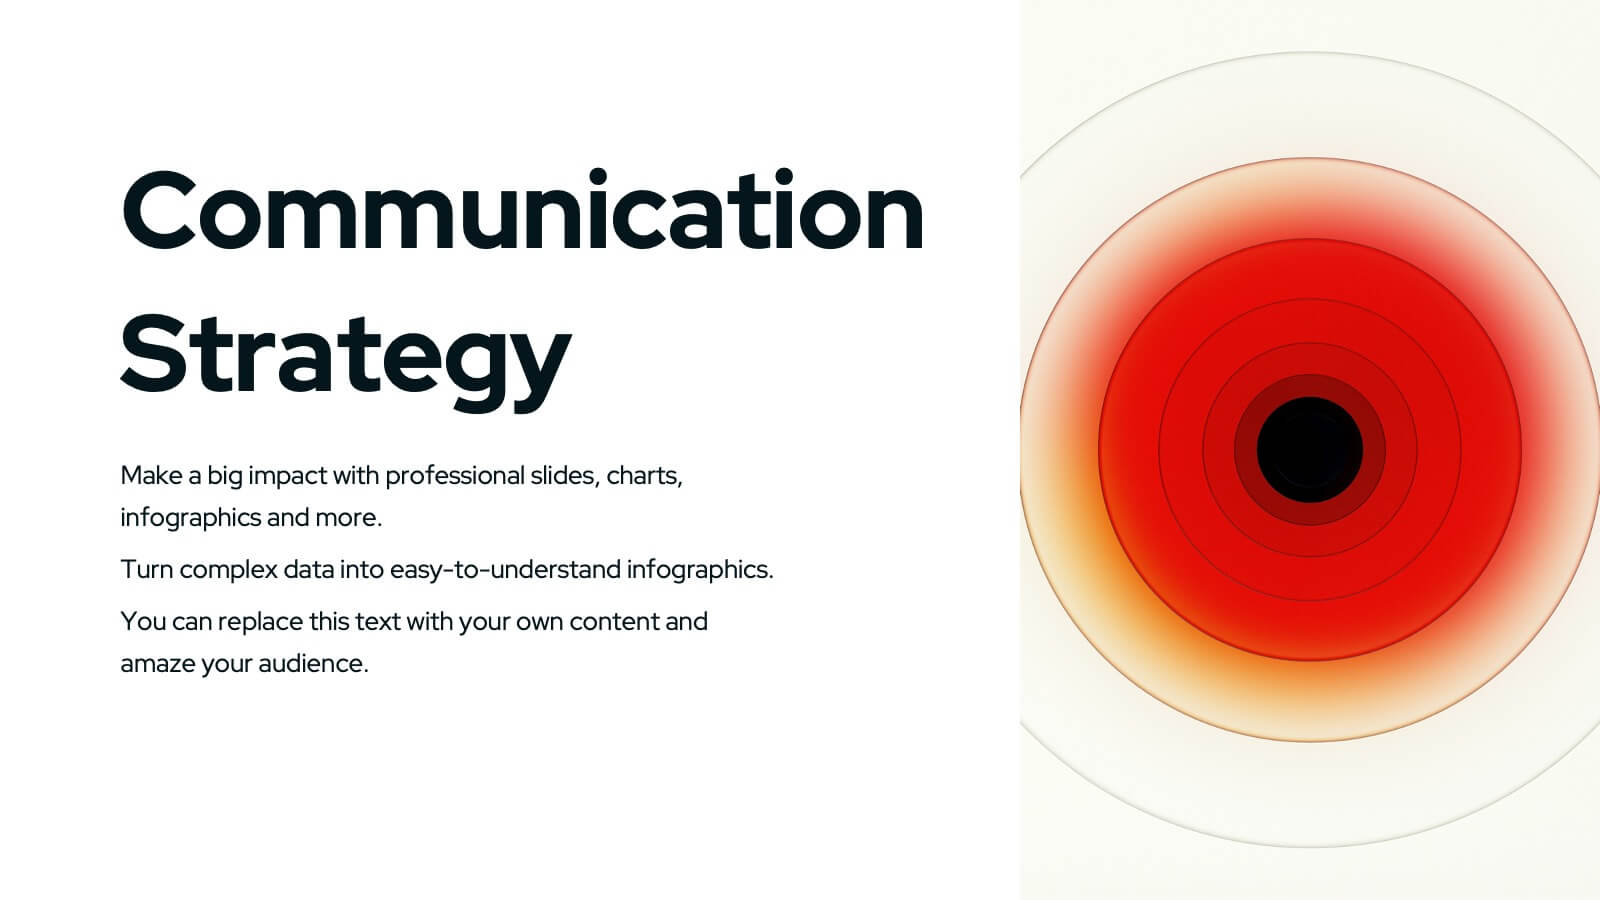
Wyrm Marketing Strategy Plan Presentation
Unleash the power of your marketing strategy with this bold and dynamic presentation template! Perfect for covering everything from landscape analysis and target audience identification to performance metrics and risk management. This template helps guide your audience through key challenges, SWOT analysis, and strategic initiatives with clarity and impact. Compatible with PowerPoint, Keynote, and Google Slides for effortless and engaging presentations.


4 slides
Neuroscience-Inspired Concept Mapping Presentation
Visualize abstract ideas with clarity using the Neuroscience-Inspired Concept Mapping Presentation. Featuring a head silhouette and four labeled concept nodes, this layout is perfect for connecting ideas, frameworks, or steps in a thought process. Fully editable in PowerPoint, Canva, and Google Slides for seamless customization and presentation.


6 slides
Real Estate Classes Infographic
Real estate classes are educational programs or courses that provide individuals with the knowledge and skills needed to succeed in the real estate industry. This infographic template provides an overview of different types of real estate classes and what real estate is. This is designed to help individuals interested in the real estate industry understand the various educational opportunities available to them. Help your audience make informed decisions about their educational journey in the real estate field. Fully customizable and compatible with Powerpoint, Keynote, and Google Slides.


6 slides
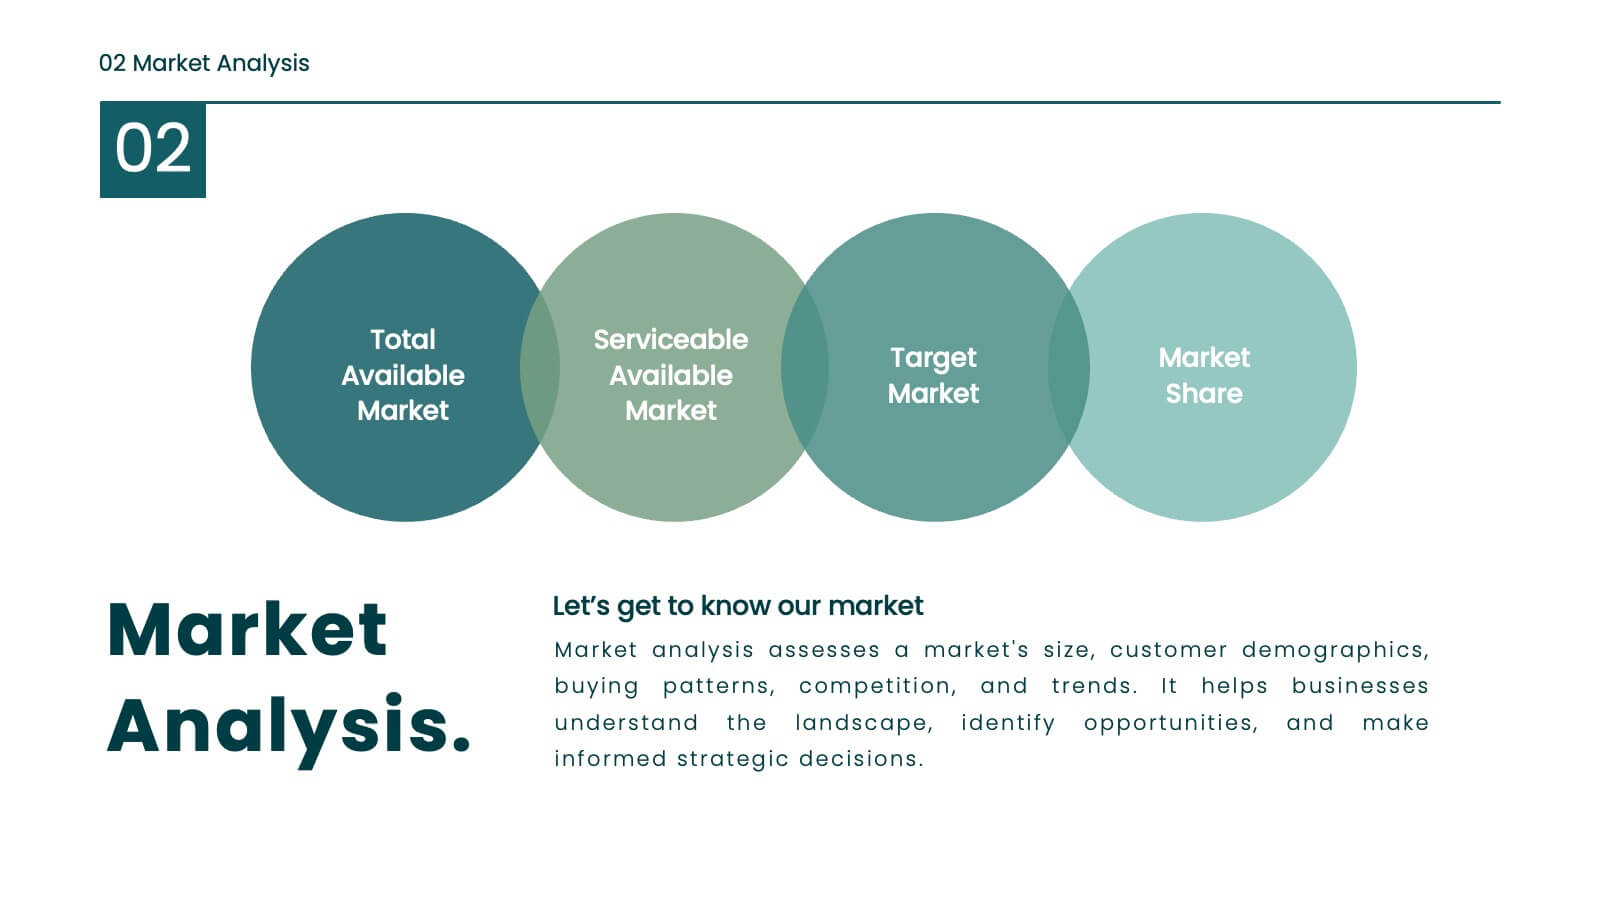
TAM SAM SOM Formula Infographics
Understand market potential with our TAM SAM SOM Formula infographic template. This template is fully compatible with popular presentation software like PowerPoint, Keynote, and Google Slides, allowing you to easily customize it to calculate and analyze your Total Addressable Market (TAM), Serviceable Available Market (SAM), and Serviceable Obtainable Market (SOM). The TAM SAM SOM Formula infographic template offers a visually engaging platform to break down these critical market size metrics and understand your business's growth potential. Whether you're an entrepreneur, marketer, or business strategist, this template provides a user-friendly canvas to create informative presentations and develop strategies based on market segmentation. Unleash your business's growth potential with this SEO-optimized TAM SAM SOM Formula infographic template, thoughtfully designed for clarity and ease of use. Customize it to calculate and showcase these market size metrics, helping you make data-driven decisions and target the right market segments effectively. Start crafting your personalized infographic today to unlock your business's full potential.


4 slides
Finance Metrics Dashboard Presentation
Bring your numbers to life with a bold, visual dashboard that makes complex financial data instantly clear. This presentation helps you track revenue, returns, profit, and performance trends using clean charts and modern KPI blocks designed for quick insight. Fully compatible with PowerPoint, Keynote, and Google Slides.


3 slides
Strategic Planning and Business Model Presentation
Present your business roadmap with clarity using this Strategic Planning and Business Model slide. Featuring a modular grid layout, it allows you to break down initiatives, objectives, and action items into digestible segments. Perfect for business strategy sessions, planning workshops, or executive reports. Fully editable in PowerPoint, Canva, and Google Slides.


28 slides
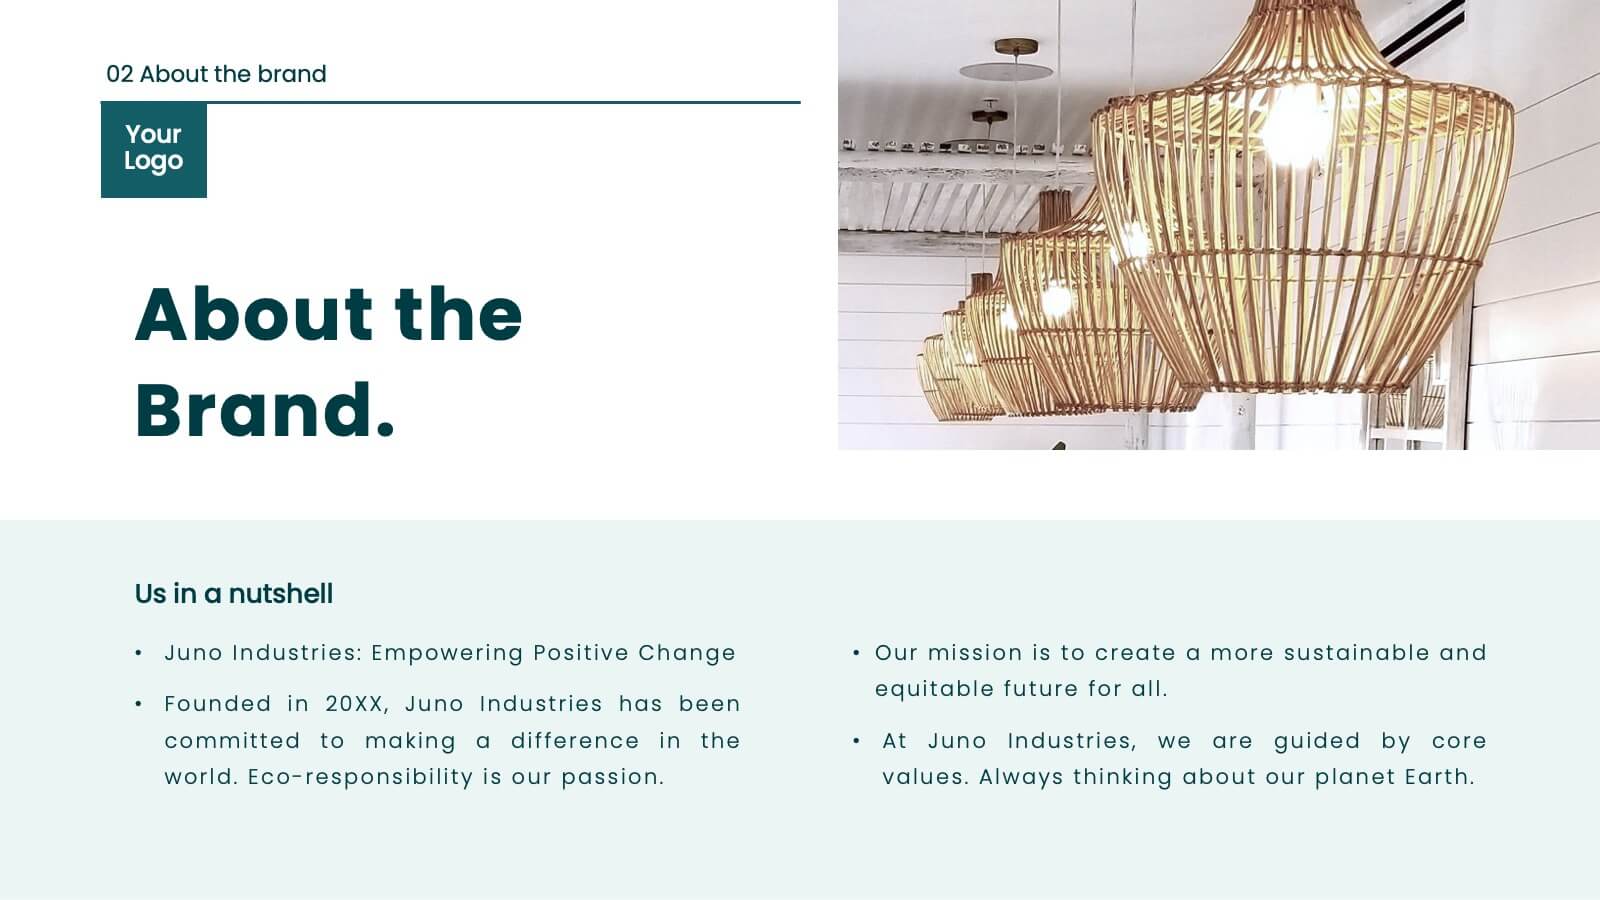
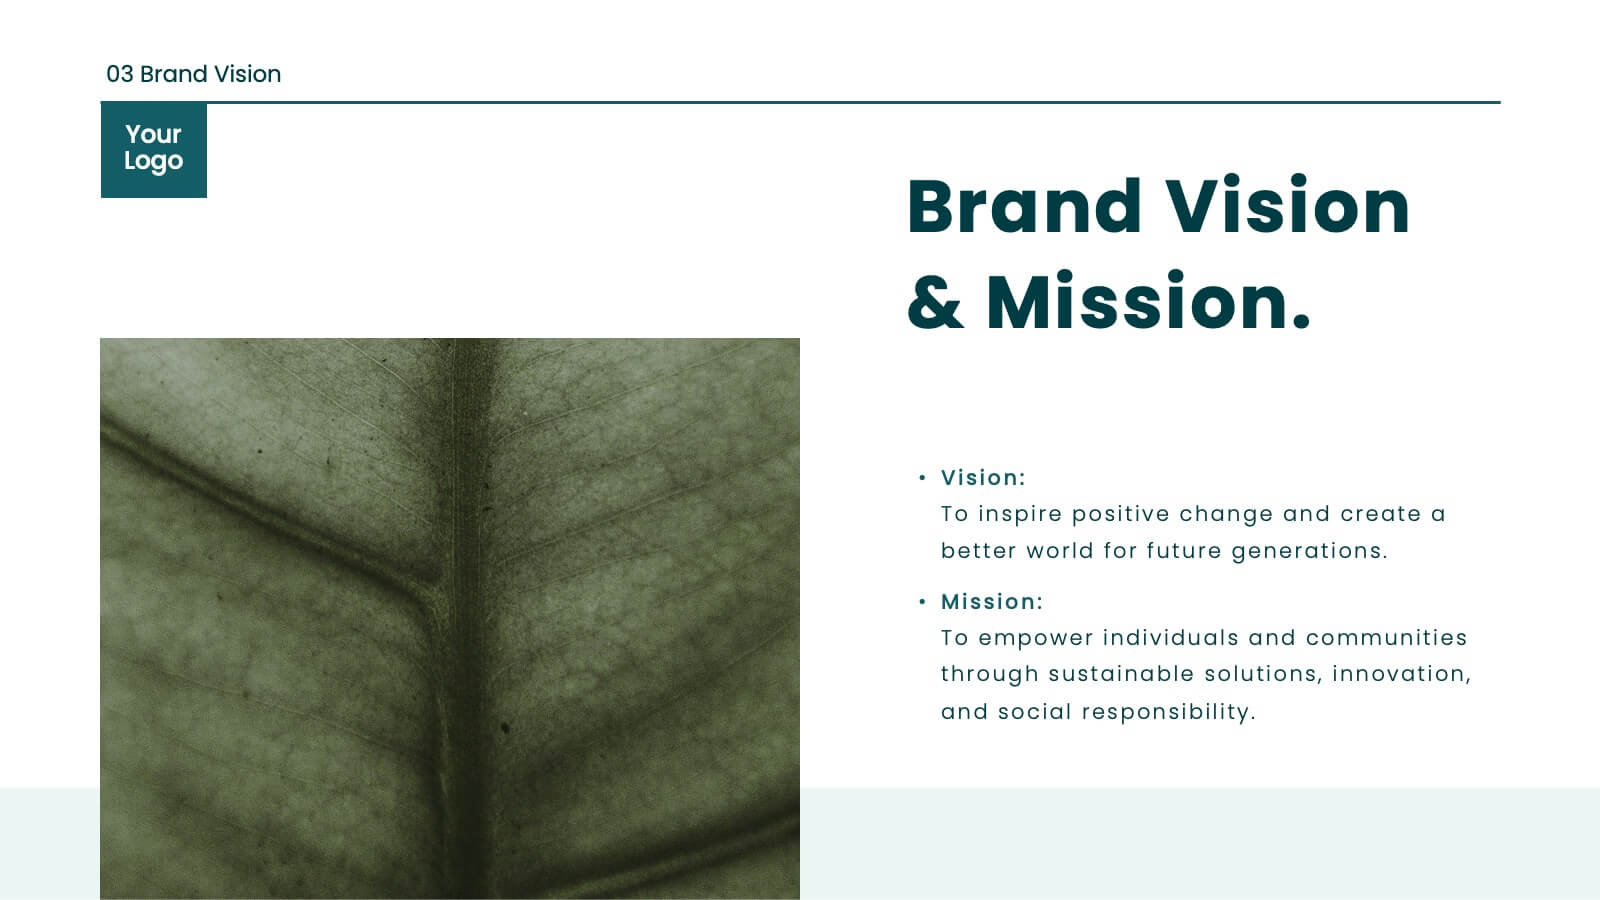
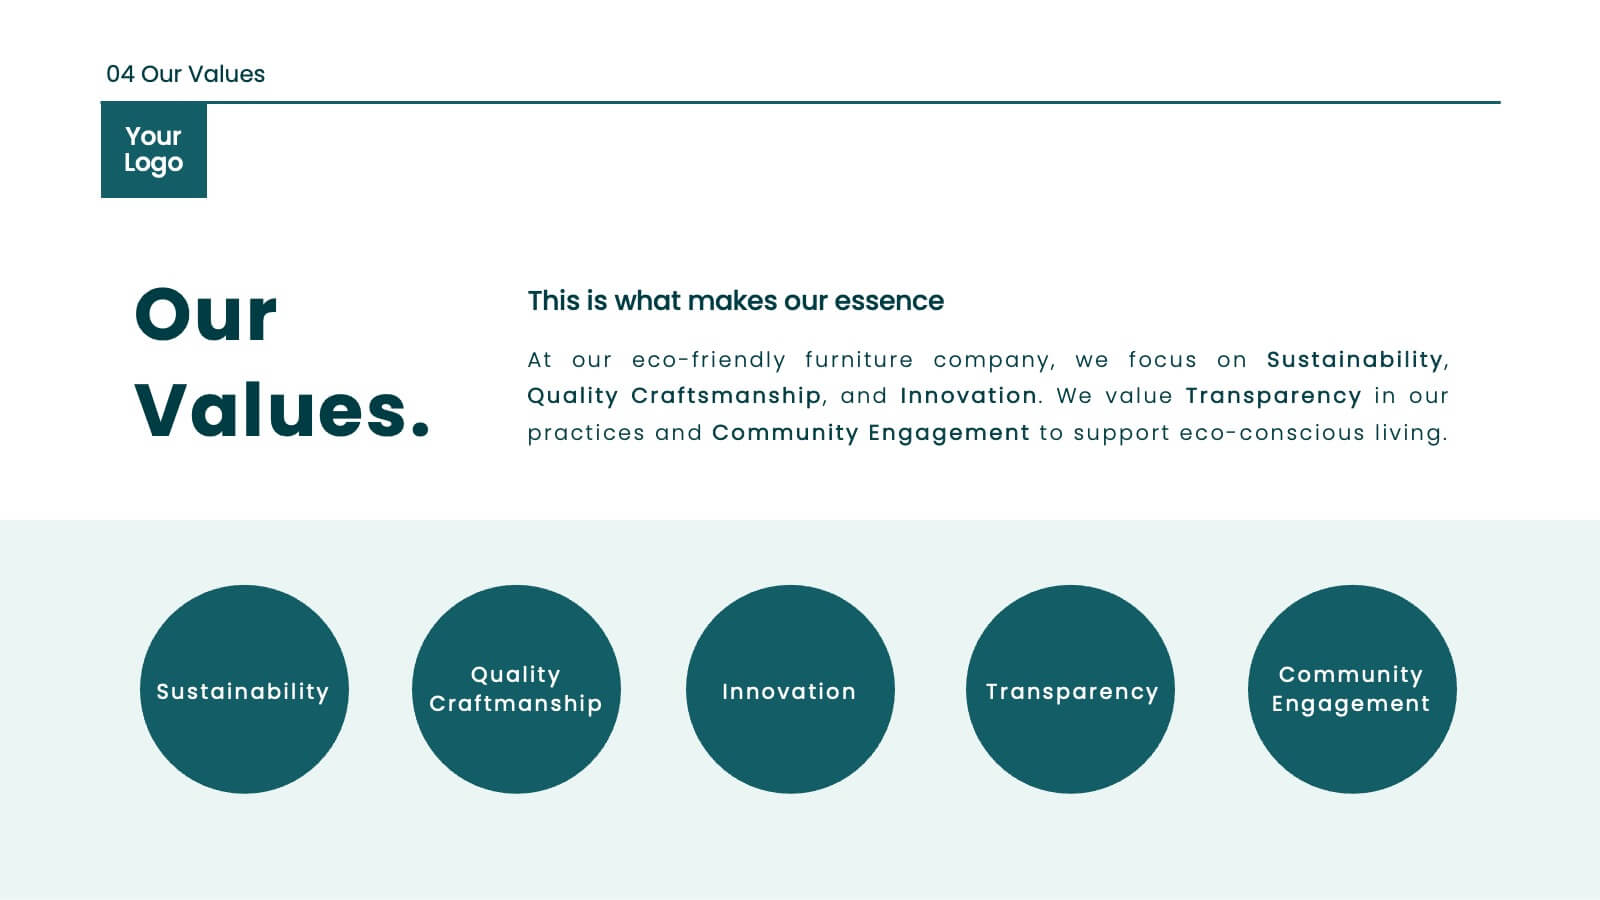
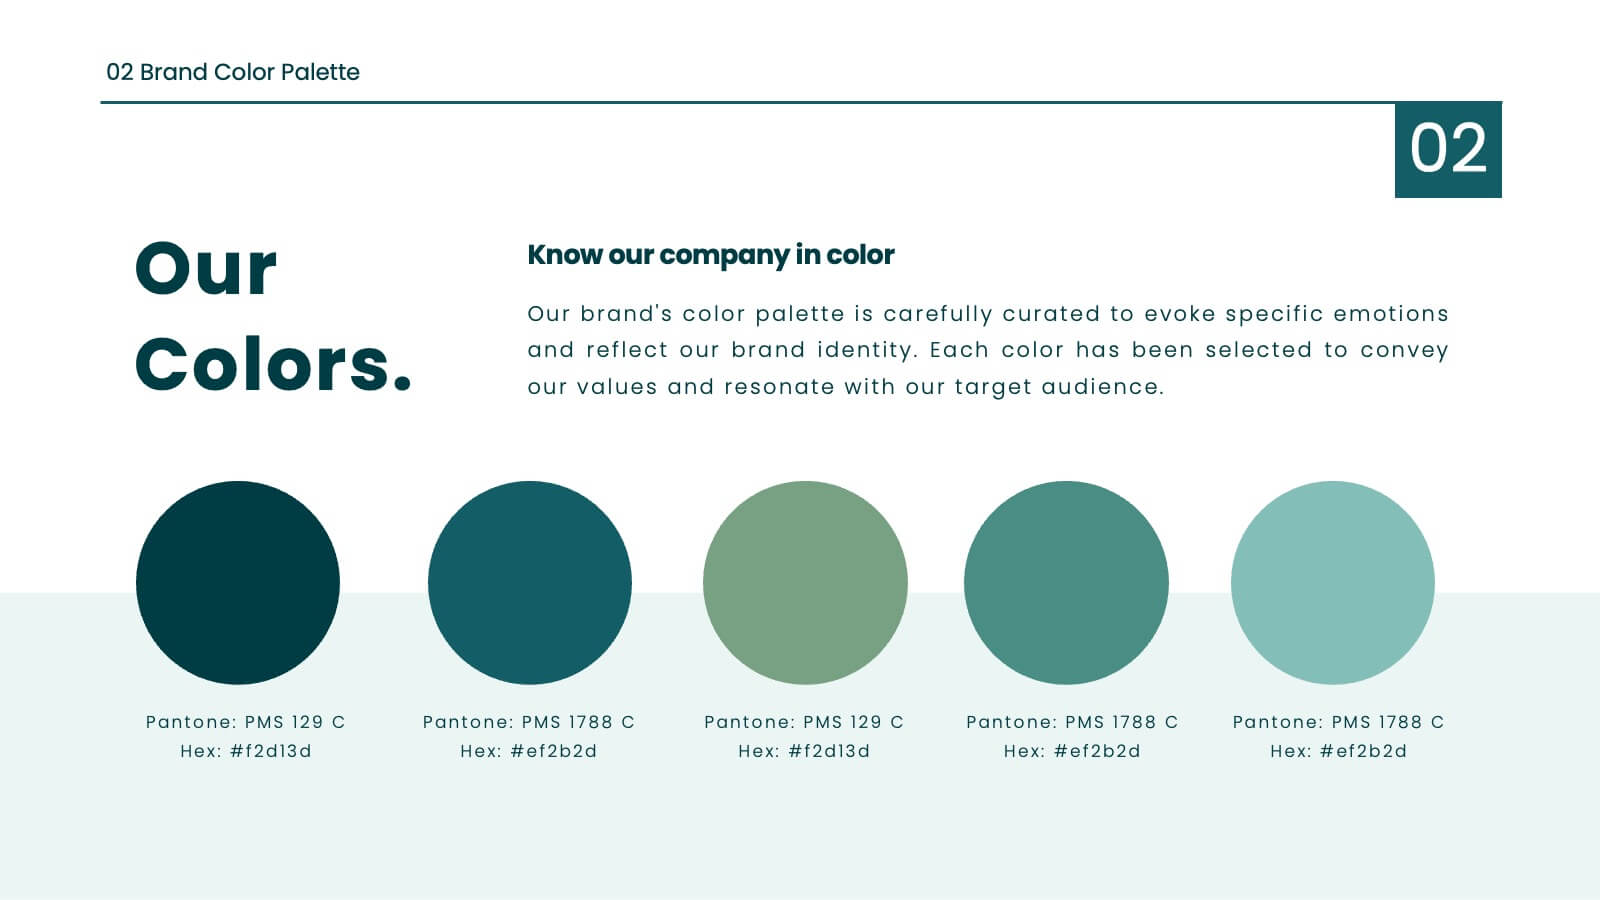
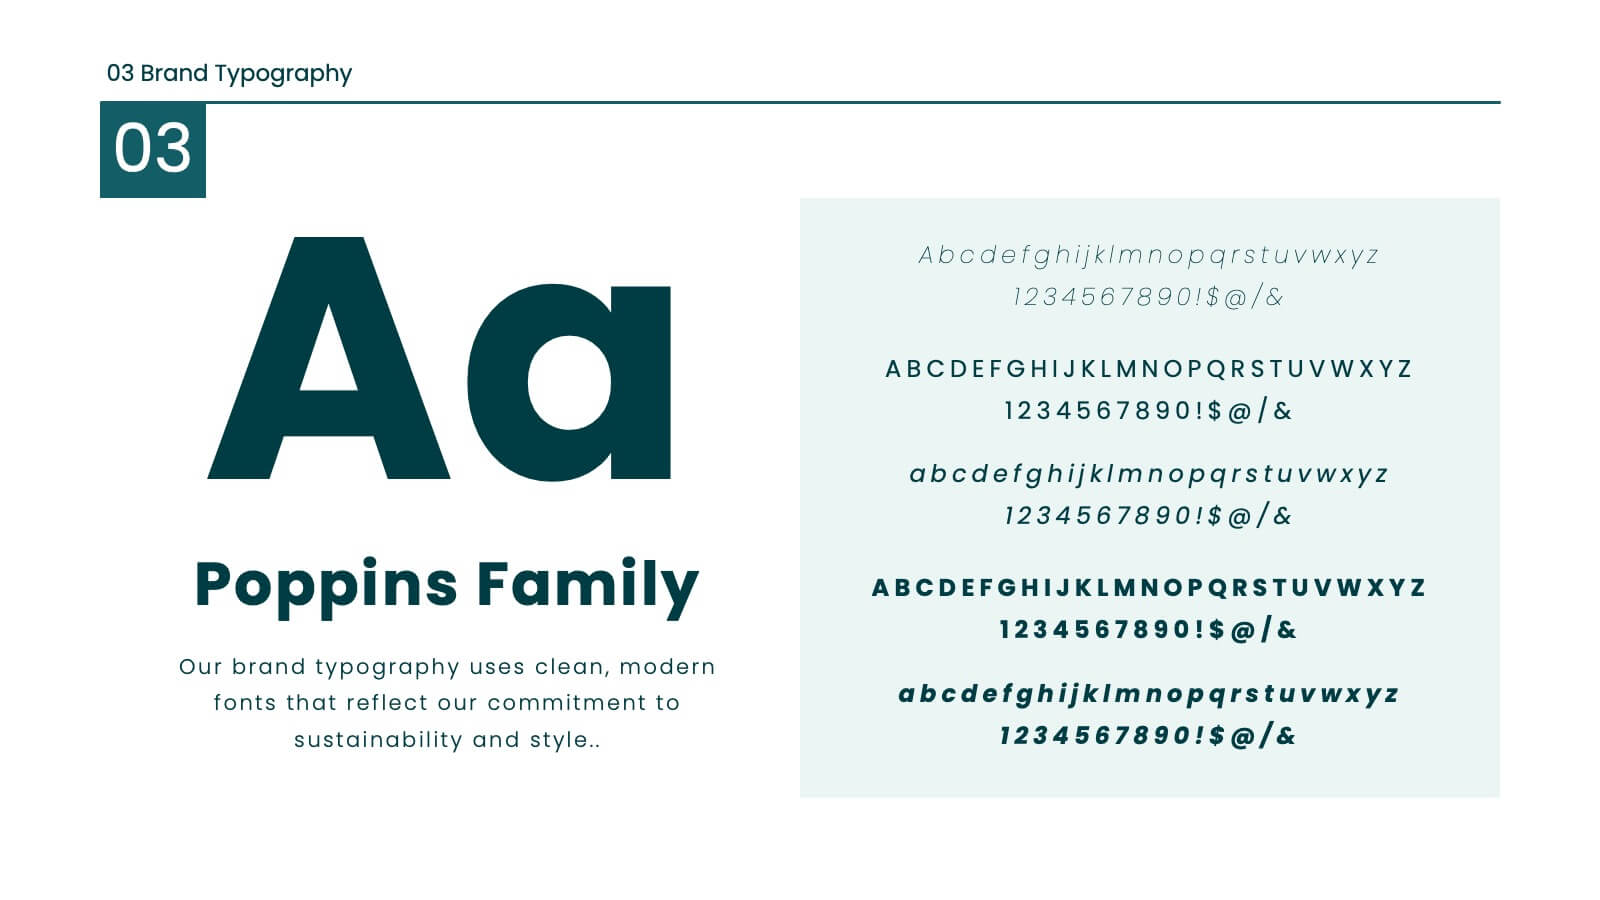
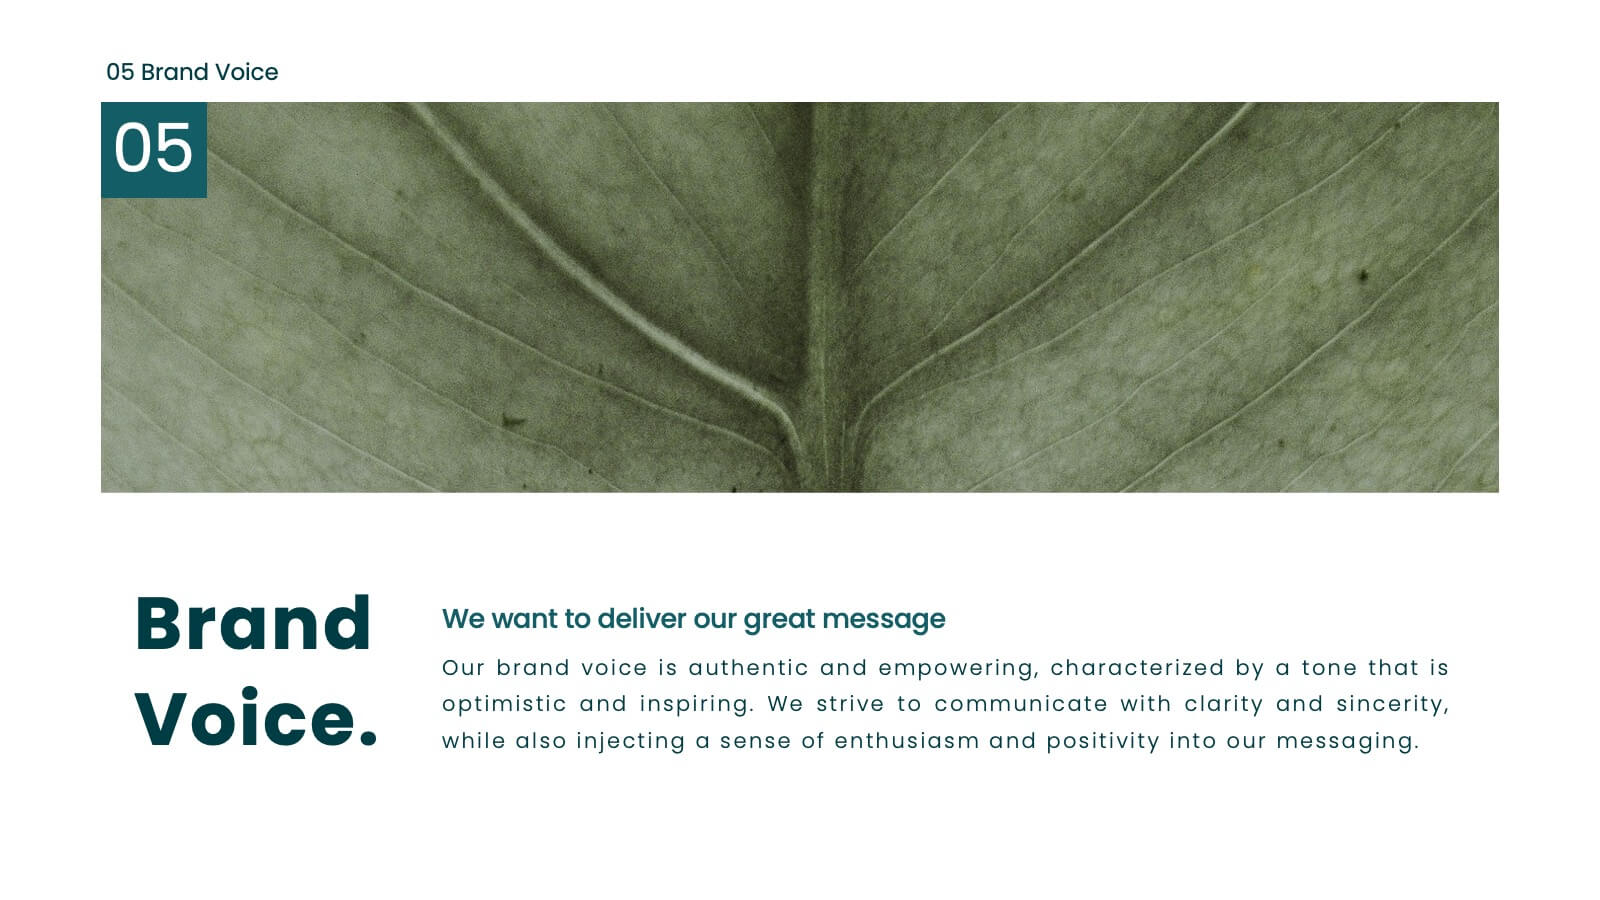
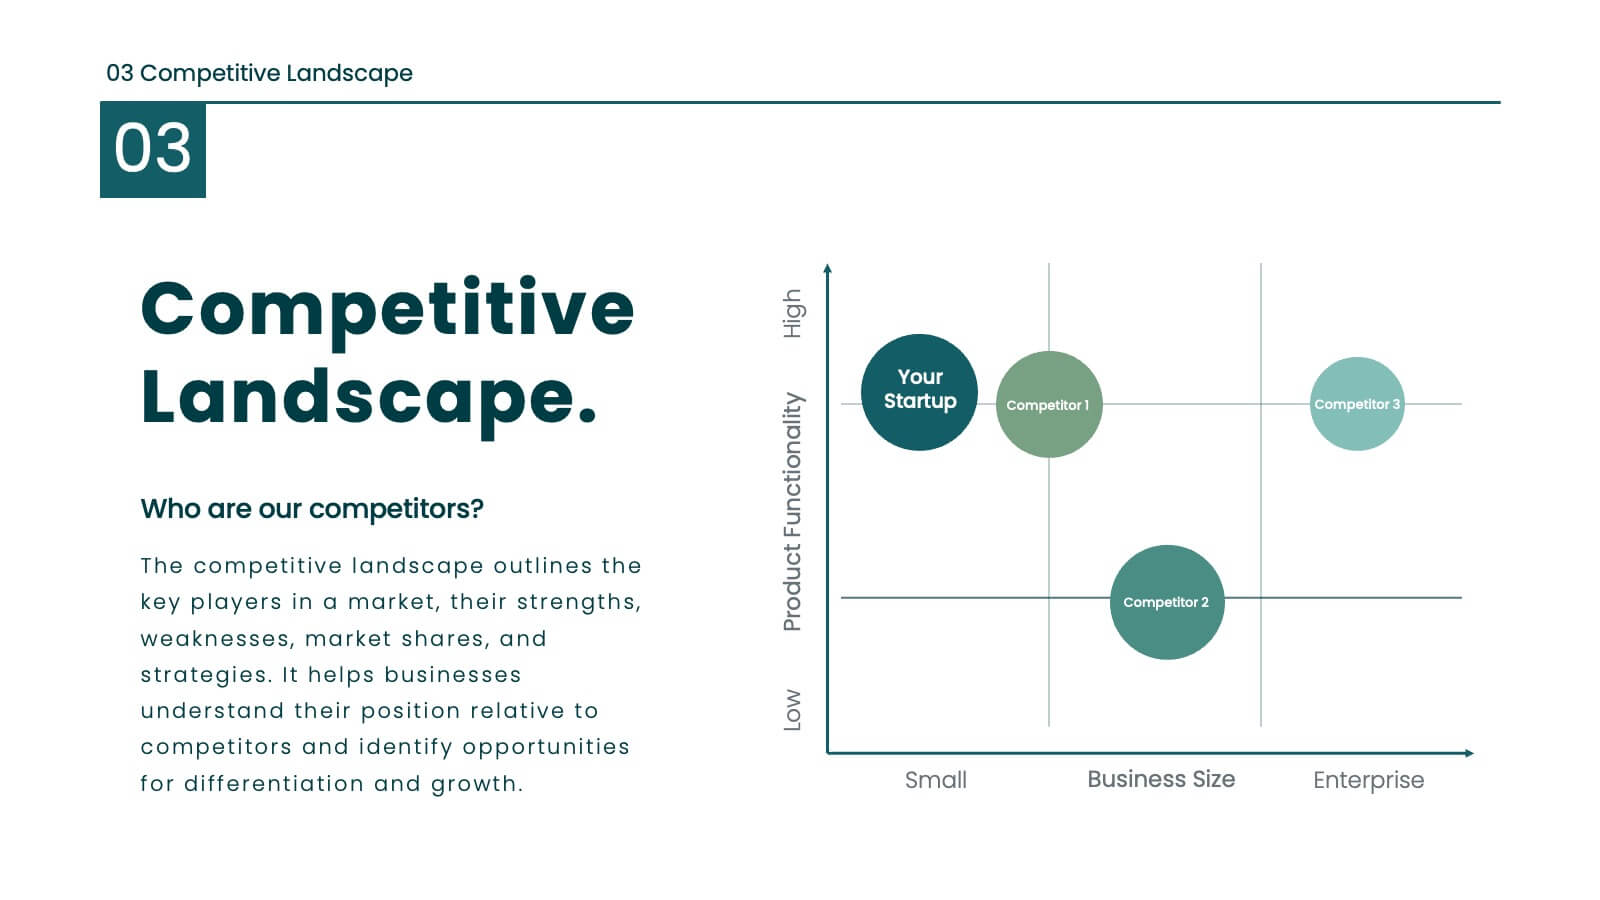
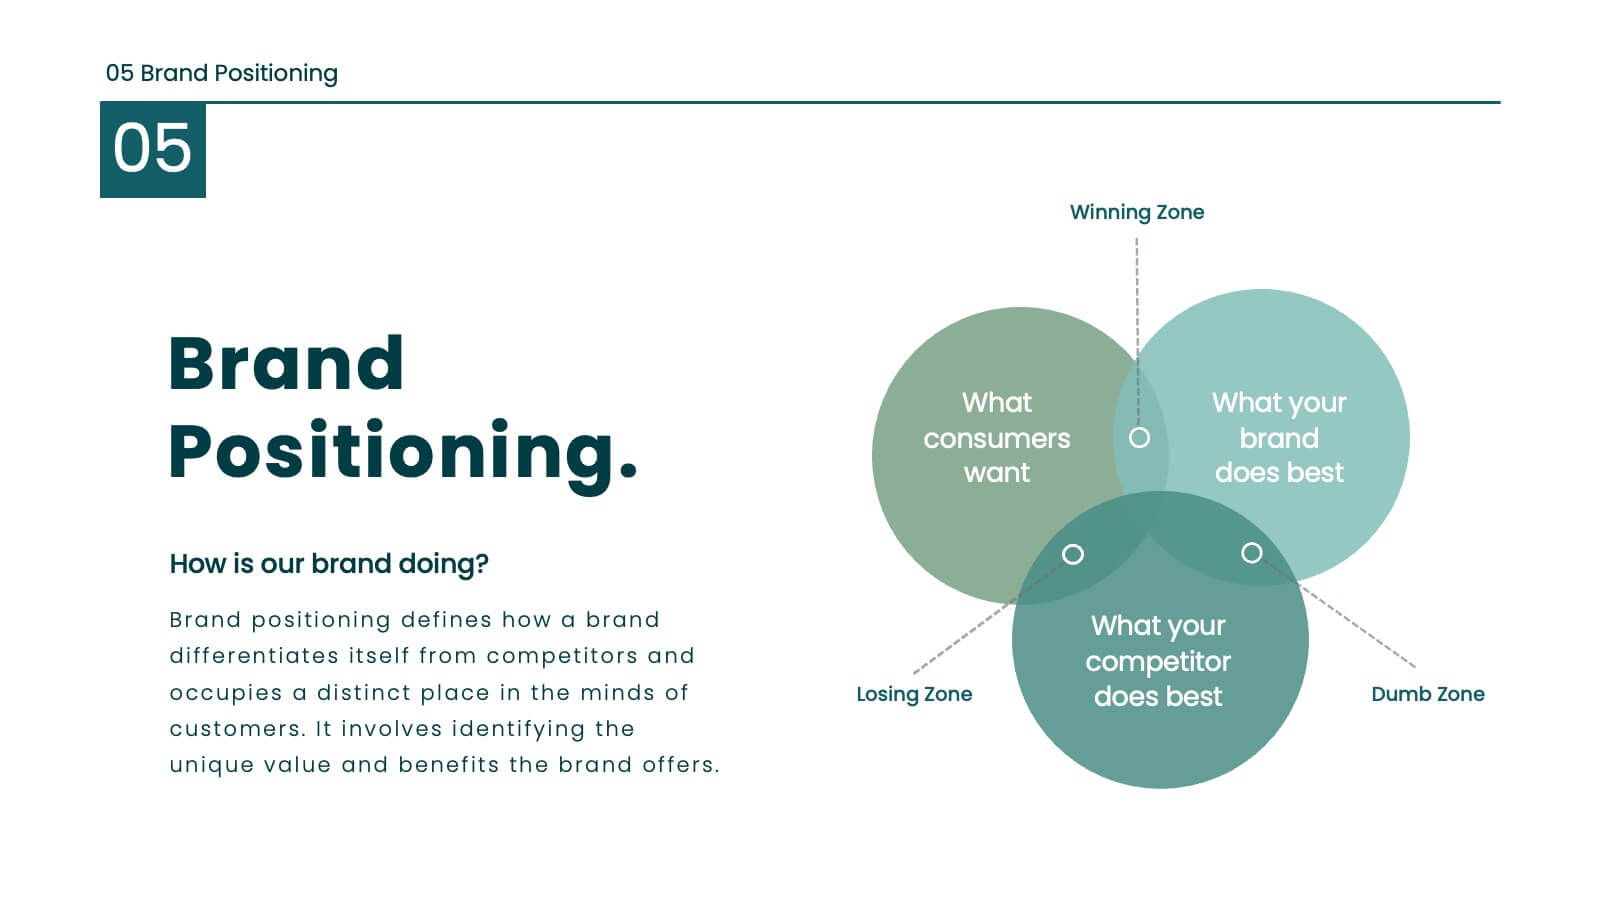
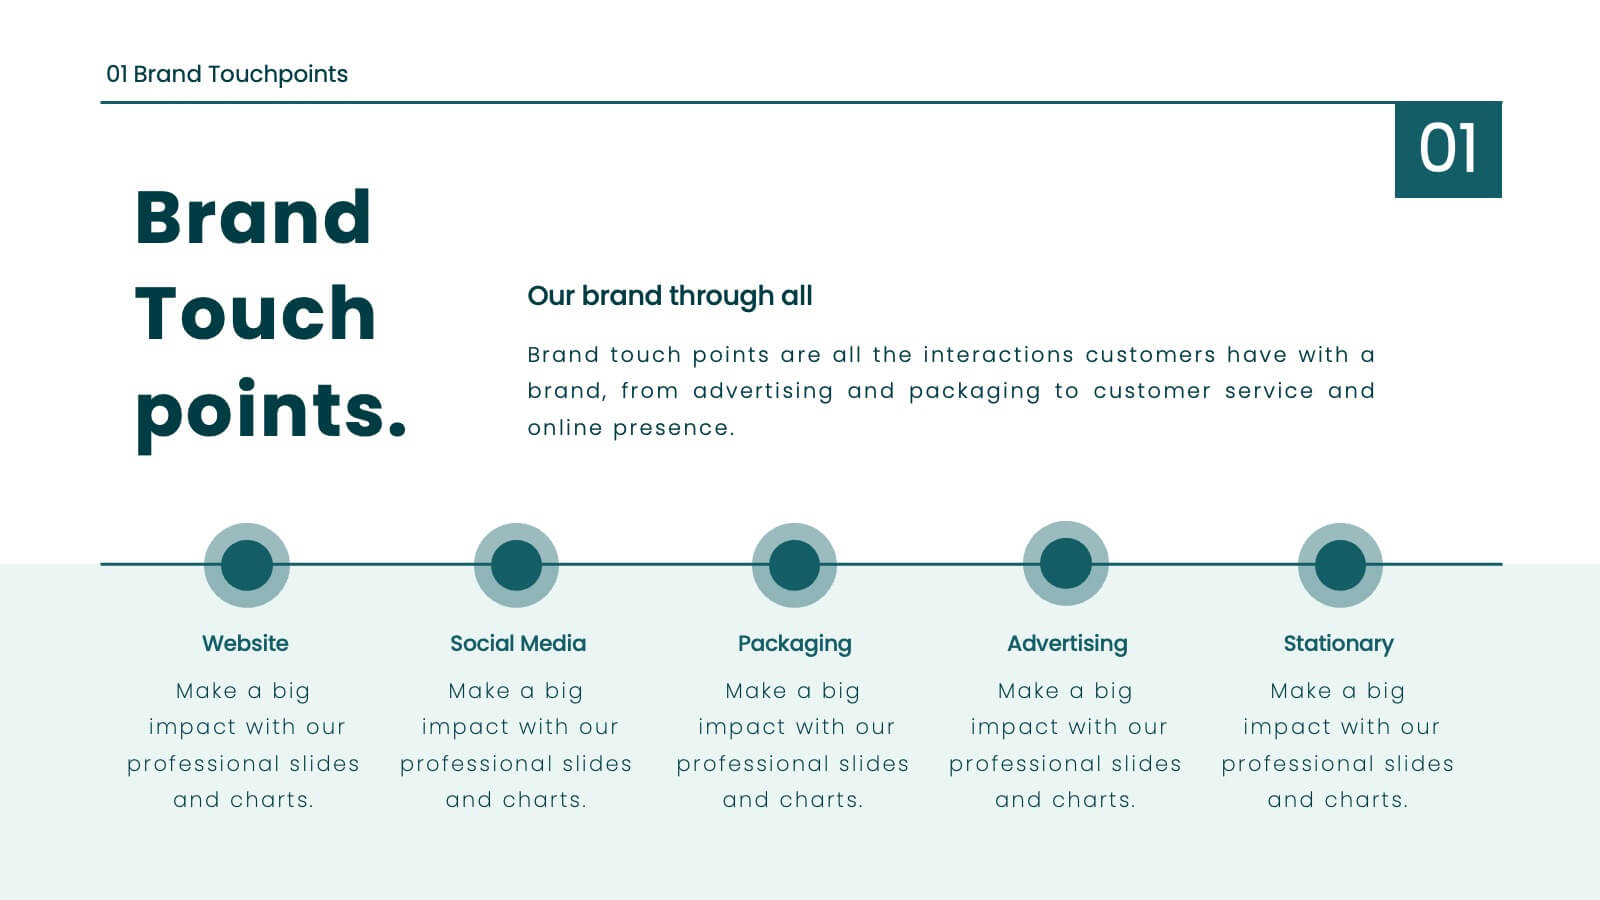
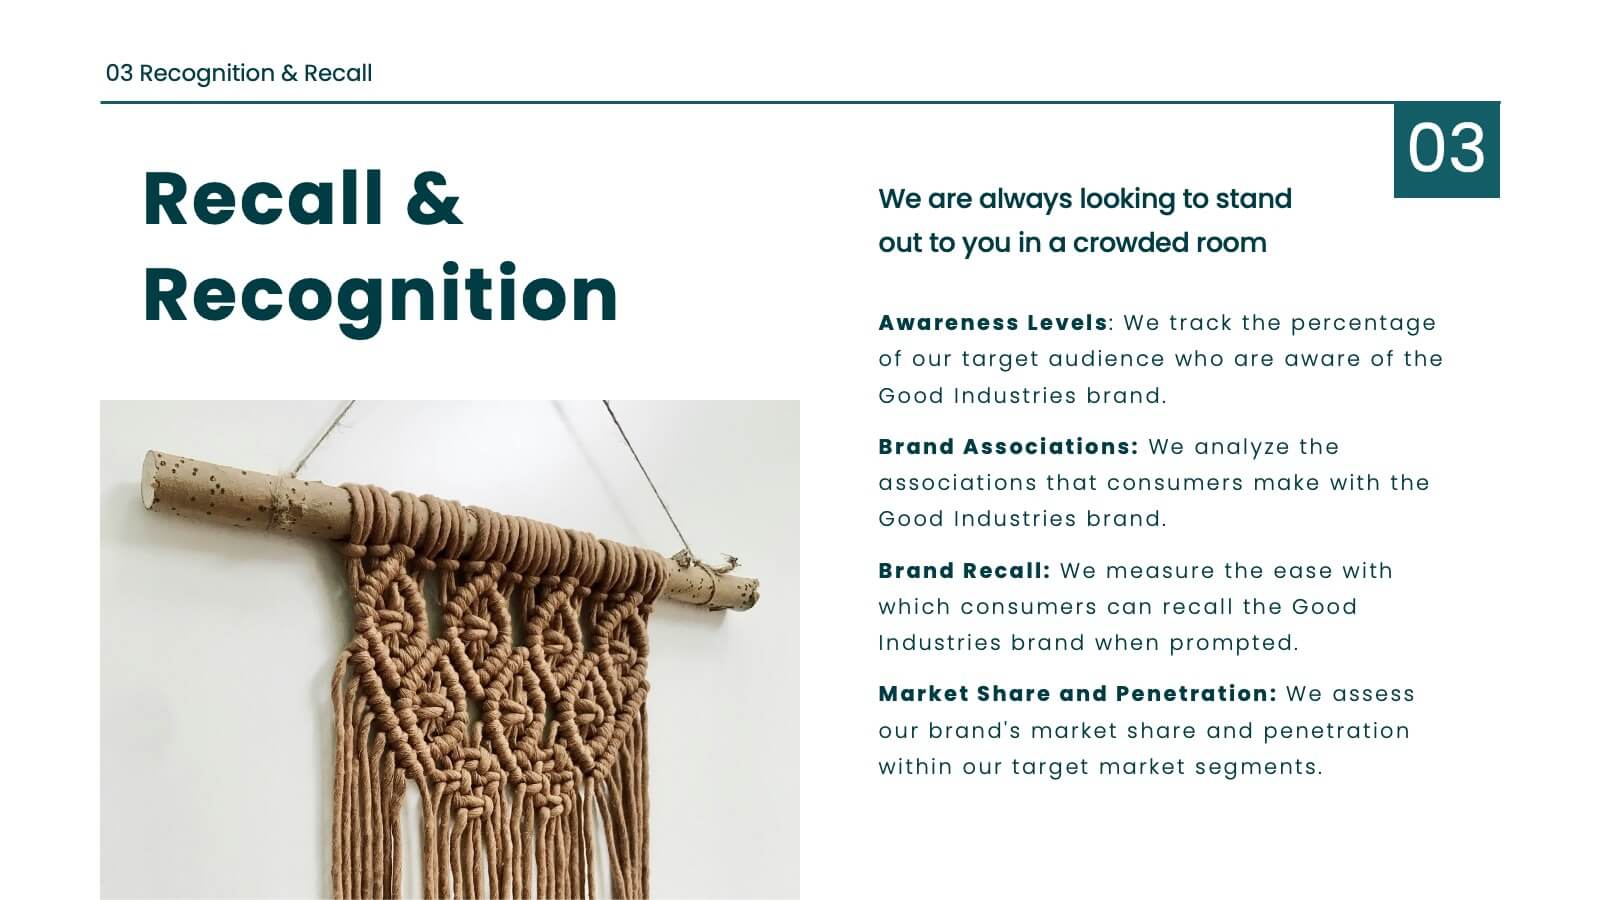
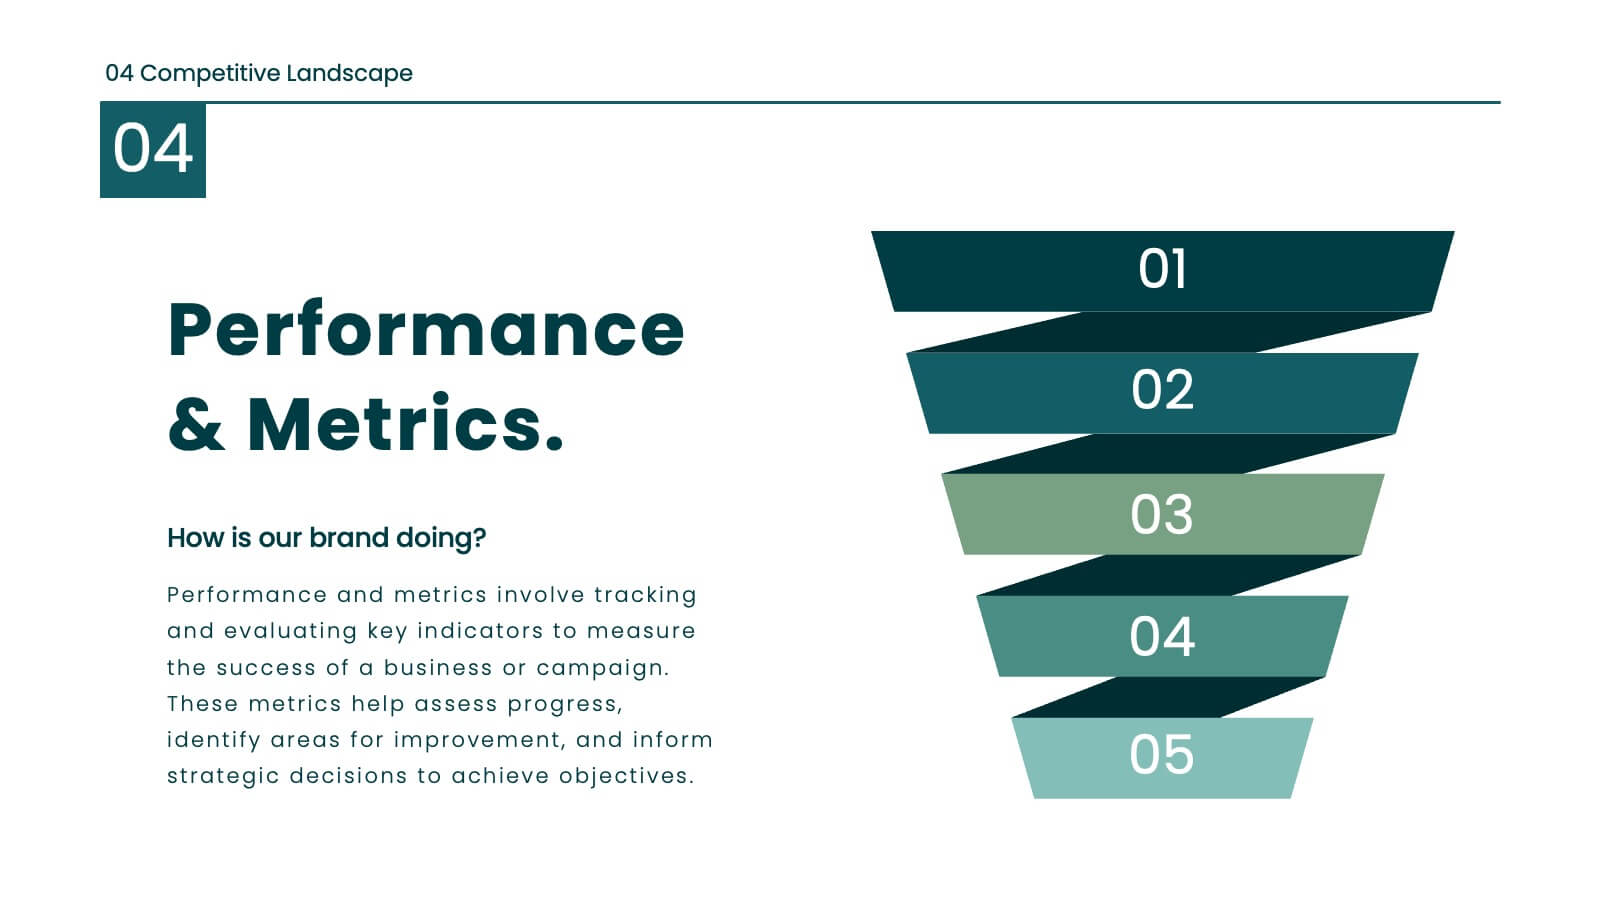
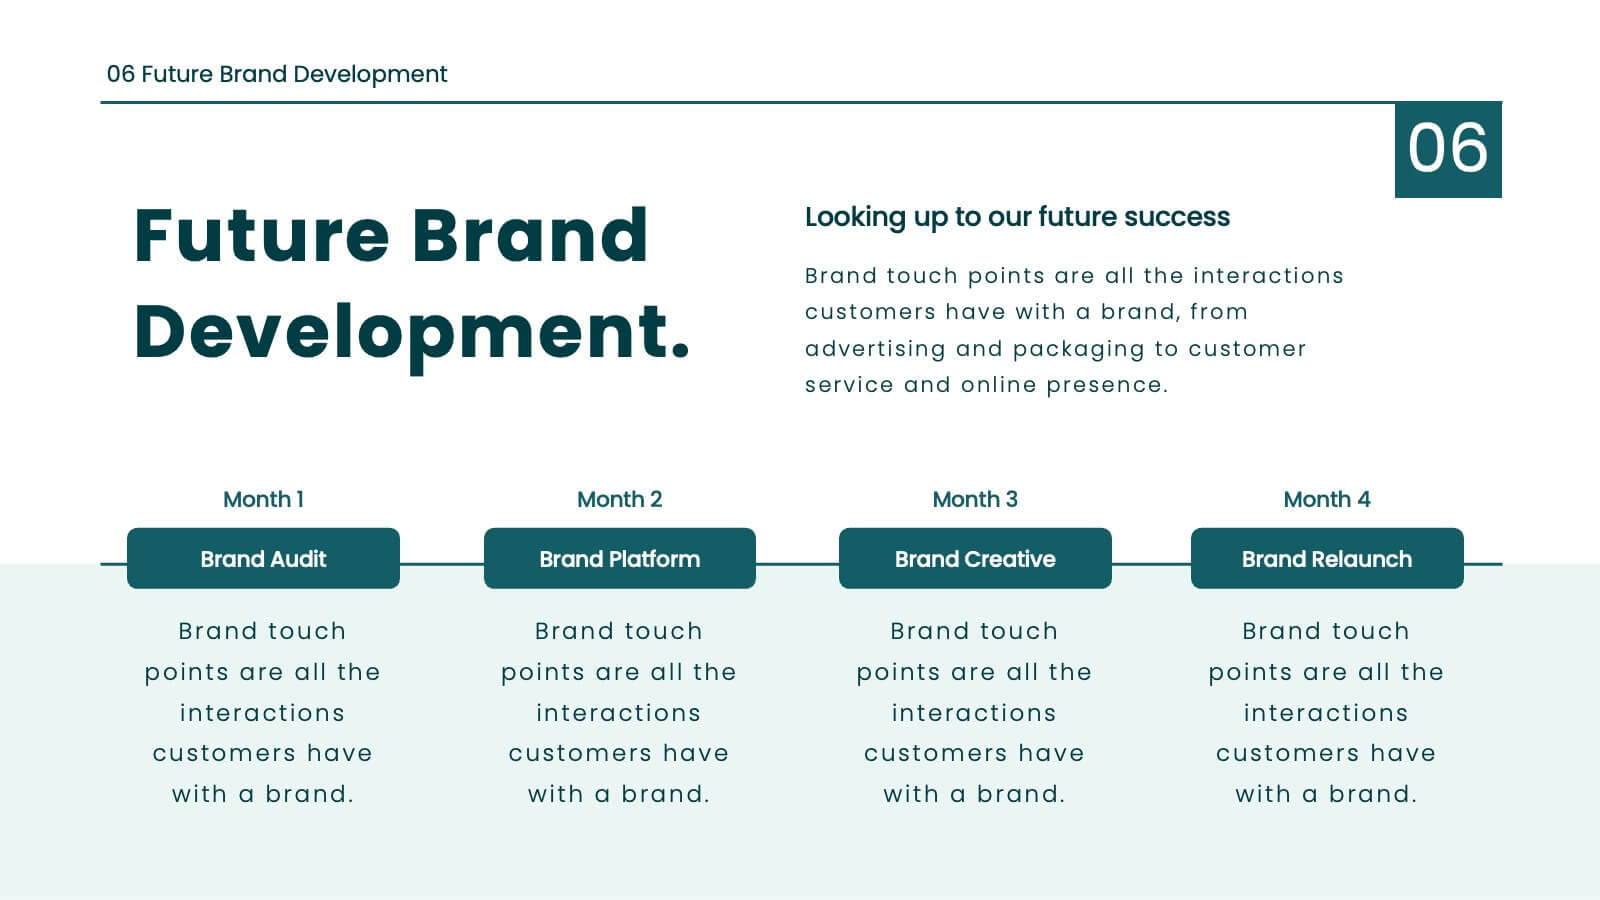
Juno Brand Guidelines Proposal Presentation
Define your brand's identity with this comprehensive, stylish presentation template. Perfect for detailing brand guidelines, vision, mission, and market analysis, it features a clean design with a professional layout. Highlight key elements like color palettes, typography, and unique selling propositions to ensure consistency and clarity. Compatible with PowerPoint, Keynote, and Google Slides, it’s ideal for any platform.


4 slides
School Curriculum Overview Presentation
Present your academic plan with this creative curriculum overview layout. Featuring intersecting pencil graphics, it visually organizes four key subjects or areas of focus. Perfect for teachers, school administrators, or education consultants. Fully customizable in PowerPoint, Keynote, and Google Slides to match any educational level or institutional branding.