


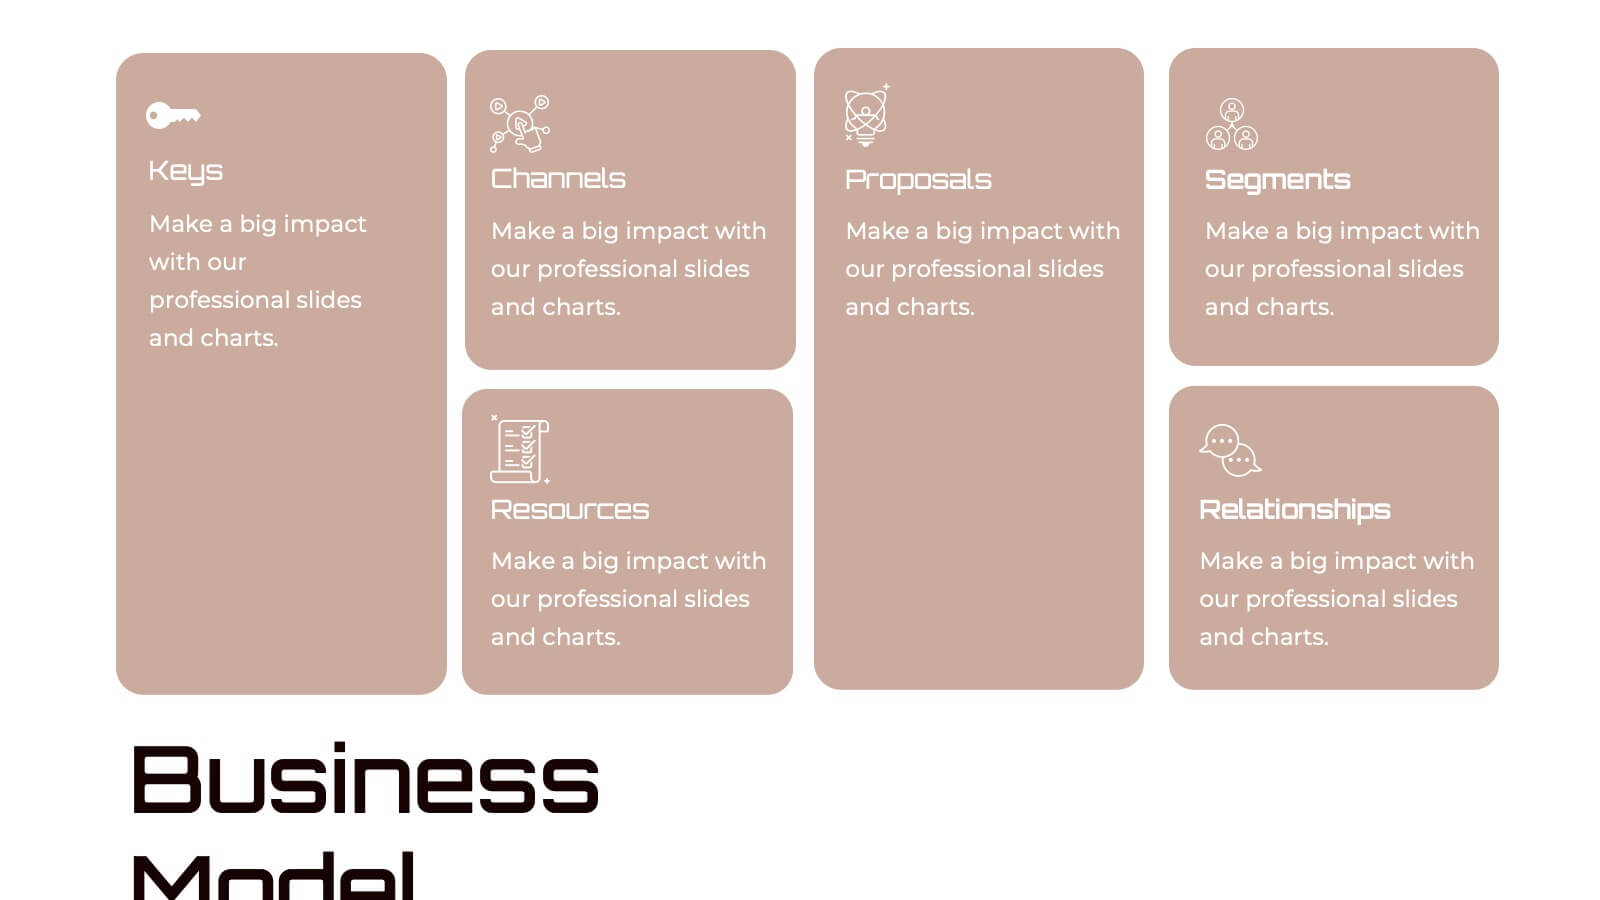
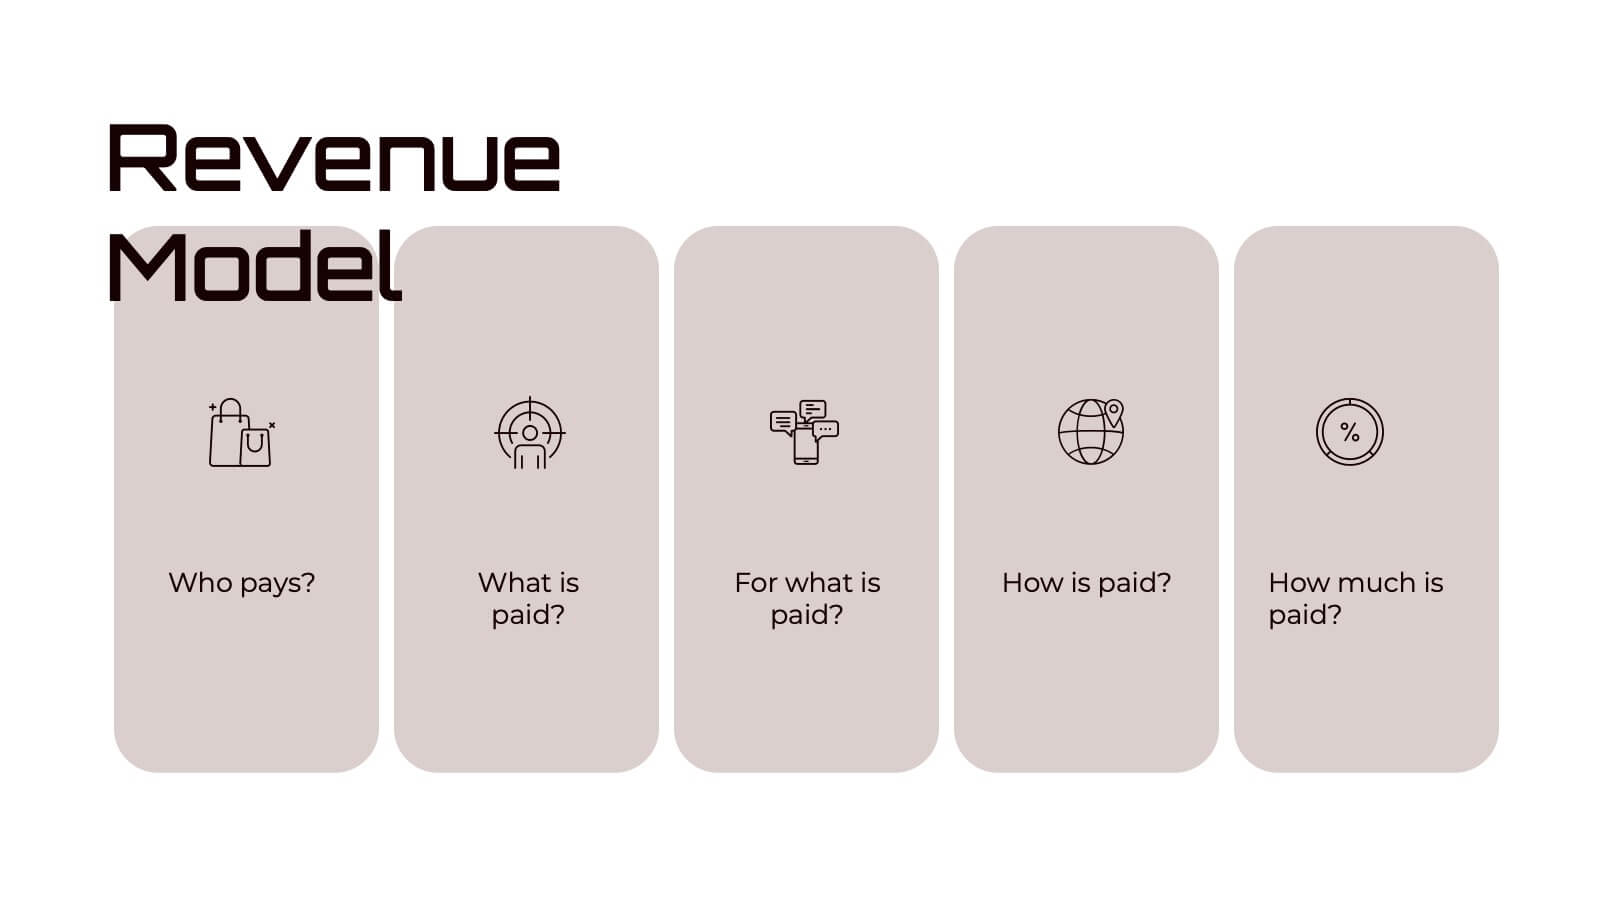
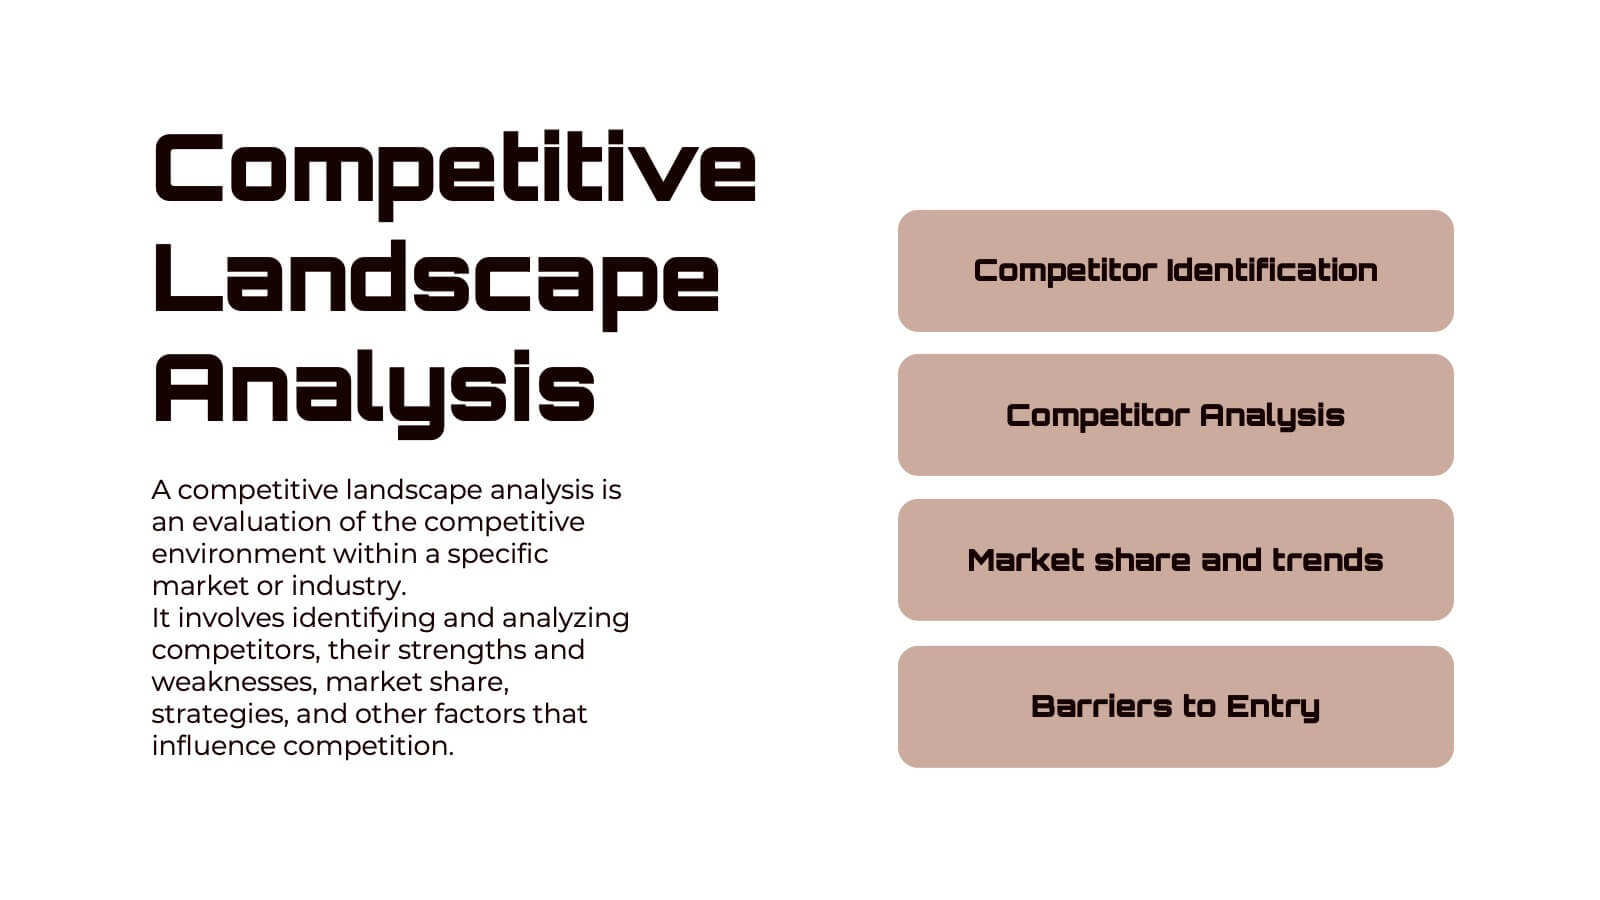
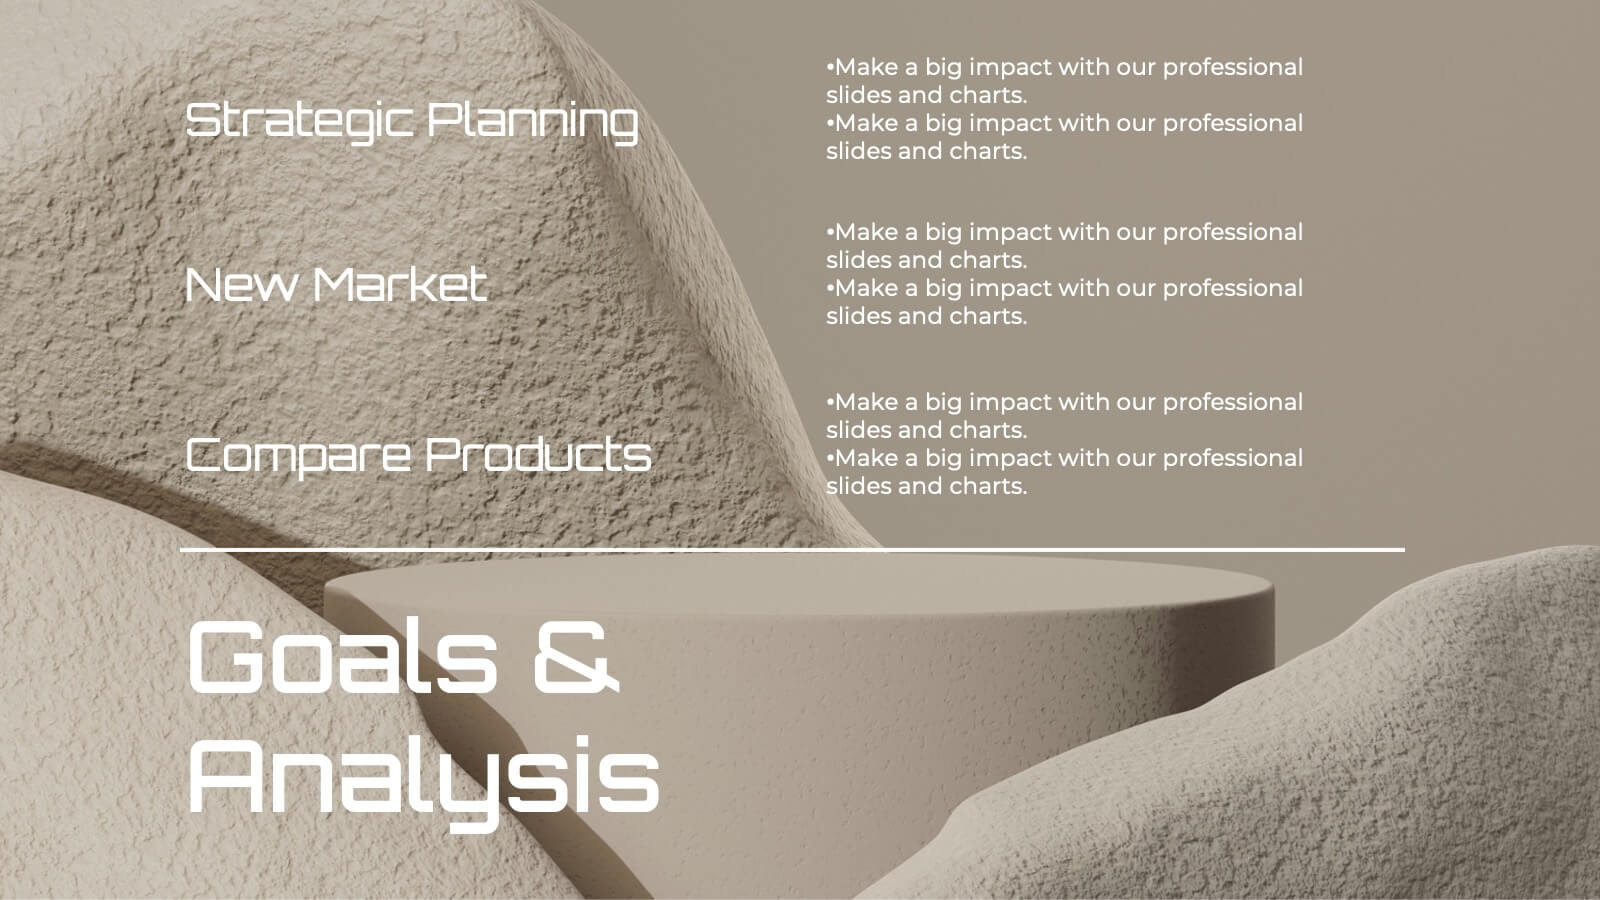
Features
- 5 Unique slides
- Fully editable and easy to edit in Microsoft Powerpoint, Keynote and Google Slides
- 16:9 widescreen layout
- Clean and professional designs
- Export to JPG, PDF or send by email


Do you have any questions?
Recommend


10 slides
Brain Function Infographic Presentation
Explore cognitive processes with the Brain Function Infographic. Featuring a layered human head design, this visual template highlights four key functions, making it ideal for psychology, neuroscience, and decision-making presentations. Fully customizable with editable colors, text, and icons. Compatible with PowerPoint, Keynote, and Google Slides for seamless presentation use.


26 slides
Blockchain for Businesses Presentation
Navigate the world of decentralized technology with our Blockchain for Businesses presentation template, compatible with PowerPoint, Keynote, and Google Slides. Tailored for business leaders, tech entrepreneurs, and financial experts, this template is a gateway to understanding blockchain's impact on the corporate landscape. Our template demystifies blockchain, presenting its core concepts and applications in business, from enhancing security to streamlining transactions. It provides a visual narrative to explain how blockchain can be a game-changer in various industries by fostering transparency, efficiency, and trust. With customizable diagrams, charts, and case studies, you can illustrate the practical benefits of blockchain integration in business operations. This template is SEO-optimized to reach audiences interested in leveraging blockchain technology for competitive advantage. Use our template to educate your audience about the strategic implementation of blockchain and position your business at the forefront of technological innovation.


10 slides
Business Performance Metrics Presentation
Track and display your business metrics effectively with the "Business Performance Metrics" presentation templates. These visually engaging slides are designed to help you present key performance indicators in a clear and structured manner, enhancing understanding and decision-making. Ideal for corporate presentations, these templates are fully compatible with PowerPoint, Keynote, and Google Slides, ensuring seamless integration into your workflow.


5 slides
Geographic Distribution Heat Map Layout Presentation
Visualize regional trends at a glance with the Geographic Distribution Heat Map Layout Presentation. This template helps you showcase location-based performance, market presence, or demographic data across the U.S. using a clean gradient heat map. Ideal for sales reports, marketing reach, or expansion strategies. Fully editable in Canva, PowerPoint, Keynote, and Google Slides.


22 slides
Pearl Product Launch Pitch Deck Presentation
Make your product launch shine with this sleek, pearl-inspired presentation! Perfect for pitching your product’s unique value, market positioning, and growth potential, this template is designed to captivate investors and stakeholders. Its elegant, minimalist layout keeps your message front and center. Compatible with PowerPoint, Keynote, and Google Slides.


5 slides
Business Problem Statement Presentation
Clarify challenges and drive solutions with this business problem statement template! Designed for strategic planning, this structured layout helps you define key issues, analyze root causes, and communicate insights effectively. Ideal for business leaders, consultants, and project managers. Fully customizable and compatible with PowerPoint, Keynote, and Google Slides for seamless use.


26 slides
Linear Technology Presentation
Cyberspace is the realm of digital information that can be accessed, shared, and stored using electronic devices. Focus on the future of technology with this template! This presentation's linear design will put your ideas front-and-center. This design is high-tech the theme colors and icons are sure to make an inspiring first impression on your audience. This can be used for business presentations, academic projects and conferences. This template consists of 26 slides that will bring your ideas to the next level by putting emphasis on key points and keeping your ideas concise and organized.


5 slides
Statistical Insights for Business Growth Presentation
Showcase key business statistics with impact using this radial chart-style presentation slide. Ideal for visualizing growth percentages, progress tracking, or survey results, this design helps break down five distinct insights with matching callouts. Perfect for analytics reports, performance dashboards, and stakeholder updates. Fully customizable in PowerPoint, Keynote, and Google Slides.


21 slides
Inventra Creative Portfolio Presentation
Make a lasting impression with this sleek and modern creative portfolio presentation template. Perfect for showcasing your artistic journey, featured projects, unique style, and client testimonials. Highlight your creative process, pricing, and services with a bold and professional layout. Fully customizable in PowerPoint, Keynote, and Google Slides.


26 slides
E-commerce Presentation
Venture into the digital marketplace with a presentation template that embodies the innovative spirit of e-commerce. This template, with its vibrant colors and modern design elements, is tailored to highlight the fast-paced world of online retail. The slides offer a digital storefront for your ideas, from introducing the creative minds behind the operation to showcasing the latest trends in online shopping. Utilize engaging layouts to compare products, outline sales strategies, or highlight consumer behavior with clear, concise infographics. With promotional slide options to announce special deals and a design that captures the convenience and excitement of shopping with a click, this collection is an essential tool for marketers, online retailers, and startups. It’s optimized for conveying complex data in a user-friendly format, ensuring your audience stays engaged and informed. Compatible with PowerPoint, Keynote, and Google Slides, it’s the perfect cart to carry your message in the bustling online marketplace.


3 slides
Agriculture Sector Insights Presentation
Bring data to life with a presentation that captures the essence of growth and sustainability. Ideal for showcasing trends, production metrics, or environmental insights, this design blends visual storytelling with professional clarity. Fully editable and compatible with PowerPoint, Keynote, and Google Slides for effortless customization and impactful delivery.


5 slides
Customer Inquiry and Response Strategy Presentation
Streamline your communication flow with this step-by-step layout ideal for showcasing inquiry handling processes, customer service touchpoints, or lead response timelines. The linear design includes five fully editable stages with icons and text areas to clarify each phase of your strategy. Perfect for CRM teams, sales ops, and client support leaders. Fully customizable in PowerPoint, Keynote, and Google Slides.


10 slides
Concept Mapping with Bubble Map
Break down complex ideas into visual clusters with this hexagon-style concept mapping template. Designed to organize information into thematic groups, it's ideal for brainstorming, mind mapping, or presenting strategies and workflows. Each section uses color-coded bubble maps for easy navigation. Fully editable in PowerPoint, Keynote, and Google Slides.


6 slides
Customer Journey Map Presentation
Visualize the customer experience step-by-step with the Customer Journey Map Presentation. This sleek infographic helps you outline key touchpoints from awareness to post-purchase, making it ideal for marketing strategies, service design, or UX presentations. Fully editable and compatible with PowerPoint, Keynote, and Google Slides.


10 slides
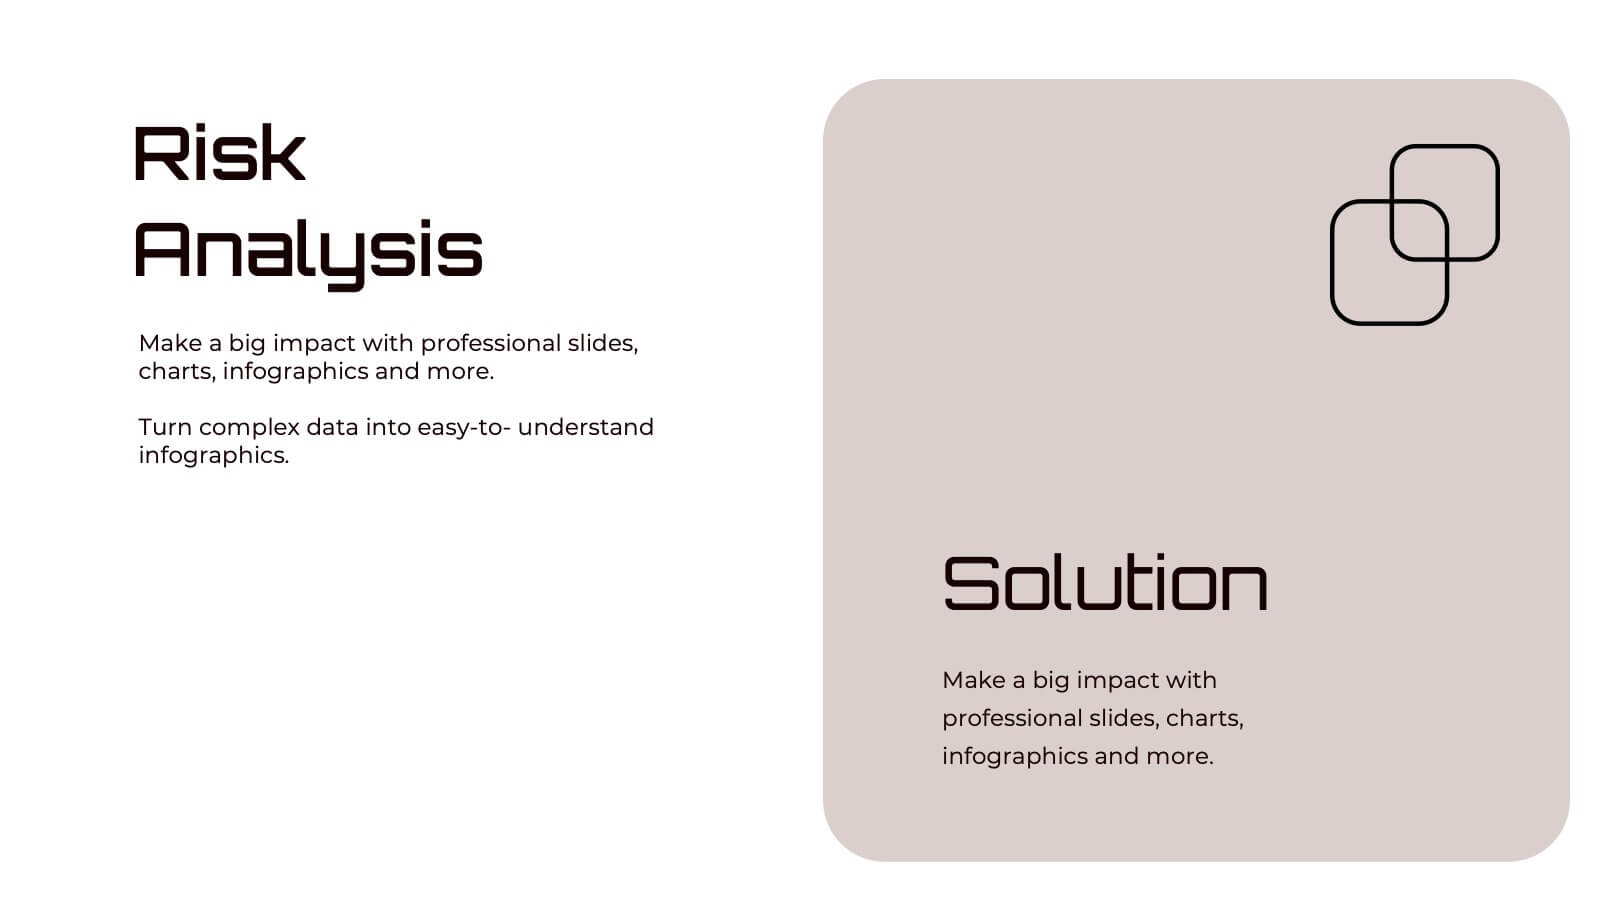
Corporate Risk Assessment Framework
Clearly outline your organization’s safety strategy with this structured hierarchy of controls slide. Featuring five progressive risk control methods—Elimination, Substitution, Engineering, Administrative, and PPE—this template is perfect for safety training, compliance briefings, and risk audits. Compatible with PowerPoint, Keynote, and Google Slides.


4 slides
Real Estate Market Trends
Present housing data and property growth insights with this ascending building chart layout. Perfect for realtors, investors, and market analysts, this template helps visualize real estate performance over time. Fully editable in PowerPoint, Keynote, and Google Slides.


7 slides
Executive Summary Business Infographic
Elevate your executive insights with our meticulously crafted executive summary infographic. Drenched in the professionalism of blue tones and accented by the prestige of gold, our template encapsulates key findings and top-tier decisions in a comprehensive yet concise manner. Enriched with pinpoint infographics, emblematic icons, and relevant image placeholders, it conveys essential details with precision. Perfectly honed for Powerpoint, Keynote, or Google Slides. An indispensable resource for business leaders, managers, and analysts seeking to distill complex information into actionable insights. Present with authority; let every slide underscore pivotal decisions.