


Features
- 8 Unique slides
- Fully editable and easy to edit in Microsoft Powerpoint, Keynote and Google Slides
- 16:9 widescreen layout
- Clean and professional designs
- Export to JPG, PDF or send by email


Do you have any questions?
Recommend


4 slides
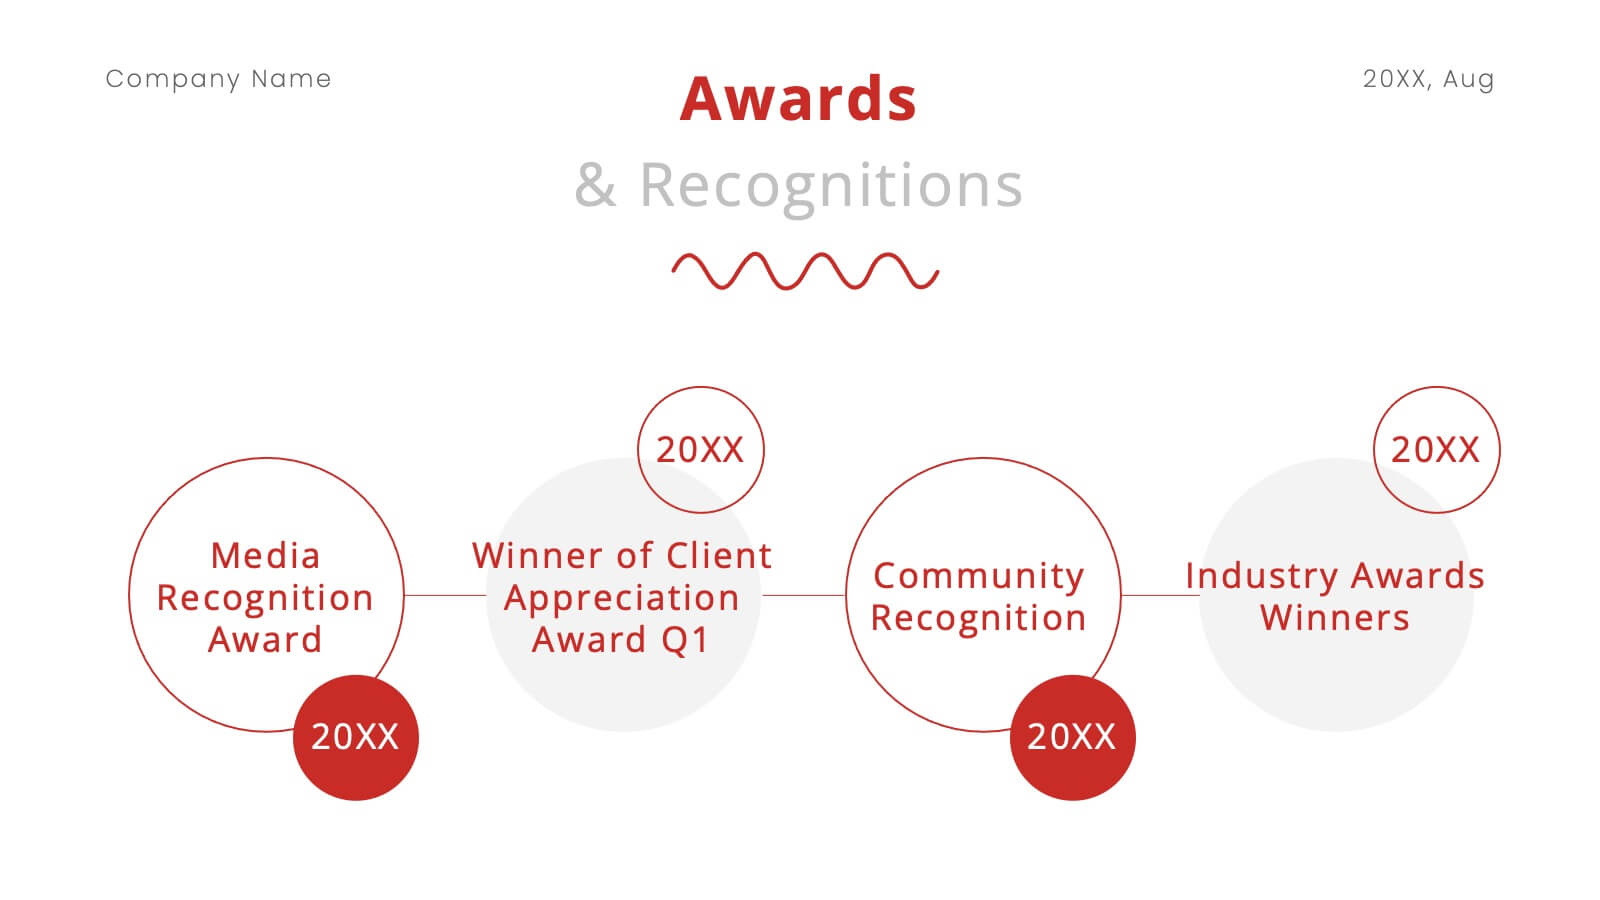
Historical Event Timeline Presentation
Visualize your timeline with this Historical Event layout, ideal for showcasing progress, milestones, or key moments over time. Featuring a horizontal design with date markers and icons, it’s perfect for history, education, or project recaps. Fully editable in PowerPoint, Keynote, and Google Slides to match your content and branding.


5 slides
Company History and Growth Timeline Presentation
Present your milestones with clarity using the Company History and Growth Timeline presentation. Ideal for startups, enterprises, and project retrospectives, this timeline layout helps you highlight key achievements, growth phases, and expansion years in a visually structured format. With modern design elements, editable text fields, and dynamic year markers, it's perfect for telling your brand story or progress journey. Fully compatible with PowerPoint, Keynote, and Google Slides.


12 slides
Business Networking Strategy
Showcase your connection-building roadmap with this hexagonal Business Networking Strategy template. Ideal for illustrating partnerships, key contacts, or collaboration phases, this layout helps structure complex relationships with clarity. Fully customizable in PowerPoint, Keynote, and Google Slides to match your branding and networking objectives.


24 slides
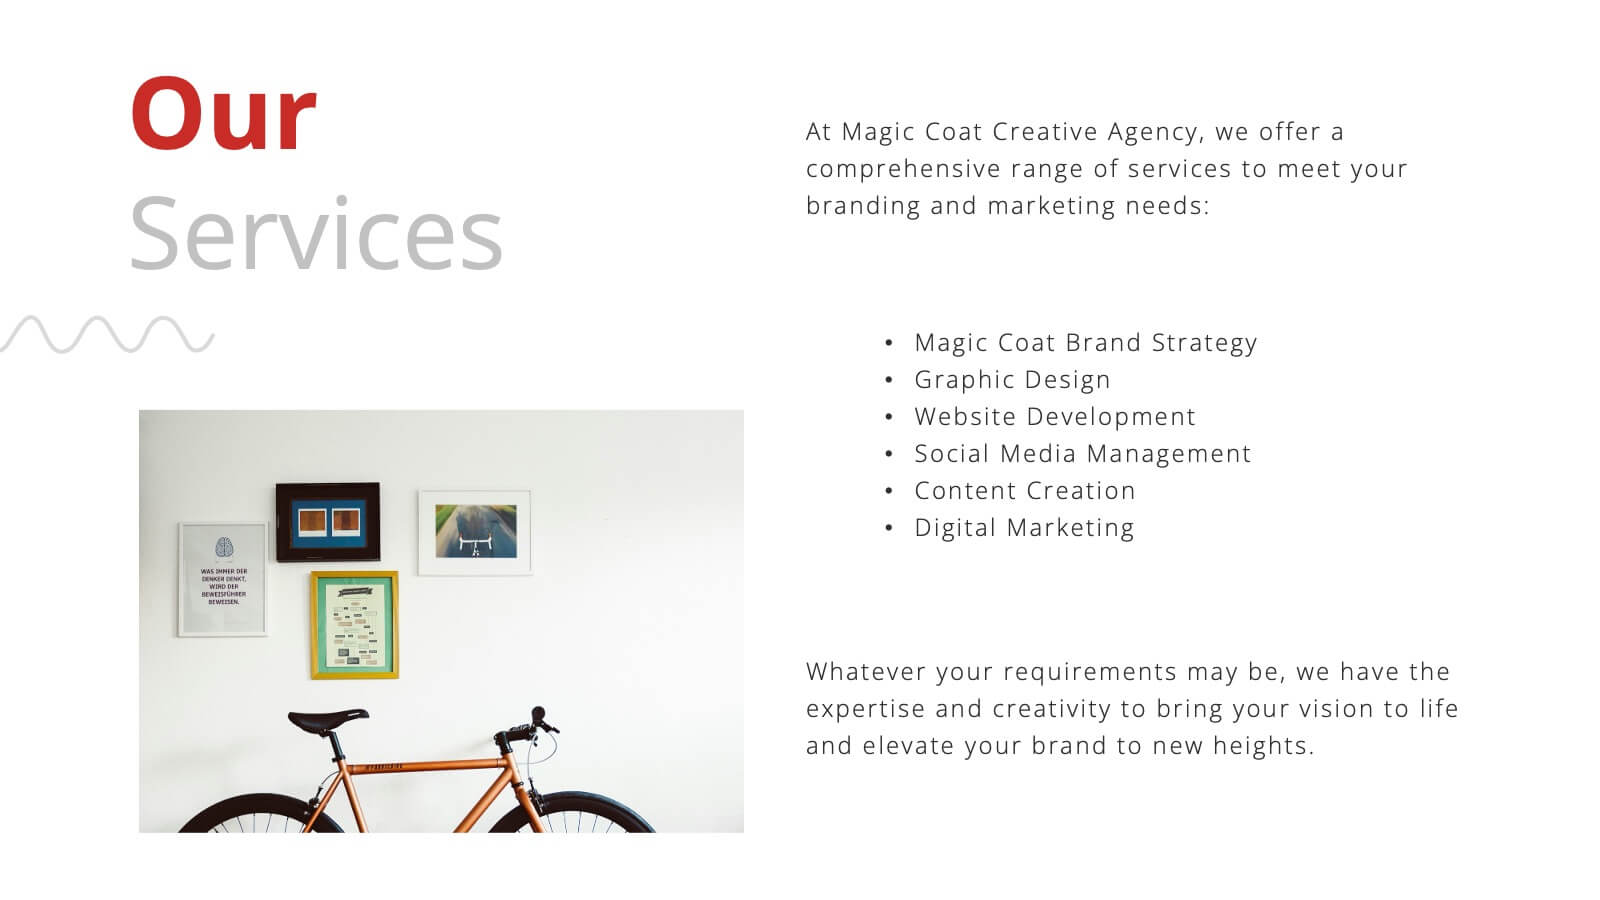
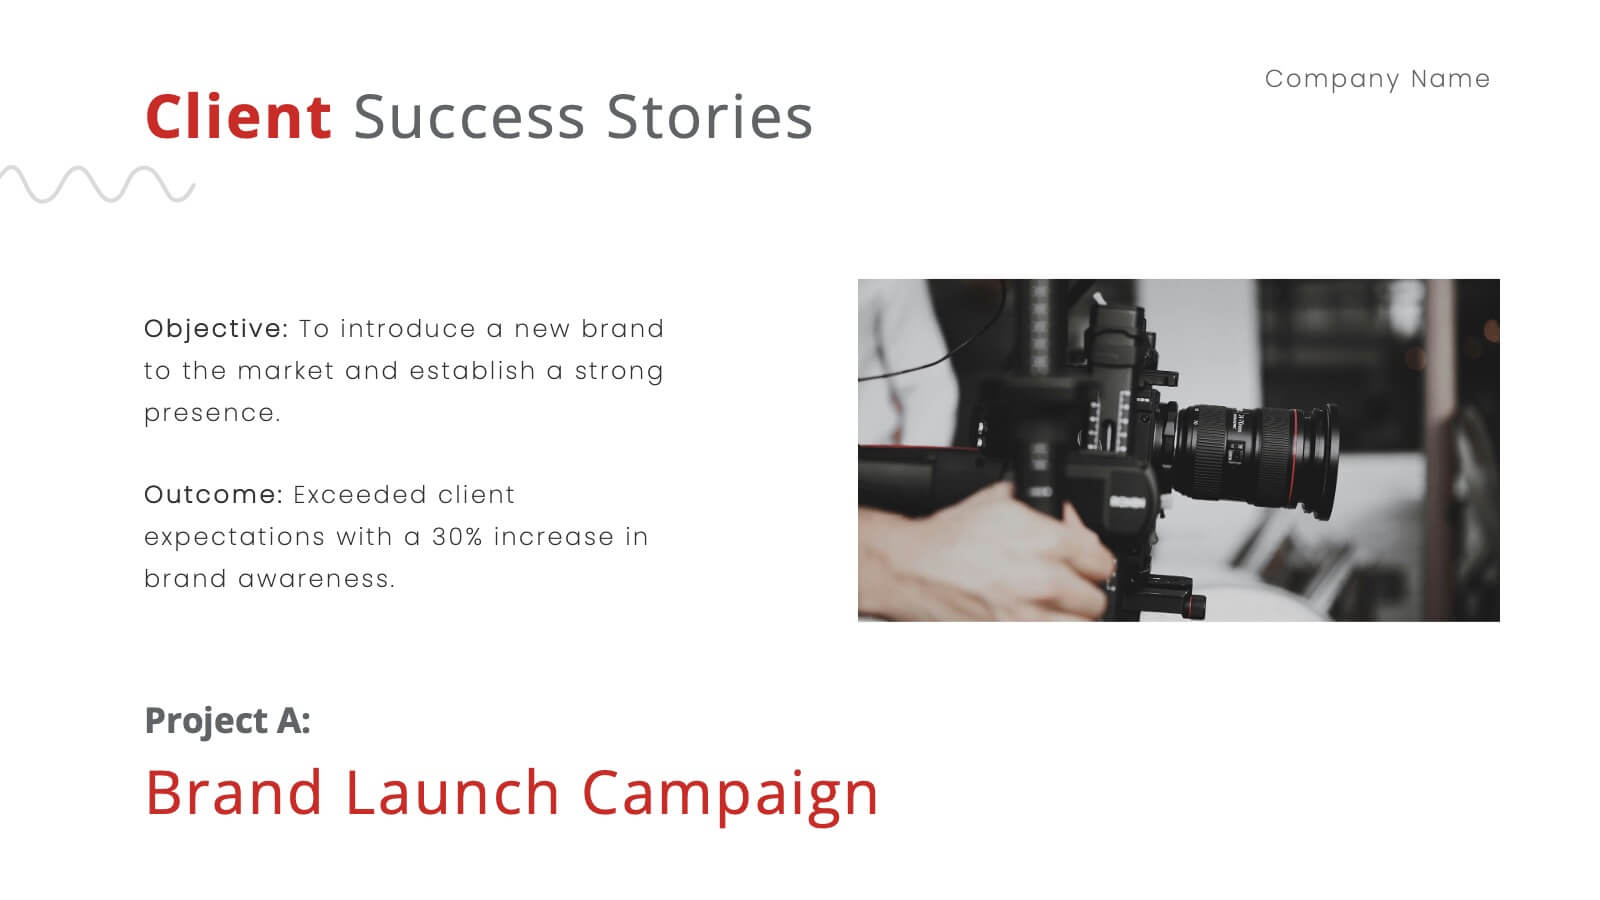
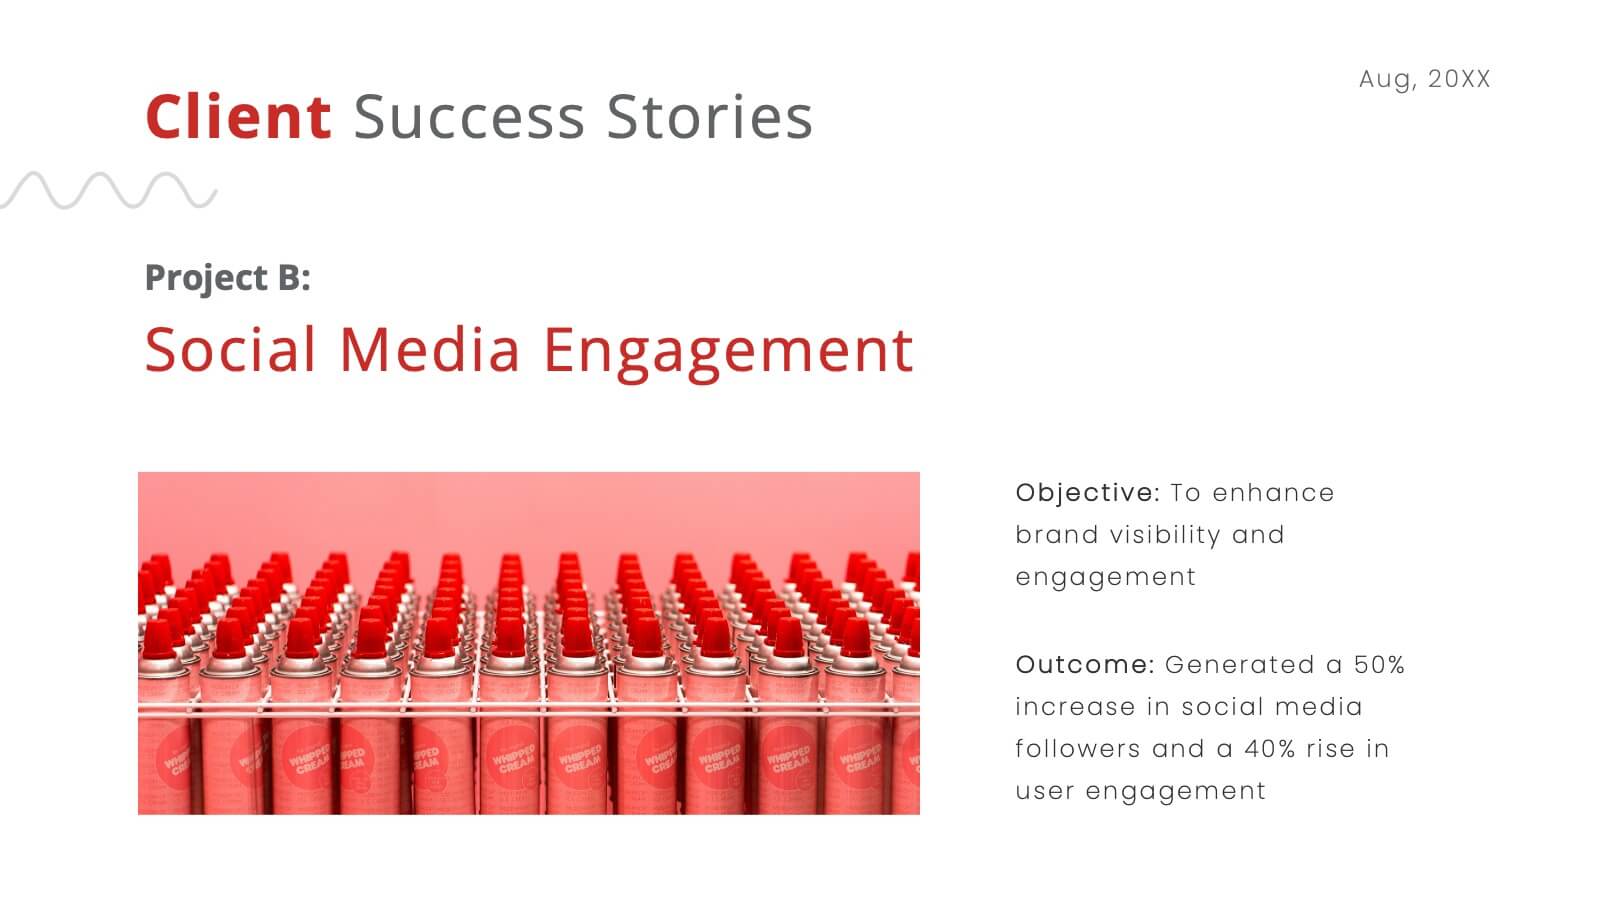
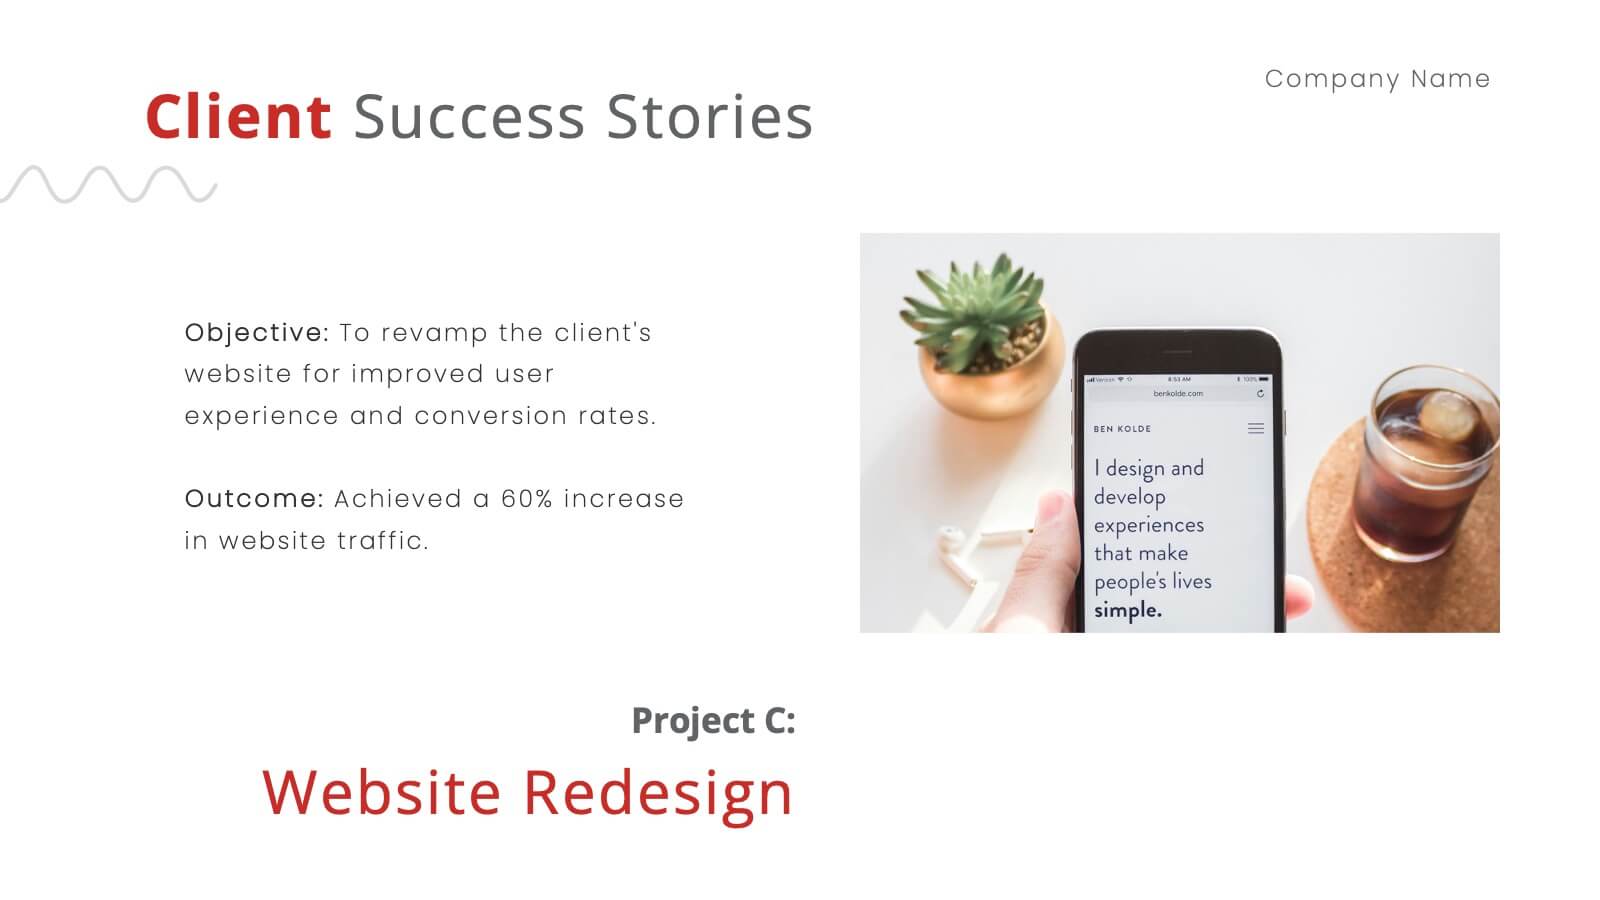
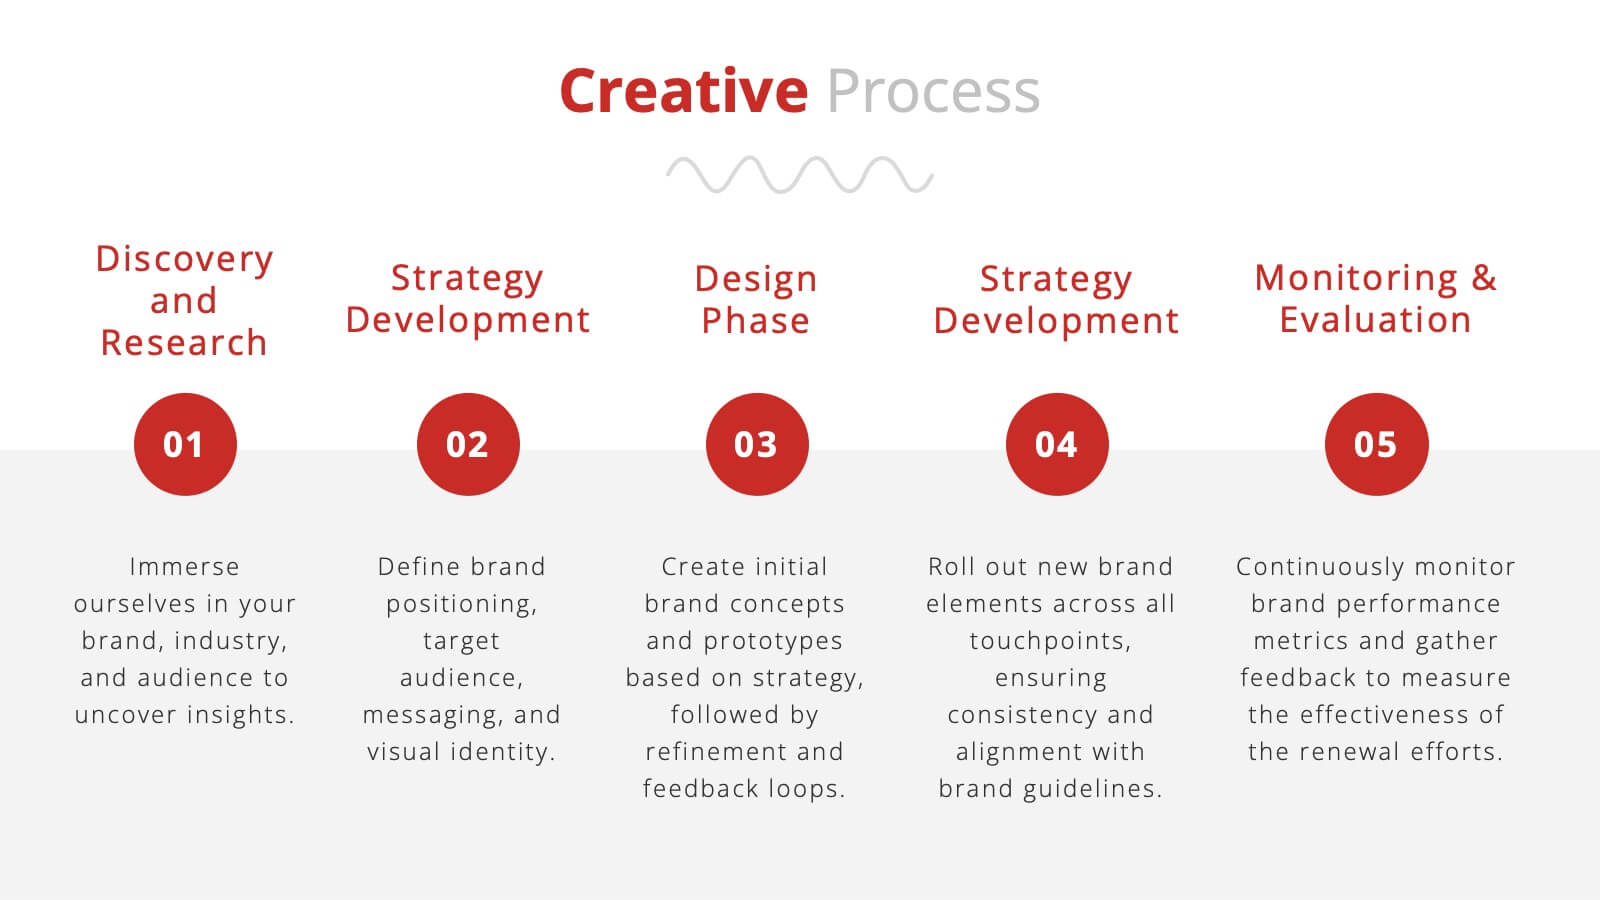
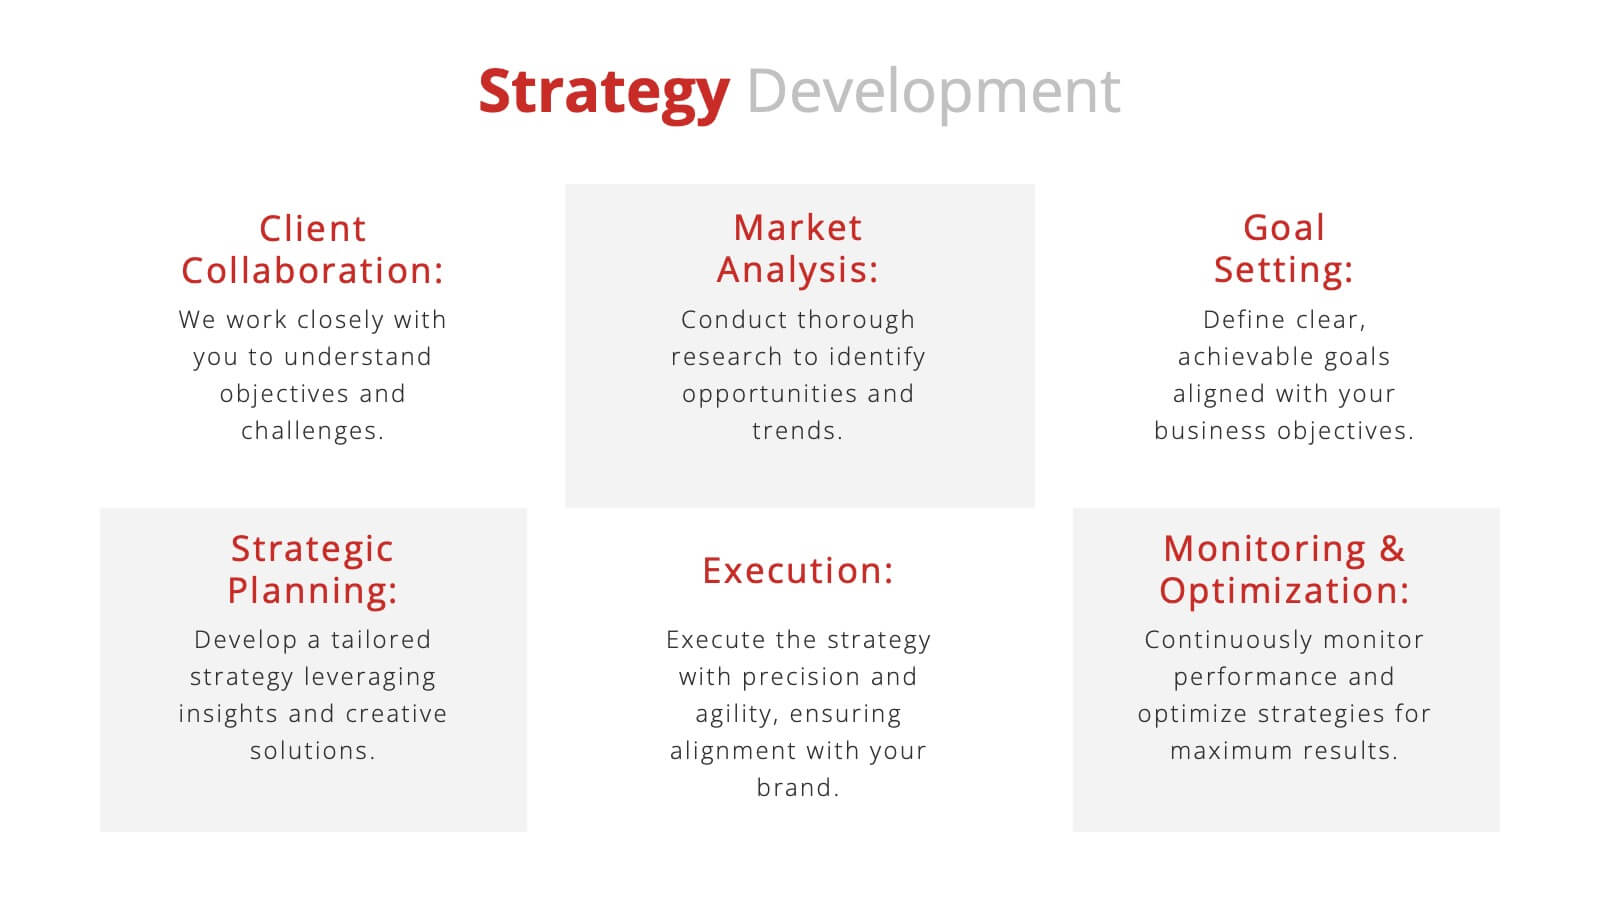
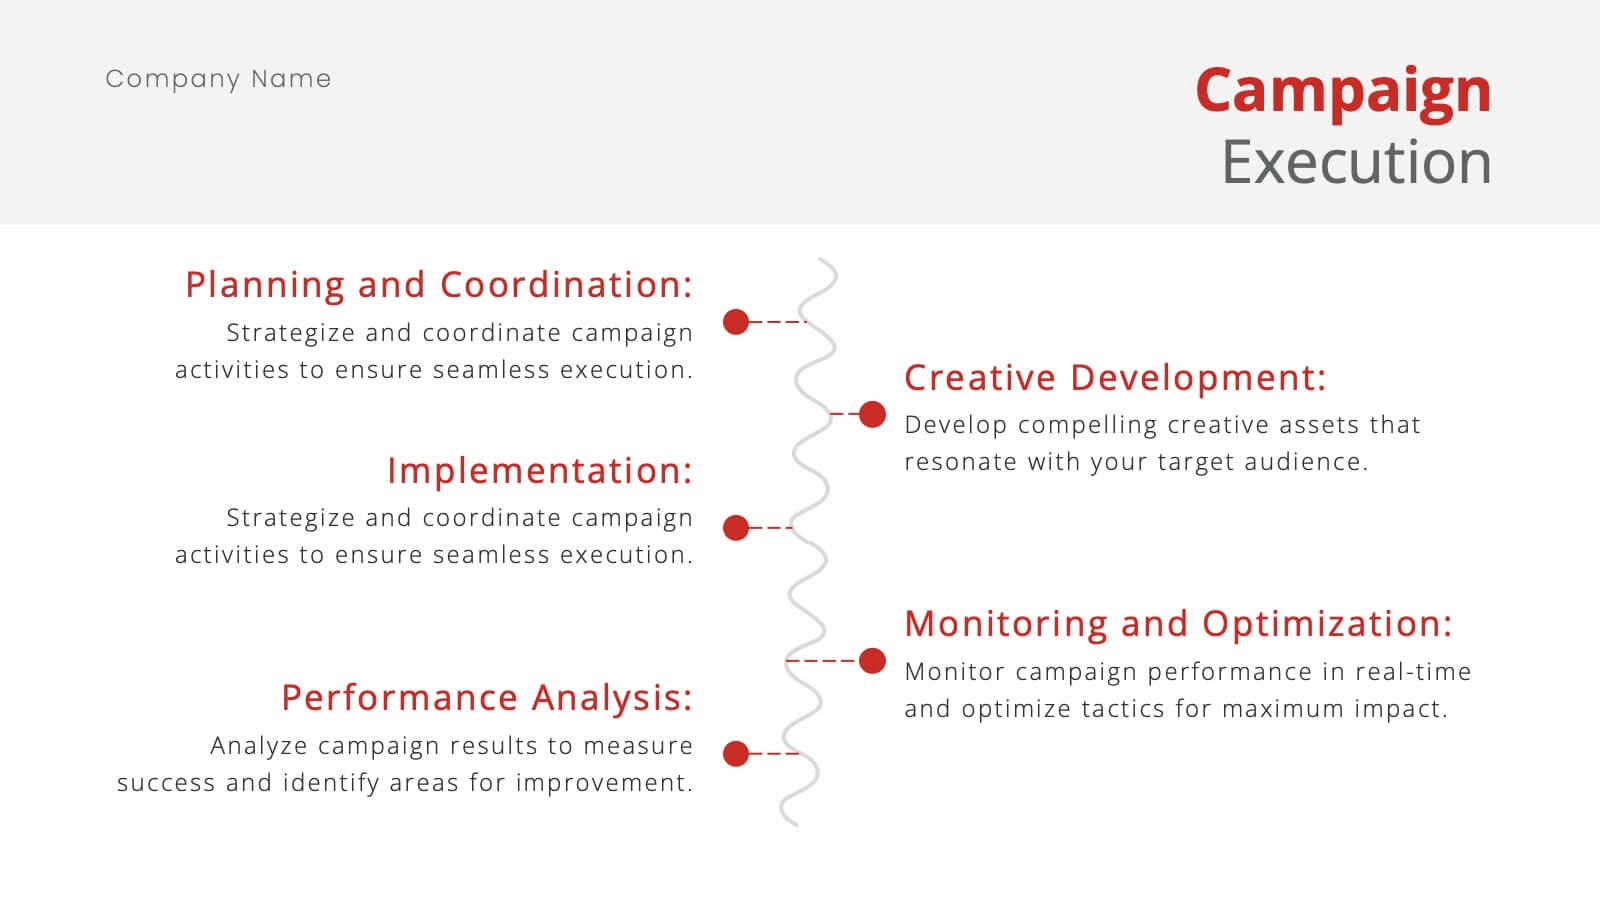
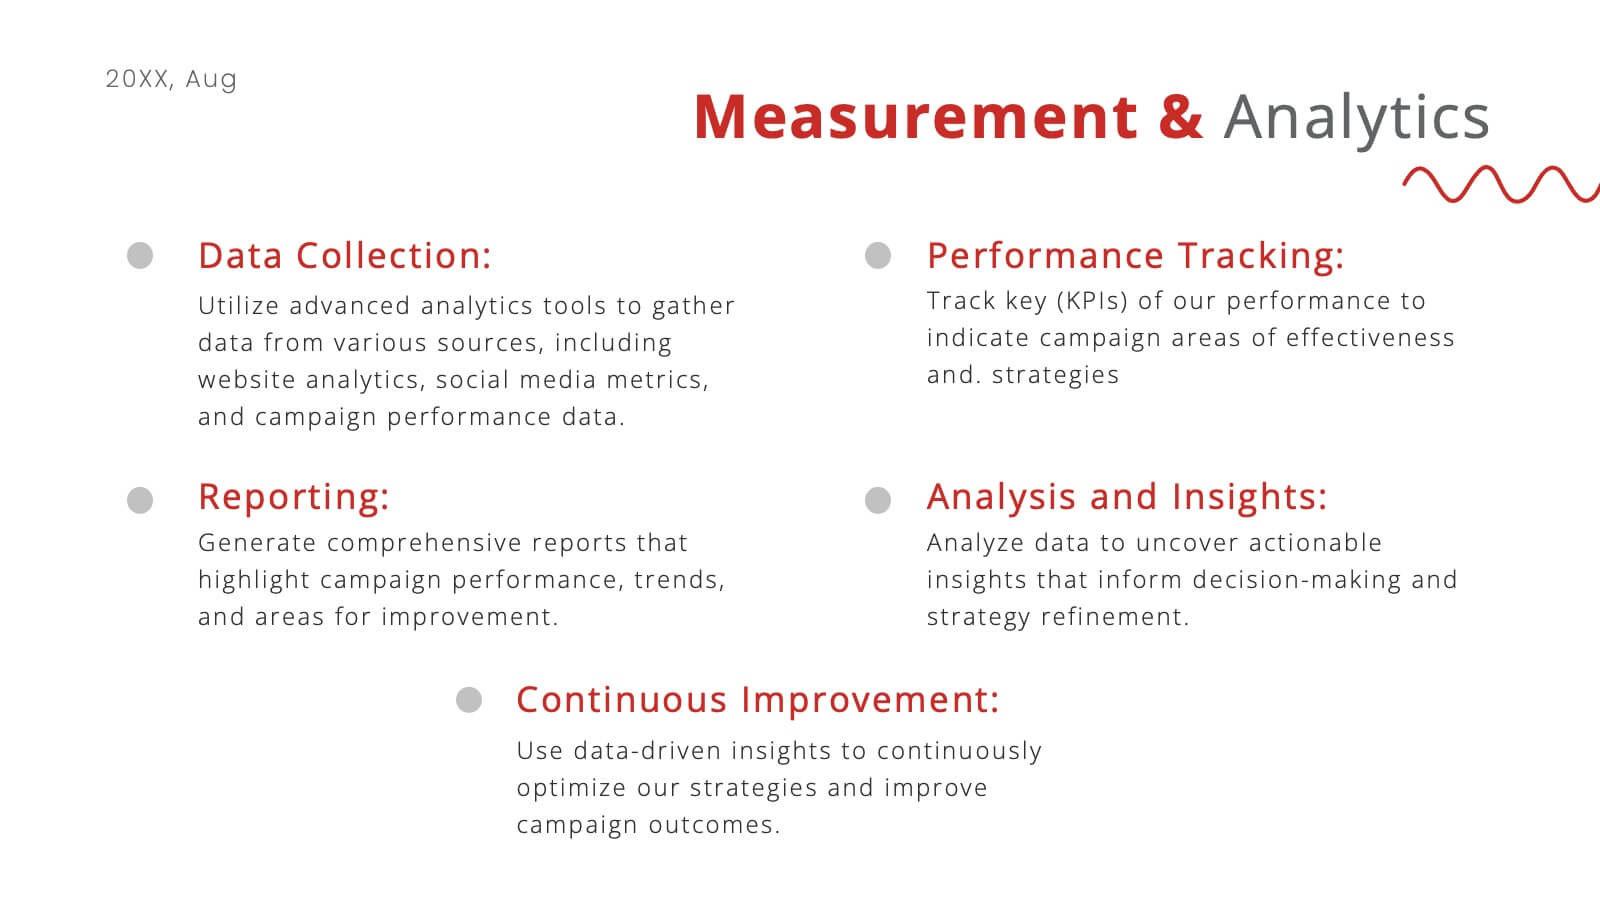
Nickel Advertising Agency Proposal Presentation
Take your advertising agency to the next level with this sleek and modern presentation template! Highlighting your services, team, success stories, and marketing strategies, it’s the perfect tool to showcase your agency’s strengths and capabilities. Fully customizable and compatible with PowerPoint, Keynote, and Google Slides, this template is ideal for impressing potential clients and partners.


4 slides
Business Milestone Roadmap Presentation
Visualize your company's journey with this curved-road milestone infographic. Perfect for tracking key goals, quarterly achievements, or strategic plans, this template uses clear markers along a winding path to emphasize progress and direction. Ideal for business updates, project timelines, or growth strategies. Fully editable in PowerPoint, Keynote, and Google Slides.


6 slides
Creative 3D Elements Slide Presentation
Take your slides from flat to fantastic with this playful 3D layered design! This infographic template is perfect for visualizing multi-step processes, product stacks, or layered strategies in a modern and creative way. It’s fully editable and easy to customize in PowerPoint, Keynote, and Google Slides for any presentation need.


4 slides
Personalized Learning Experience Presentation
Present tailored learning paths with this vibrant personalized education slide. Designed with sticky-note and pin graphics, it's ideal for breaking down individual goals, curriculum customization, or adaptive learning models. Fully editable in PowerPoint, Keynote, and Google Slides—perfect for educators, trainers, and instructional designers seeking clarity and engagement in learning presentations.


6 slides
5-Year Financial Forecast Slide Presentation
Show your long-term growth with a clean, visual touch that makes numbers easy to follow and goals clear to everyone. This modern layout highlights yearly progress using engaging icons and percentage indicators, perfect for financial reports or investor decks. Fully compatible with PowerPoint, Keynote, and Google Slides for seamless editing.


11 slides
Sales Dashboards Infographic
A sales dashboard is a visual representation of sales data and key performance indicators (KPIs) that provides a quick and comprehensive view of a company's sales performance and related metrics. Step into the fast-paced world of sales with our sales dashboards infographic template. It's your compass for charting the course to success in the dynamic realm of sales, providing a visual guide that transforms data into actionable insights. This infographic is designed to to track progress towards sales goals, identify trends, and optimize strategies to improve sales performance. Compatible with Powerpoint, Keynote, and Google Slides.


7 slides
Brain Structure Infographic
Unlock the marvels of the human mind with our brain structure infographic. Resting on a pristine white canvas and enriched by the calming green, profound blue, and enlightening yellow, this template meticulously dissects the intricacies of brain anatomy. Adorned with detailed infographics, illustrative icons, and specific image placeholders, it dives deep into the regions and functions of the brain. Impeccably tailored for Powerpoint, Keynote, or Google Slides. An indispensable resource for neuroscientists, educators, medical students, or anyone with an intrigue for cerebral wonders. Venture with insight; let each slide be your guide through the labyrinth of the human brain.


8 slides
Environmental Impact Reporting Presentation
Showcase sustainability data with clarity using the Environmental Impact Reporting Presentation. Perfect for tracking plastic usage, waste trends, and eco-initiatives. The infographic-style visuals highlight four distinct data points with bold icons and labeled callouts. Fully editable in PowerPoint, Keynote, and Google Slides—ideal for ESG reports, audits, or environmental awareness campaigns.


21 slides
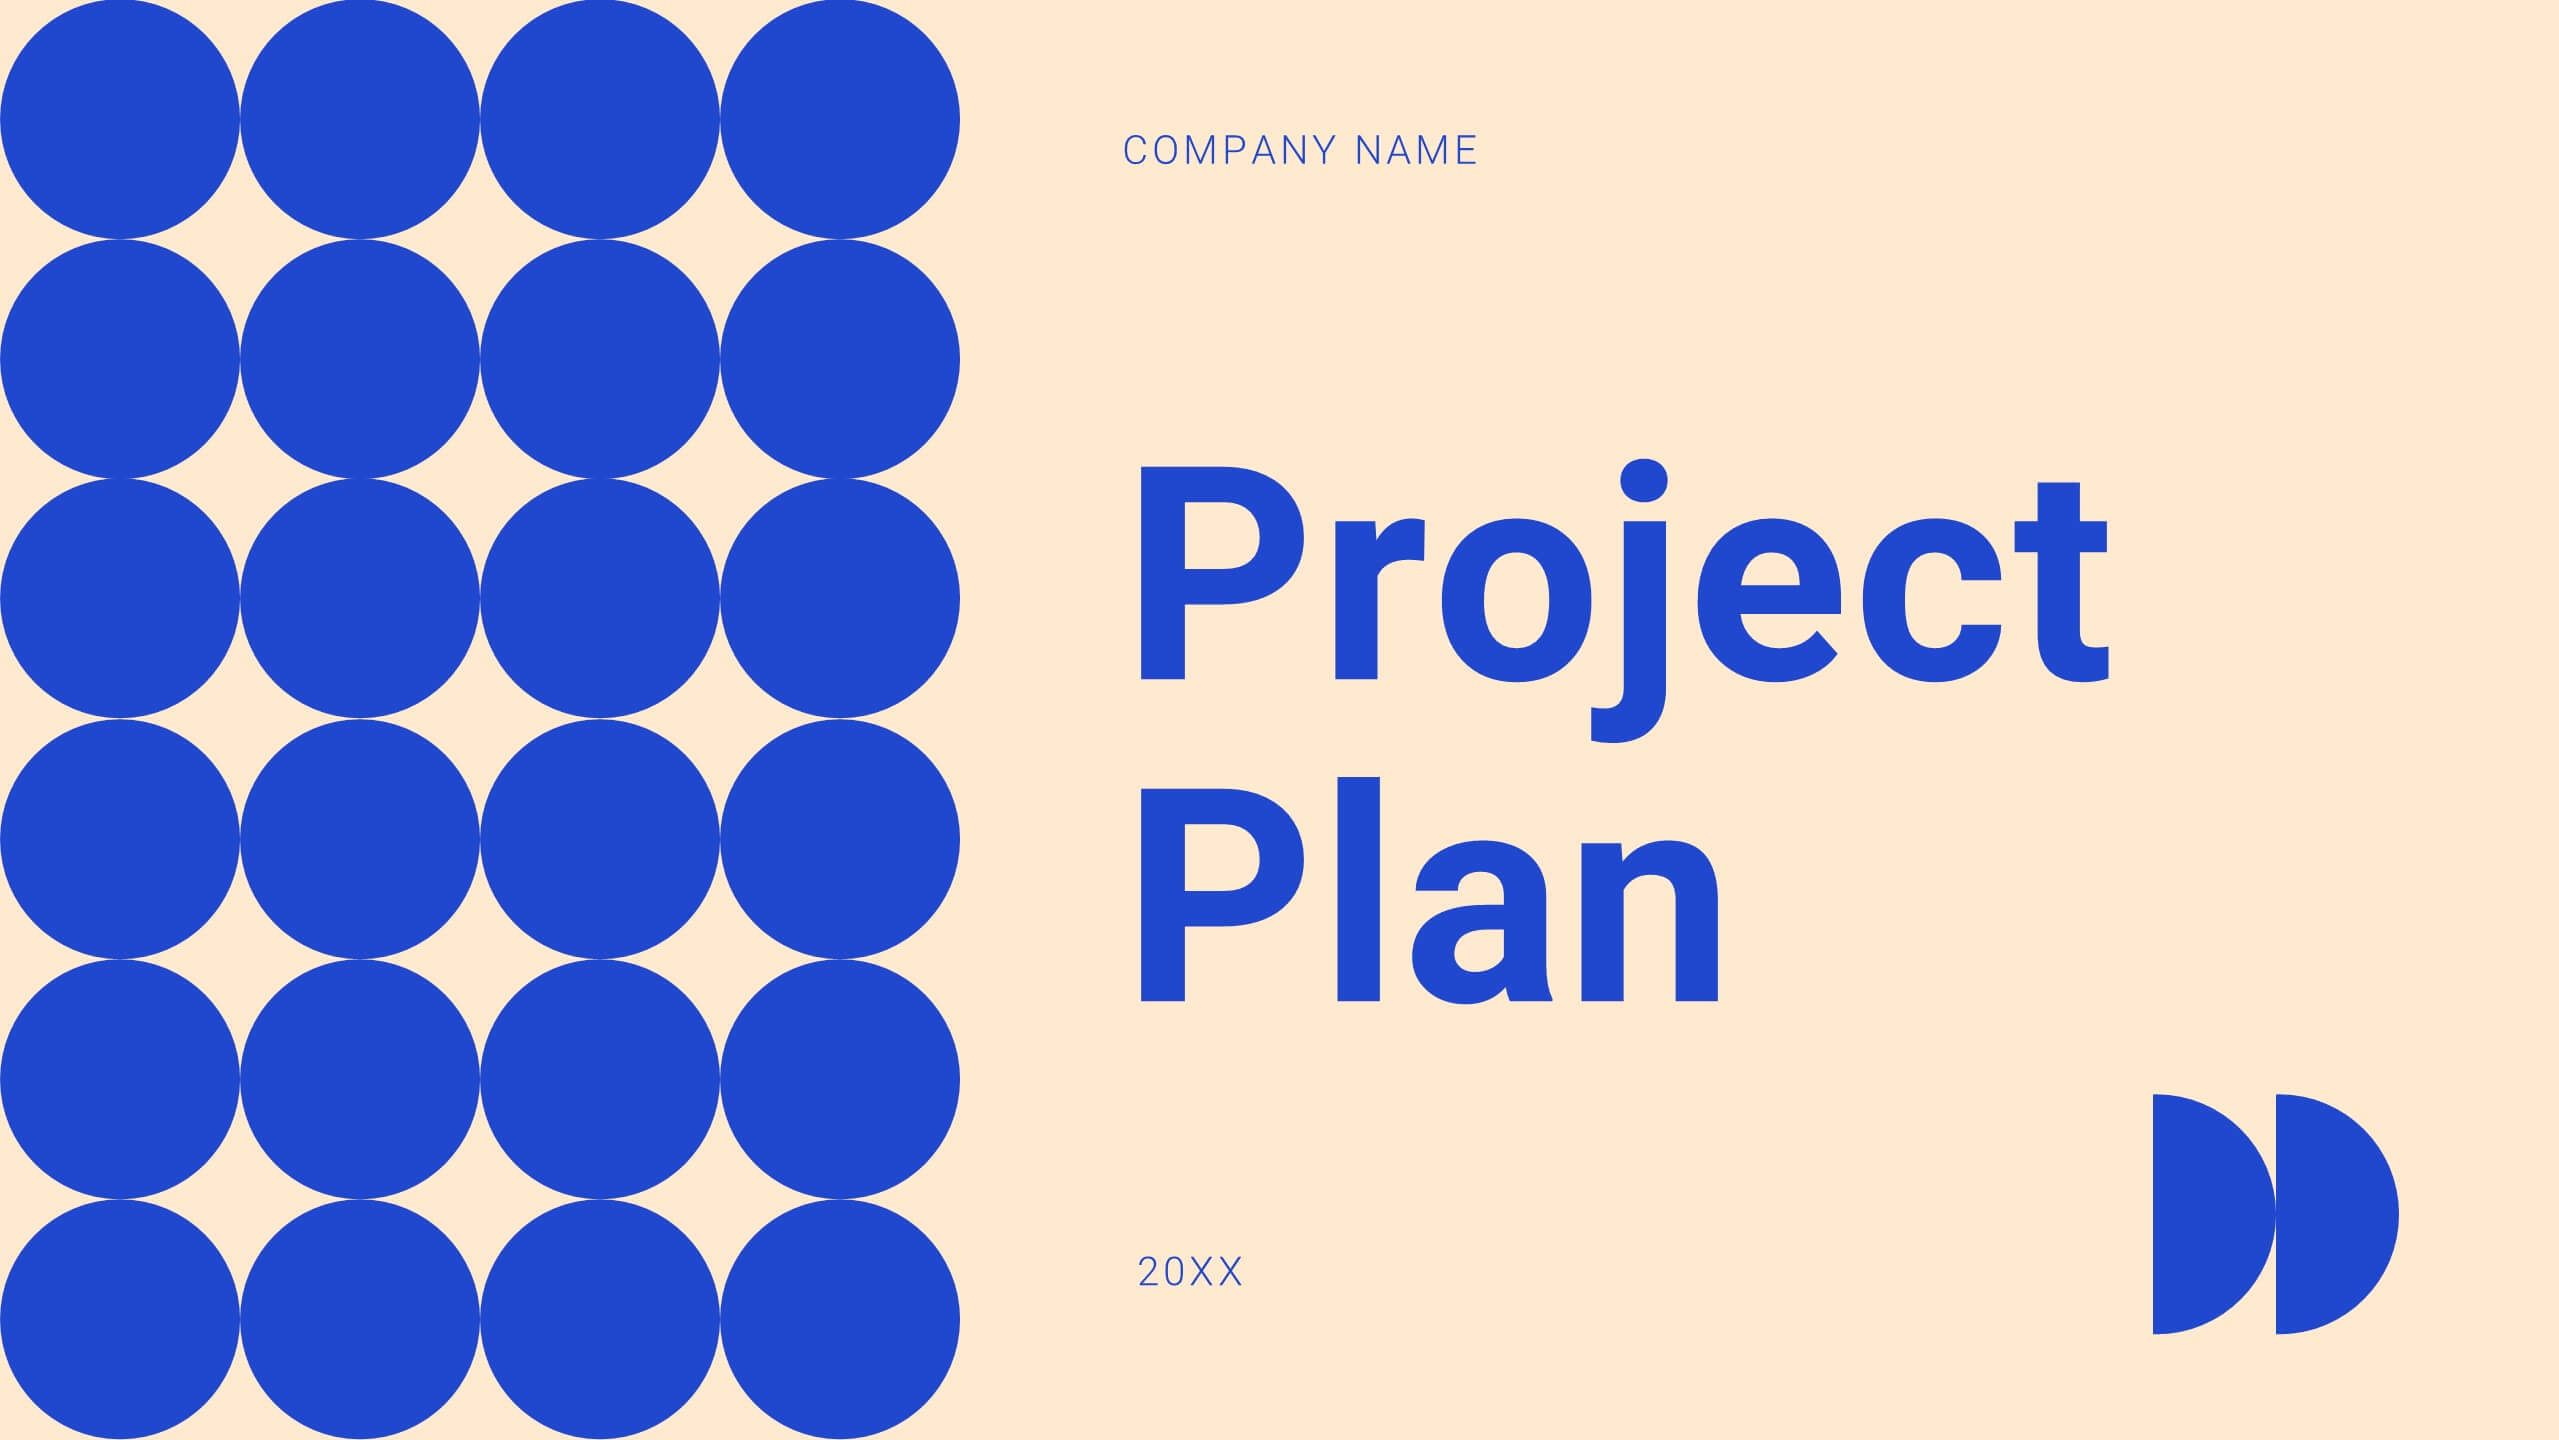
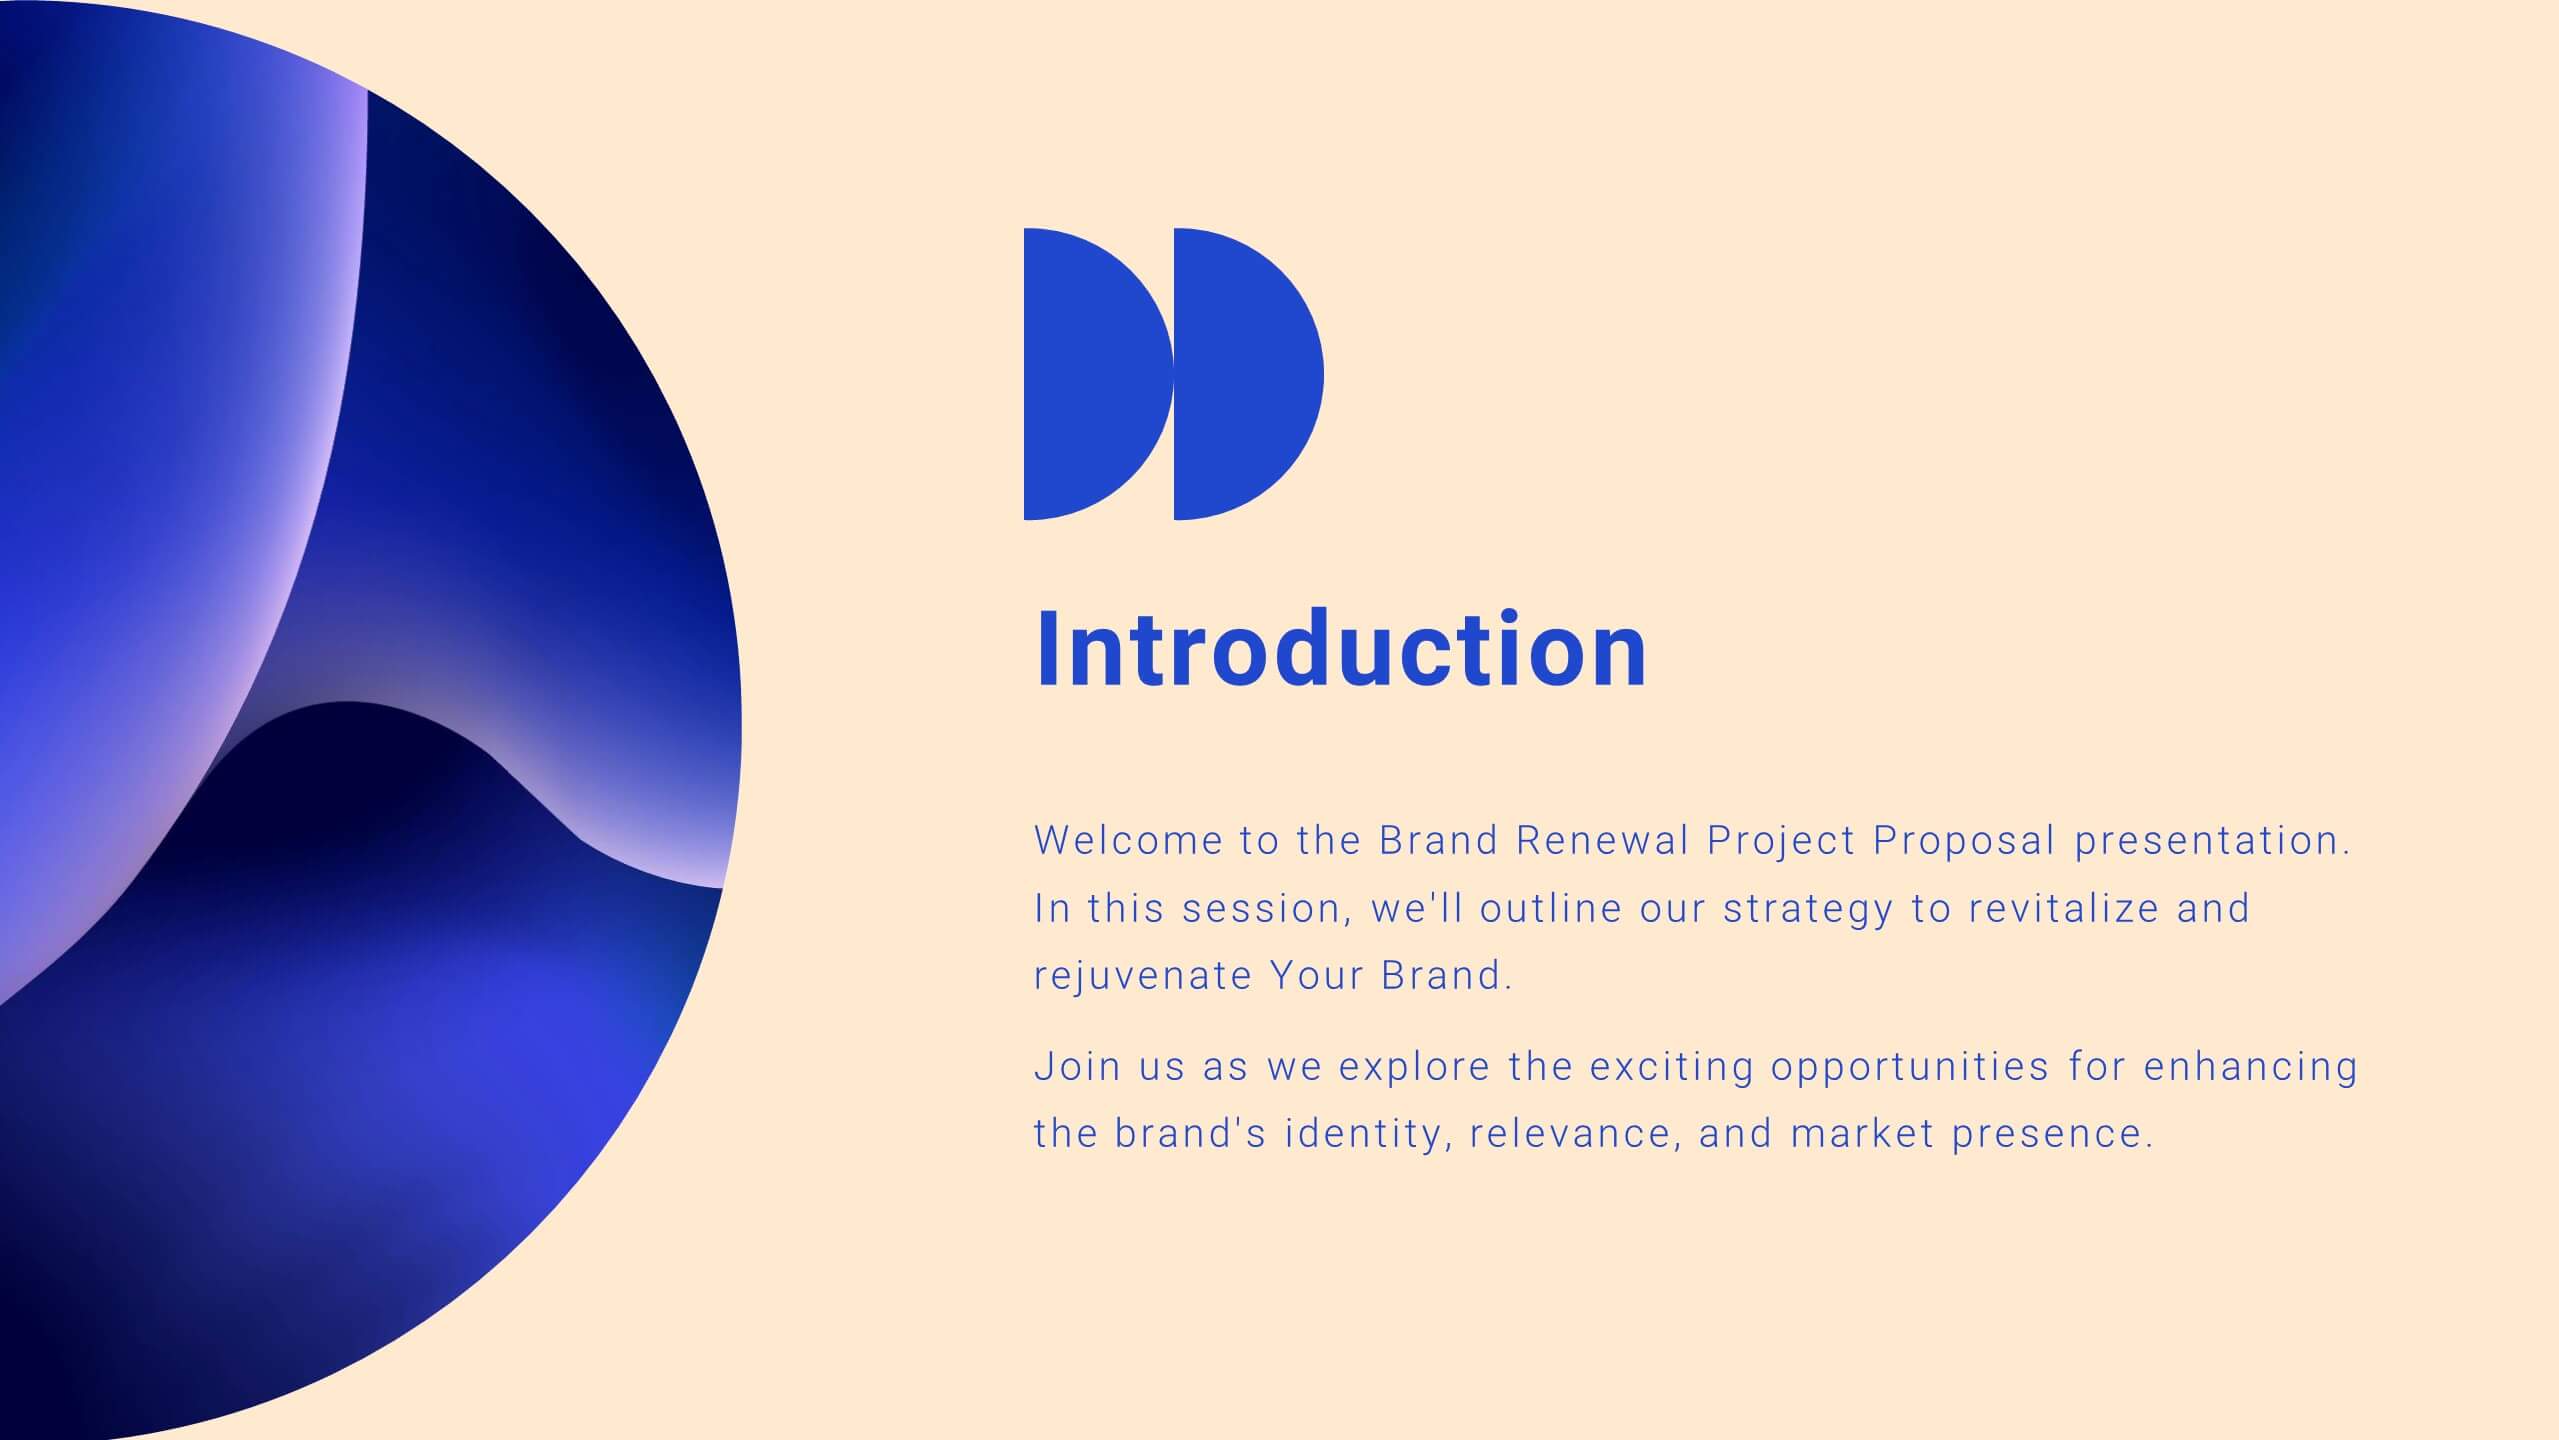
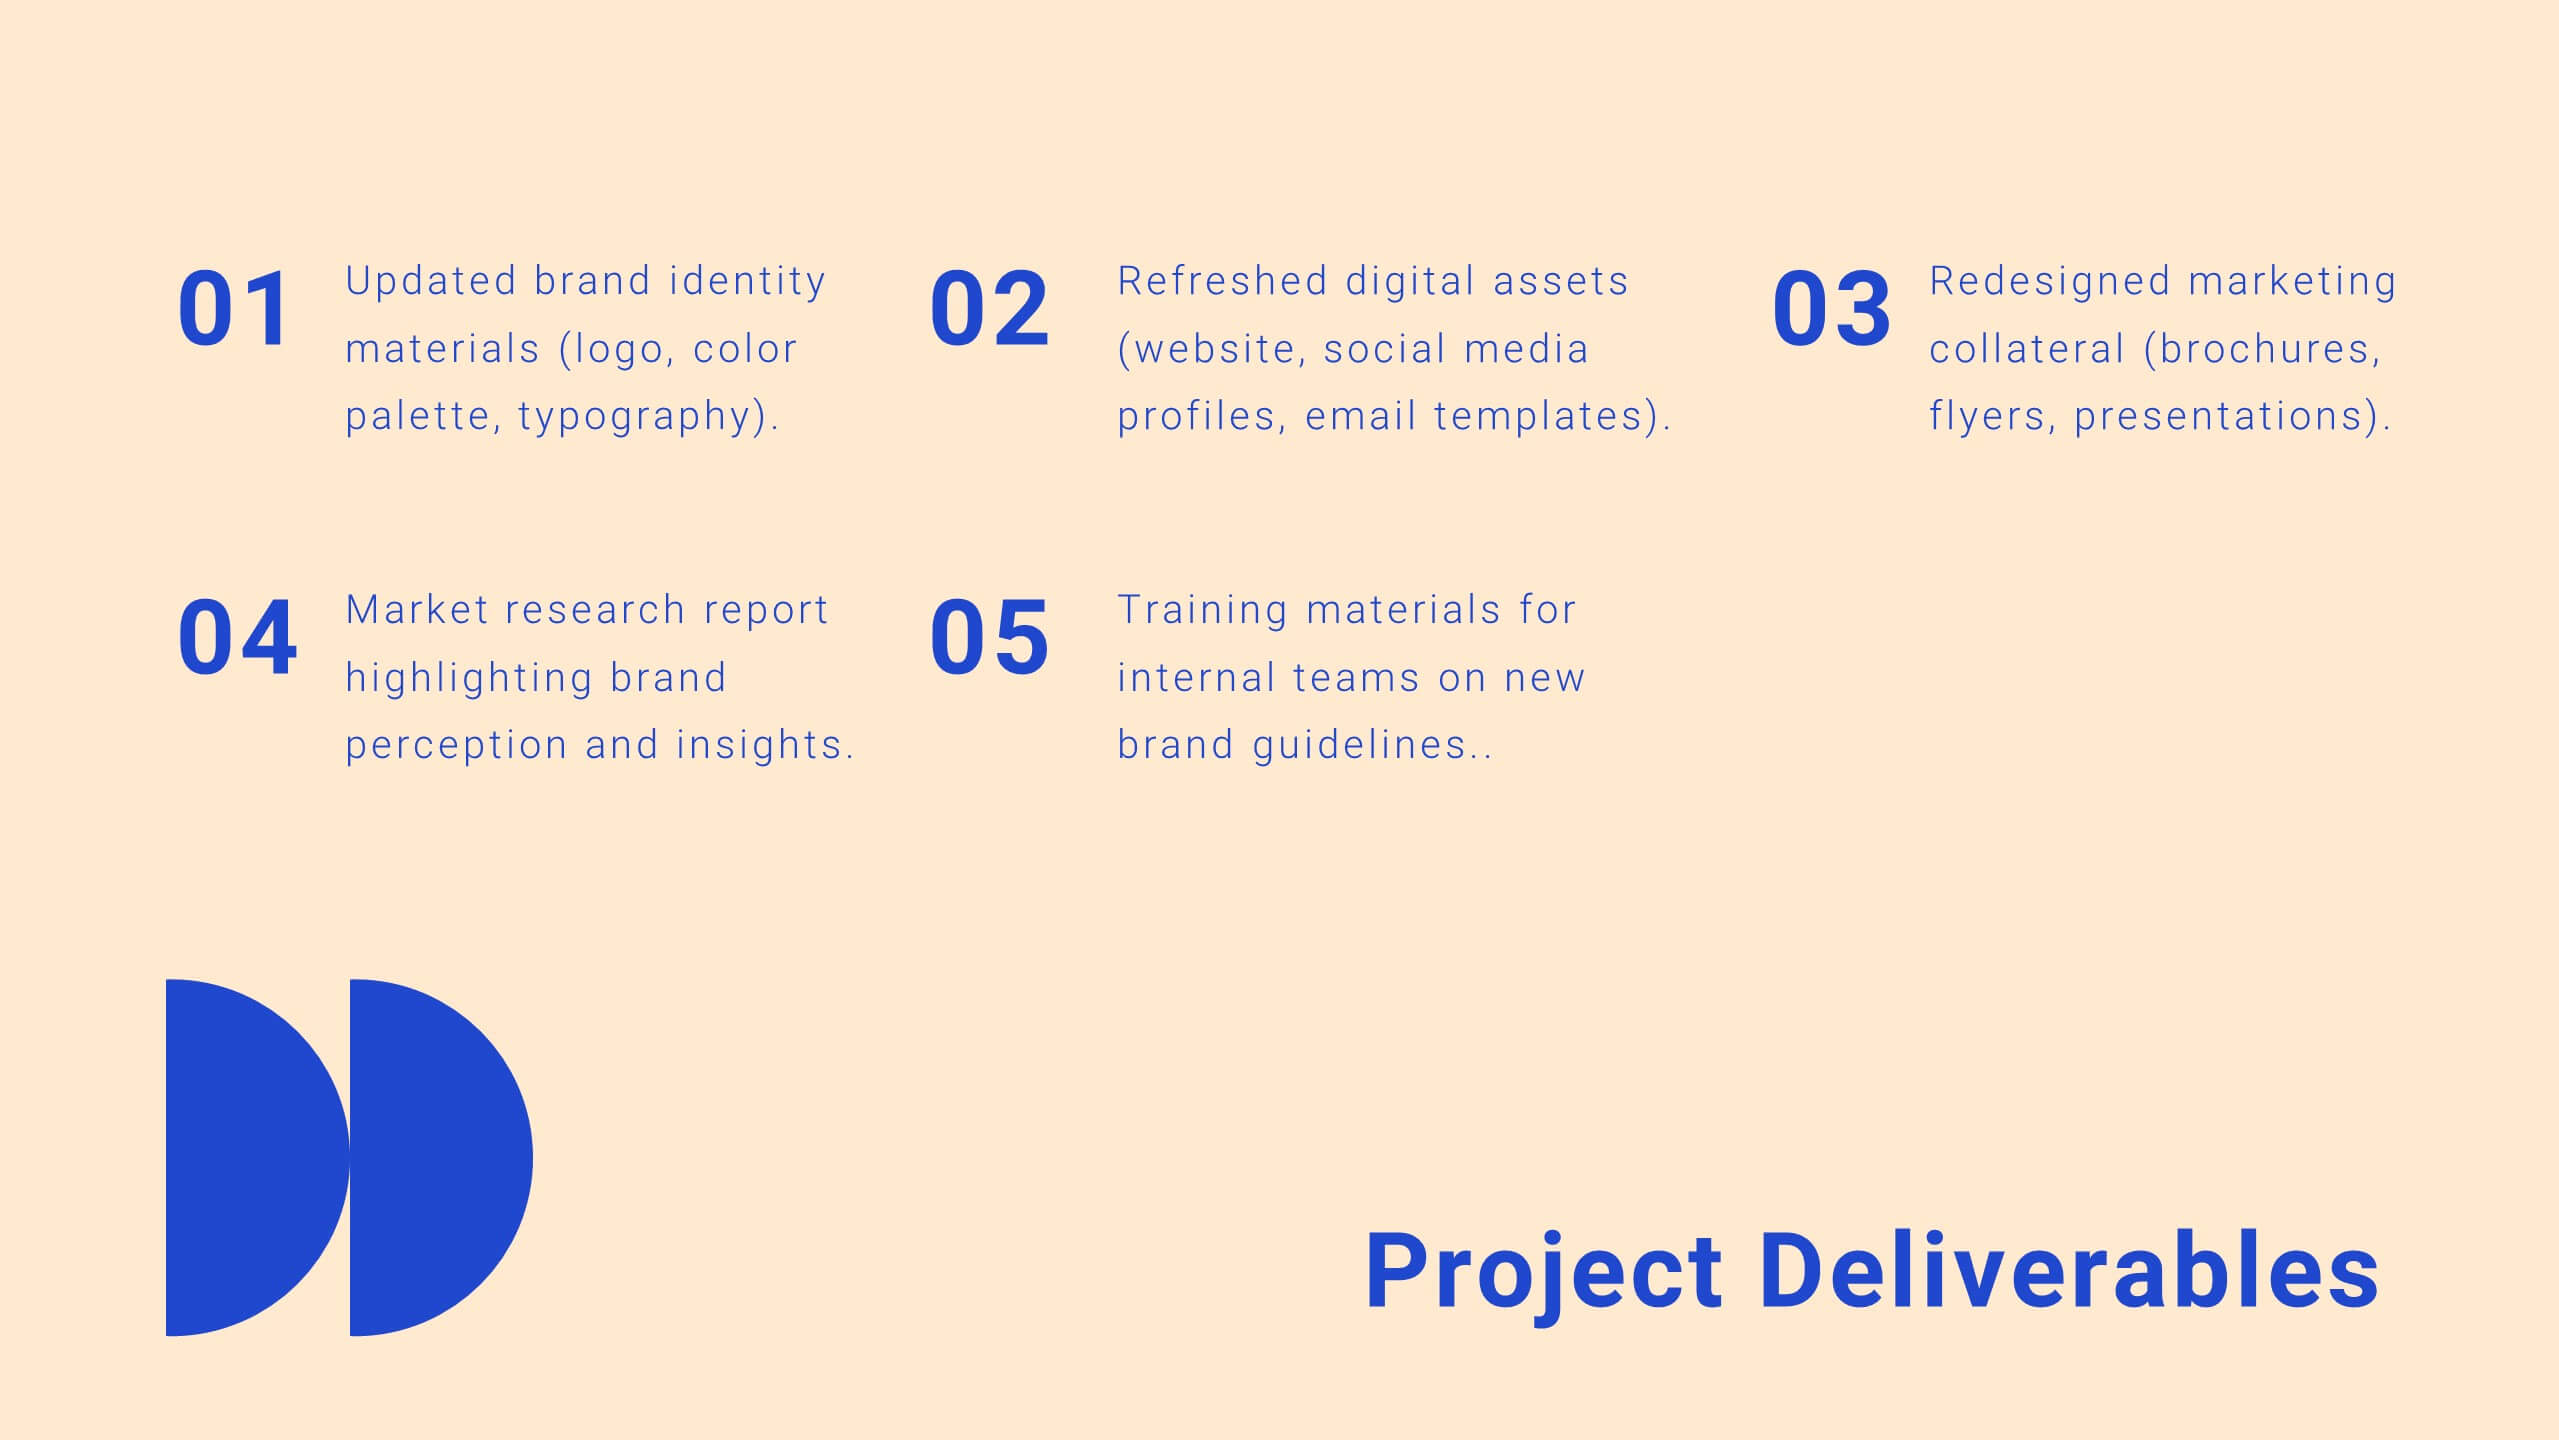
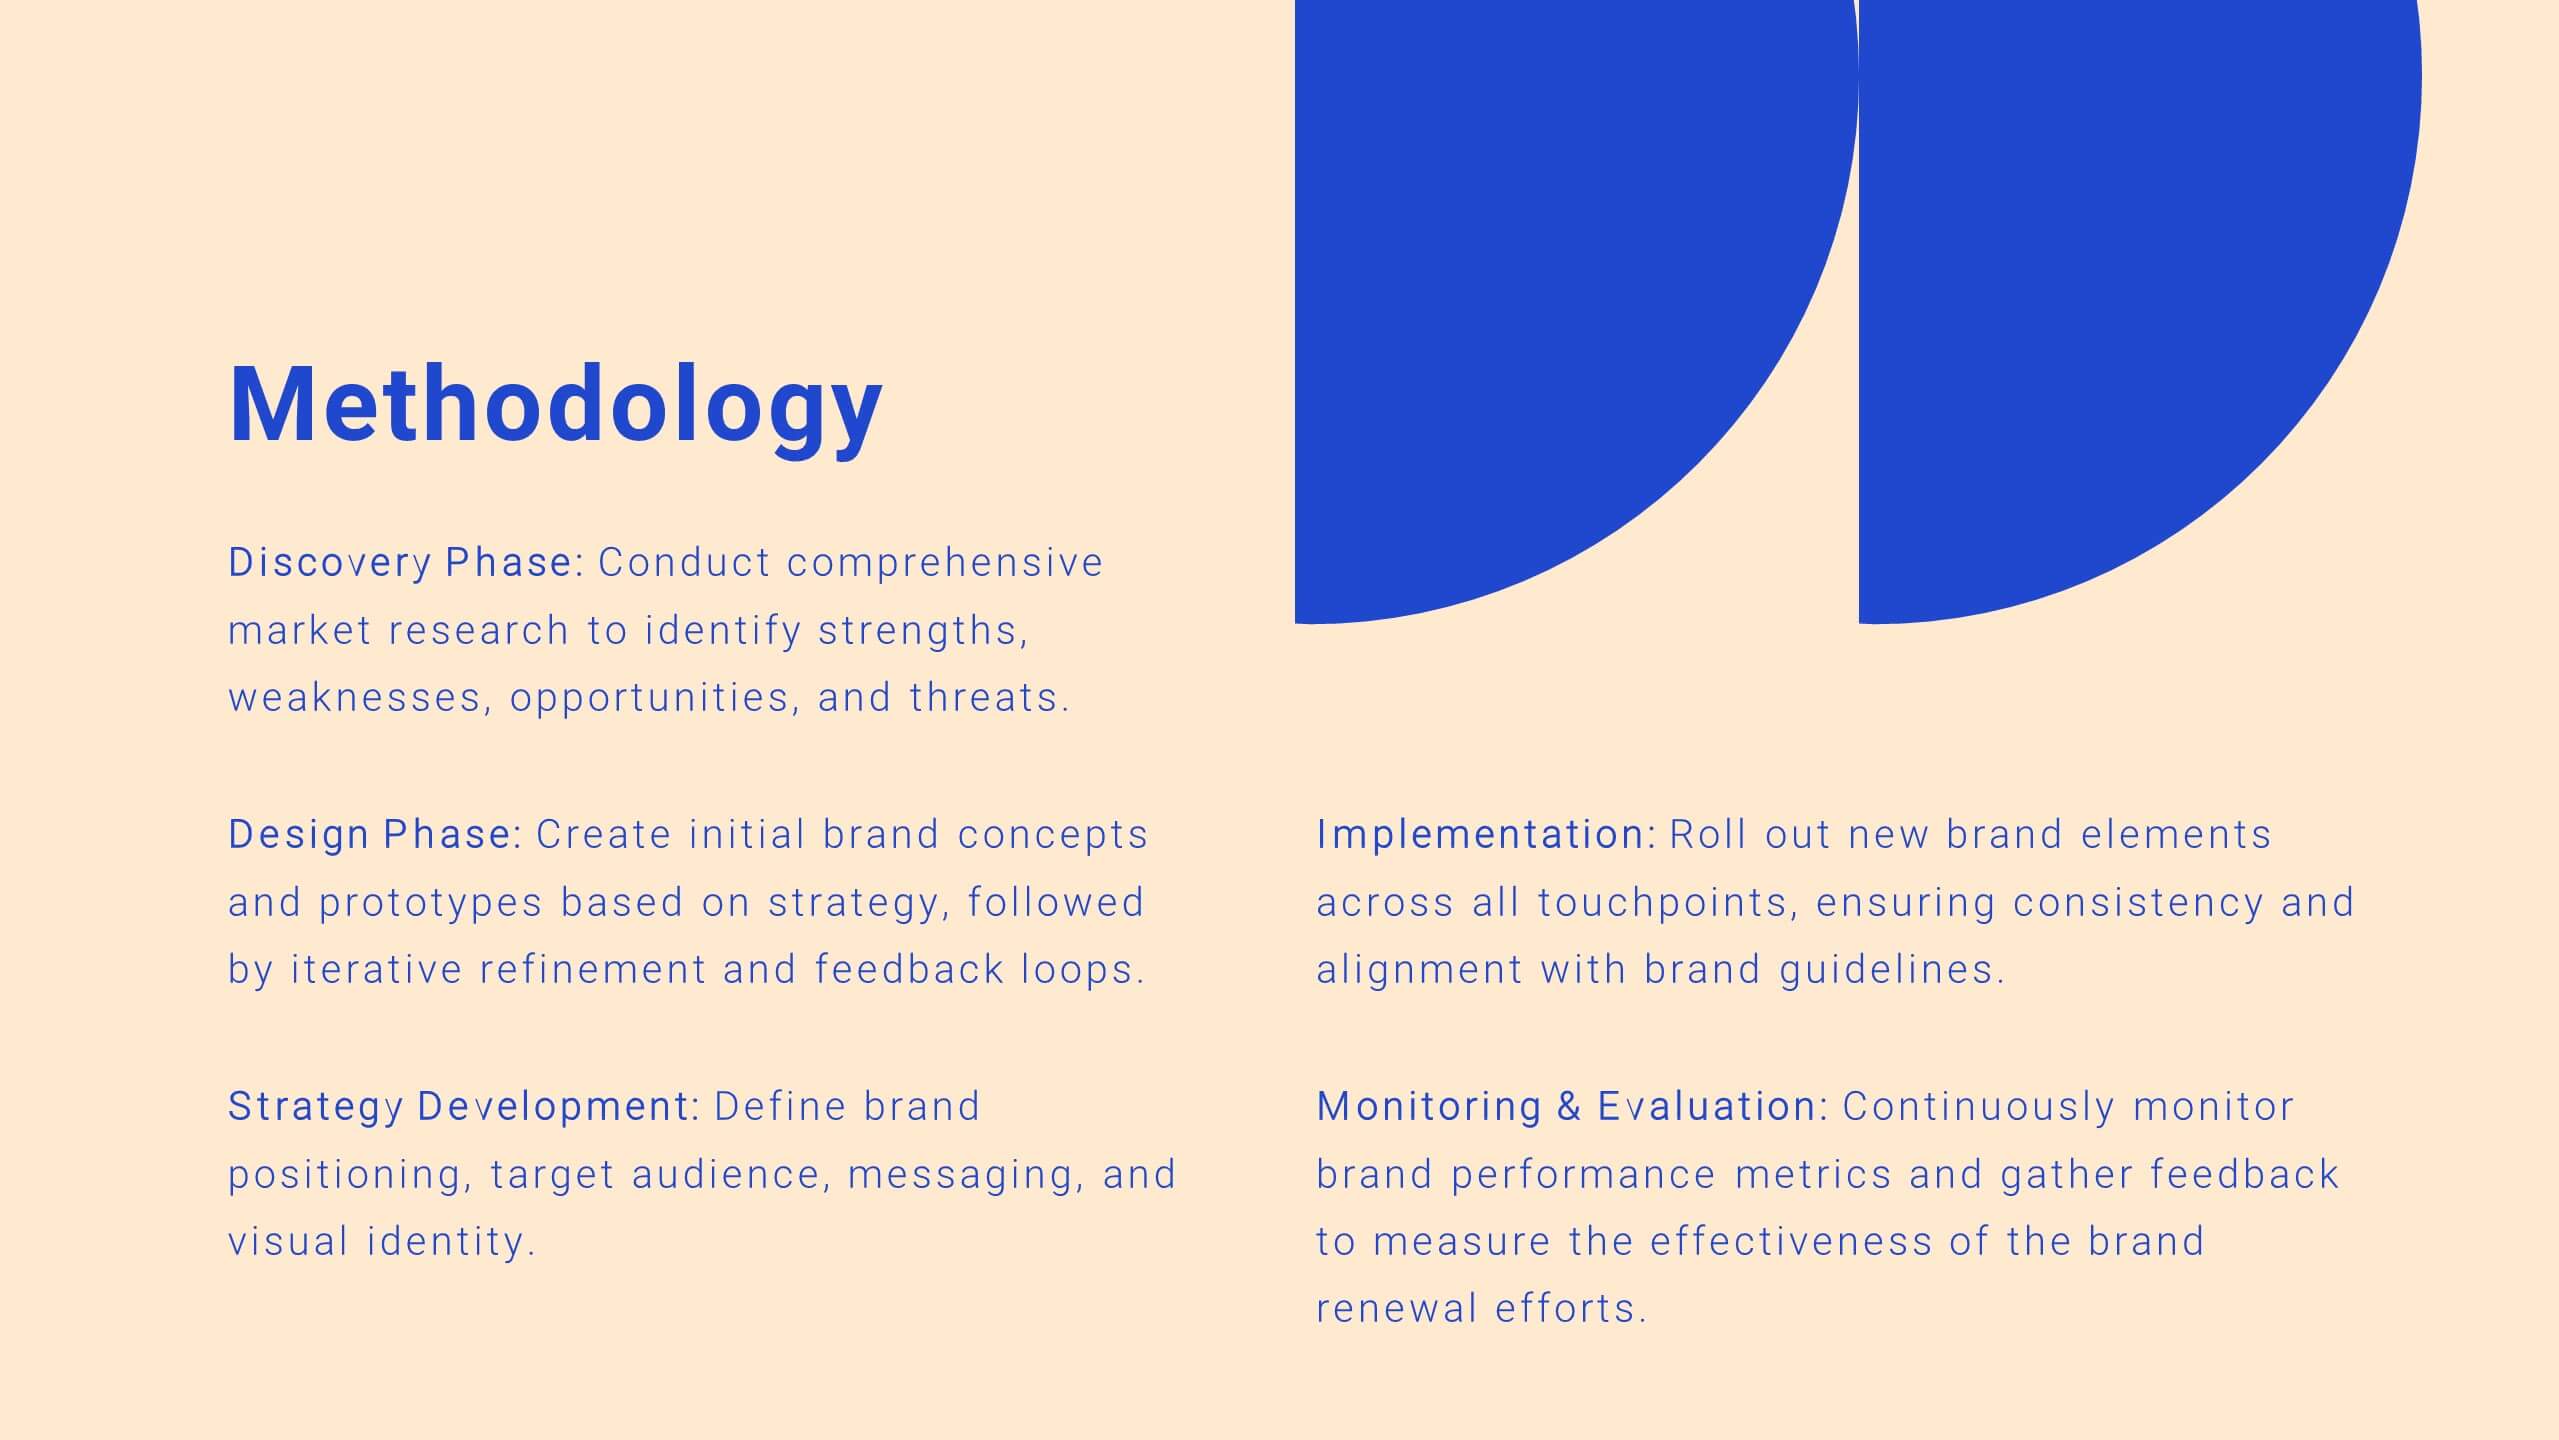
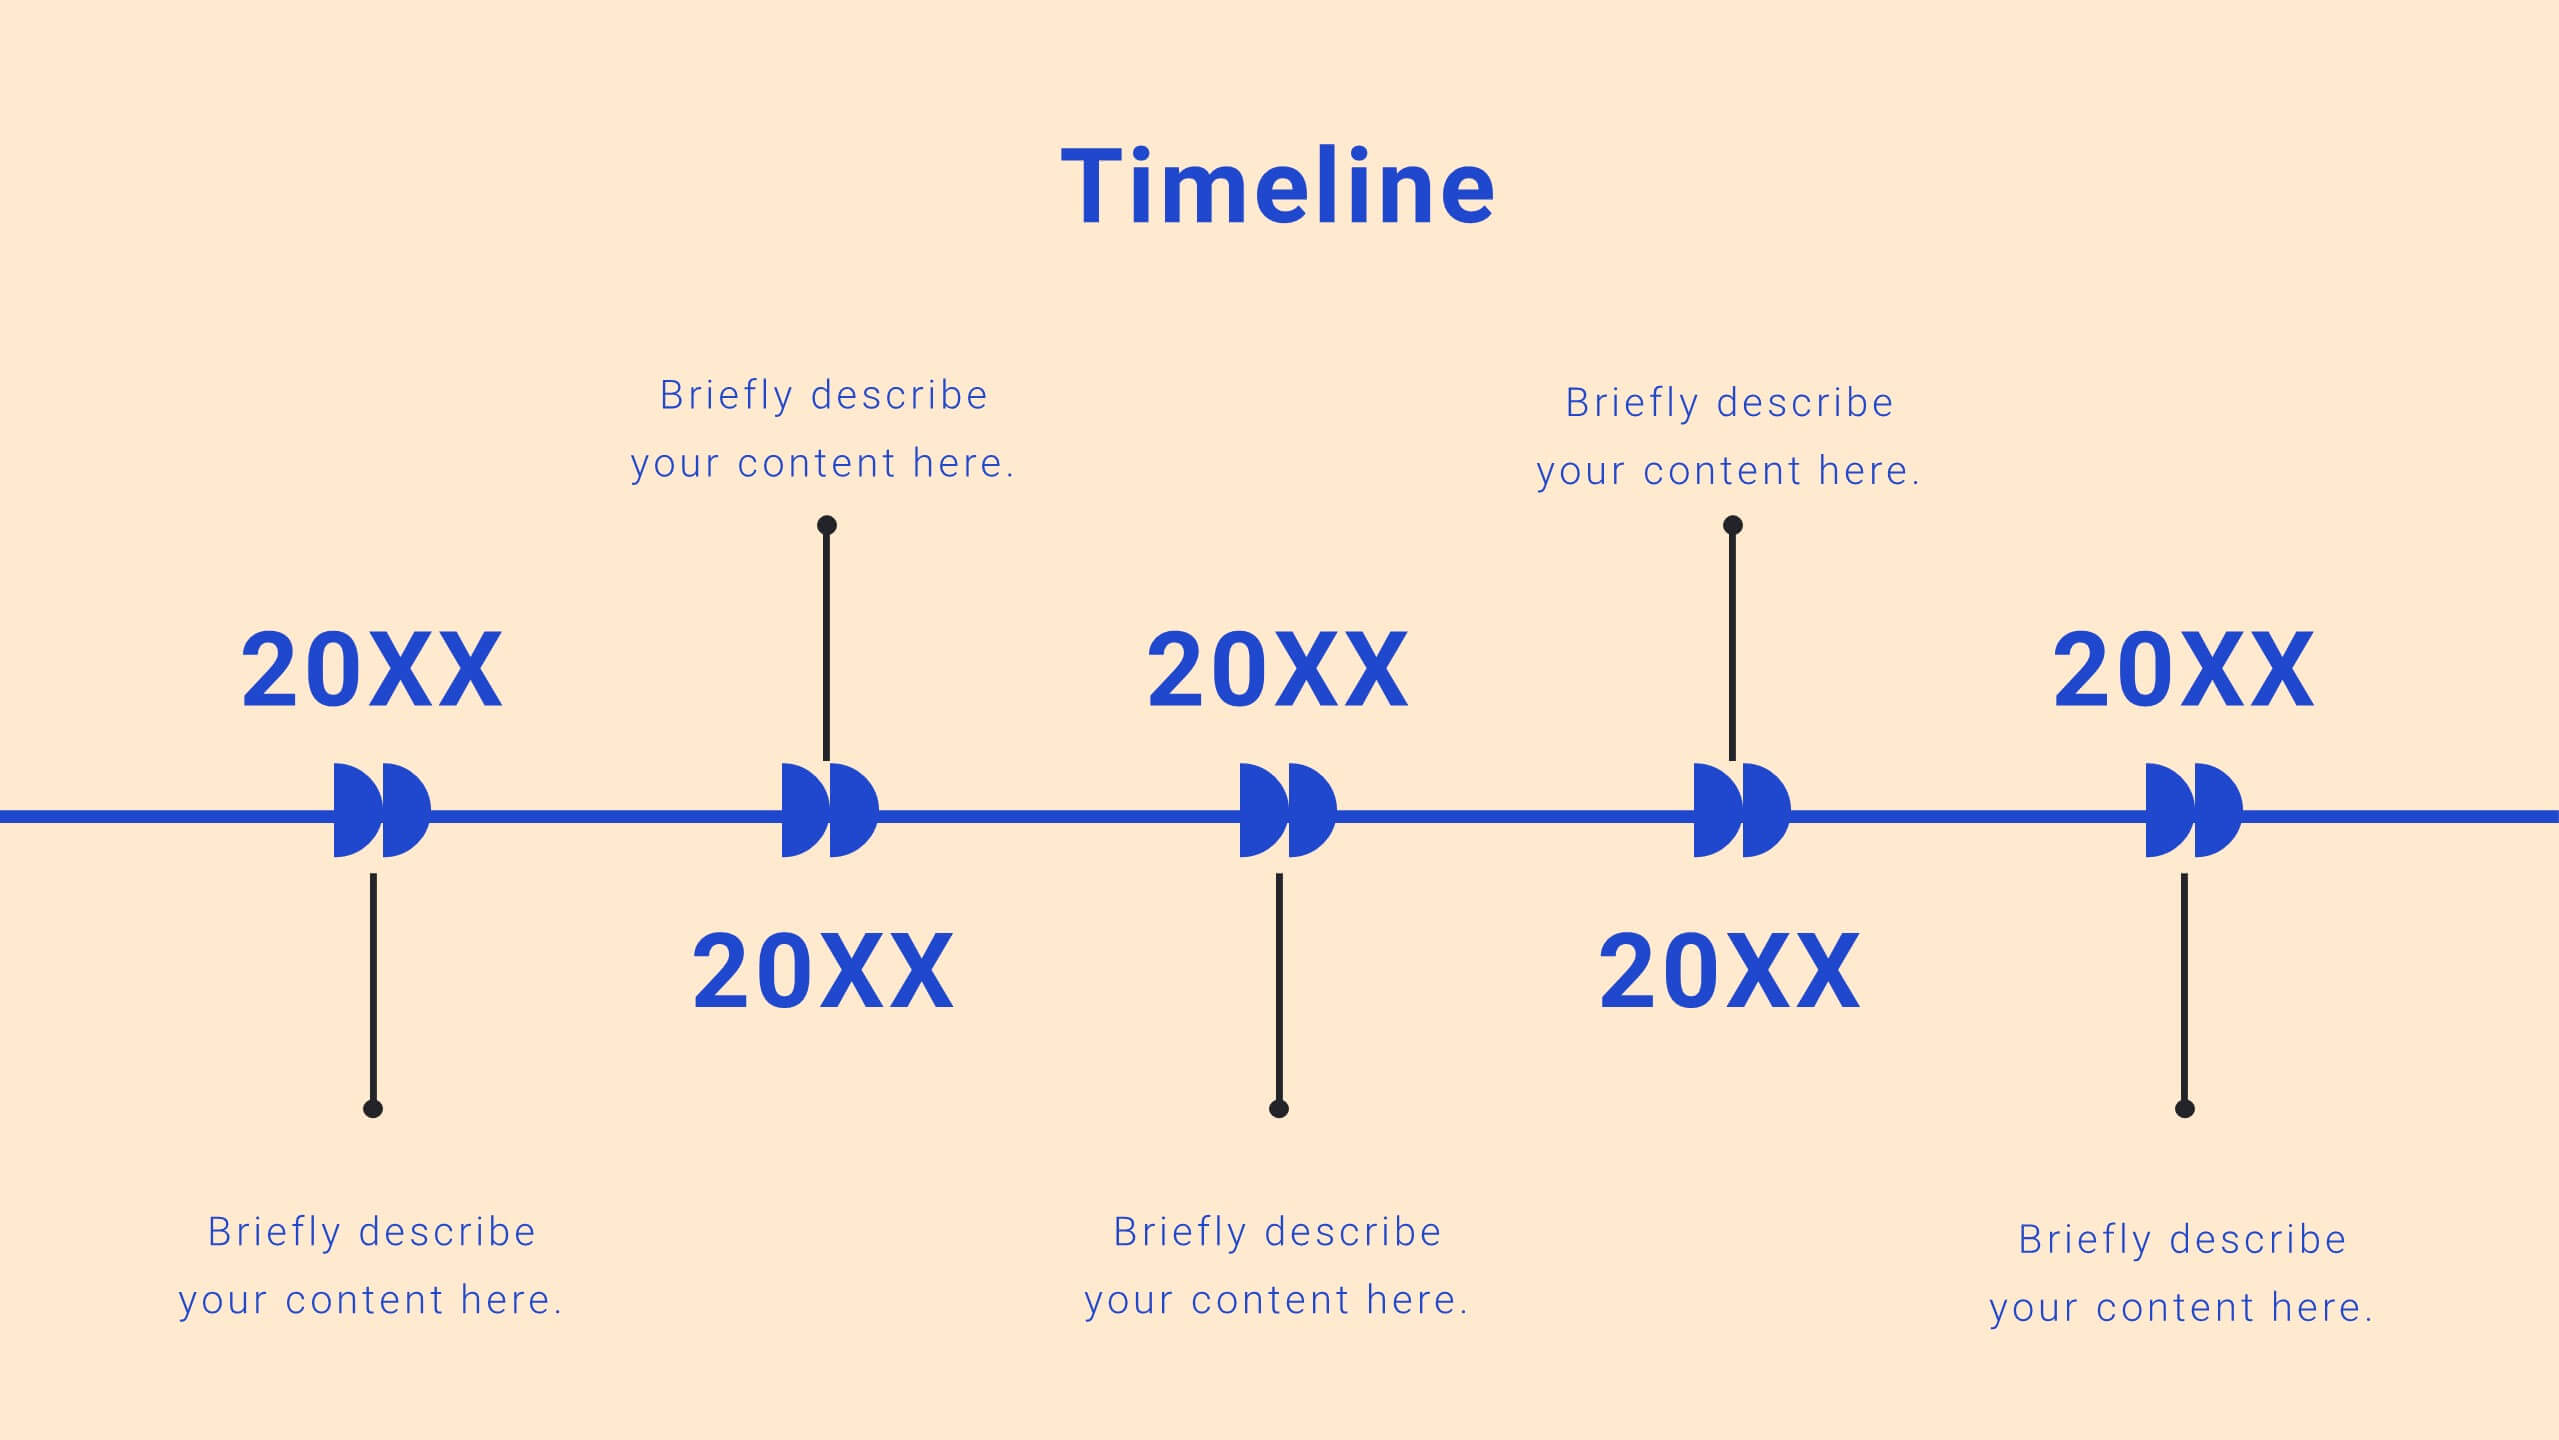
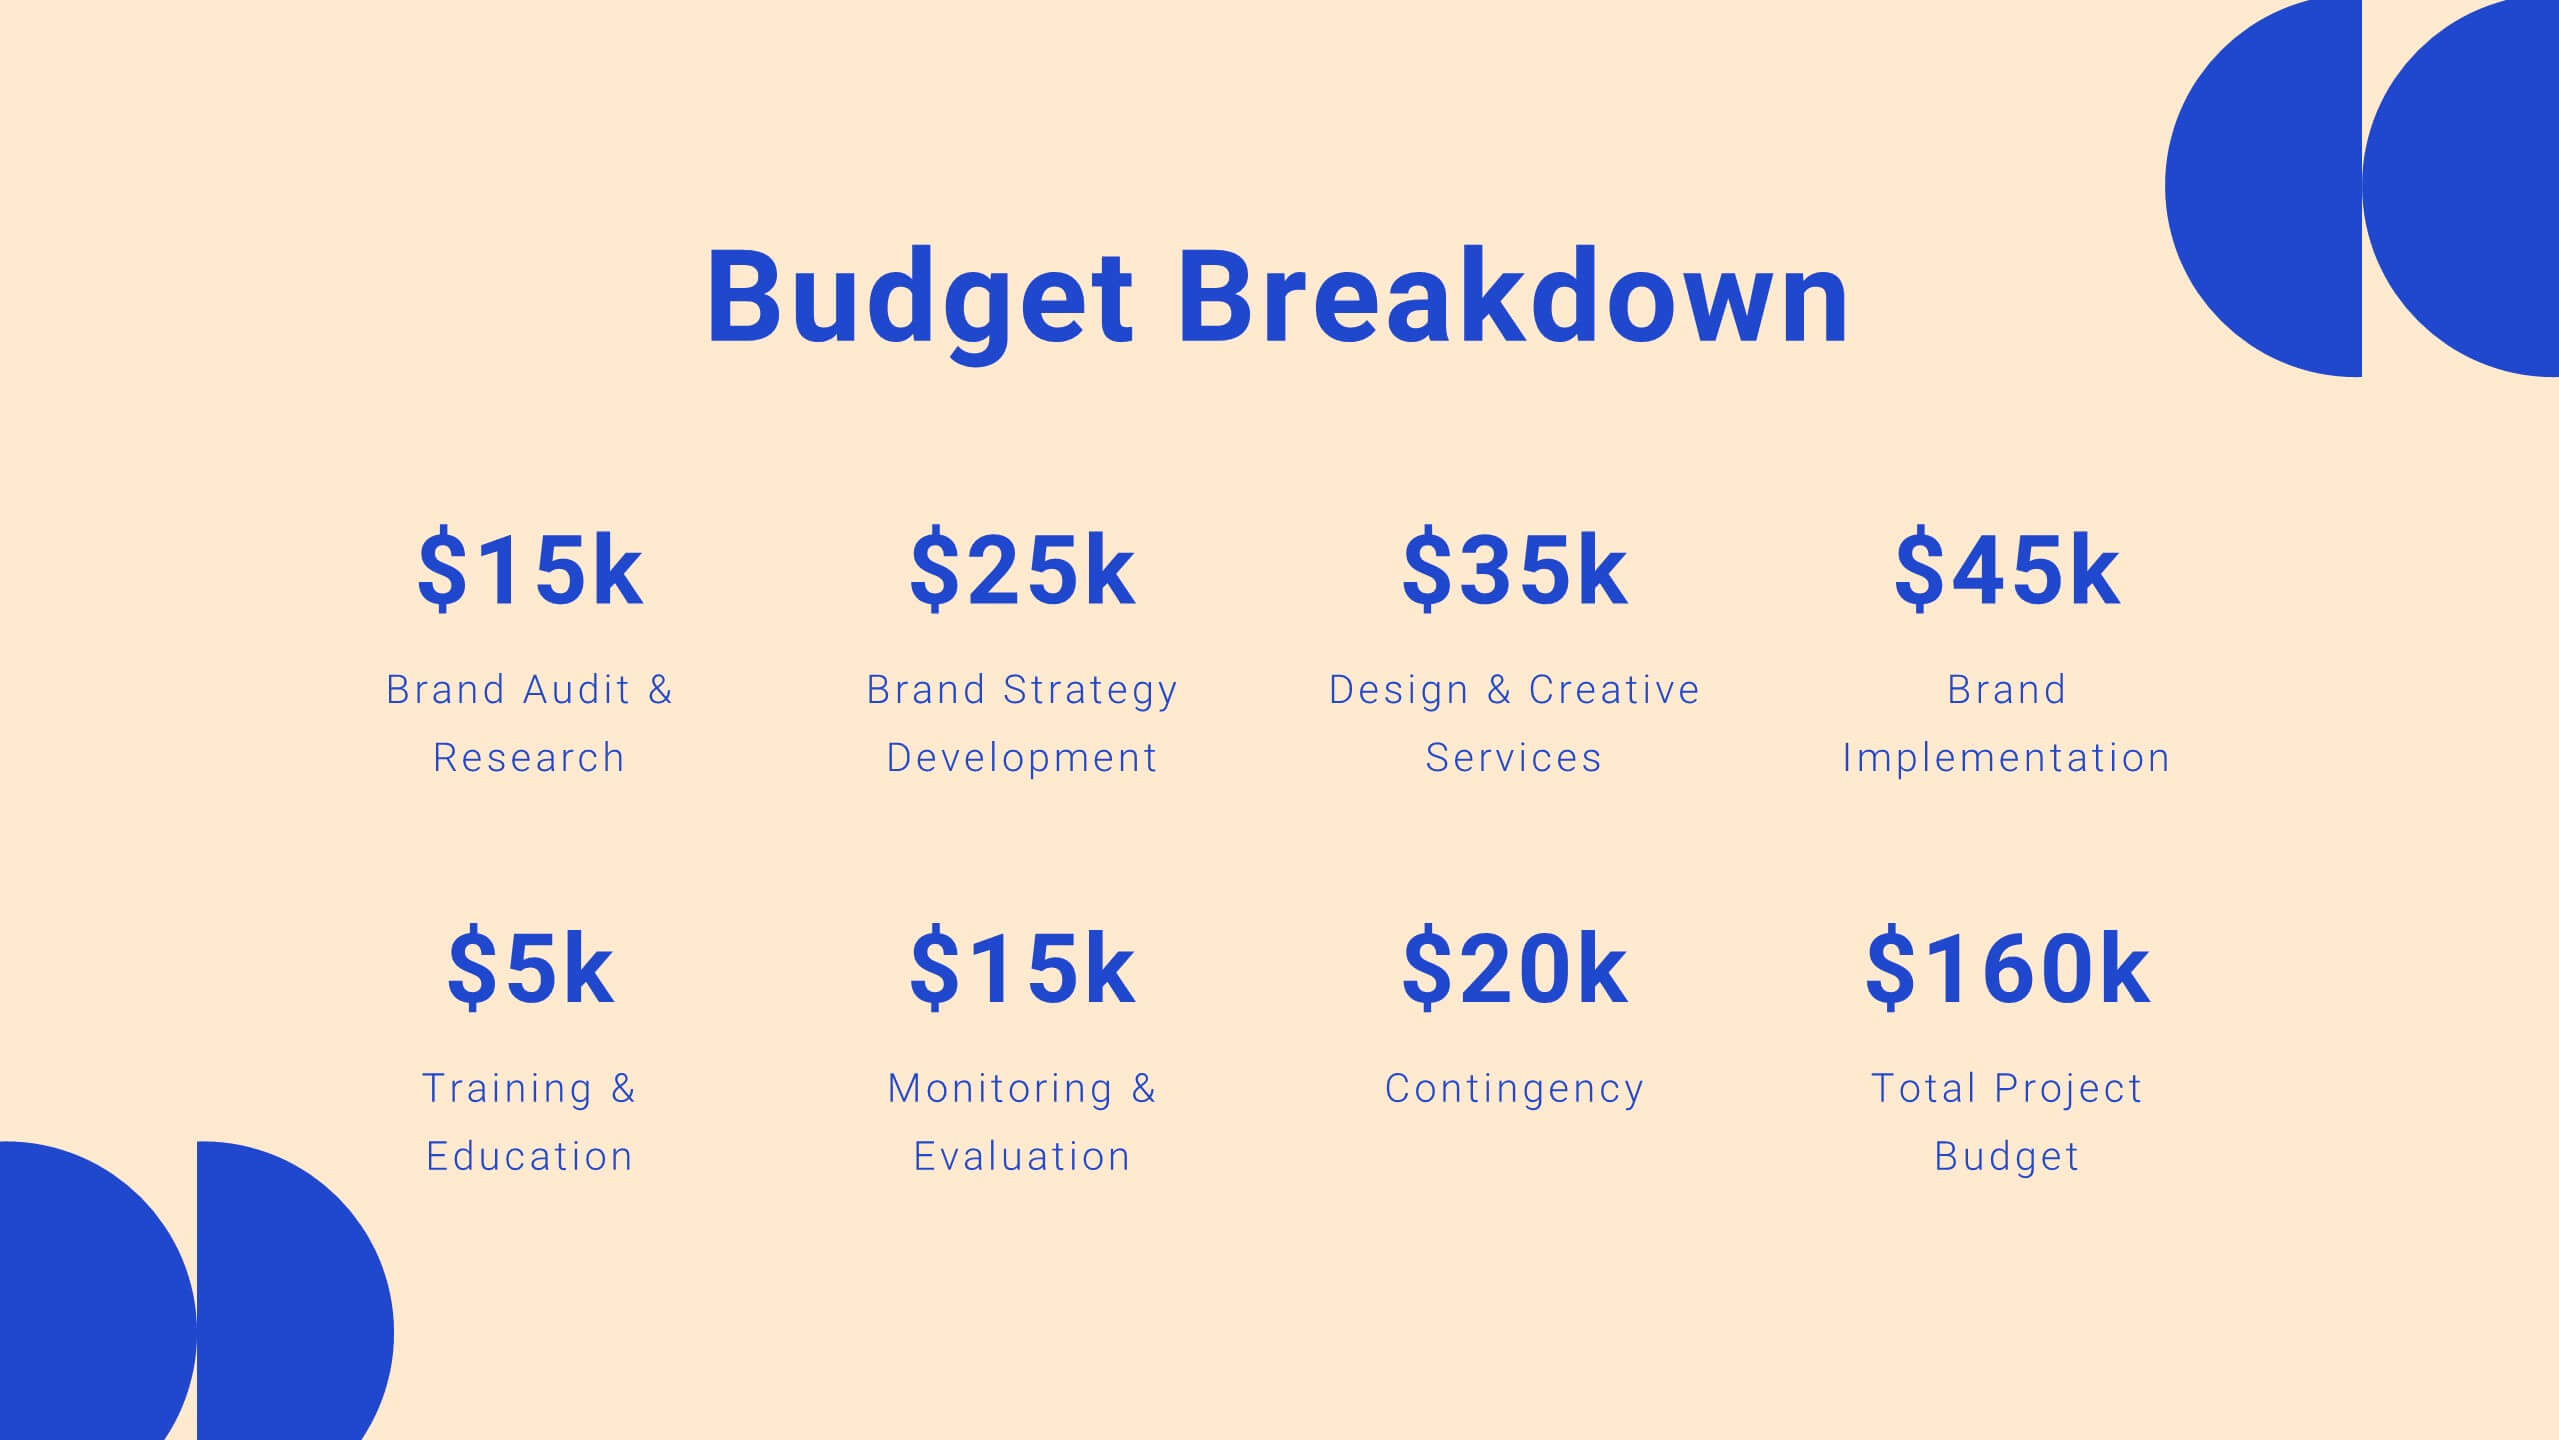
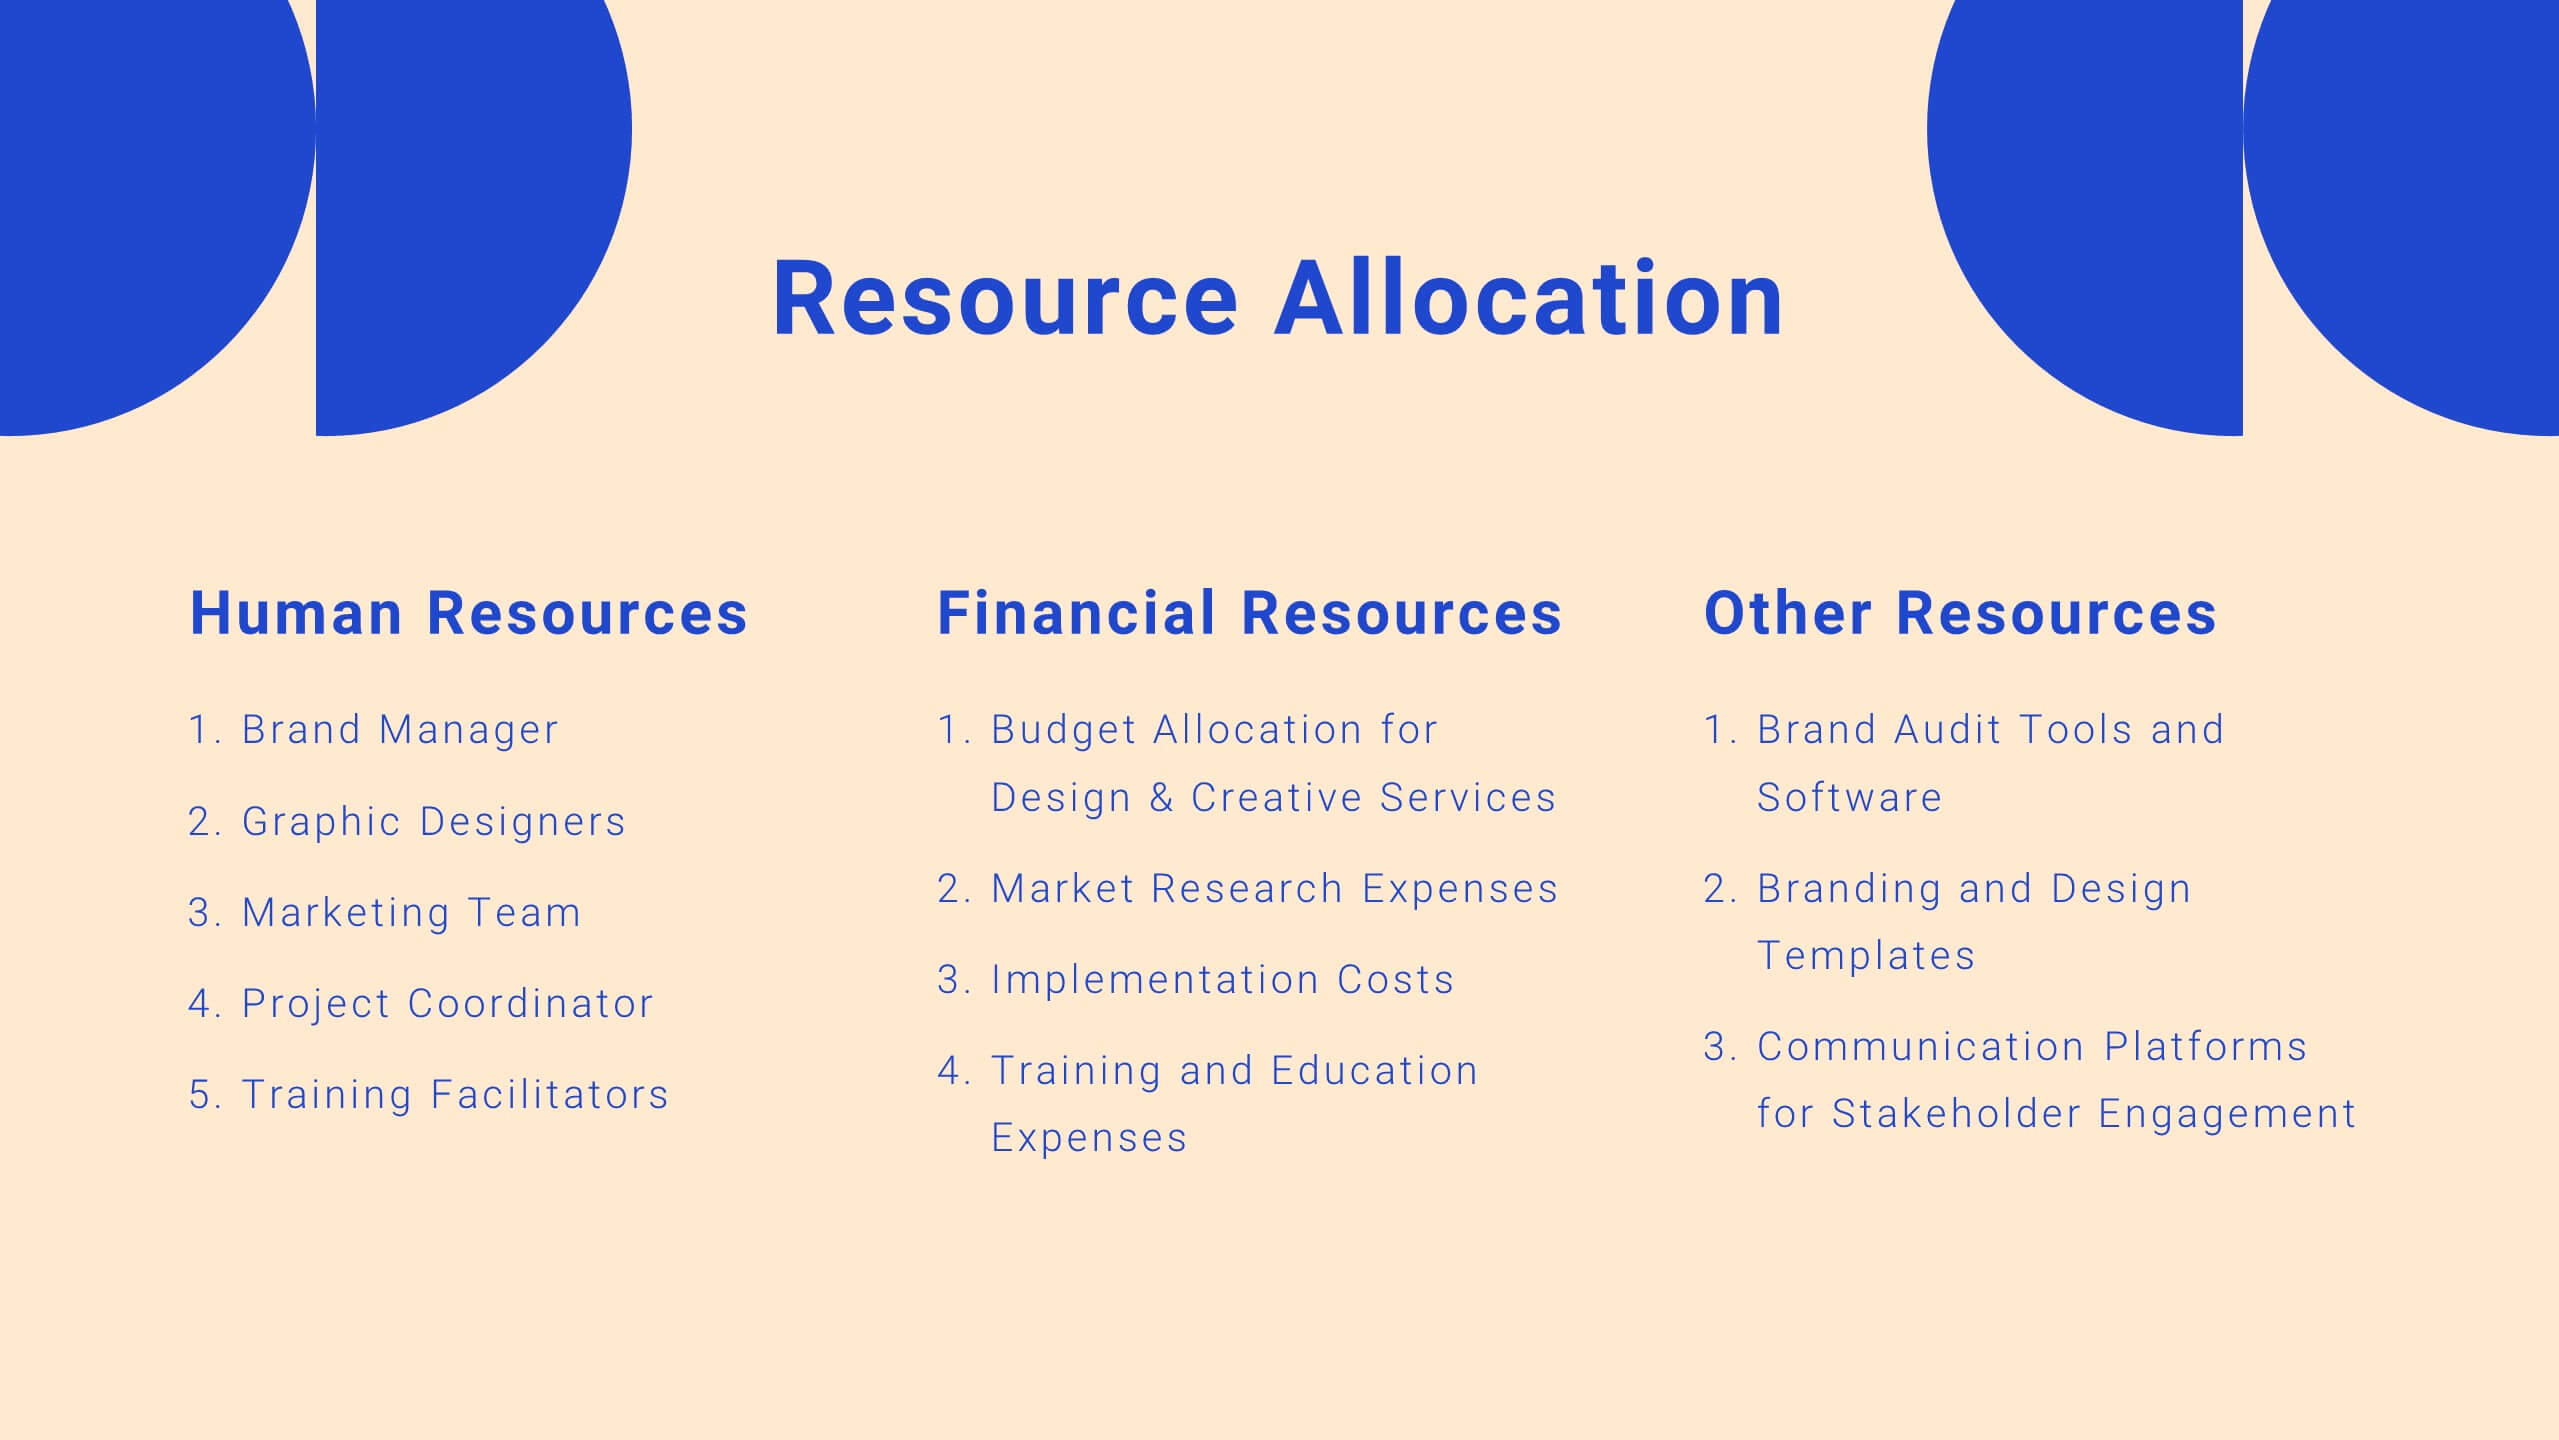
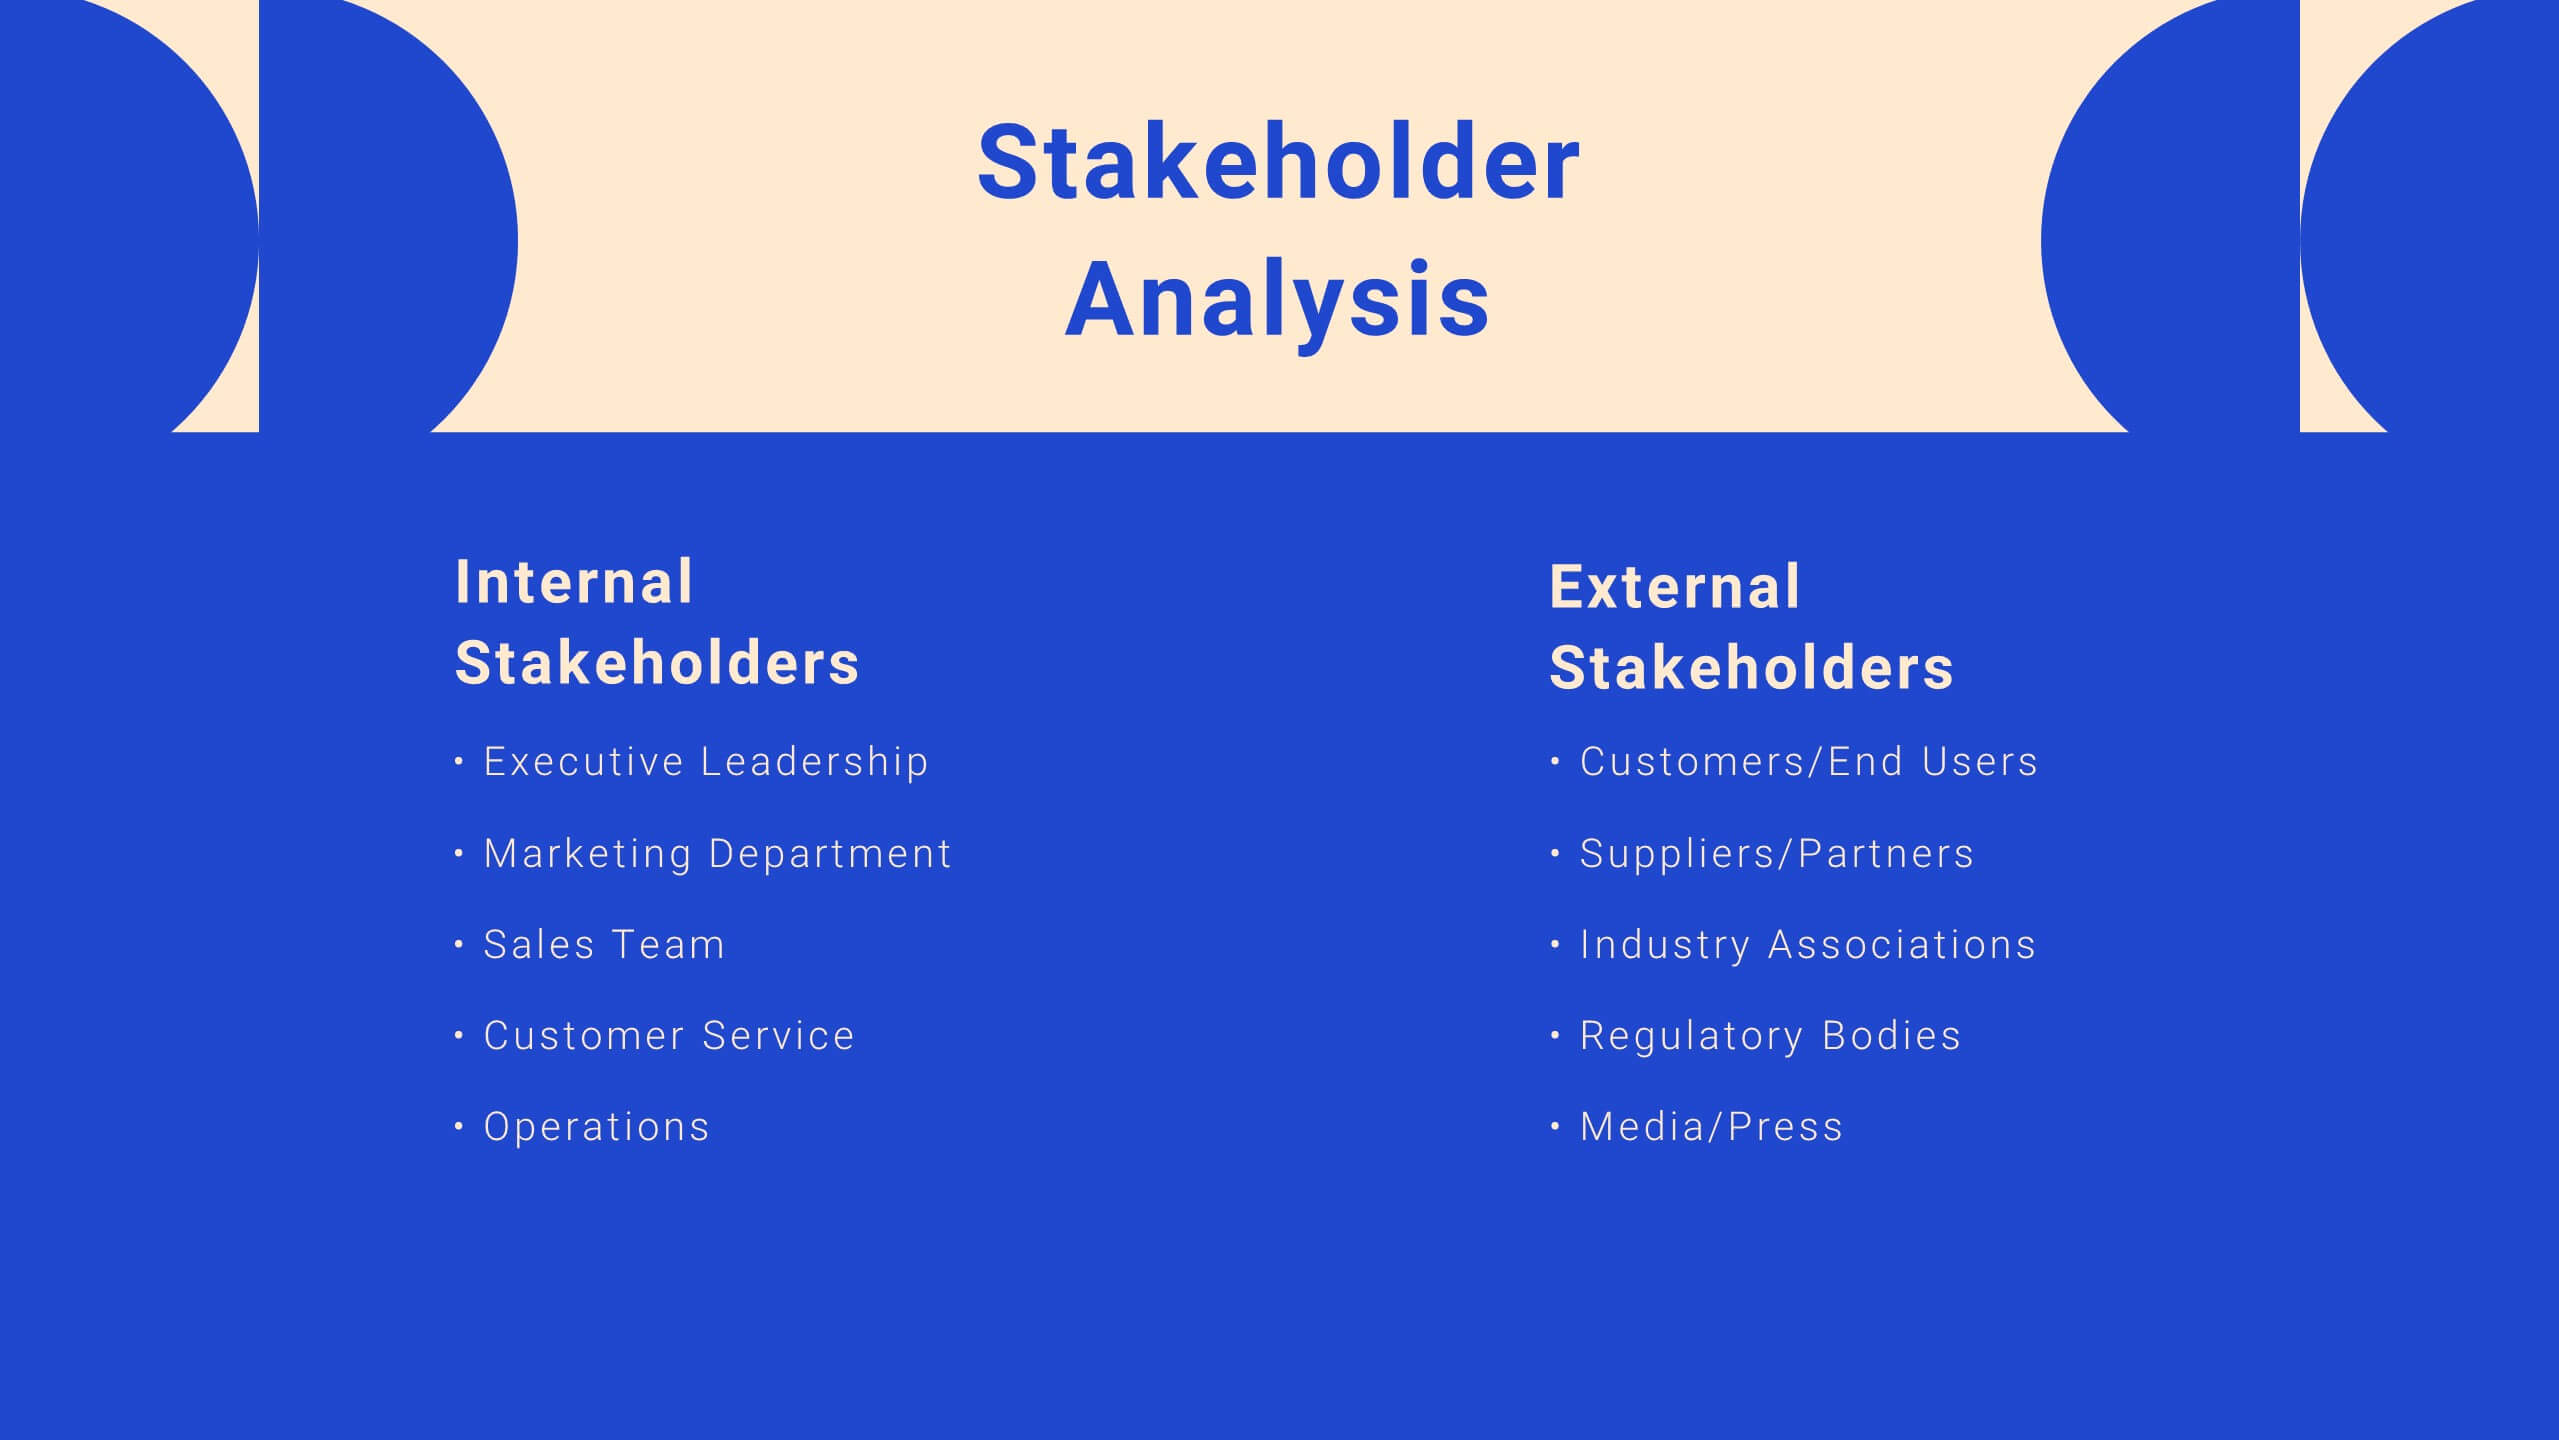
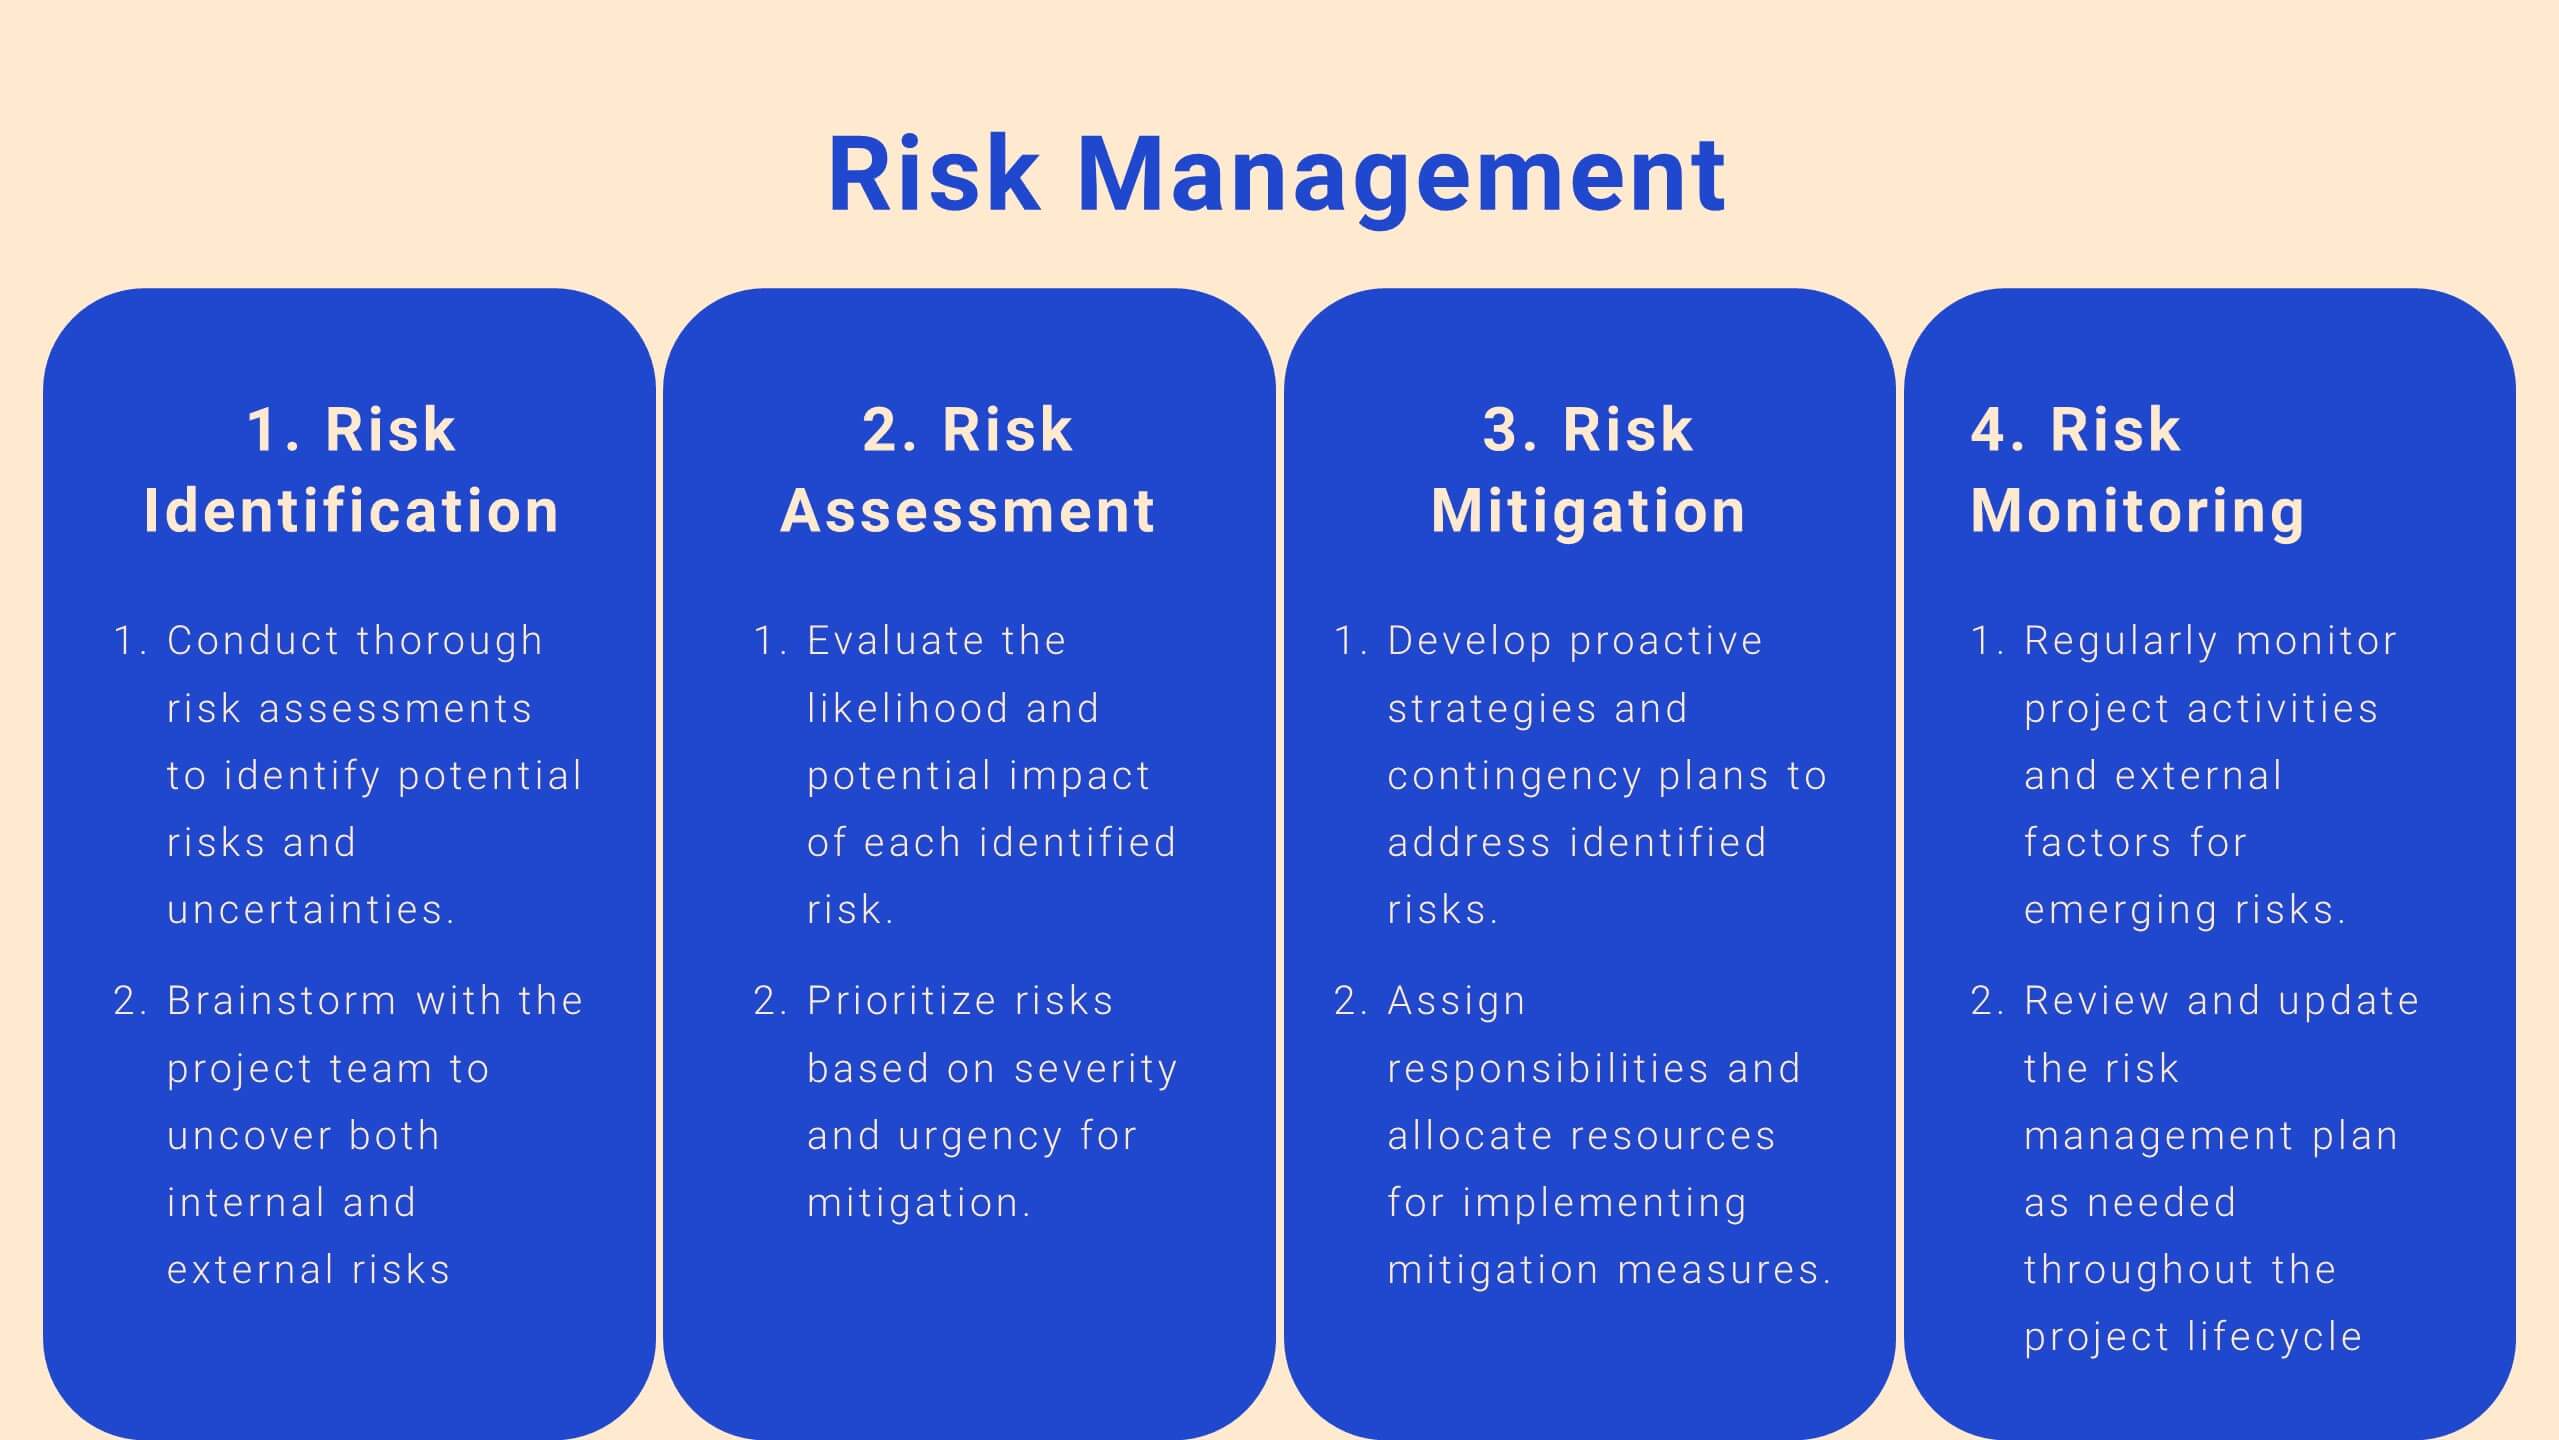
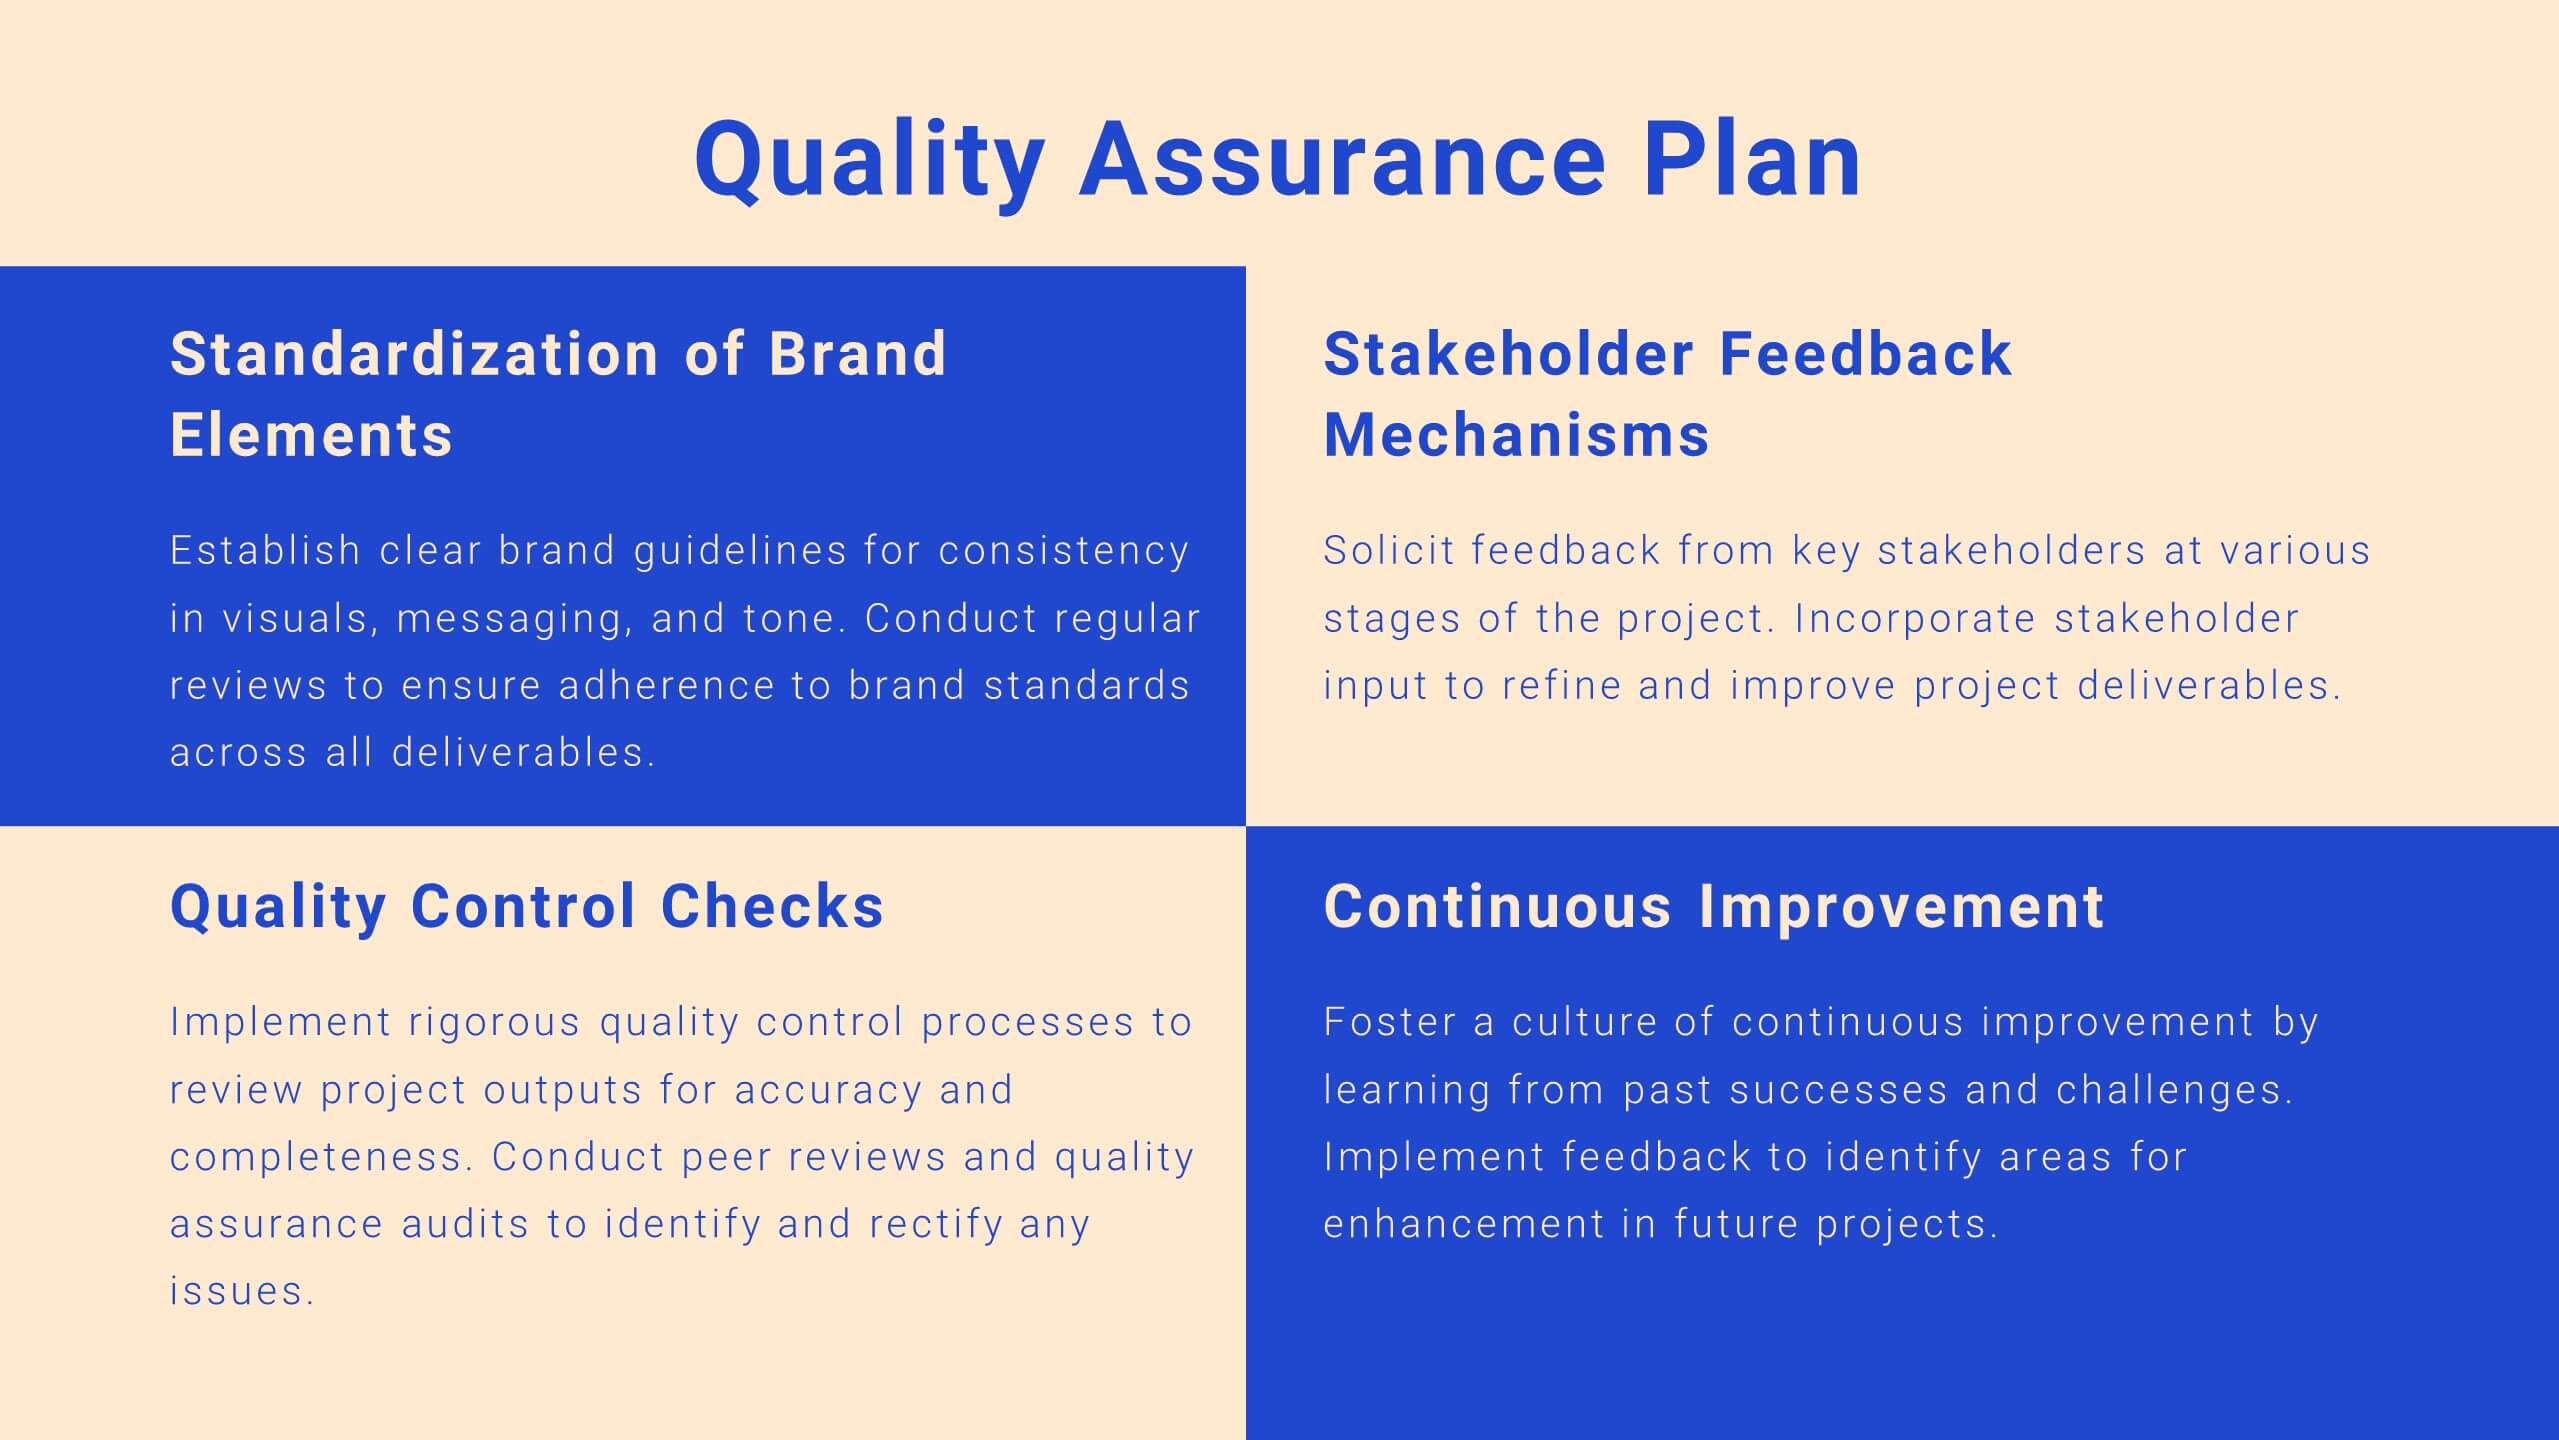
Drift Agile Project Plan Presentation
Take control of your projects with this comprehensive project plan template! From introductions to detailed objectives, this template covers scope of work, methodology, timelines, budget breakdowns, and risk management. Ideal for ensuring your project stays on track, it also includes stakeholder analysis and quality assurance plans. Compatible with PowerPoint, Keynote, and Google Slides.


4 slides
SEO Keyword Planning and Ranking Goals Presentation
Stand out in the crowded digital space with bold visuals that simplify complex strategies! This infographic presentation helps you break down SEO keyword planning and ranking goals into clear, layered steps using a funnel format that’s intuitive and professional. Perfect for SEO agencies, marketers, and digital strategists aiming to communicate data-driven insights effectively. Compatible with PowerPoint, Keynote, and Google Slides.


21 slides
Ecliptica Design Strategy Proposal Presentation
Elevate your design strategy proposals with this clean and professional presentation template. Featuring a structured layout, it covers essential sections like design briefs, target audience analysis, concept development, and final presentation deliverables. Visuals such as wireframes, design process breakdowns, and project timelines help convey your creative ideas effectively. With placeholders for typography, color schemes, and visual direction, this template is tailored for creative professionals, agencies, and designers. Easily adaptable to suit your branding needs, it's compatible with PowerPoint, Google Slides, and Keynote for seamless customization and presentation. Perfect for pitching new strategies or showcasing your design process.


23 slides
Kale Market Research Presentation
Elevate your market research presentation with this sleek template! Includes sections for introduction, objectives, data collection, analysis, key findings, and recommendations. Perfect for presenting insights, implications, and future research directions. Compatible with PowerPoint, Keynote, and Google Slides, ensuring a visually appealing and professional look. Make your data shine!


26 slides
Doriyan Presentation Template
Doriyan is a beautiful, colorful, professional and descriptive presentation. This template has wonderful colors and graphics that are engaging and conveys the information to the audience. This template is suitable for all types of businesses especially those that are investors, realtors or other companies involved in investment advice. Charts, timelines and easy to edit text makes this template perfect for businesses seeking to introduce there business and services to make a great impression. Doriyan offers a way to boost your business. Present your information with this efficient template!


7 slides
Mind-Brain Concept Diagram Presentation
Visualize cognitive processes with the Mind-Brain Concept Diagram. This engaging infographic presents six key elements surrounding a central brain illustration, making it ideal for psychology, neuroscience, or decision-making presentations. Fully editable with customizable text, colors, and icons. Compatible with PowerPoint, Keynote, and Google Slides for seamless integration.