


Features
- 26 Unique slides
- Fully editable and easy to edit in Microsoft Powerpoint, Keynote and Google Slides
- 16:9 widescreen layout
- Clean and professional designs
- Export to JPG, PDF or send by email


Do you have any questions?
Recommend


26 slides
Premium Finance for Daily Life Presentation
Introducing our Premium Finance for Daily Life Presentation template this is a comprehensive and informative tool to educate individuals about the concept of premium finance and its relevance in everyday life. This presentation aims to provide valuable insights on how premium finance can be utilized to manage and optimize personal finances. The slides are fully customizable and compatible with PowerPoint, Keynote, and Google Slides. It features a professional design with clean layouts, visually appealing graphics, and icons related to finance and daily life activities. The presentation can cover various topics related to premium finance.


5 slides
Business Growth and Expansion
Visually communicate each stage of business development with this Business Growth and Expansion diagram. Featuring a dynamic circular flow, this editable slide is perfect for showcasing progress, scaling strategies, or roadmap milestones. Fully compatible with PowerPoint, Keynote, and Google Slides—ideal for business plans and strategic presentations.


21 slides
Naga Project Proposal Presentation
Present your project with confidence using this comprehensive proposal presentation! It covers crucial sections such as objectives, methodology, timeline, budget breakdown, and risk mitigation strategies, ensuring every detail is addressed clearly. Ideal for client proposals or internal planning, this template works seamlessly with PowerPoint, Keynote, and Google Slides.


6 slides
Business Journey Roadmap Planning Presentation
Map out strategic progress with this Business Journey Roadmap Planning presentation. Ideal for outlining key steps, milestones, and achievements, this staircase-style layout visually guides your audience through your business journey. Fully editable in Canva, PowerPoint, and Google Slides—perfect for project planning, goal setting, and executive updates.


4 slides
Simple Title Page Design Presentation
Make a memorable first impression with a clean, modern title design that instantly draws attention. Ideal for creative portfolios, business reports, or marketing decks, this layout combines strong typography with sleek visuals for a professional look. Fully editable in PowerPoint, Keynote, and Google Slides for complete flexibility.


22 slides
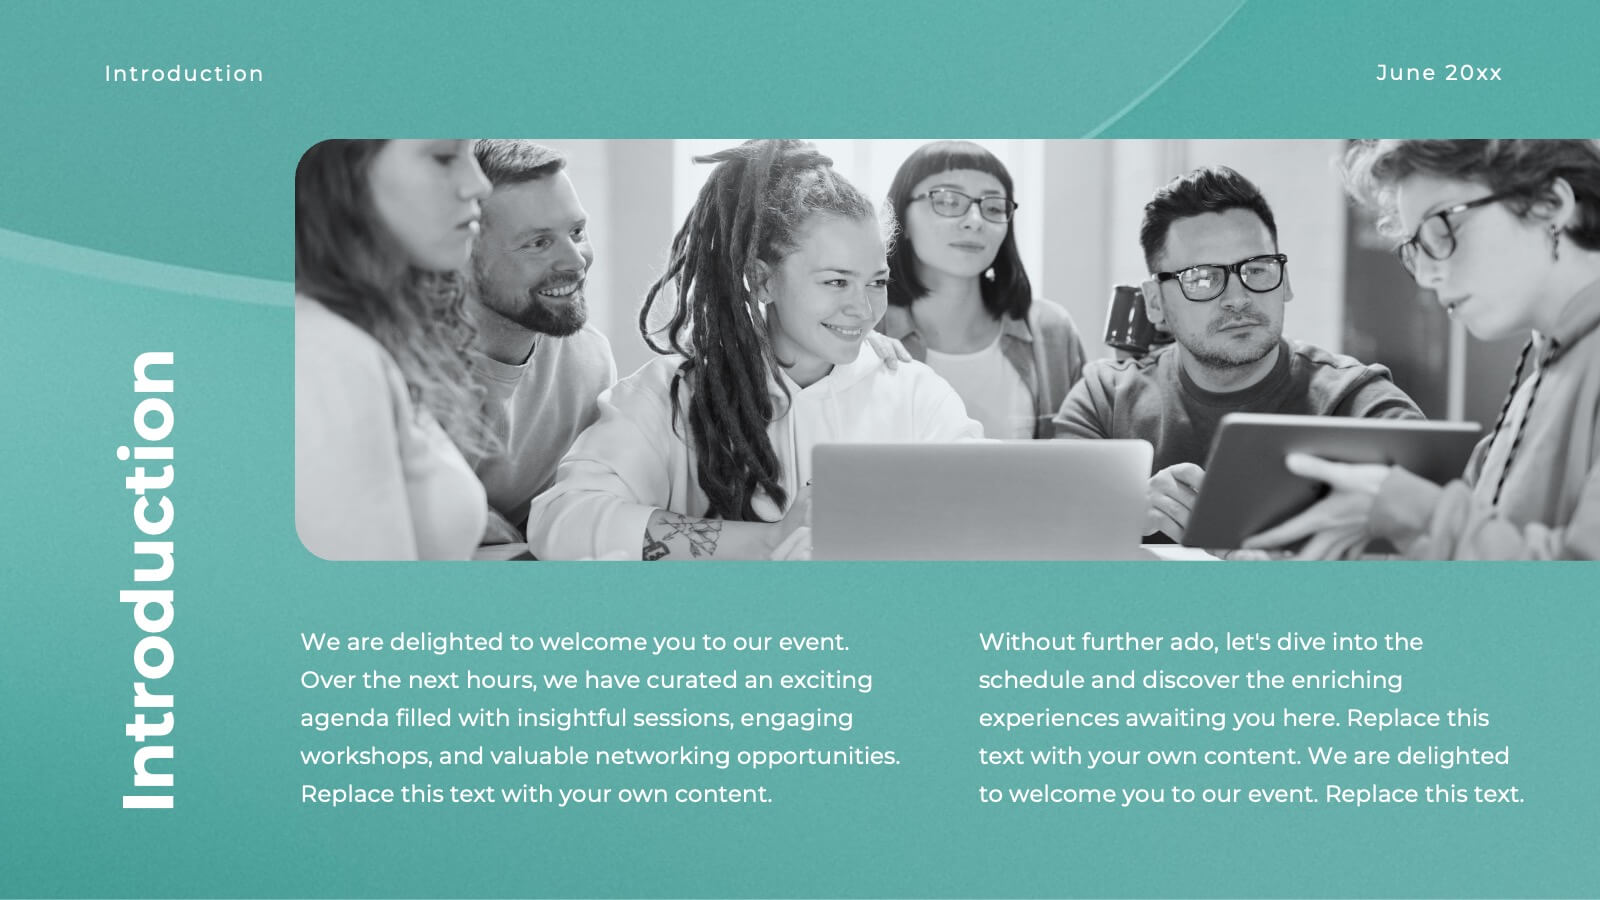
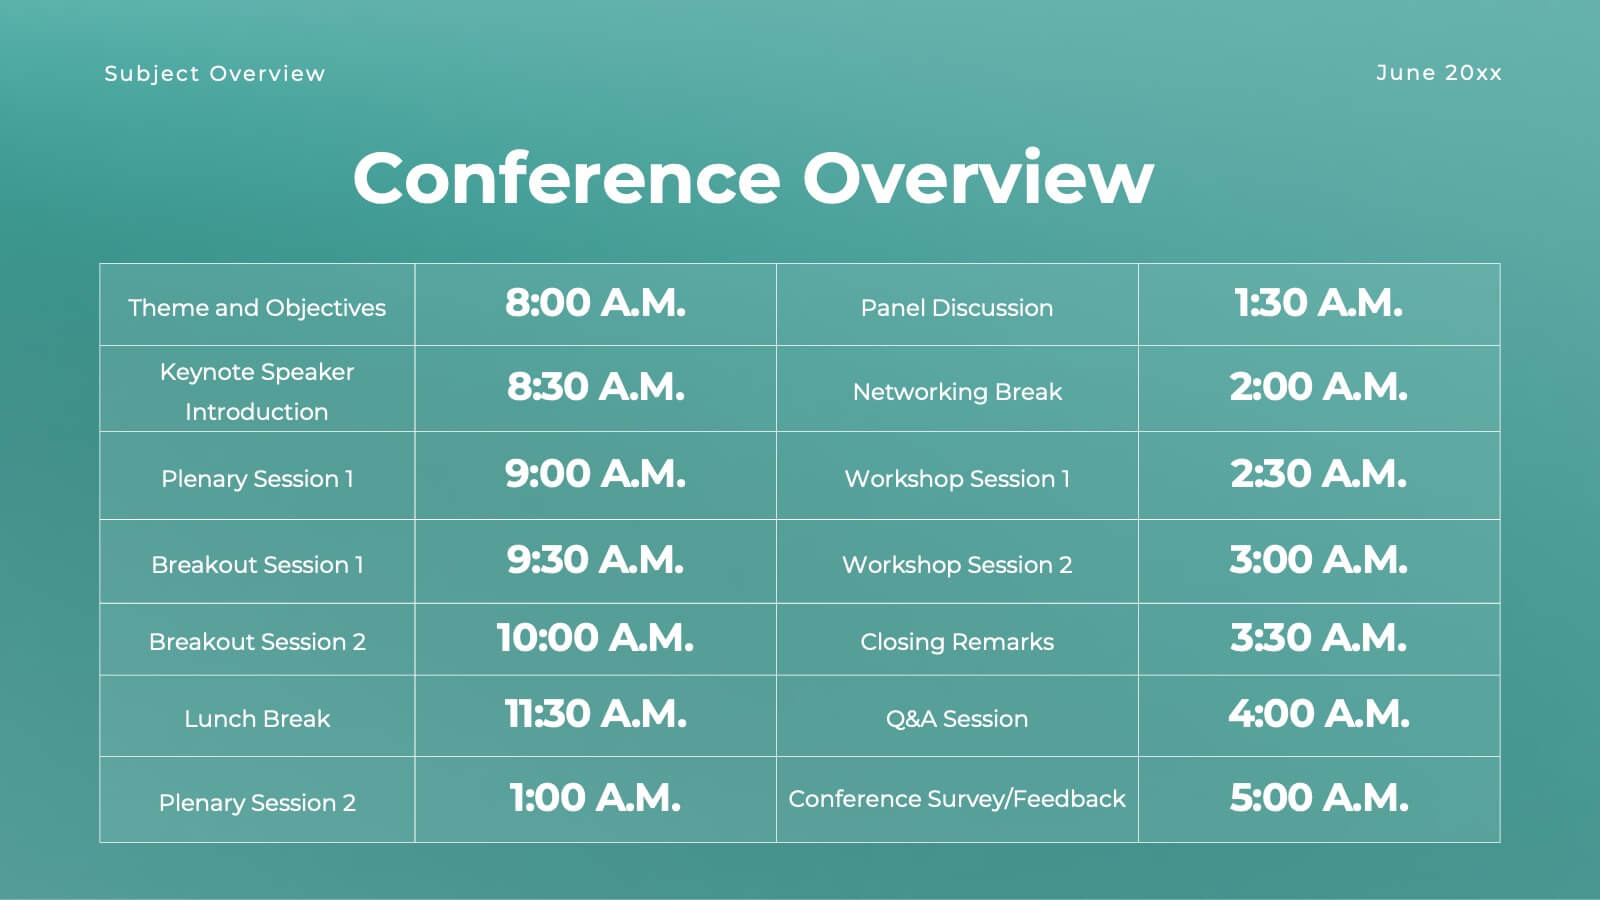
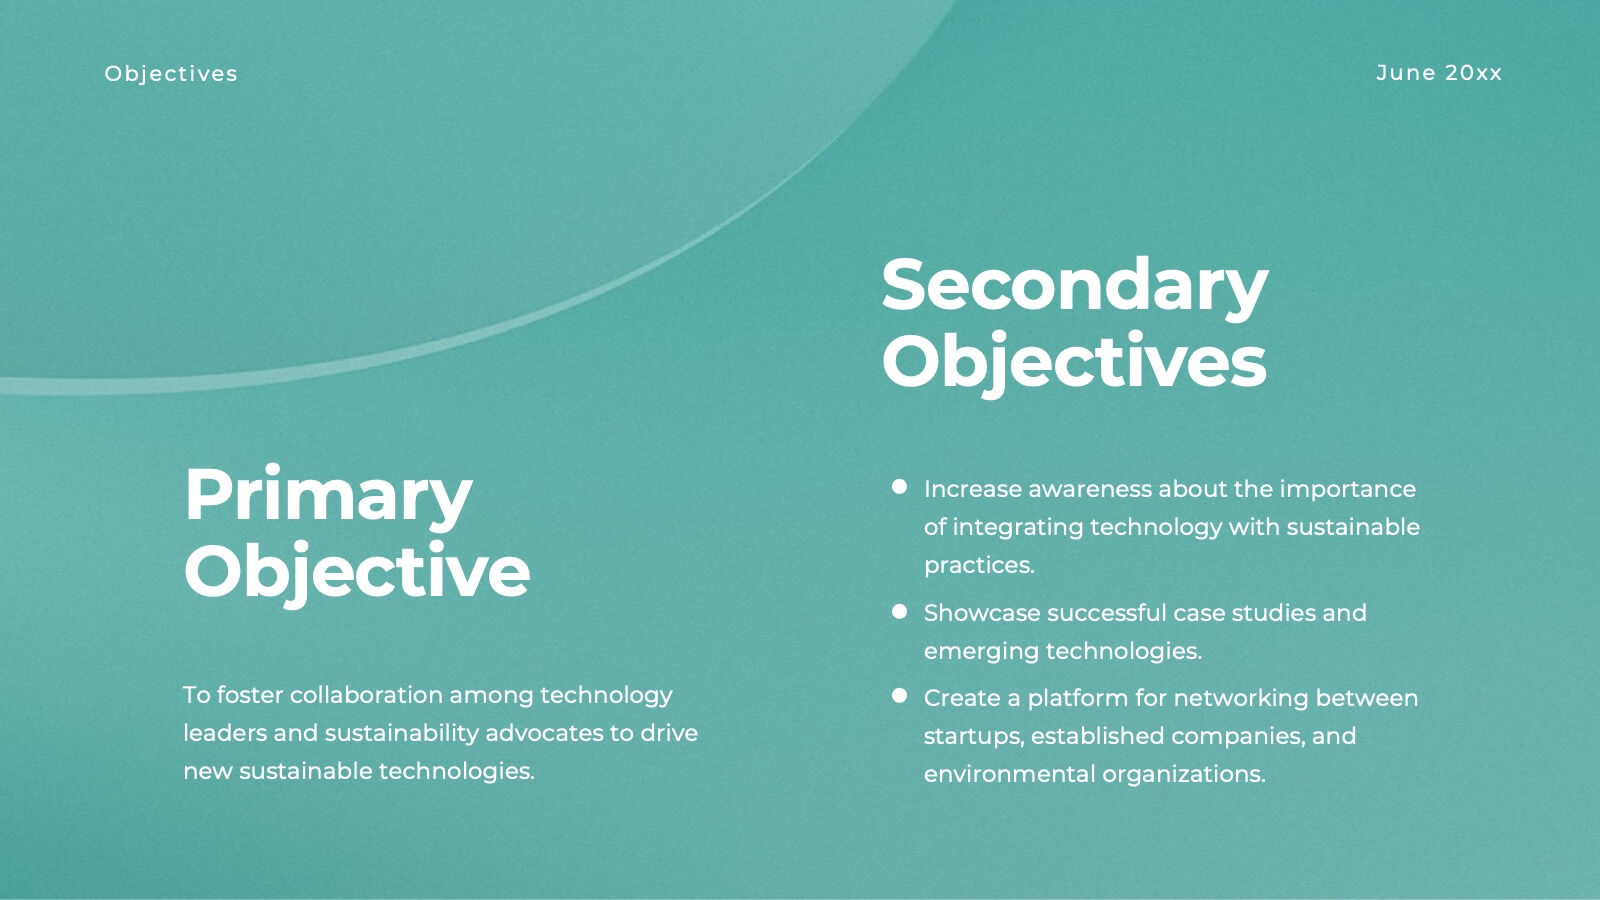
Halo Small Business Pitch Deck Presentation
Streamline your business presentations with this versatile pitch deck template! Ideal for conferences and meetings, it includes slides for objectives, session details, keynote speakers, and panel discussions. Keep your audience engaged with professional design and clear, structured content. Compatible with PowerPoint, Keynote, and Google Slides for seamless presentations on any platform.


5 slides
RACI Role Assignment Matrix Overview Presentation
Clarify team responsibilities with the RACI Role Assignment Matrix Overview Presentation. This professional template helps define who is Responsible, Accountable, Consulted, and Informed across key project tasks. Perfect for streamlining communication, reducing overlap, and improving accountability. Fully editable in PowerPoint, Canva, and Google Slides.


5 slides
Employee and Team Performance Analysis Presentation
Visualize individual and team contributions with this clear and structured performance analysis template. Showcase key metrics, employee growth, and team achievements using easy-to-read layouts and progress indicators. Ideal for HR reports, performance reviews, and team evaluations. Fully editable in PowerPoint, Keynote, and Google Slides.


7 slides
PESTEL Framework Business Presentation
The "PESTEL Framework Business" presentation effectively utilizes a segmented color scheme to categorize different environmental factors impacting business strategy: Political, Economic, Social, Technological, Environmental, and Legal. Each segment is color-coded and designated space for text, making it easy to highlight how each factor can influence business operations and decision-making processes. This visual arrangement not only aids in easy comprehension but also allows for a systematic review of external factors, essential for strategic planning.


4 slides
Cost Breakdown Table Presentation
Make your numbers speak with style using a clean, structured layout that simplifies pricing and cost analysis. This presentation is perfect for comparing plans, budgets, or expenses in a clear and visually engaging way. Fully editable and compatible with PowerPoint, Keynote, and Google Slides.


10 slides
Key Business Insights Executive Summary Presentation
Showcase your strategic insights effectively with the 'Key Business Insights Executive Summary' template. This visually appealing tool highlights critical data points and metrics, enabling a clear presentation of business achievements and forecasts. Perfectly tailored for use in PowerPoint, Keynote, and Google Slides, it ensures your executive summaries are both comprehensive and compelling.


4 slides
Medical Theme Slides for Healthcare Presentation
Bring clarity and care to your data storytelling with this modern healthcare-themed presentation. Designed for hospitals, clinics, or medical professionals, it helps you present health data, research findings, and patient care insights with professionalism and trust. Fully customizable and compatible with PowerPoint, Keynote, and Google Slides for seamless editing.


4 slides
Governance Practices for Risk Mitigation Presentation
Break down your risk strategy with the Governance Practices for Risk Mitigation Presentation. This slide features a step-stair 3D block visual, ideal for illustrating layered compliance initiatives, control measures, and escalation paths. Perfect for corporate governance teams, compliance officers, and strategic risk planners. Fully editable in PowerPoint, Keynote, and Google Slides.


5 slides
Market Improvement Trends and Expansion in Oceania Map Presentation
Present your market insights with clarity using this Oceania-focused expansion map. Highlight four key regions with callouts and data pointers, ideal for tracking growth trends, regional strategies, or entry points. Fully editable and compatible with PowerPoint, Keynote, and Google Slides—perfect for strategic planning, investor decks, and regional market analysis.


20 slides
Uplift Content Marketing Pitch Deck Presentation
This content marketing presentation is designed to elevate your strategies to the next level! It covers everything from industry insights to the latest consumer behavior trends and SEO strategies. It helps streamline influencer marketing, data-driven approaches, and even includes sustainability in marketing. Perfect for PowerPoint, Keynote, and Google Slides presentations!


3 slides
Work from Home Setup and Productivity Plan Presentation
Ready to supercharge your productivity from your kitchen table to your couch office? This visual template helps you map out ideal remote work setups, task plans, and daily focus routines. Organize workspace essentials and time blocks in a clean, engaging format. Fully compatible with PowerPoint, Keynote, and Google Slides.


6 slides
Customer Loyalty Rewards Structure Presentation
Illustrate your brand’s customer retention strategy with the Customer Loyalty Rewards Structure presentation. This visually engaging template highlights reward tiers, perks, and loyalty card systems—perfect for showcasing how customers earn incentives over time. Ideal for marketing teams, retail businesses, and loyalty program proposals. Fully editable in PowerPoint, Keynote, and Google Slides.