


Features
- 8 Unique slides
- Fully editable and easy to edit in Microsoft Powerpoint, Keynote and Google Slides
- 16:9 widescreen layout
- Clean and professional designs
- Export to JPG, PDF or send by email


Do you have any questions?
Recommend


6 slides
Enterprise Loyalty Program Infographic
A loyalty program is a structured marketing strategy designed to encourage customers to continue doing business with a company or brand by offering various incentives, rewards, and benefits for their ongoing loyalty and repeat purchases. This infographic template is a visual representation of the key components, benefits, and features of a loyalty program designed for a large-scale business or enterprise. This template visually conveys the value of the program, encourages participation, and showcases the benefits that customers can enjoy by becoming loyal members. This is compatible with Powerpoint, Keynote, and Google Slides.


26 slides
Saam Presentation Template
Are you looking for a way to make your food presentation more fun and yummy-looking? Well, look no further! Our Saam food presentation template is just what you need. It's packed full of fun graphics and pictures of your food that will make your presentation look super tasty. And the best part? You can customize the photo layouts and charts to make your presentation look exactly how you want it with all the important information. So whether you're presenting your new restaurant to your investor, or showing your friends what you cooked for dinner this week, this template has got you covered.


5 slides
SEO and Funnel Tactics in Marketing Presentation
Showcase your digital strategy step-by-step with the SEO and Funnel Tactics in Marketing Presentation. Designed with a layered visual layout, this template helps you highlight up to five key stages of your marketing funnel—from awareness to conversion. Fully customizable in PowerPoint, Canva, Keynote, and Google Slides.


4 slides
Social Media Calendar Overview
Stay organized and consistent with your posting schedule using the Social Media Calendar Overview Presentation. This clean, visual weekly planner helps you map out daily content across multiple categories with color-coded bullets and structured columns from Monday to Sunday. Perfect for content teams, marketers, and freelancers managing multi-platform campaigns. Fully customizable in PowerPoint, Keynote, and Google Slides.


21 slides
Eldritch Product Roadmap Presentation
The Product Roadmap Presentation Template features 21 modern slides, including product overviews, features, pain points, technical specs, and marketing strategies. Its sleek gray-yellow design ensures professionalism. Perfect for startups or businesses, it’s fully customizable and compatible with PowerPoint, Keynote, and Google Slides, ideal for impactful product-focused presentations.


6 slides
Letter Recognition and Phonics Training Presentation
Make early learning visual and interactive with this clean, A-to-F phonics layout. Each letter icon is paired with editable text for sound associations, learning milestones, or steps in a language program. Great for educators, speech therapists, or early childhood presentations. Fully editable in PowerPoint, Keynote, and Google Slides.


23 slides
Pulse Project Status Report Presentation
This vibrant and sleek report template delivers a powerful visual impact while ensuring clear communication. Perfect for tracking progress, reviewing key metrics, and analyzing client feedback, it covers everything from project highlights to competitor insights. Compatible with PowerPoint, Keynote, and Google Slides, this template elevates every report presentation with professional flair!


26 slides
Denice Presentation Template
Denice is a creative template with a bold and professional look. This template has a chic, modern aesthetic that grabs attention and makes an impact on your audience. The colors are soft nudes which help keep the look clean and easy to read. The soft nudes are sure to catch your readers' attention without being overwhelming. The graphs, timelines and charts make this template perfect for promotional campaigns. In addition to its professional look, Denice also comes loaded with features and tools to help you reach your audience. Save time and effort by choosing the Denice template.


4 slides
Elegant Watercolor Background Presentation
Add a touch of sophistication to your presentation with soft watercolor textures that create a calming, professional atmosphere. Perfect for creative projects, proposals, or portfolios, this elegant design blends artistry with clarity. Fully compatible with PowerPoint, Keynote, and Google Slides for seamless customization and a refined visual finish.


8 slides
Product Development and Innovation
Break down your product journey with this modern step-by-step infographic. Ideal for startups, product managers, and innovation teams, this slide illustrates four stages—perfect for visualizing design thinking, MVP rollouts, or feature planning. Easily editable in PowerPoint, Keynote, and Google Slides.


6 slides
Customer Feedback Smile Rating Scale
Visualize customer satisfaction with this editable Smile Rating Scale Presentation. Featuring five emotive icons, it’s perfect for showcasing feedback, survey results, or performance reviews. Fully customizable in PowerPoint, Keynote, and Google Slides, it simplifies data presentation while adding a friendly, professional touch to your report or presentation.


4 slides
Financial Budget Forecasting
Visualize your budget like never before with this clean, data-friendly layout designed to simplify your forecasting. The infographic-style graphics help break down financial estimates, expenses, and revenue projections into clear sections, making it ideal for reports or investor meetings. Compatible with PowerPoint, Keynote, and Google Slides.


6 slides
Eco-Initiatives and Sustainability Efforts Presentation
Highlight your green strategy with the Eco-Initiatives and Sustainability Efforts Presentation. This template features a clean, icon-based layout to showcase up to six key eco-friendly actions or goals. Ideal for CSR reports, environmental planning, or internal sustainability updates. Fully editable in PowerPoint, Google Slides, and Canva.


6 slides
User Experience Rating System Presentation
Evaluate user satisfaction with this user experience rating system template! Designed to visually represent feedback levels, this structured layout helps businesses analyze customer experiences, identify strengths, and address pain points. Perfect for UX research, surveys, and performance assessments. Fully customizable and compatible with PowerPoint, Keynote, and Google Slides


4 slides
Healthcare Medical Infographic Presentation
Bring your healthcare insights to life with a clean, calming design that makes complex medical data easy to follow. This presentation highlights key health metrics, patient information, and wellness topics using simple visuals and structured layouts for clarity. Fully compatible with PowerPoint, Keynote, and Google Slides.


21 slides
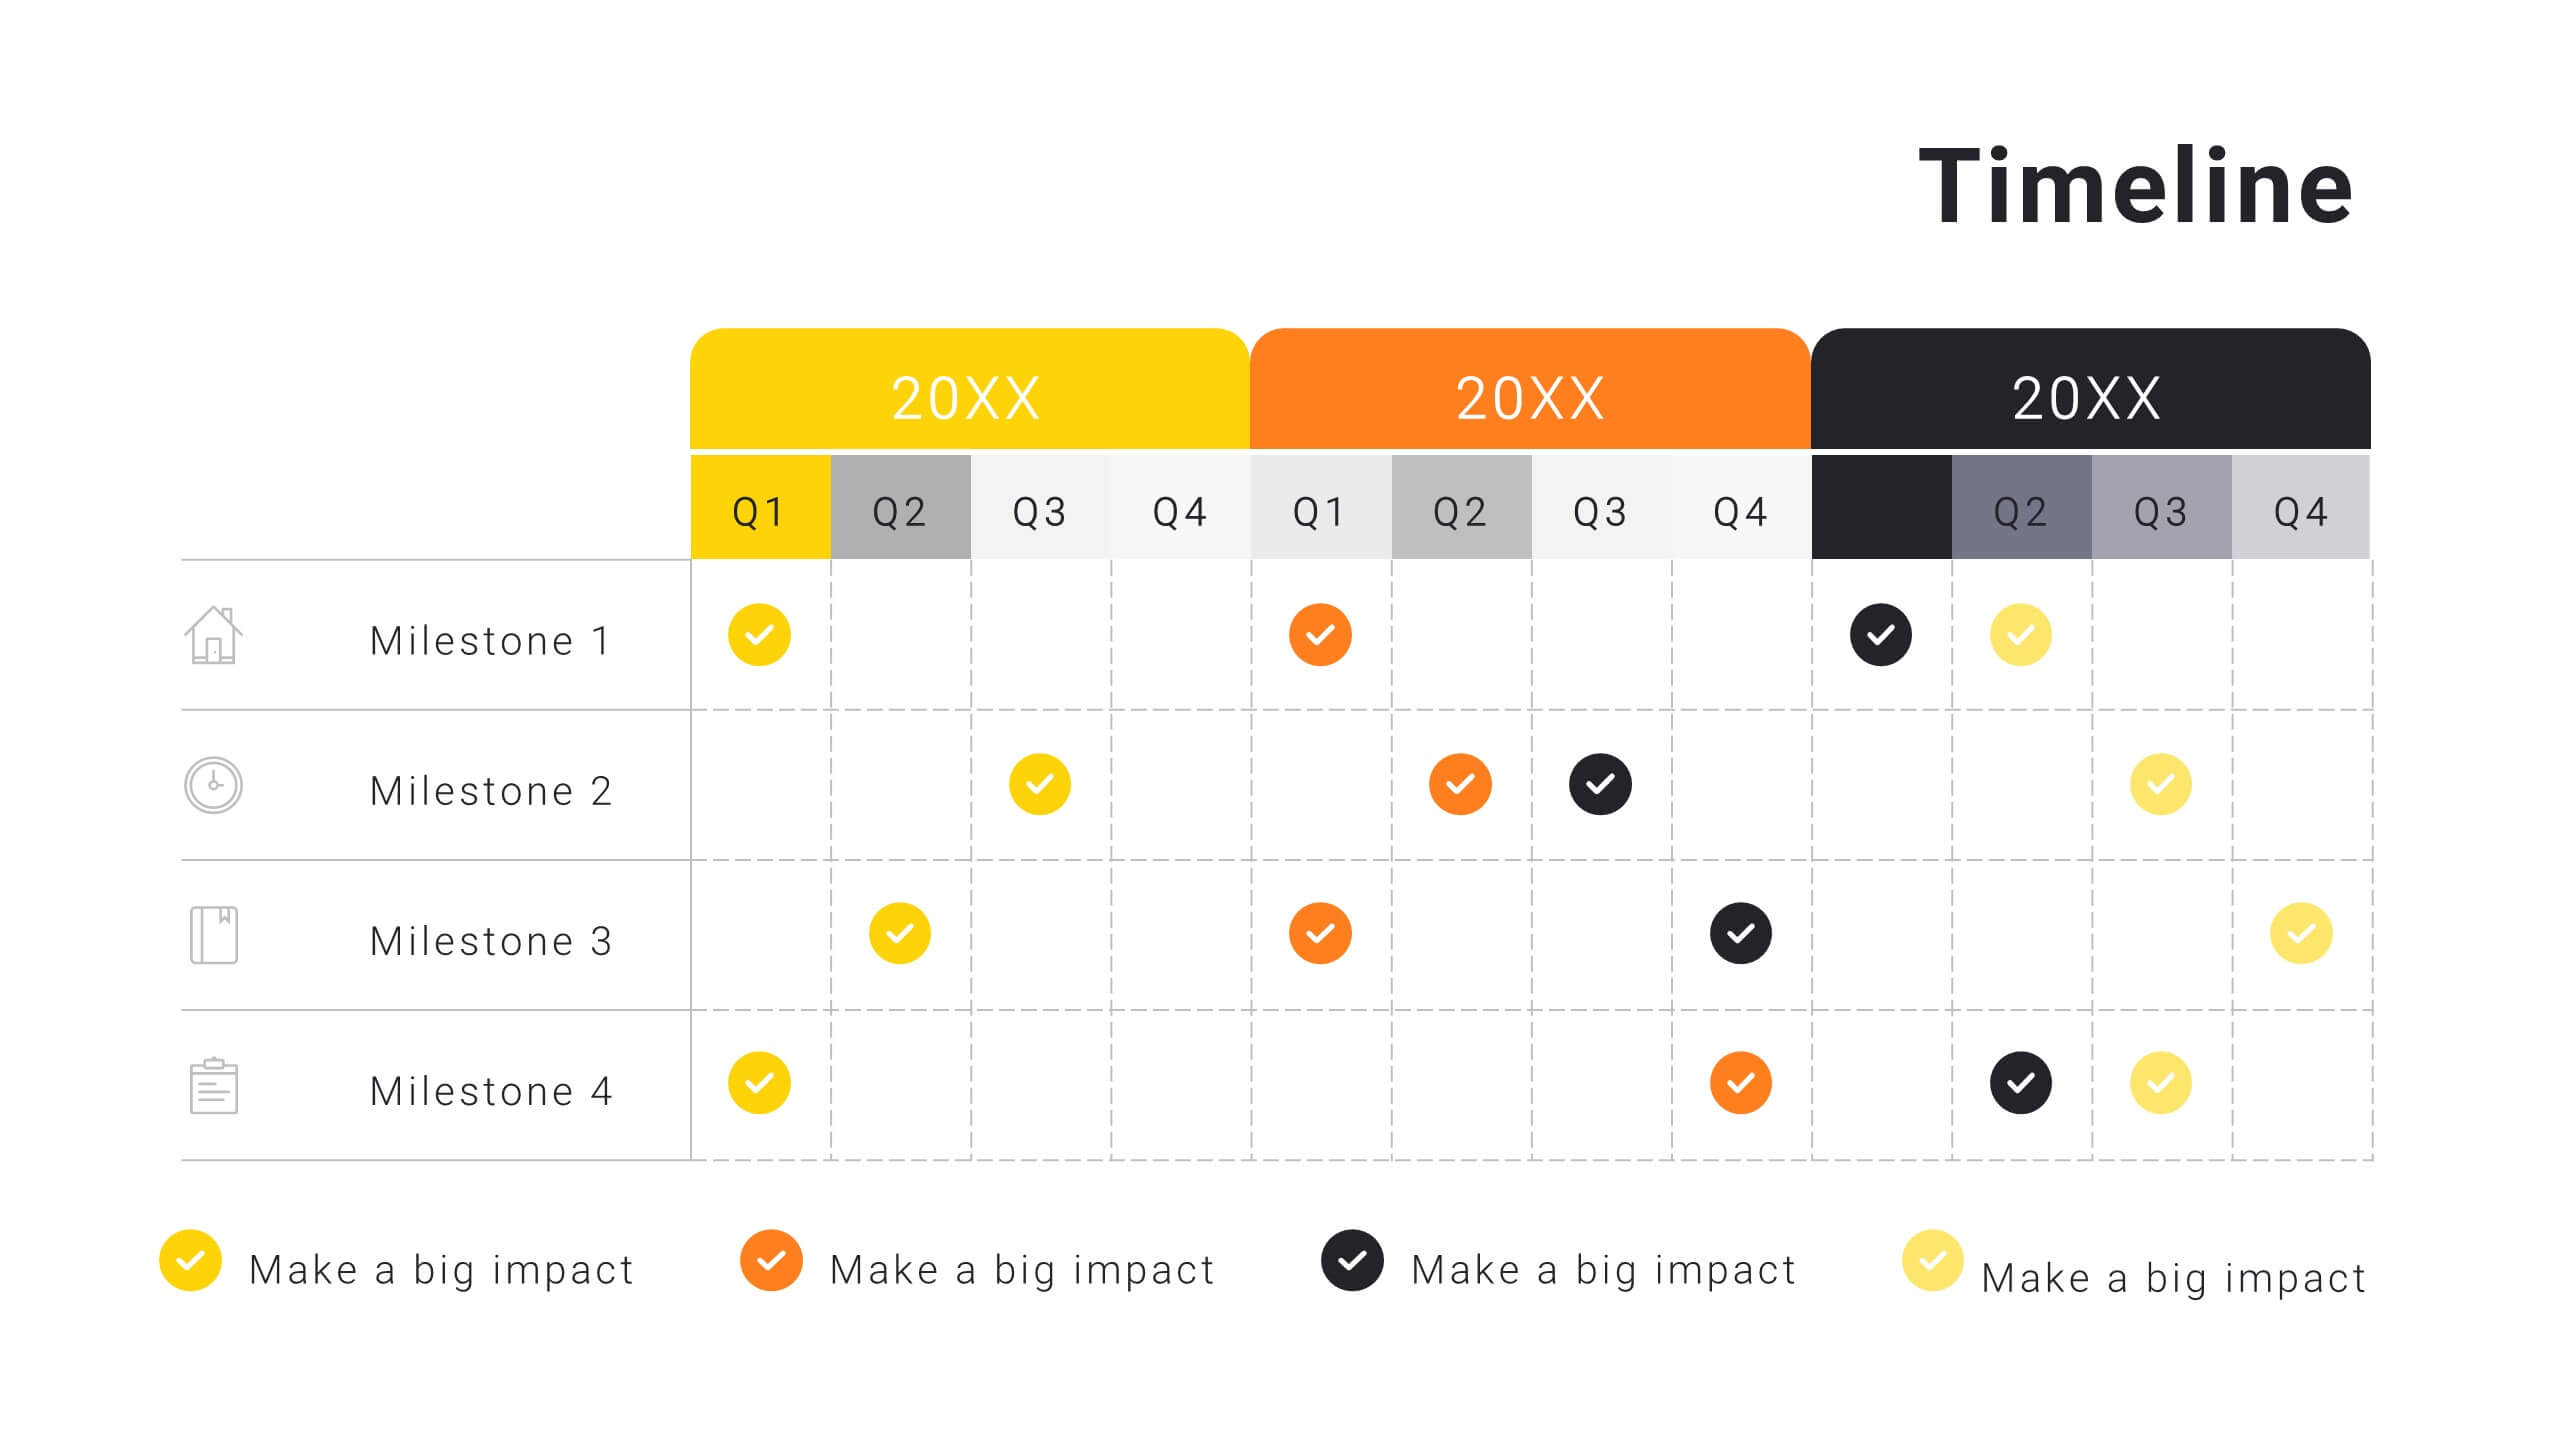
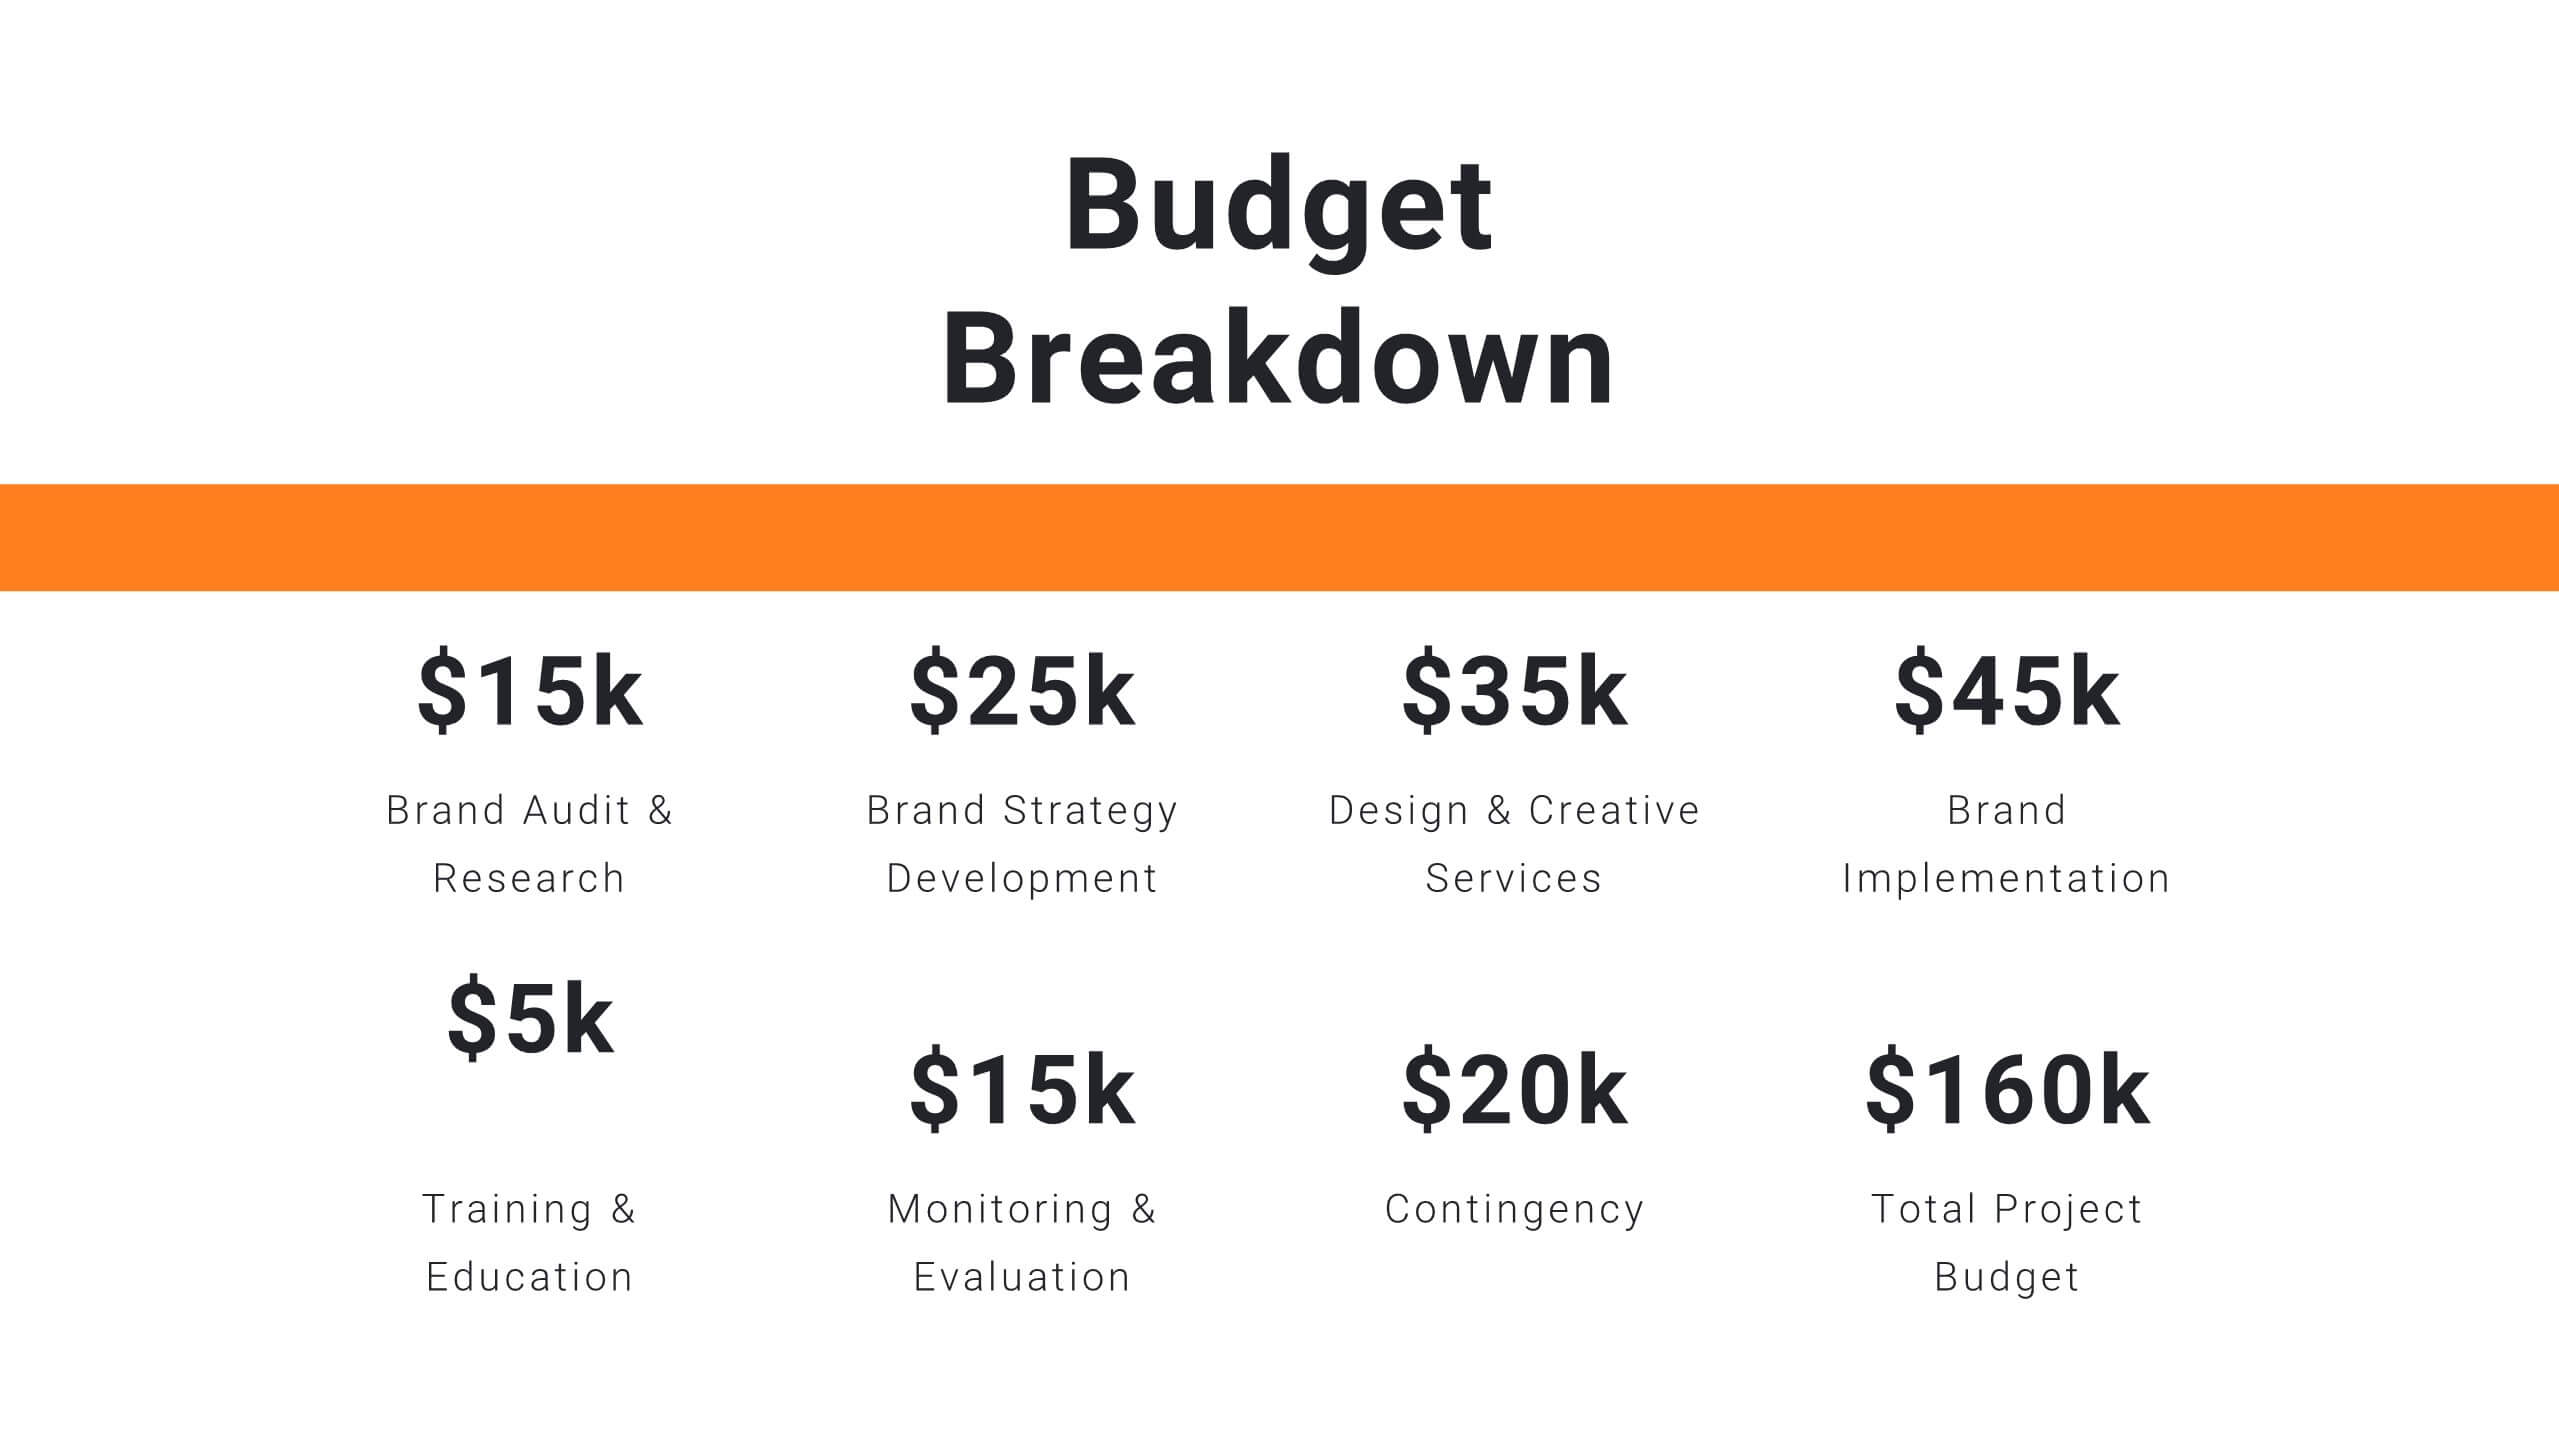
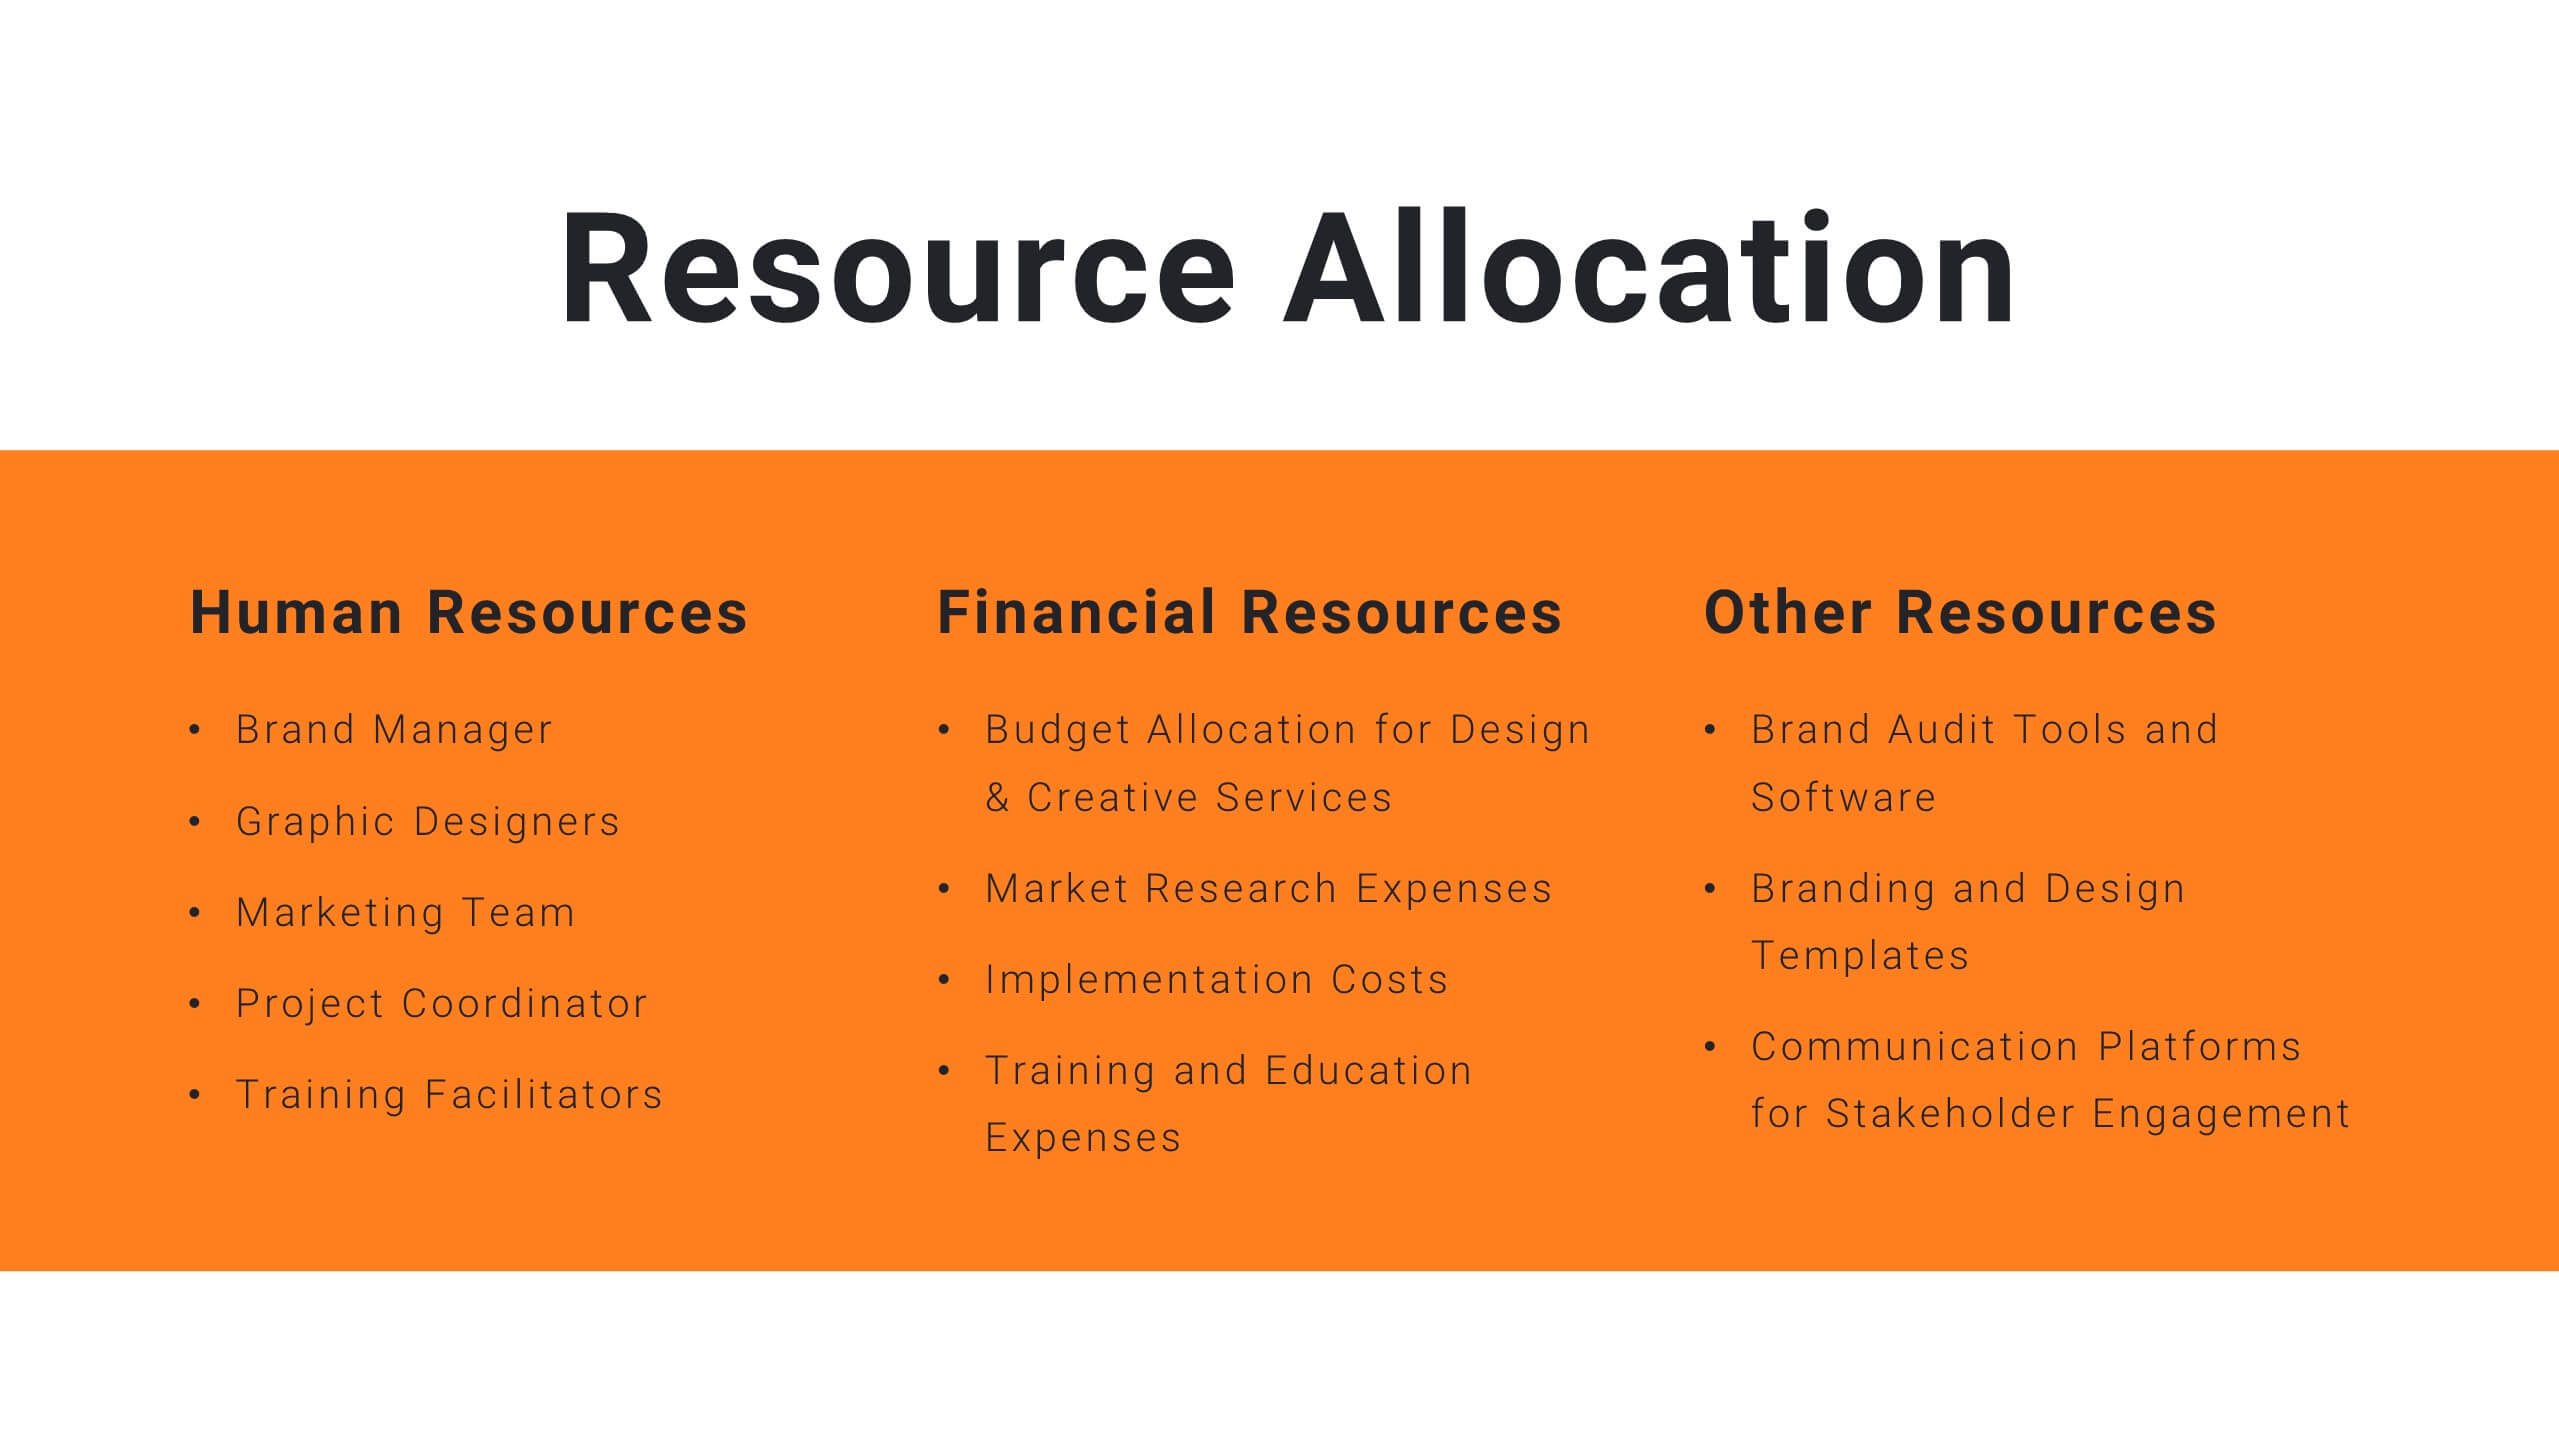
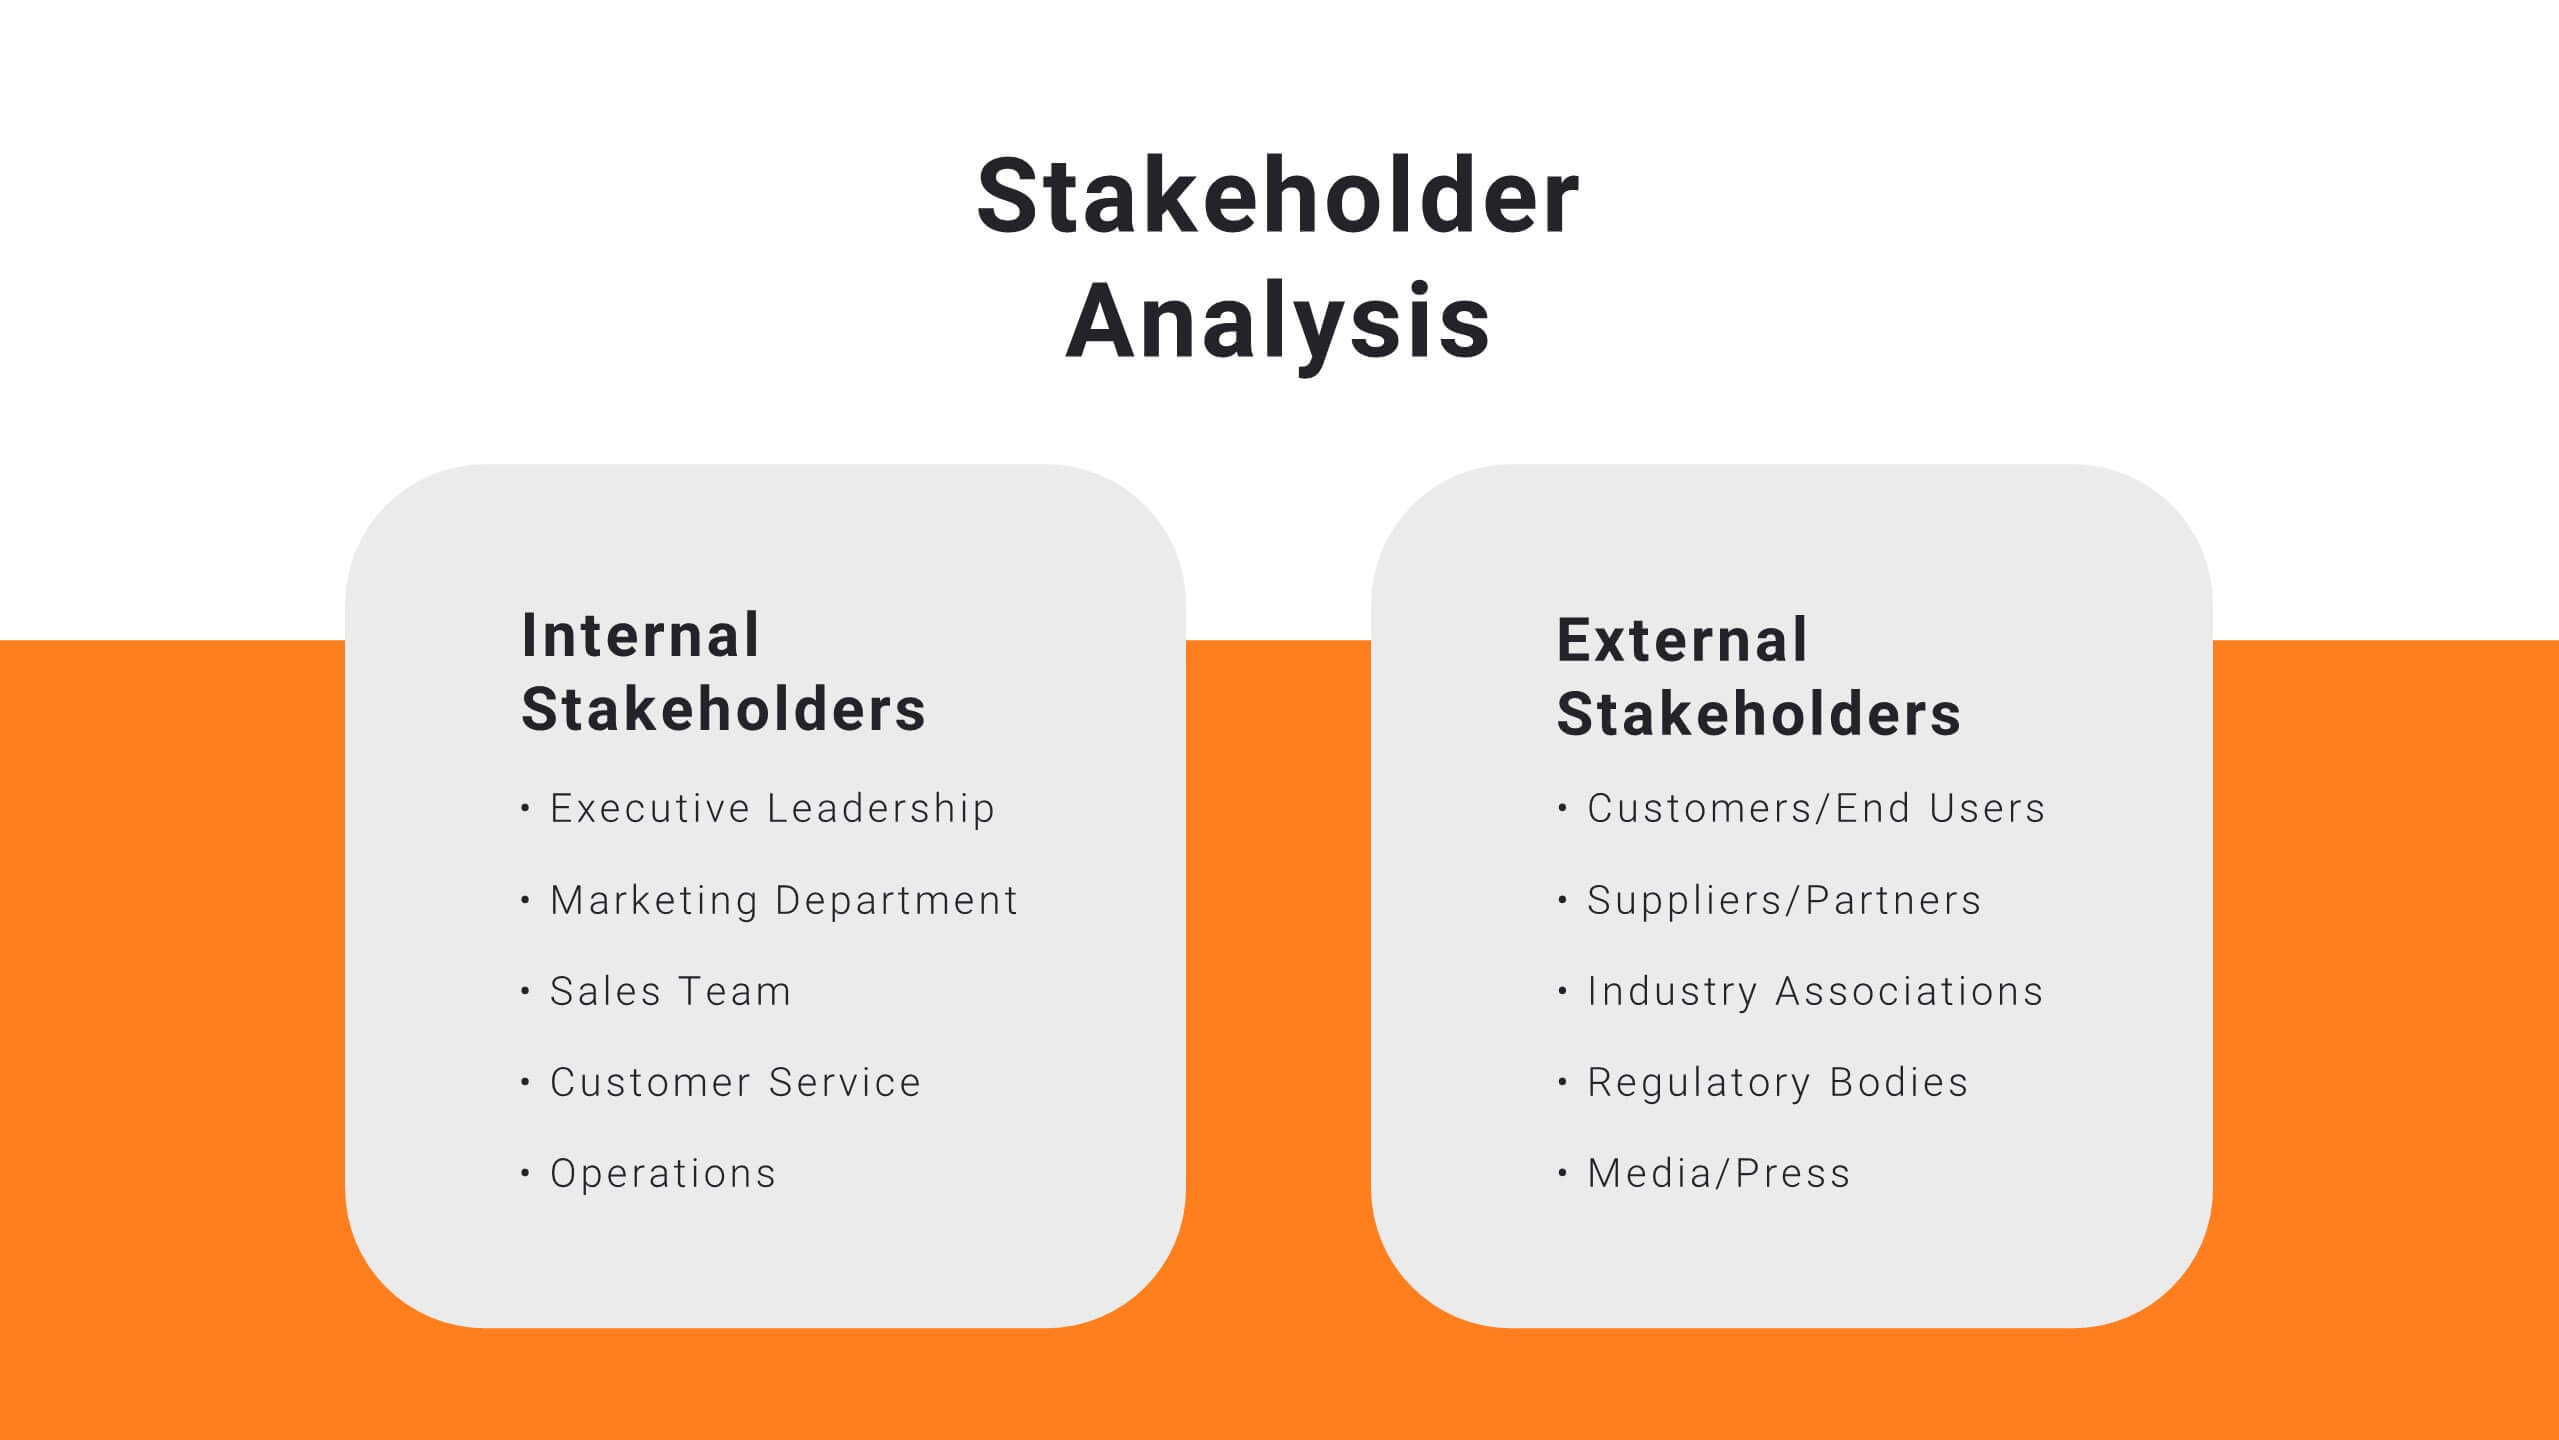
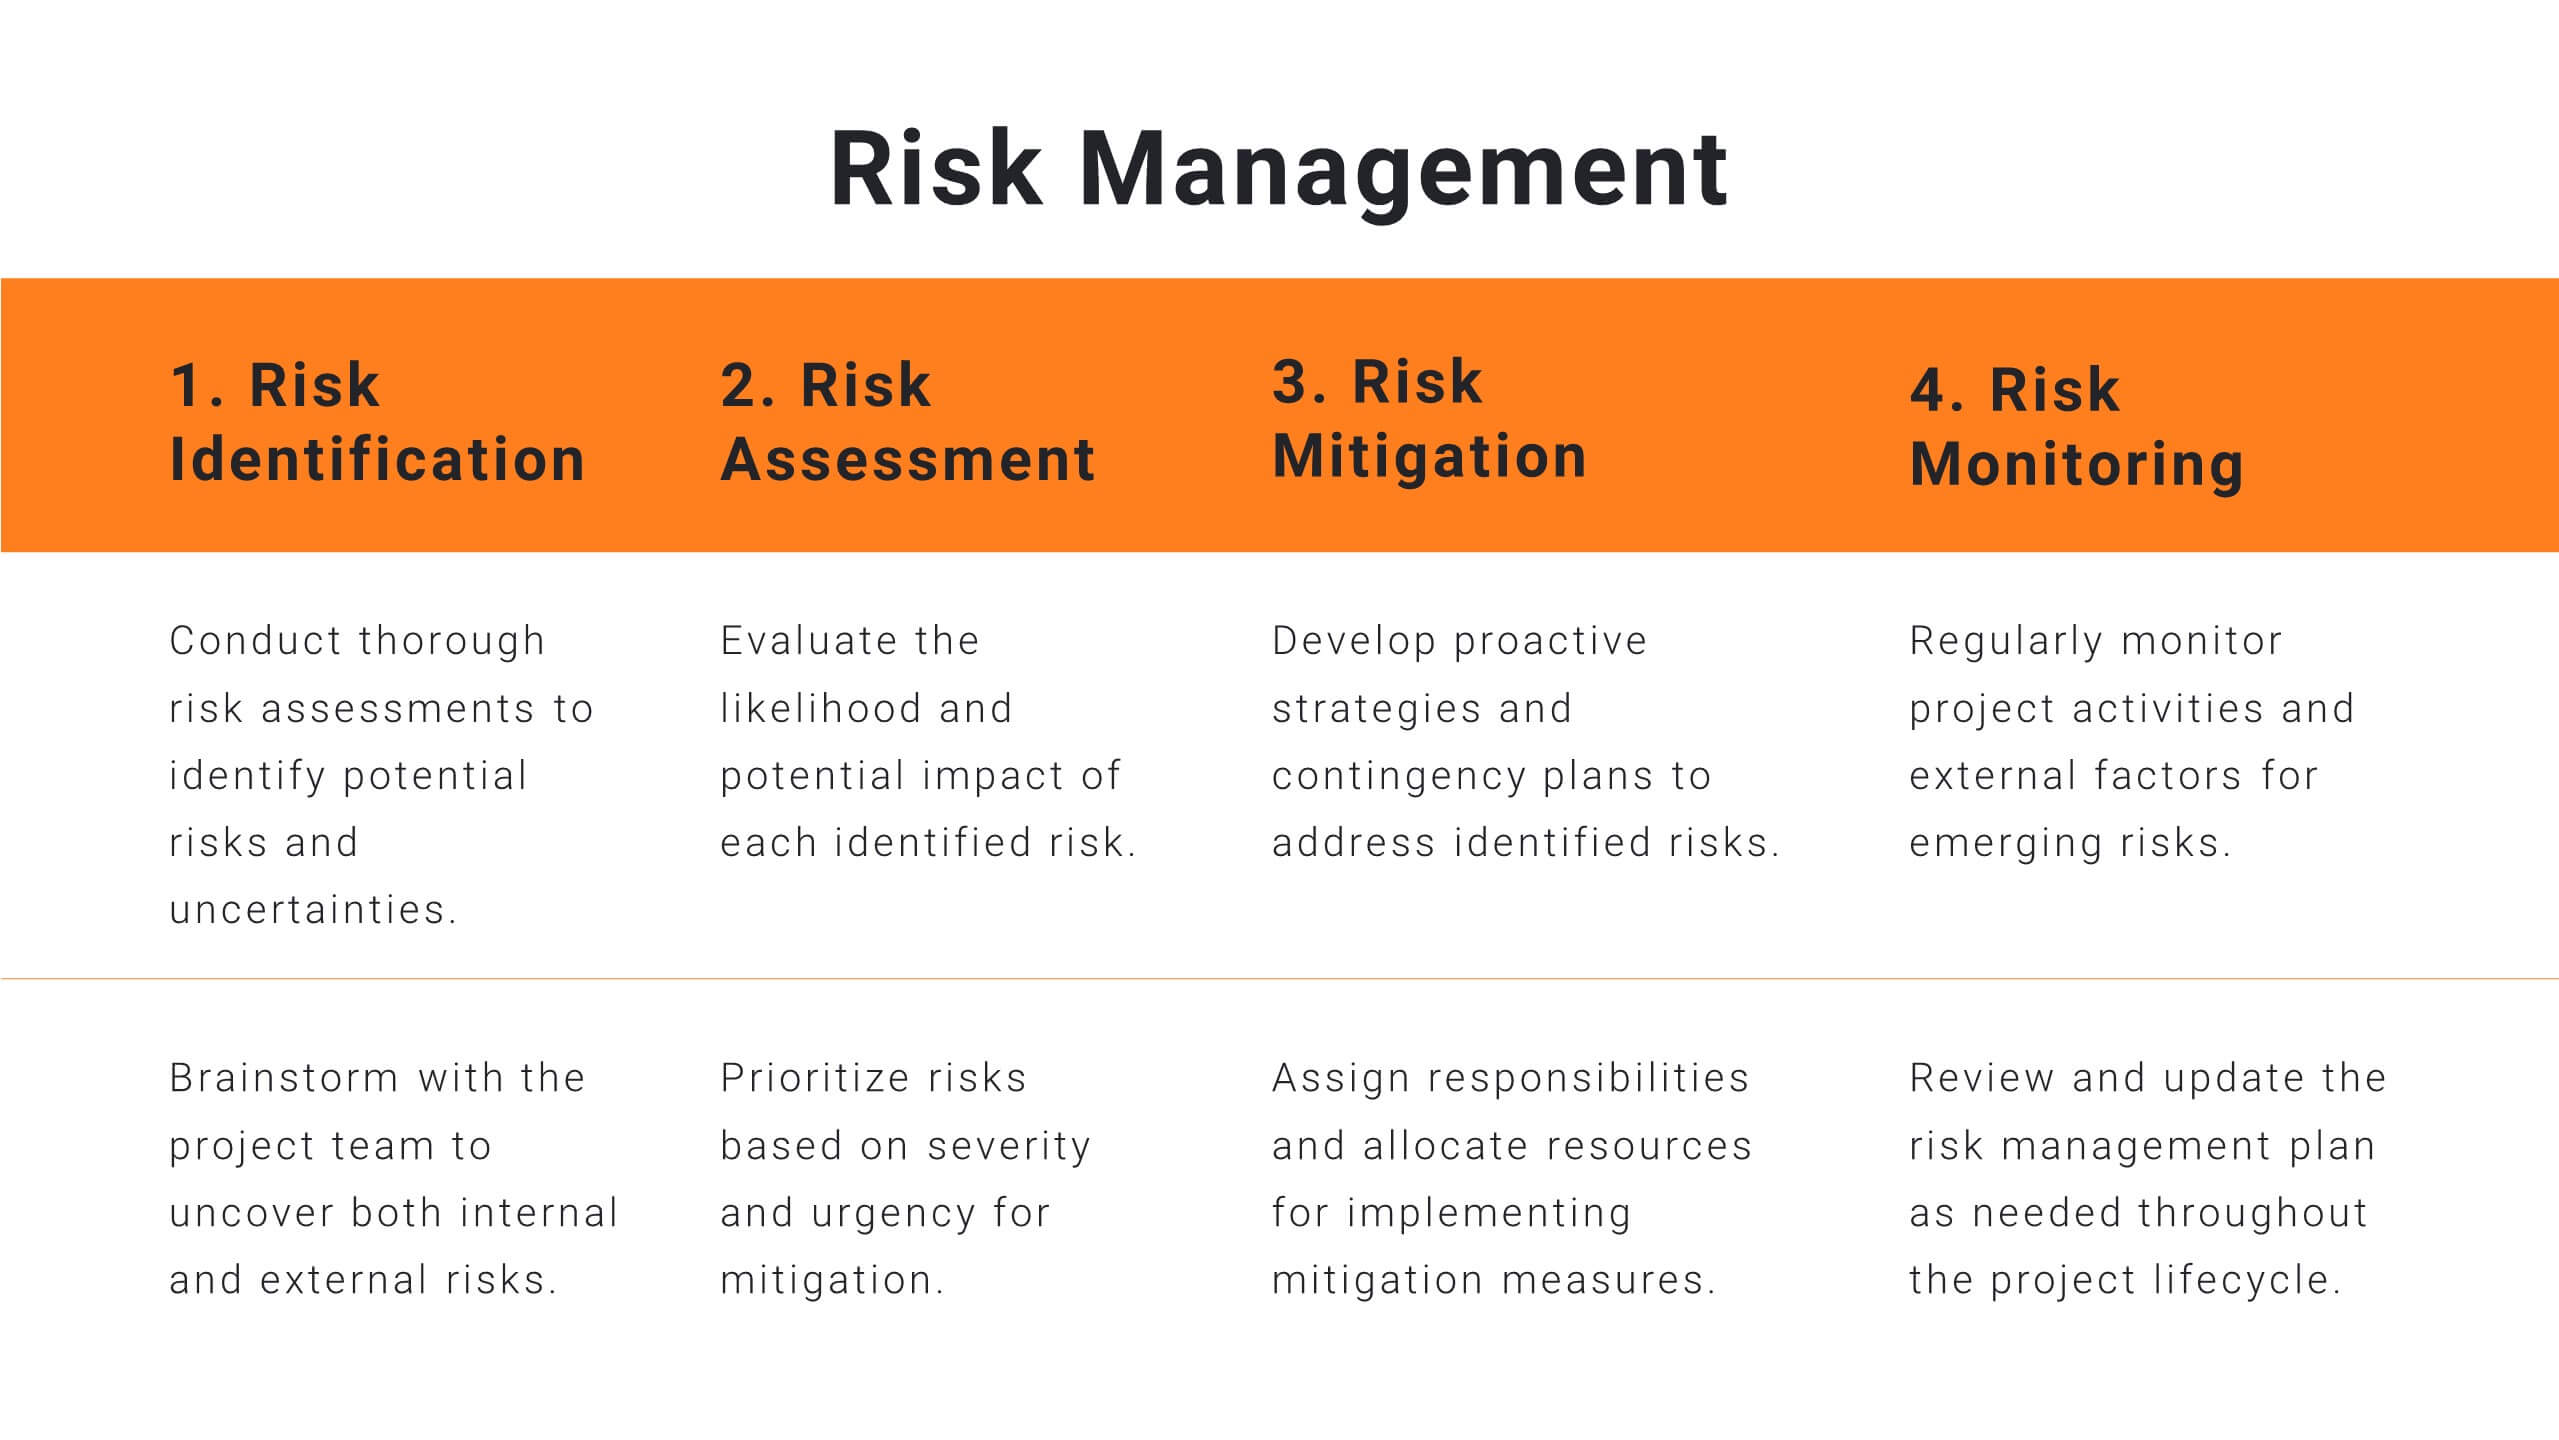
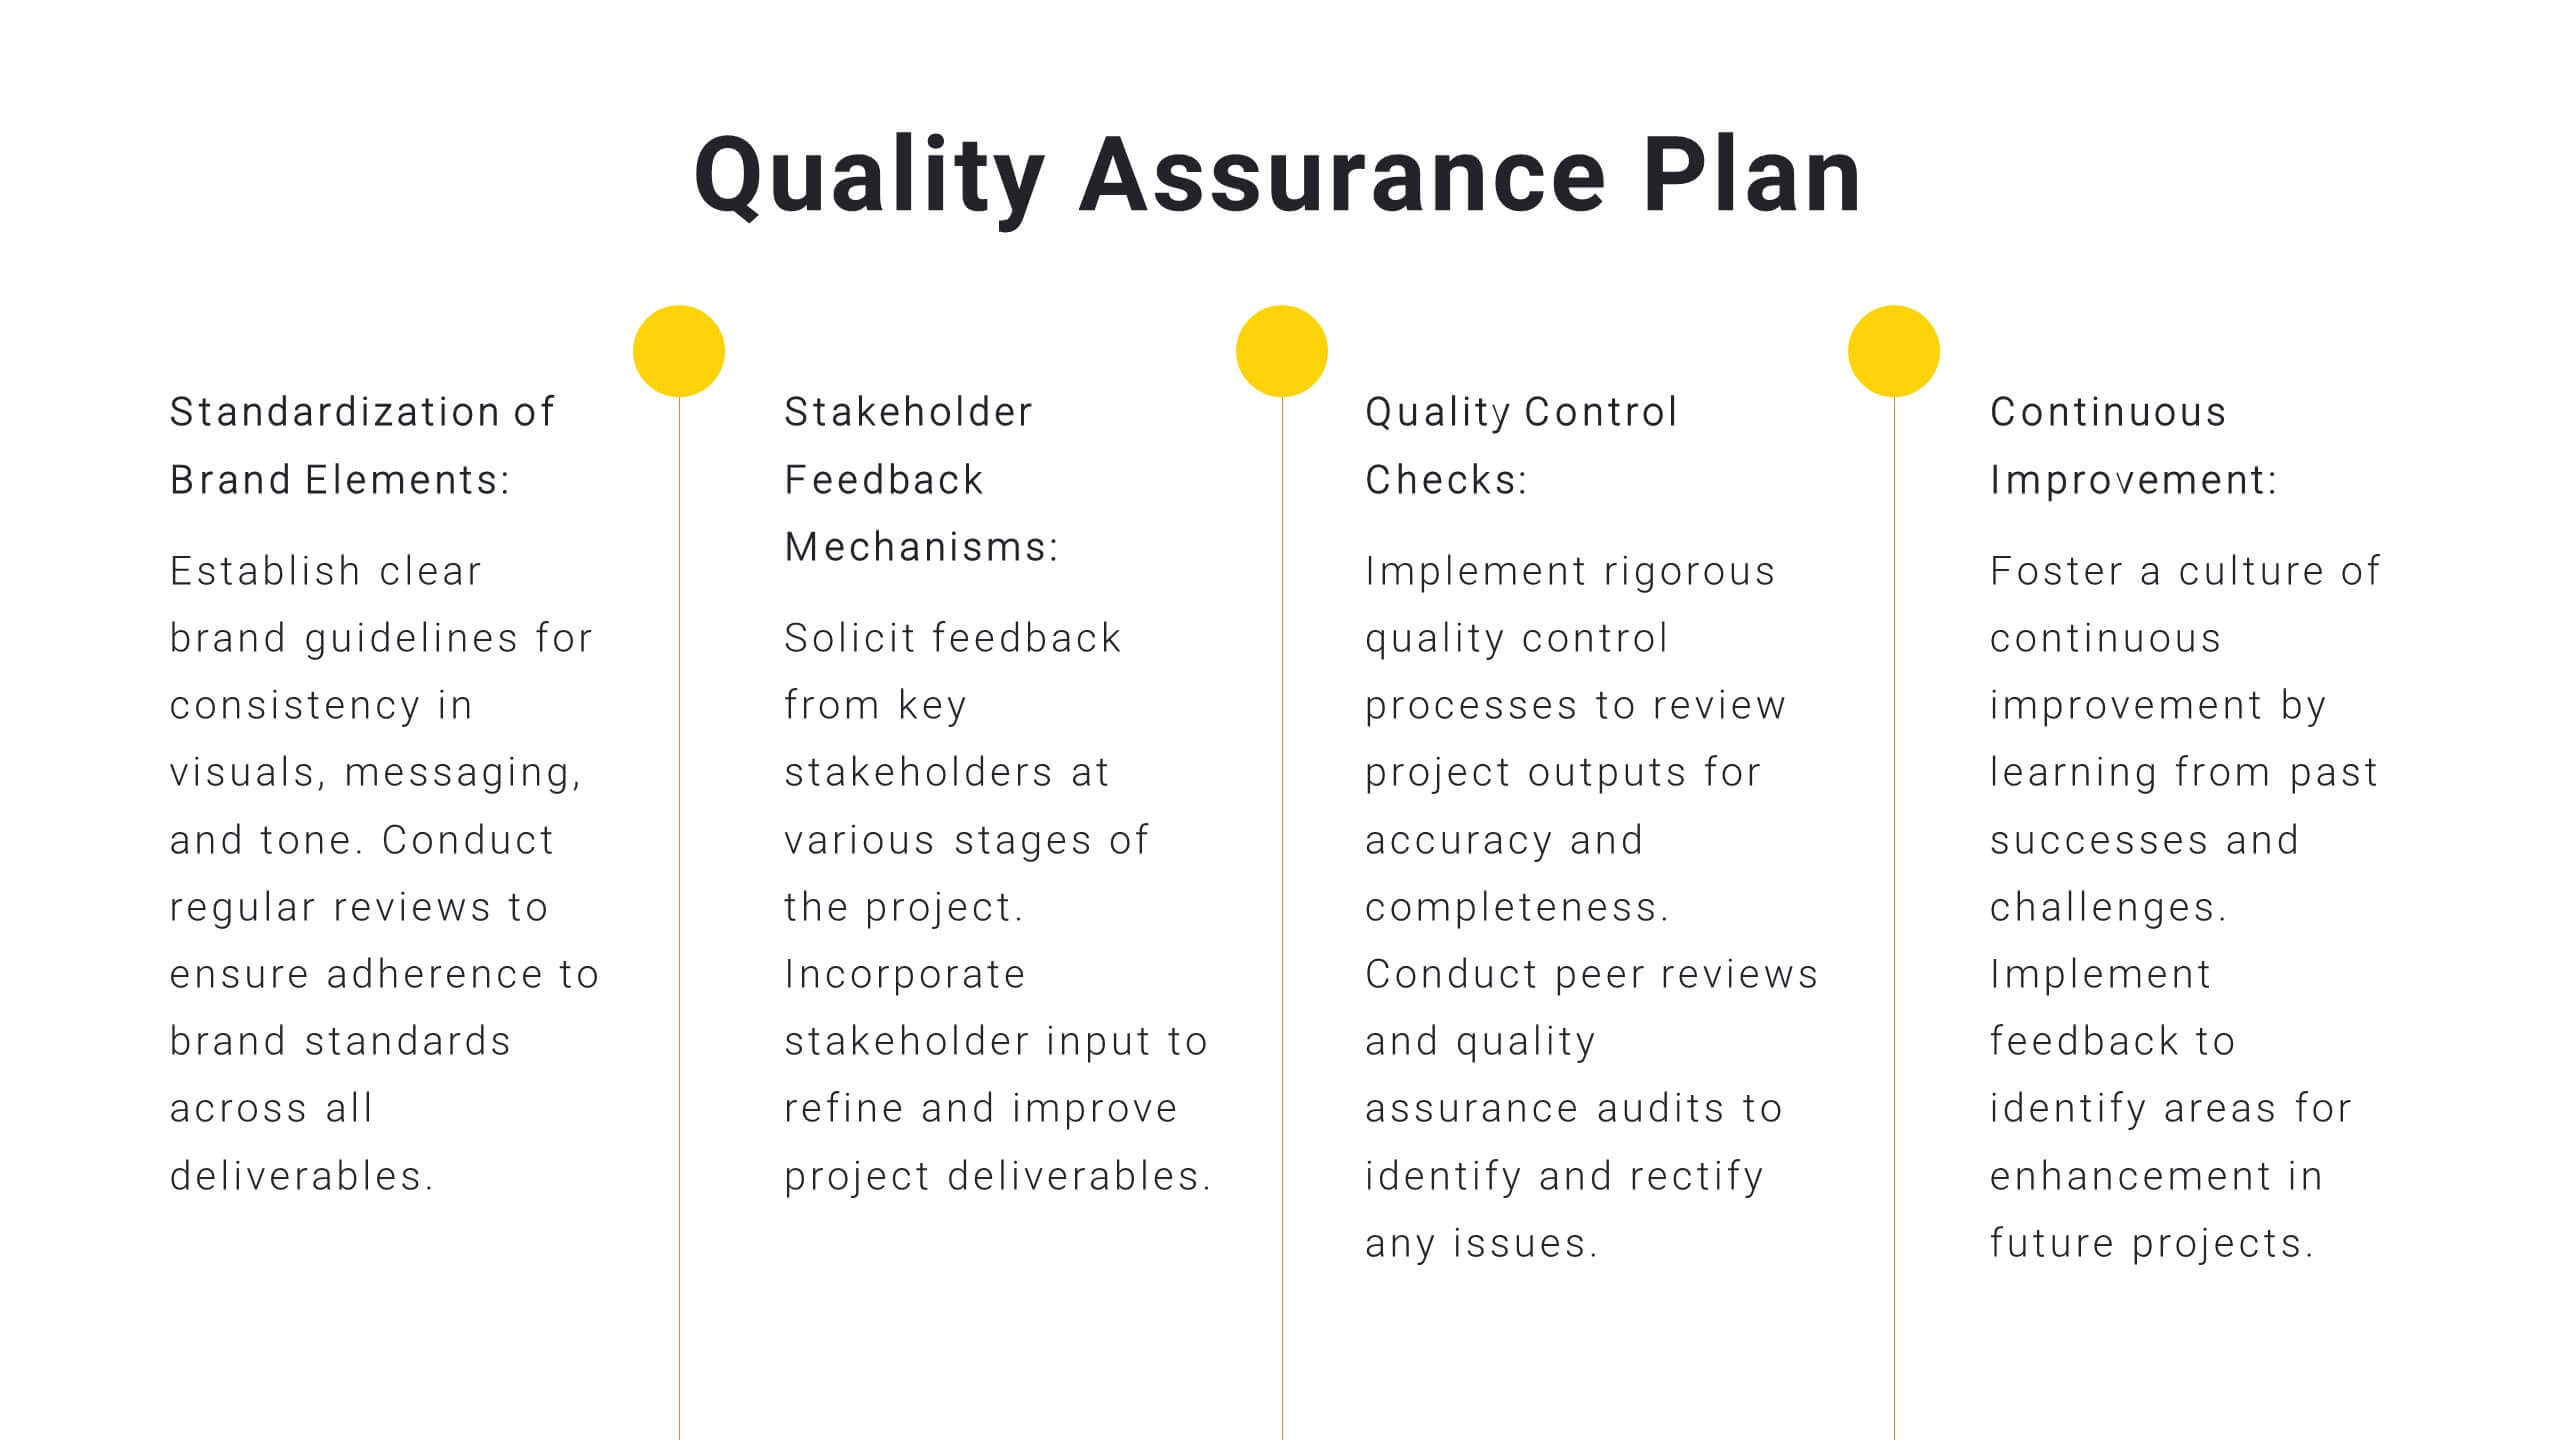
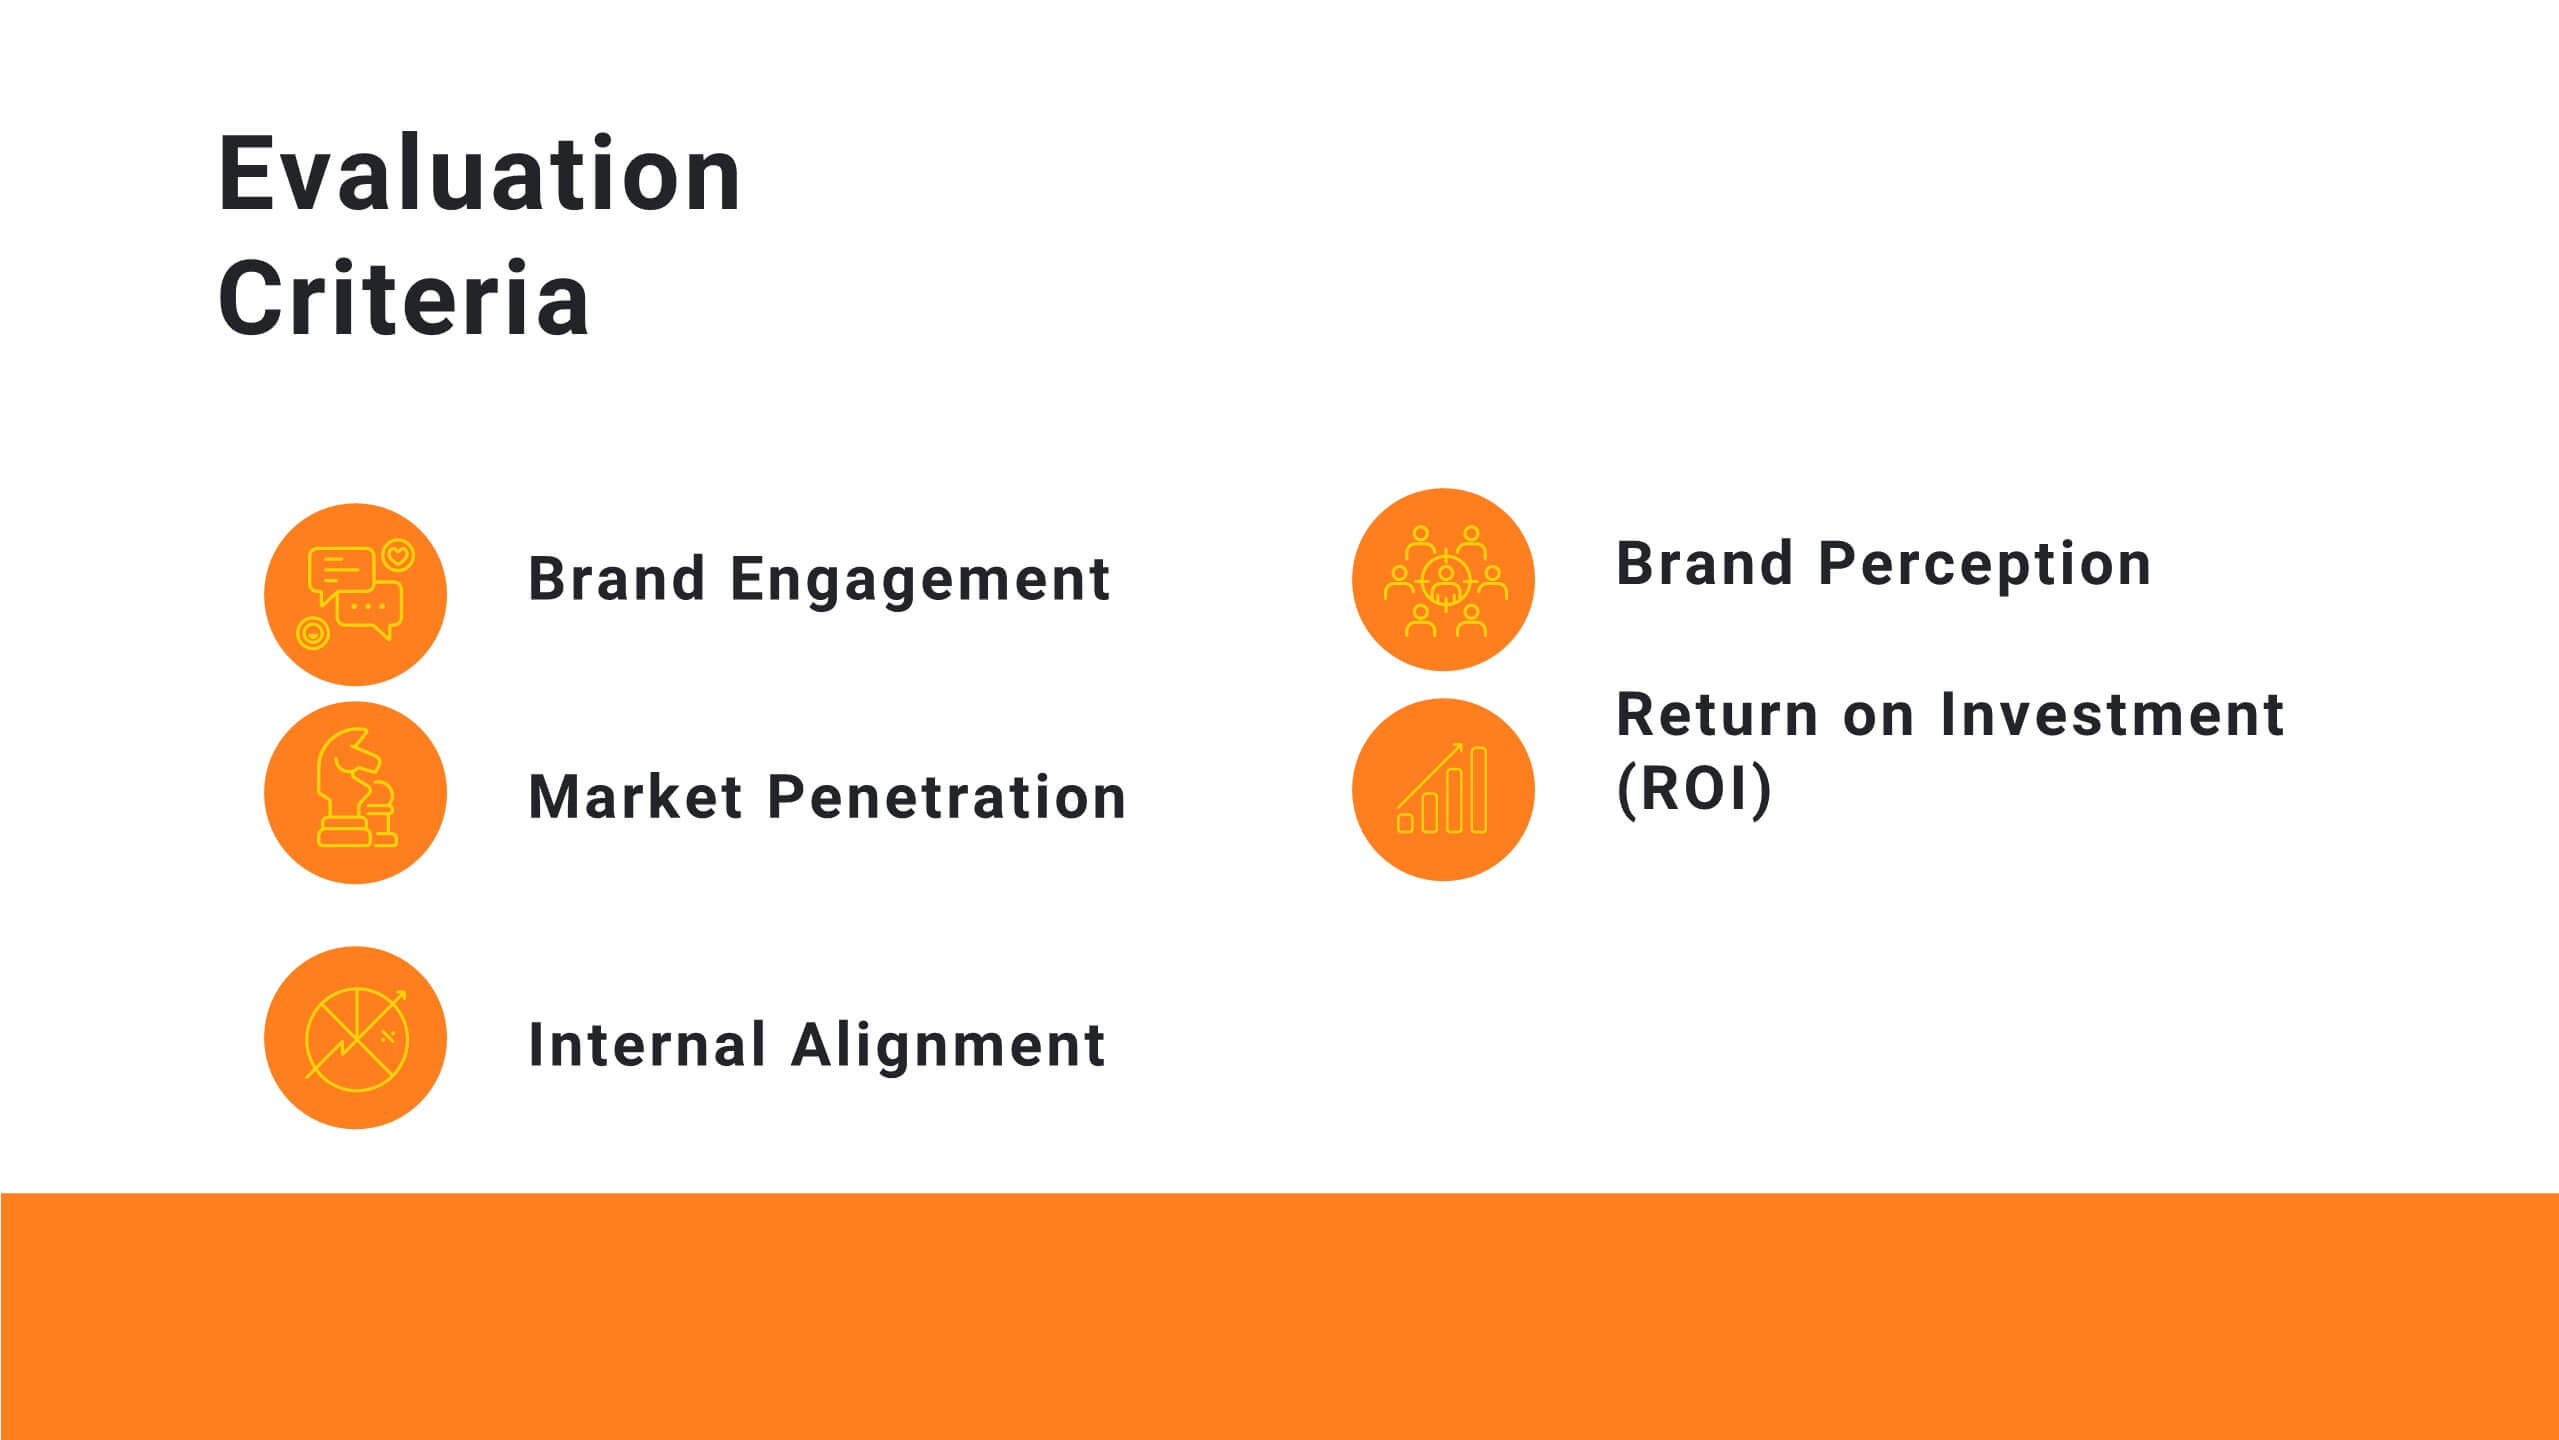
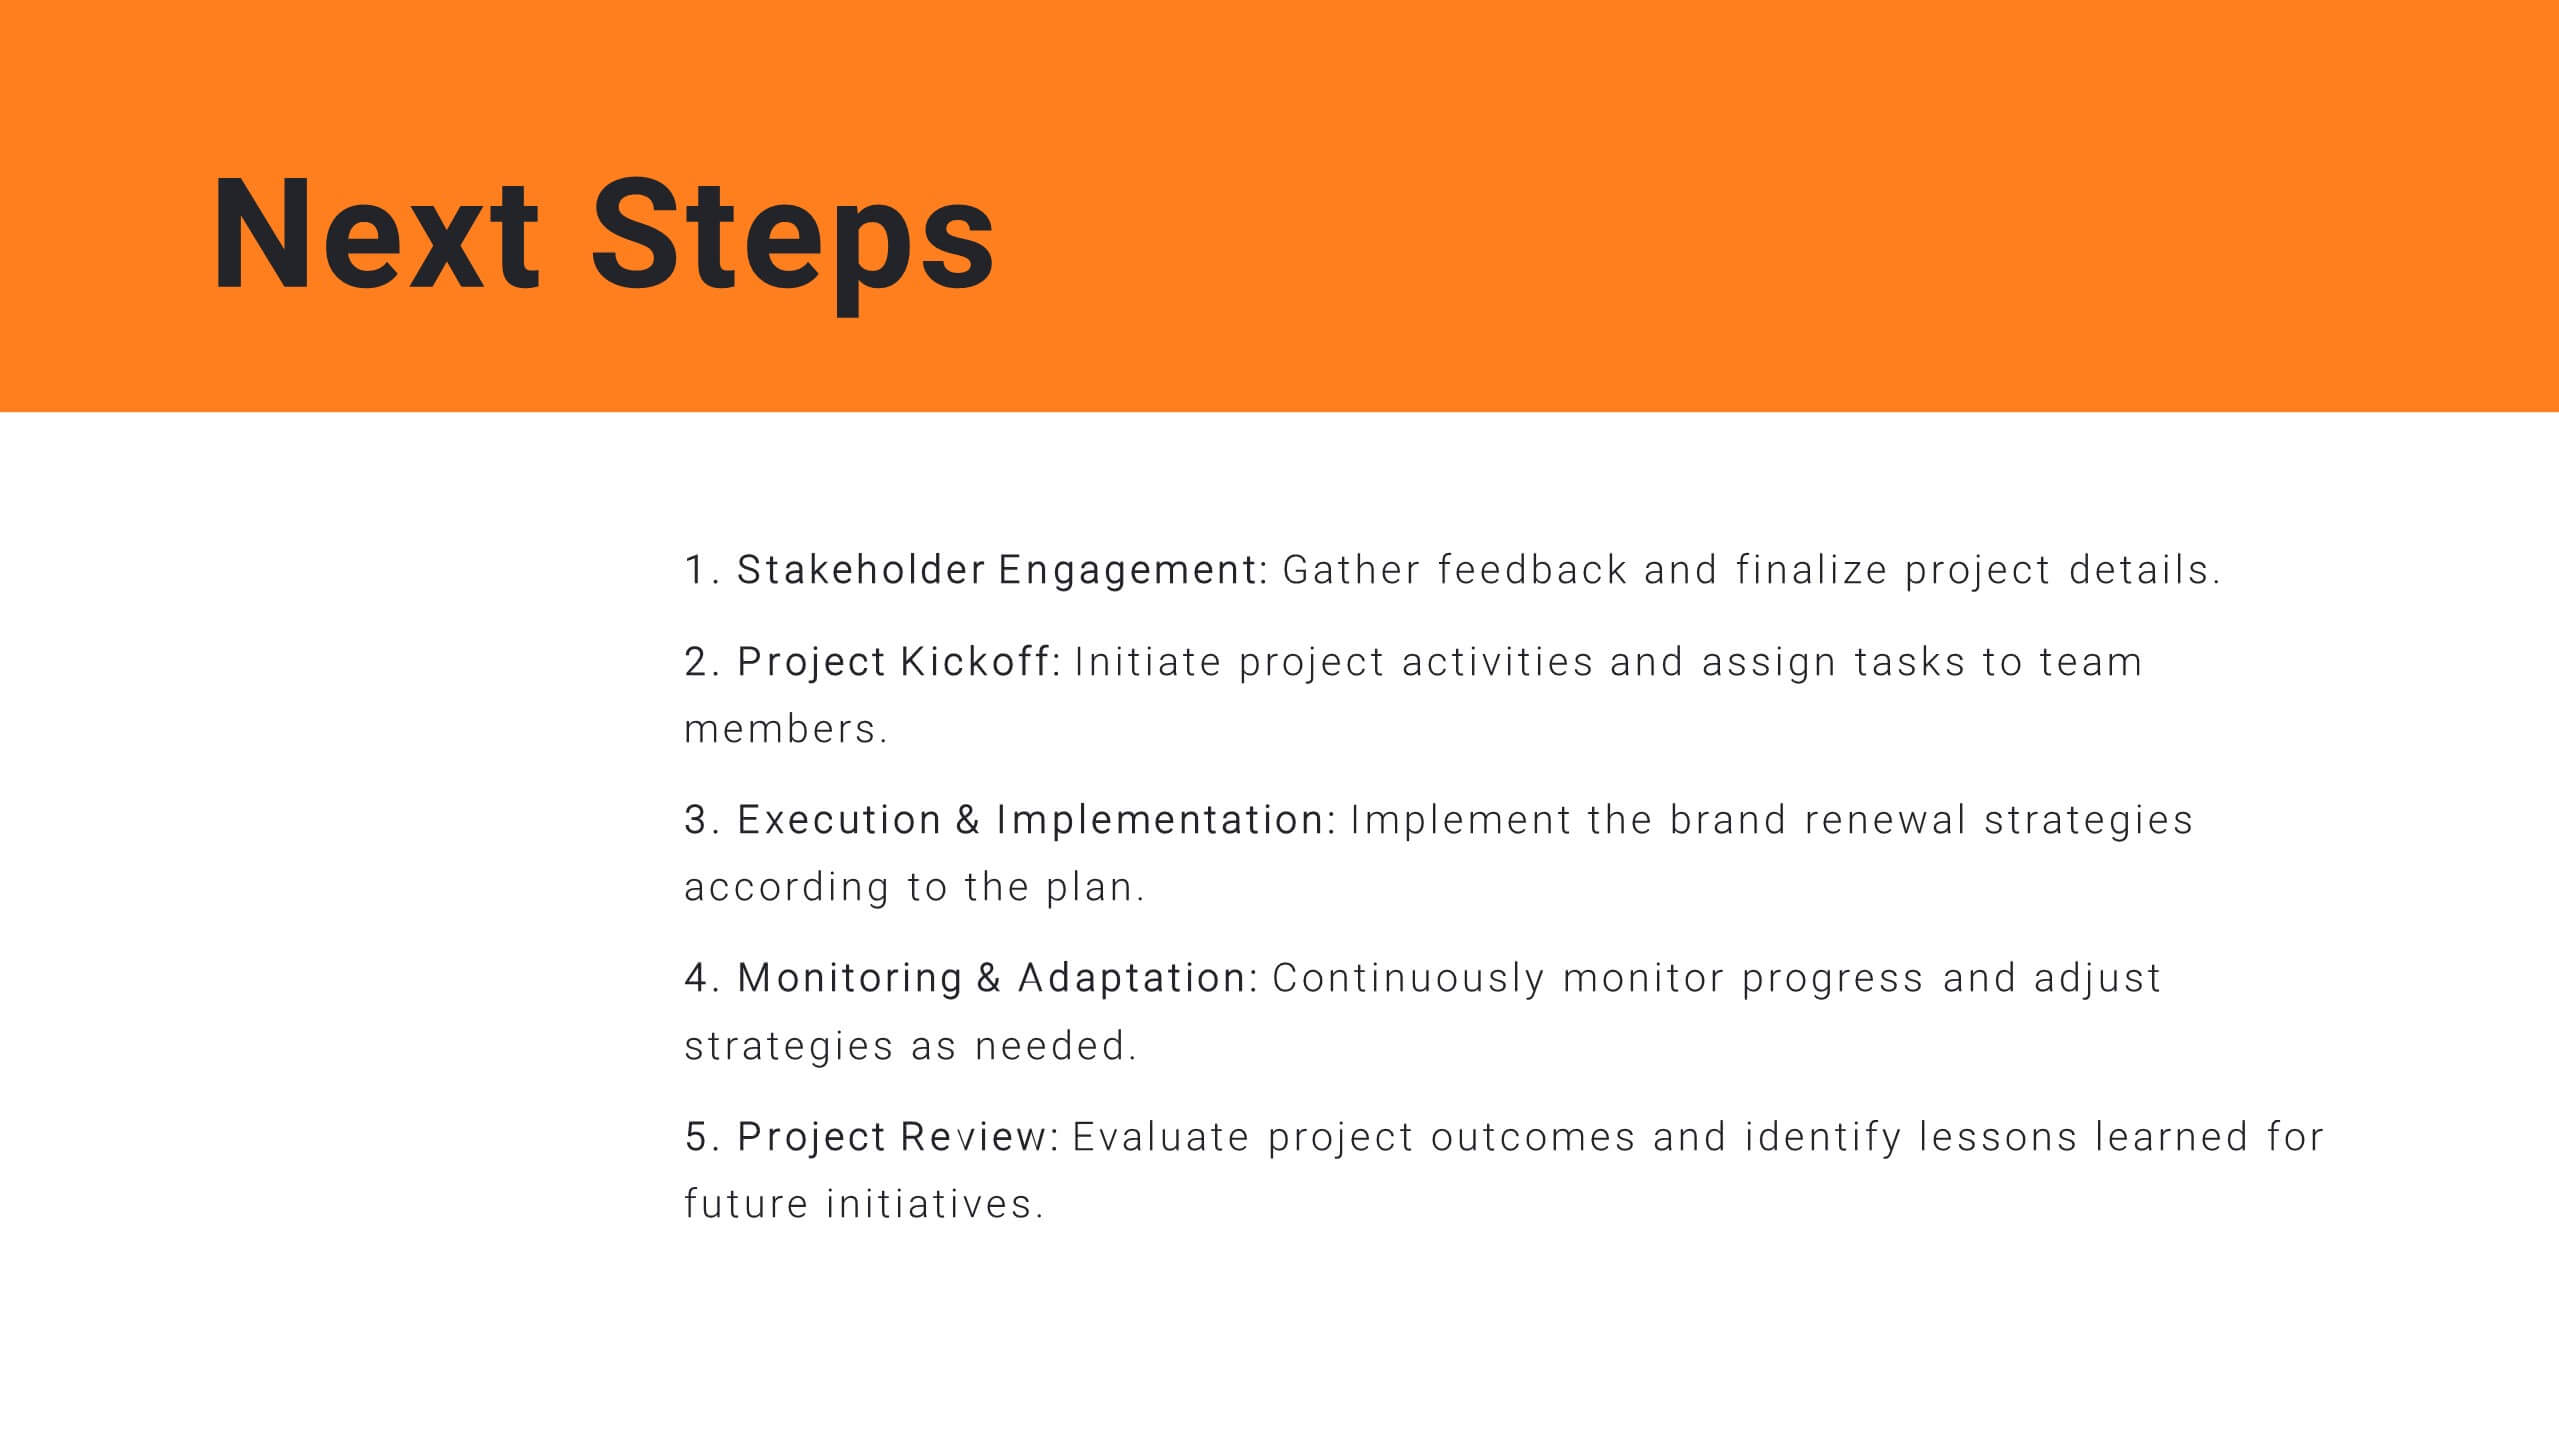
Harmony Project Management Plan Presentation
Plan your project efficiently with this comprehensive project management plan template! It covers all essential aspects including timeline, budget, resource allocation, and risk management. Ensure smooth project execution and achieve your objectives. Compatible with PowerPoint, Keynote, and Google Slides, it's designed to streamline your project planning and management process.


6 slides
World Map Biomes Infographics
The "World Map Biomes" infographic template is a visually stunning and educational tool, expertly designed for PowerPoint, Keynote, and Google Slides. This template is a treasure trove for educators, environmentalists, and geographers aiming to provide a captivating geographical overview of the planet's diverse biomes. This template beautifully illustrates the Earth's varied biomes, from lush rainforests and arid deserts to tundra and coral reefs. Each biome is vividly represented, complete with key characteristics, flora and fauna, and climate information. This makes it a powerful resource for educational programs, environmental awareness campaigns, and geographical studies. The design is as informative as it is visually appealing, with a color scheme that mirrors the richness and diversity of the Earth's ecosystems. This not only makes the presentation a feast for the eyes but also enhances the educational impact, engaging audiences of all ages in the wonders of our world's biomes. Whether used in a classroom, a seminar, or an environmental exhibit, this template ensures that the "World Map Biomes" are presented in an enthralling, informative, and visually spectacular manner.