


Features
- 4 Unique slides
- Fully editable and easy to edit in Microsoft Powerpoint, Keynote and Google Slides
- 16:9 widescreen layout
- Clean and professional designs
- Export to JPG, PDF or send by email


Do you have any questions?
Recommend


6 slides
Problem-Solving Framework for Business Success Presentation
Streamline your approach to complex challenges with this 6-step business problem-solving framework. This professional slide layout clearly separates each stage—from identifying the issue to implementing solutions—using easy-to-edit circular markers and concise content boxes. Ideal for consulting pitches, internal planning, or strategy development, this slide is fully customizable in PowerPoint, Keynote, and Google Slides.


6 slides
Porter's Five Forces Strategy Presentation
Give your competitive analysis a bold, intuitive flow with a clean layout that visually breaks down each force in a simple, strategic way. This presentation helps you highlight market pressures, evaluate risks, and support smarter decision-making with clarity and confidence. Fully editable and compatible with PowerPoint, Keynote, and Google Slides.


26 slides
Adlyn Presentation Template
Making low-calorie foods a part of your daily diet protect against the risk of heart disease, diabetes, and cancer. They make you feel full while reducing the daily calorie intake, which can help with weight loss. The Adlyn template is a concise, easy-to-use template that’s designed to help you inform your audience on the importance of low-calorie foods. This template is perfect for site builders, food bloggers, and writers looking to create informative content on food facts and healthy living. Using Adlyn you can add daily tips about nutrition and exercise along with a list of healthy foods.


6 slides
Post Office Scenes Infographics
The "Post Office Scenes" infographic template, designed for PowerPoint, Keynote, and Google Slides, is an ideal tool for postal services, logistics companies, and educational settings. This engaging template provides a detailed overview of everyday activities in a post office, making it perfect for a range of presentations. This template showcases key aspects of post office operations, including mail sorting, customer service interactions, and package handling. Its design is structured to convey the intricacies of postal services in an easy-to-understand and visually appealing manner. This makes it highly effective for training purposes, educational presentations, or explaining postal logistics in corporate environments. Adopting a professional color scheme that reflects the atmosphere of a postal service, the design is both thematic and informative. It captures the essence of a post office environment, enhancing the educational impact of the presentation. Whether used for staff training, classroom teaching, or corporate presentations, this template ensures a comprehensive and clear understanding of post office scenes and operations.


3 slides
Financial Planning and Budget Forecast Presentation
Present your financial goals with clarity using the Financial Planning and Budget Forecast Presentation. This modern, minimalist layout helps you break down percentage allocations, forecast future spending, and visualize budget insights with eye-catching graphics. Perfect for finance teams, startups, and consultants. Fully customizable in PowerPoint, Google Slides, Keynote, and Canva.


4 slides
5G Tech Use Cases and Industry Impact Presentation
Step into the future with this modern, tech-focused layout designed to simplify complex 5G use case presentations. Ideal for showcasing industry-specific impacts, this infographic-style slide makes your data look clean and professional. Fully editable and compatible with PowerPoint, Keynote, and Google Slides for seamless customization.


4 slides
E-Learning Module Structure Presentation
Turn your lesson flow into a visual journey your audience can actually follow. This presentation template maps out the structure of an e-learning module with step-by-step clarity—ideal for course creators, instructional designers, or trainers. Easily customize each stage. Fully editable in PowerPoint, Keynote, and Google Slides for flexible use.


20 slides
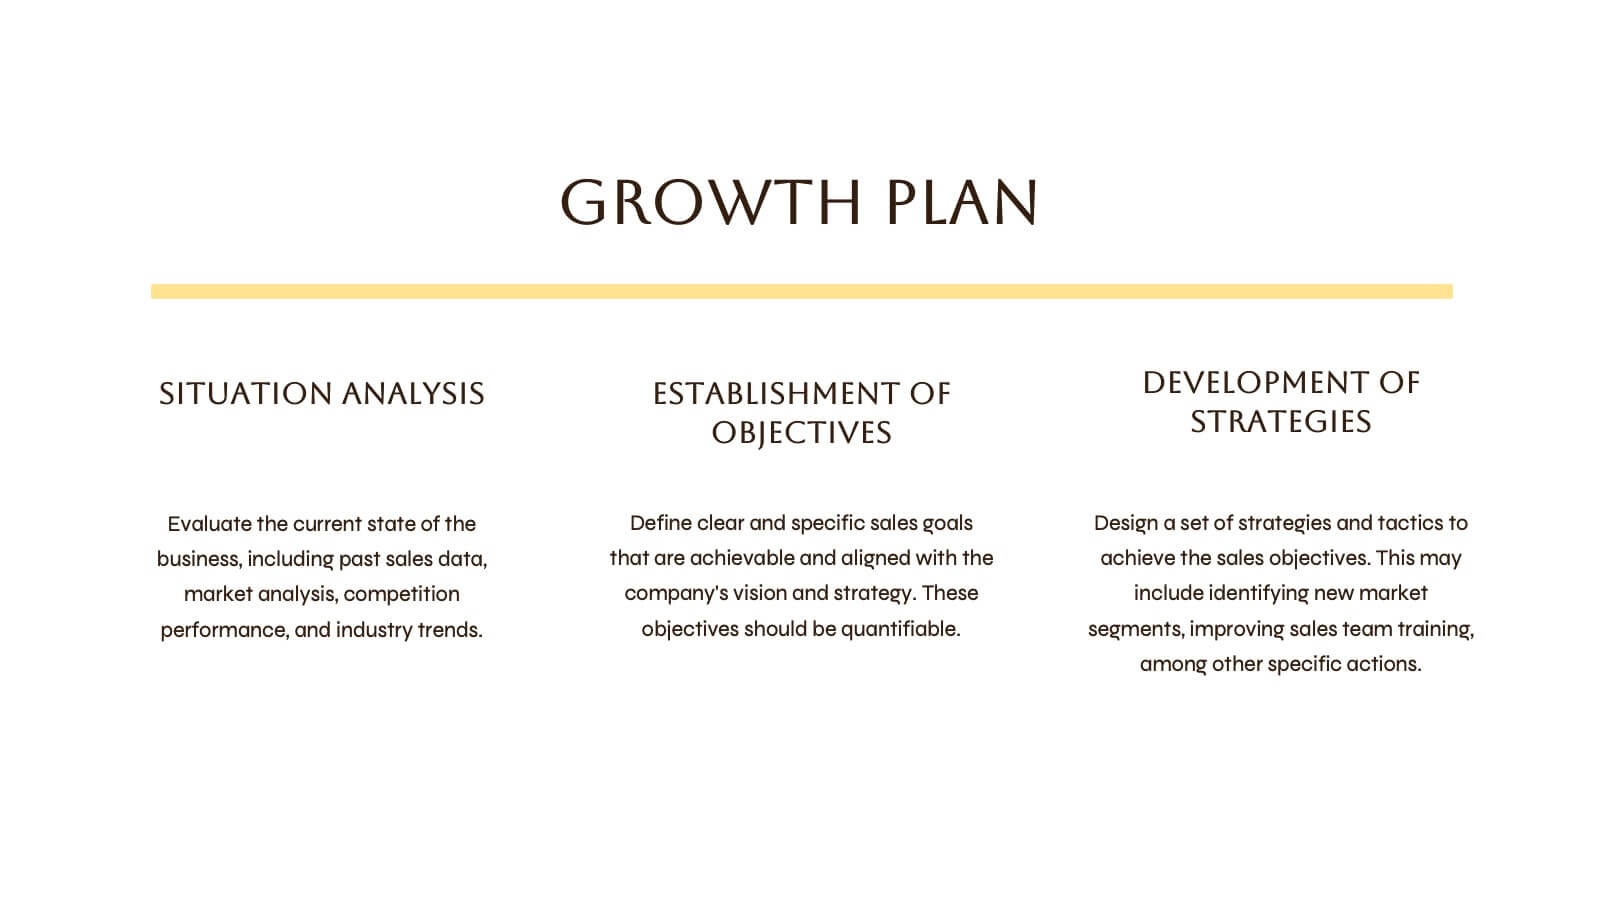
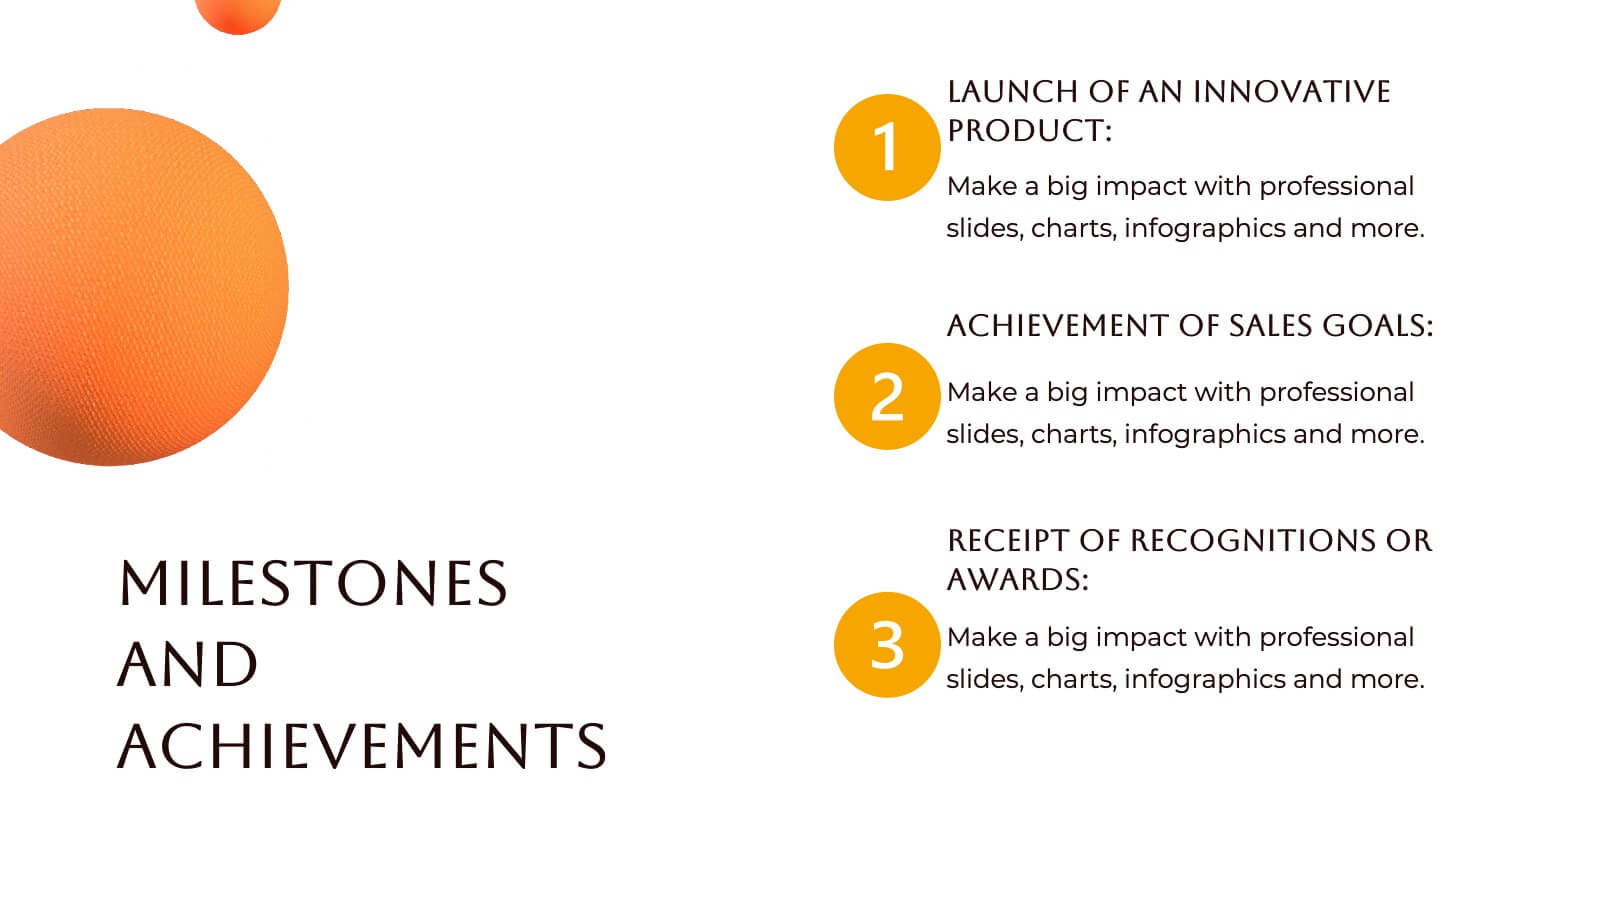
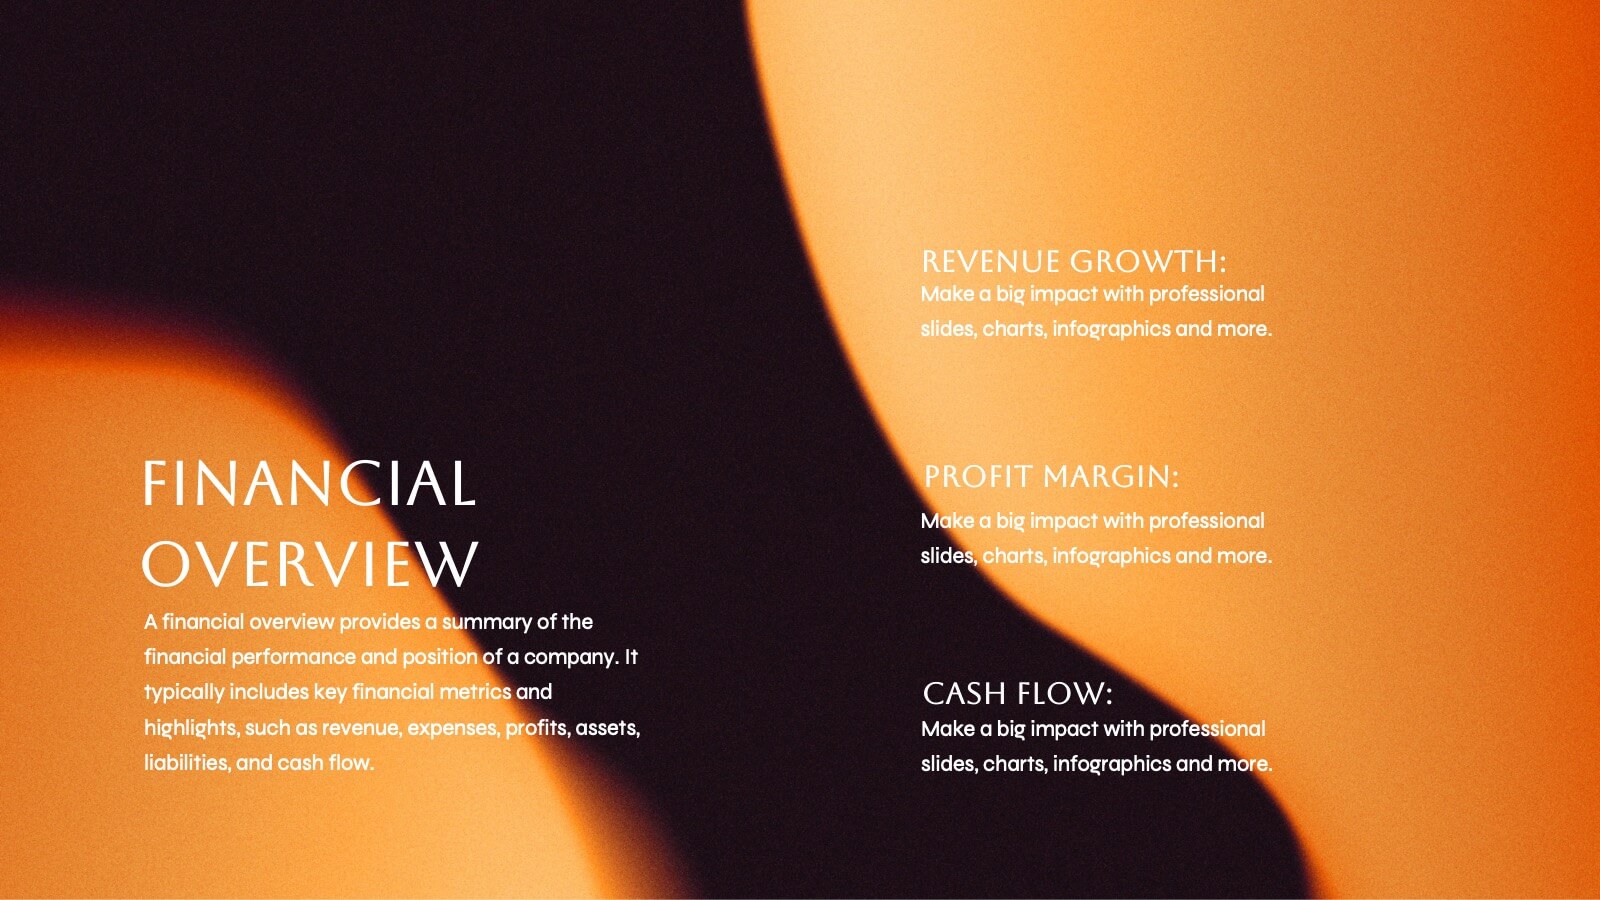
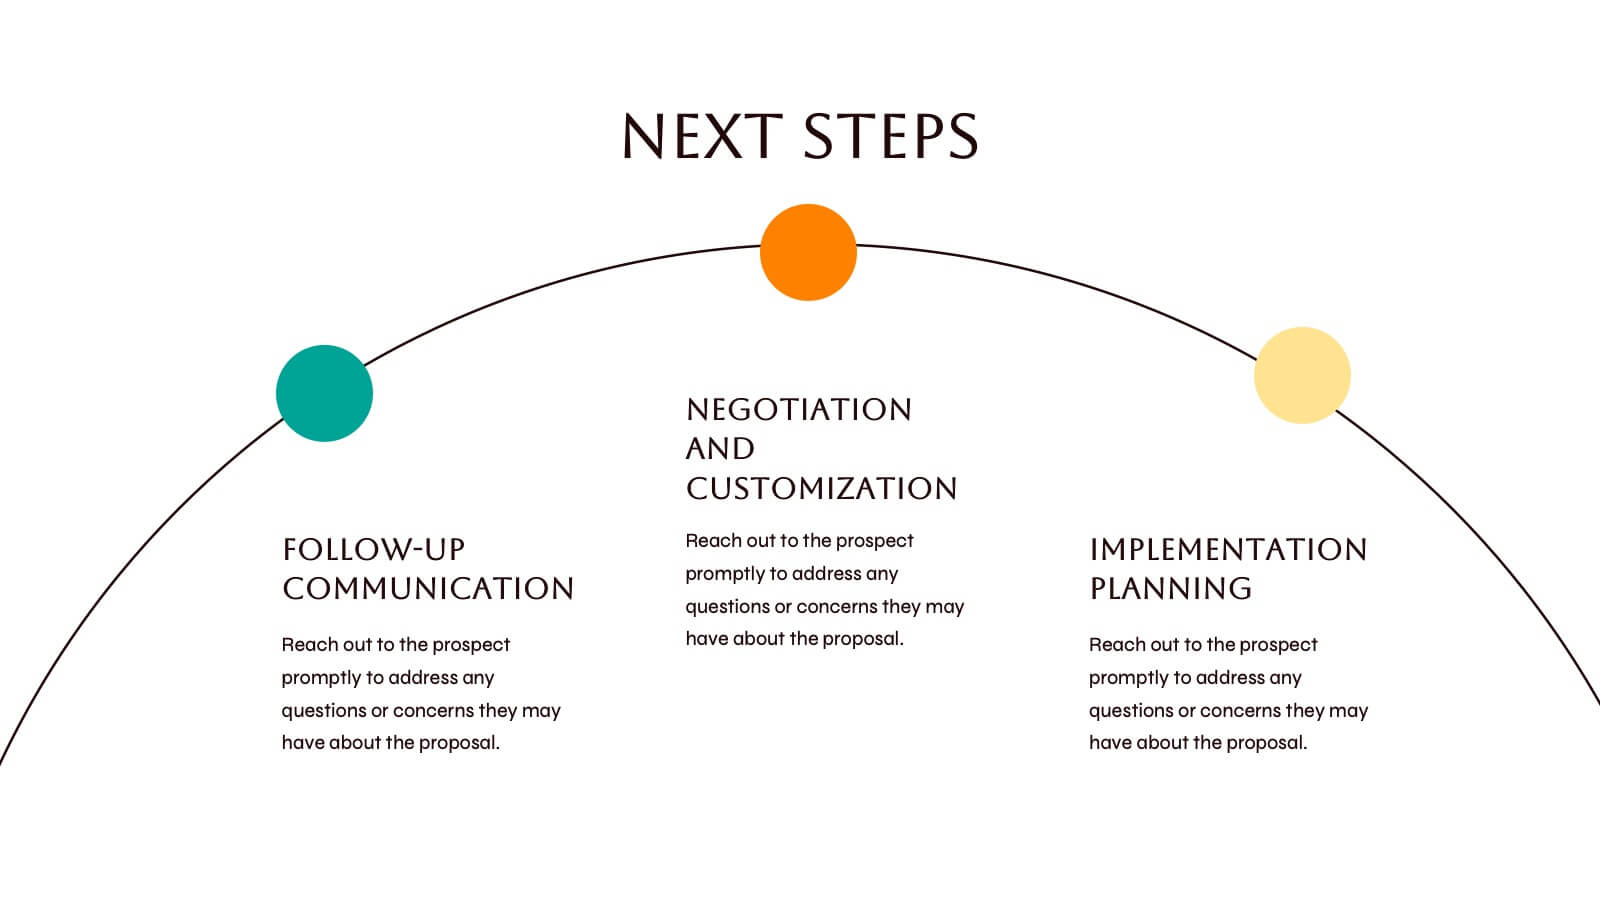
Radiance Sales Forecast Presentation
This vibrant sales presentation template is perfect for showcasing your strategy, objectives, and team. It highlights key areas like pricing, sales process, and performance metrics with a modern and eye-catching design. Compatible with PowerPoint, Keynote, and Google Slides, it ensures you’ll deliver impactful and professional presentations every time. Get ready to wow your audience!


7 slides
Network Marketing Infographic
Network marketing, is a business strategy where salespersons earn income through both direct sales of products or services and by recruiting new salespeople. This infographic template serves as a compass, guiding you through the intricate pathways of this business model and shedding light on the strategies and dynamics that lead to success. Compatible with Powerpoint, Keynote, and Google Slides. Illustrate a network of interconnected nodes to visualize the structure and growth potential of network marketing, demonstrating how each node represents a potential customer or distributor.


26 slides
Wedding Planner Company Profile Presentation
A wedding planner company is a specialized service provider that assists couples in planning, organizing, and coordinating their wedding day. This beautiful template is tailored for wedding planning companies looking to showcase their services and expertise. With this presentation, wedding planners can present their company's unique offerings, experience, and past successful events in an engaging and elegant manner. This presentation features an elegant and romantic design that reflects the essence of weddings. It incorporates soft colors, floral patterns, and beautiful imagery to create a sophisticated and enchanting atmosphere.


5 slides
Live Sports Infographics
Immerse in the dynamic realm of athletics with our live sports infographics. Crafted in a medley of energetic blue, spirited yellow, and various vivid hues, this template radiates the inherent in the world of sports. Its creative and vertical layout, optimized for impact, is perfect for sports journalists. Compatible with Powerpoint, Keynote, and Google Slides. The compelling graphics, icons, and dedicated image placeholders are specifically tailored to encapsulate the pulse-pounding moments and diverse statistics of live sports events. This visually striking, data-centric tool is indispensable for those seeking to convey complex sports information.


5 slides
Project Summary and Executive Highlights Presentation
Summarize key milestones with this Project Summary and Executive Highlights slide. Featuring a clean horizontal layout with icons and numbered steps, it’s perfect for spotlighting major achievements, phases, or metrics. Use it to present updates with clarity and professionalism. Fully editable in PowerPoint, Google Slides, or Canva.


4 slides
Business Plan in 4 Clear Steps
Break down your business strategy into four simple, actionable stages with this bold, visual template. Featuring a colorful quadrant layout inside a professional case graphic, it's perfect for business plans, roadmaps, or project overviews. Easily editable in PowerPoint, Keynote, and Google Slides.


6 slides
SCRUM Framework Infographics
The "SCRUM Framework" infographic template is a dynamic and insightful tool, meticulously crafted for PowerPoint, Keynote, and Google Slides. This template is essential for project managers, agile coaches, and development teams striving to elucidate the intricacies and benefits of the SCRUM methodology in their projects. This template adeptly breaks down the SCRUM framework into its core components: roles, events, and artifacts. It showcases the iterative process of product development, sprint planning, daily stand-ups, sprint reviews, and retrospectives. The visual representation of SCRUM roles – Product Owner, SCRUM Master, and Development Team – along with the flow of activities, makes it an indispensable resource for SCRUM training, agile transformation initiatives, and team workshops. The design is as agile as the methodology it represents, with a color scheme that encourages clarity, focus, and energy. This not only makes the presentation visually compelling but also reinforces the principles of transparency, inspection, and adaptation that are central to SCRUM. Whether used in corporate training, team onboarding, or educational settings, this template ensures that the "SCRUM Framework" is communicated with precision, clarity, and visual flair.


20 slides
Fire Spin Startup Pitch Deck Presentation
Ignite your pitch with this bold, fire-inspired presentation template, perfect for showcasing your startup’s potential! This deck helps you present key business elements like market research, revenue models, and growth strategies in a dynamic, visually engaging format. Stand out from the competition. Compatible with PowerPoint, Keynote, and Google Slides.


10 slides
Creative Thinking and Innovation
Inspire fresh perspectives and spark ideas with this Creative Thinking and Innovation presentation. Designed around a dynamic lightbulb concept, it features five clearly numbered stages for visualizing brainstorming, concept development, and strategic creativity. Perfect for workshops, ideation sessions, or innovation planning. Fully editable in PowerPoint, Keynote, and Google Slides.


23 slides
Mystic Small Business Pitch Deck Presentation
Elevate your small business presentations with this sleek, professional pitch deck template! It’s designed to highlight your company's background, market opportunities, and key objectives in a visually appealing format. Perfect for showcasing your products, services, value proposition, and financial performance, this template makes your pitch stand out. Customize it for PowerPoint, Keynote, or Google Slides to suit your needs.