


Features
- 20 Unique slides
- Fully editable and easy to edit in Microsoft Powerpoint, Keynote and Google Slides
- 16:9 widescreen layout
- Clean and professional designs
- Export to JPG, PDF or send by email


Do you have any questions?
Recommend


6 slides
Decision-Making Using Tree Diagrams Presentation
Clarify complex decisions with the Decision-Making Using Tree Diagrams Presentation. This slide design features a clear, hierarchical structure that helps visualize choices, outcomes, and decision paths step by step. Perfect for business strategy, risk analysis, or logic-based planning. Fully editable in PowerPoint, Keynote, and Google Slides.


23 slides
Stormrider Business Plan Presentation
This Business Presentation Template is designed to help you deliver structured and professional content for conferences, meetings, and corporate events. Featuring key sections such as objectives, speaker introductions, panel discussions, and networking breaks, it ensures a smooth and engaging experience. Fully customizable and compatible with PowerPoint, Keynote, and Google Slides.


4 slides
Harvey Ball Ratings Presentation
Make your evaluations stand out with this sleek and intuitive presentation design. Perfect for rating performance, comparing metrics, or visualizing customer feedback, it brings clarity and visual balance to your data. Easily editable and fully compatible with PowerPoint, Keynote, and Google Slides for a smooth, professional presentation experience.


5 slides
Financial Overview and Money Flow Presentation
Showcase financial performance and money distribution with this clear, layered infographic. Each stack segment represents a key insight—ideal for budgets, cost analysis, or income flow presentations. Simple yet visually effective, it's perfect for helping stakeholders see the full picture. Fully compatible with PowerPoint, Keynote, and Google Slides.


5 slides
Building Timeline Presentation
Bring structure and progress to your ideas with this visually engaging presentation design. Ideal for showcasing project milestones, construction phases, or business growth timelines, it helps you communicate progress clearly and professionally. Fully customizable and compatible with PowerPoint, Keynote, and Google Slides for seamless presentation editing and delivery.


18 slides
Business Data Analysis Dashboard Presentation
Track Business Performance Effectively! The Business Data Analysis Dashboard Presentation provides a structured and visually engaging way to showcase key metrics, trends, and insights. Featuring dynamic charts, graphs, and KPI indicators, this template is perfect for executive reports, financial reviews, and strategic planning. Fully customizable and compatible with PowerPoint, Keynote, and Google Slides for seamless presentation.


22 slides
Wave Startup Strategy Presentation
Pitch your startup strategy with this modern, vibrant template! It covers essentials like mission, vision, product overview, market analysis, and growth plans. Perfect for highlighting your team, financials, and milestones. Seamlessly compatible with PowerPoint, Keynote, and Google Slides for a smooth, professional presentation every time.


20 slides
Astrolight Startup Growth Plan Presentation
A modern and vibrant presentation template tailored for startups. It includes slides for business models, growth plans, competitive analysis, and financial overviews. The visually appealing layout ensures clarity and impact for stakeholders. Fully customizable and compatible with PowerPoint, Keynote, and Google Slides for seamless adaptability.


21 slides
Galactic Strategic Planning Report Presentation
Launch your strategic vision into the stars with this captivating Galactic-themed presentation template! Ideal for presenting a strategic planning report, it allows you to outline goals, action plans, and performance metrics with a sleek, cosmic design that captures attention. Compatible with PowerPoint, Keynote, and Google Slides for easy, seamless customization.


4 slides
Business Cycle Diagram Overview Presentation
Illustrate your business processes with this modern cycle diagram template. Designed to showcase four interconnected stages, it’s ideal for visualizing workflows, project phases, or continuous improvement models. Fully editable in Canva, PowerPoint, and Google Slides, this template helps you present complex cycles with clarity and visual impact.


25 slides
Luminous Qualitative Research Findings Presentation
Elevate your qualitative research findings with this sleek and professional template. It covers research objectives, methodology, data collection, and key findings. Ideal for clear and compelling presentations. Fully compatible with PowerPoint, Keynote, and Google Slides for seamless integration.


6 slides
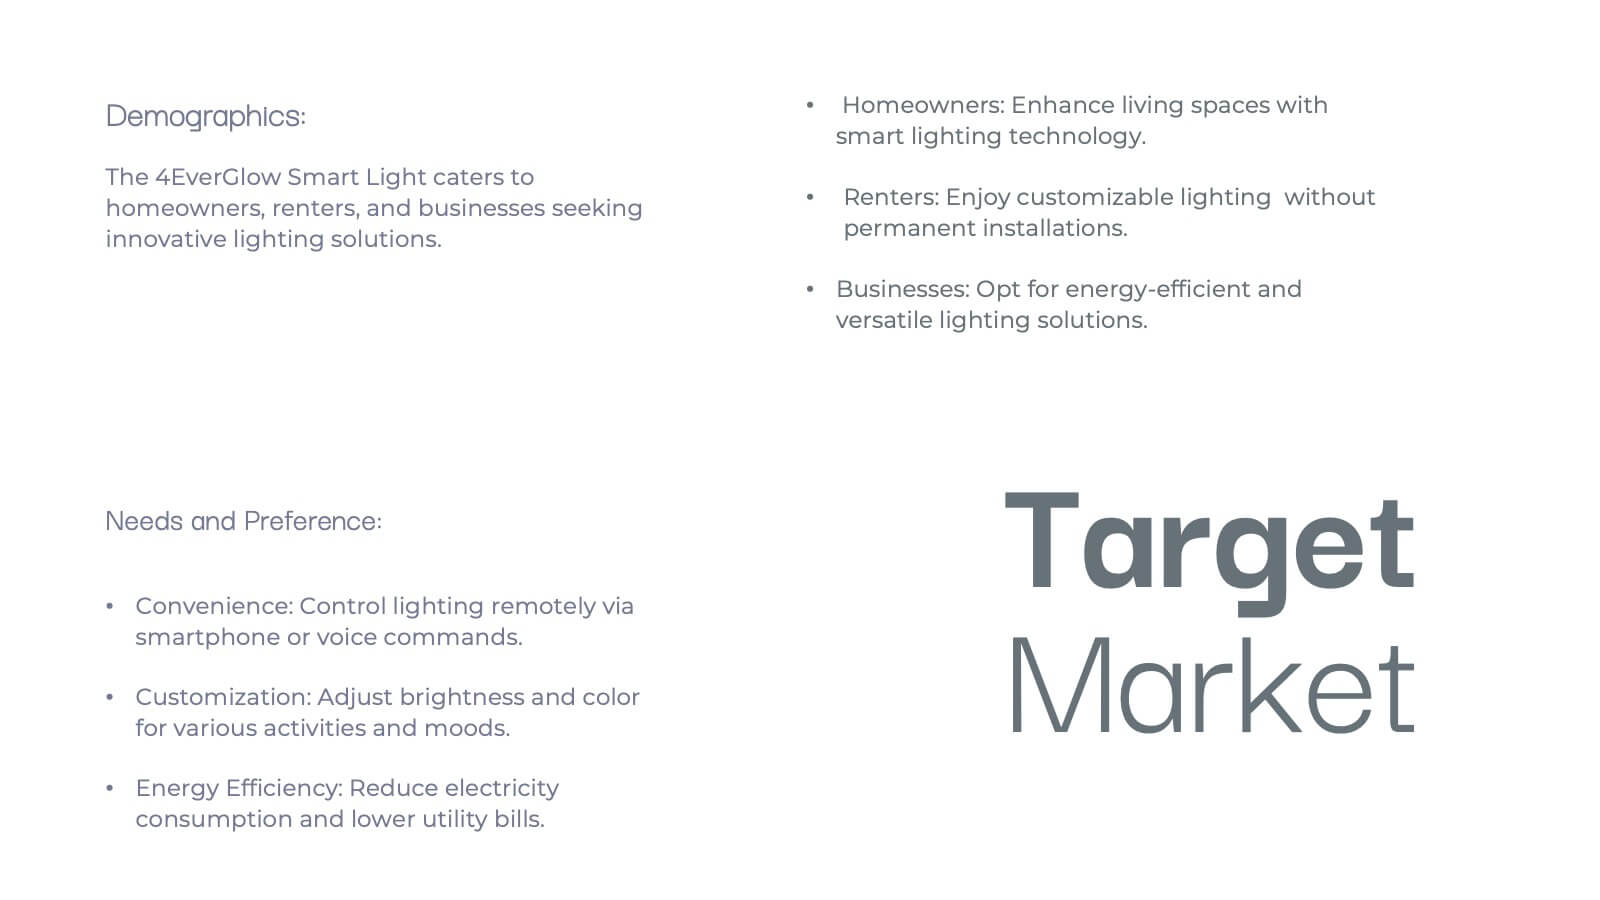
Demographic and Psychographic Segmentation Presentation
Bring your audience insights to life with a clear, data-driven design that highlights who your customers are and what drives their decisions. This presentation helps you analyze audiences by lifestyle, behavior, and demographics. Fully customizable and compatible with PowerPoint, Keynote, and Google Slides for effortless professional presentations.


20 slides
Mythion Business Idea Pitch Deck Presentation
Communicate your business vision with clarity and impact using this comprehensive pitch deck presentation template. Perfect for entrepreneurs, startups, and innovators, this template is designed to help you effectively present your idea to investors, stakeholders, or partners. Cover every essential aspect of your business journey with slides dedicated to the problem statement, solutions, market overview, and target audience. Showcase your business model, revenue projections, and unique selling proposition with visually appealing layouts. Highlight your marketing strategy, growth projections, and funding requirements to build a strong, persuasive case. Fully customizable and compatible with PowerPoint, Google Slides, and Keynote, this template allows you to tailor each slide to suit your business identity and goals. Whether you're pitching a new idea or seeking investment, this template ensures you present with professionalism and confidence.


6 slides
Big Data Analytics Presentation
The "Big Data Analytics Presentation" template is expertly designed to visualize global data analytics strategies across different regions. The map highlights key areas in distinct colors, drawing attention to where data initiatives are being implemented or where significant market trends are observed. Each region on the map corresponds to specific titles that can be customized to represent various analytical focuses such as market penetration, user demographics, or revenue growth. Accompanying the map are percentage circles that quantify planning, execution, and success rates, making this template invaluable for analysts, data scientists, and corporate strategists who need to present complex data in an easily digestible format. This visual tool is perfect for enhancing presentations, strategic meetings, and reports with a clear, concise, and visually engaging representation of data-driven insights.


21 slides
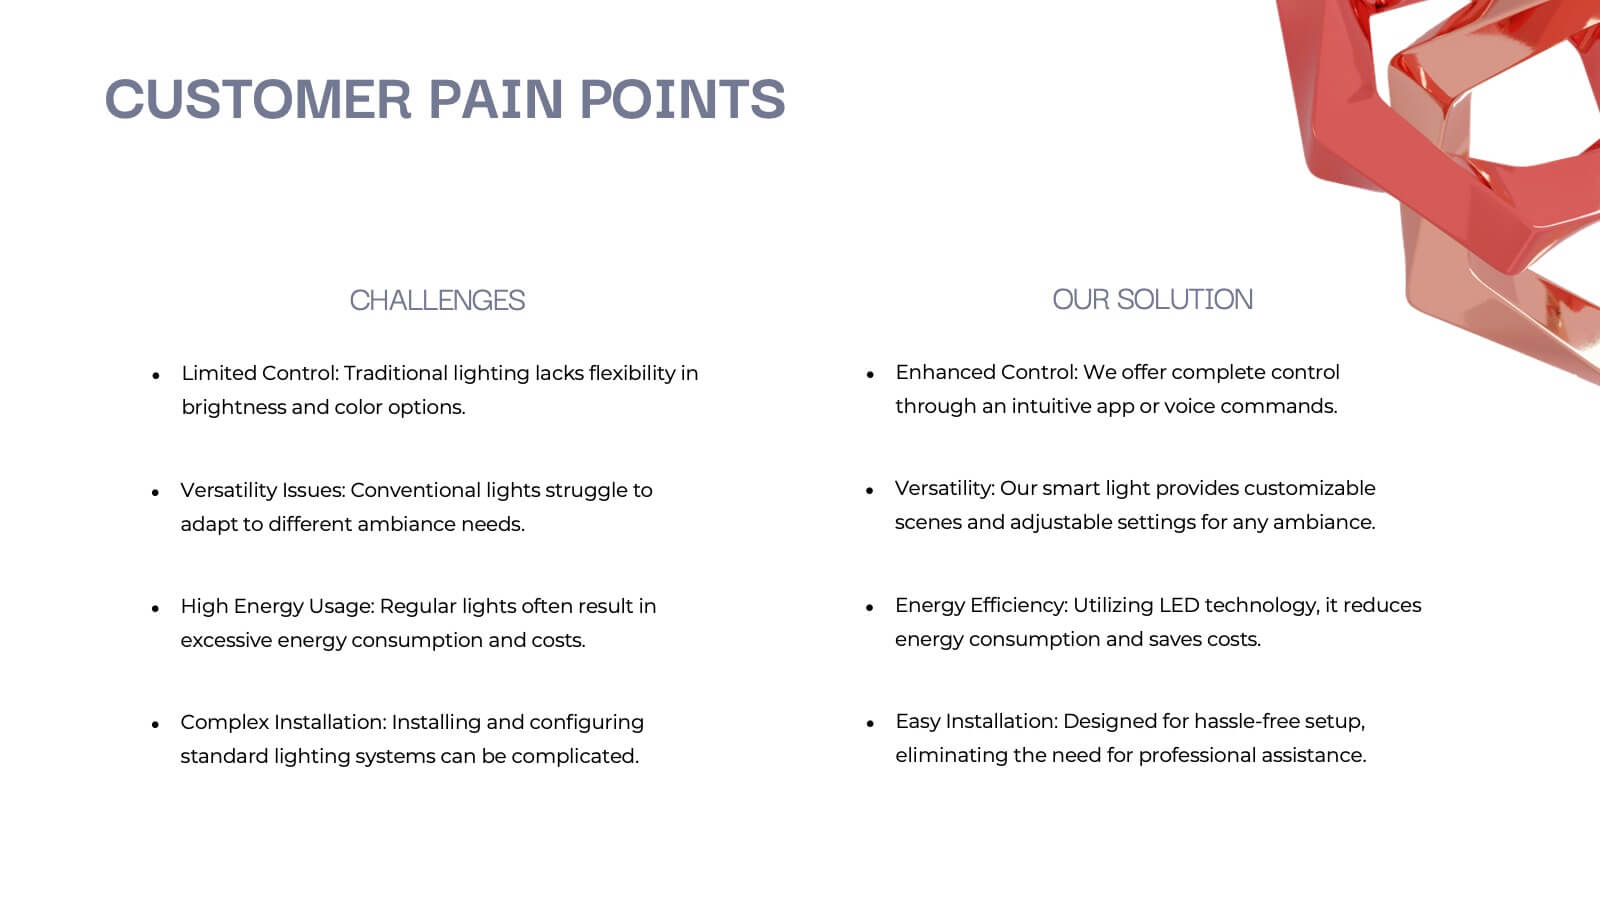
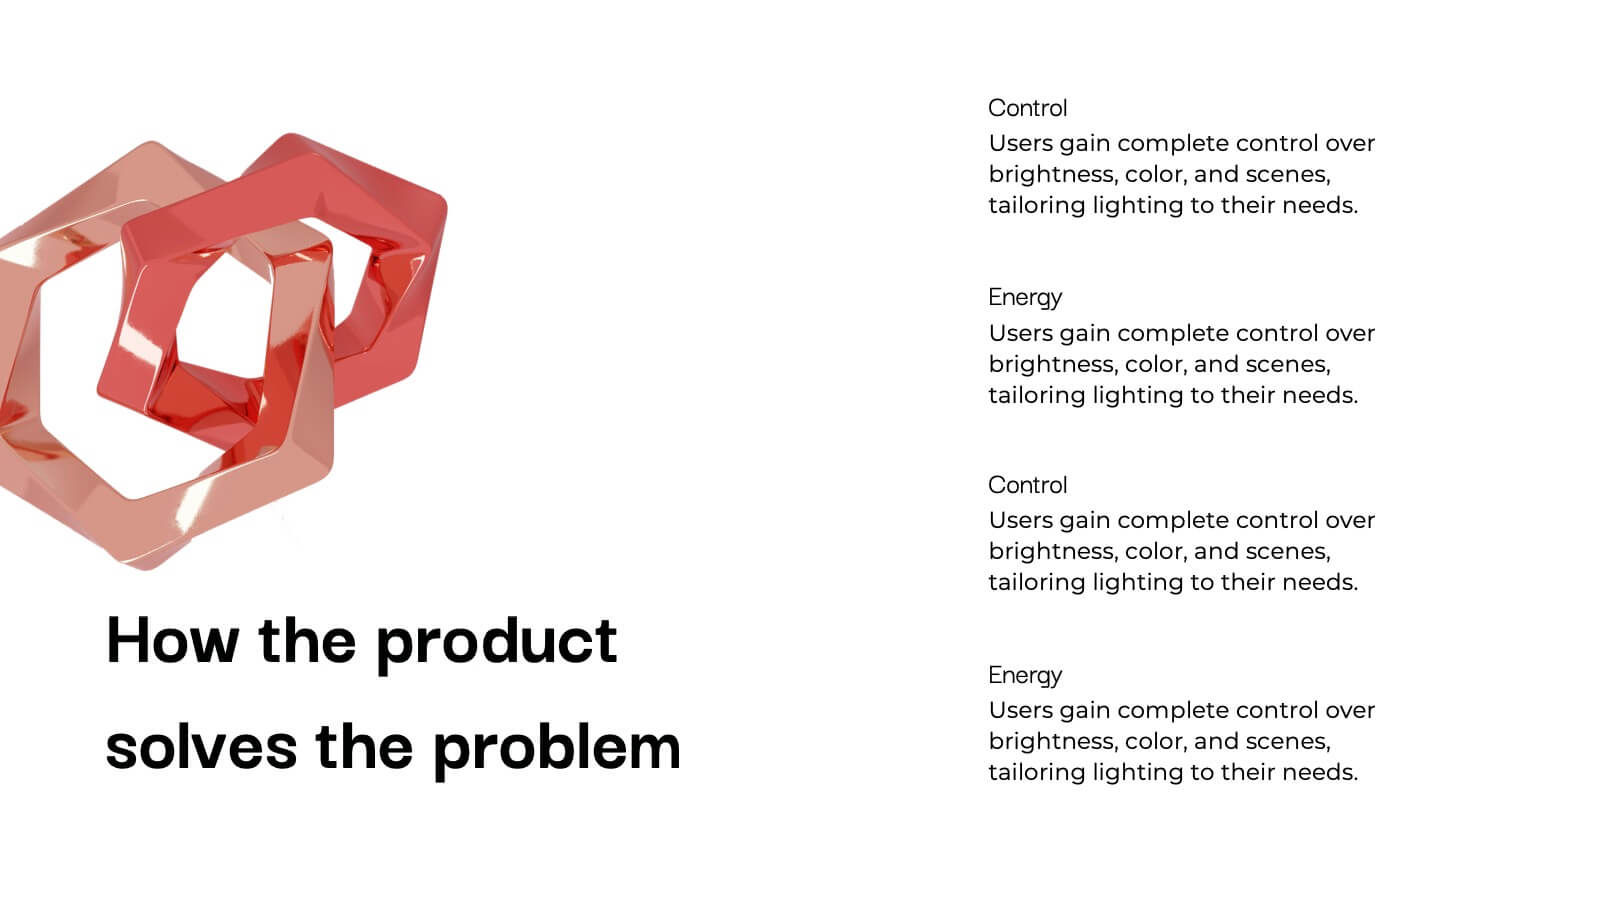
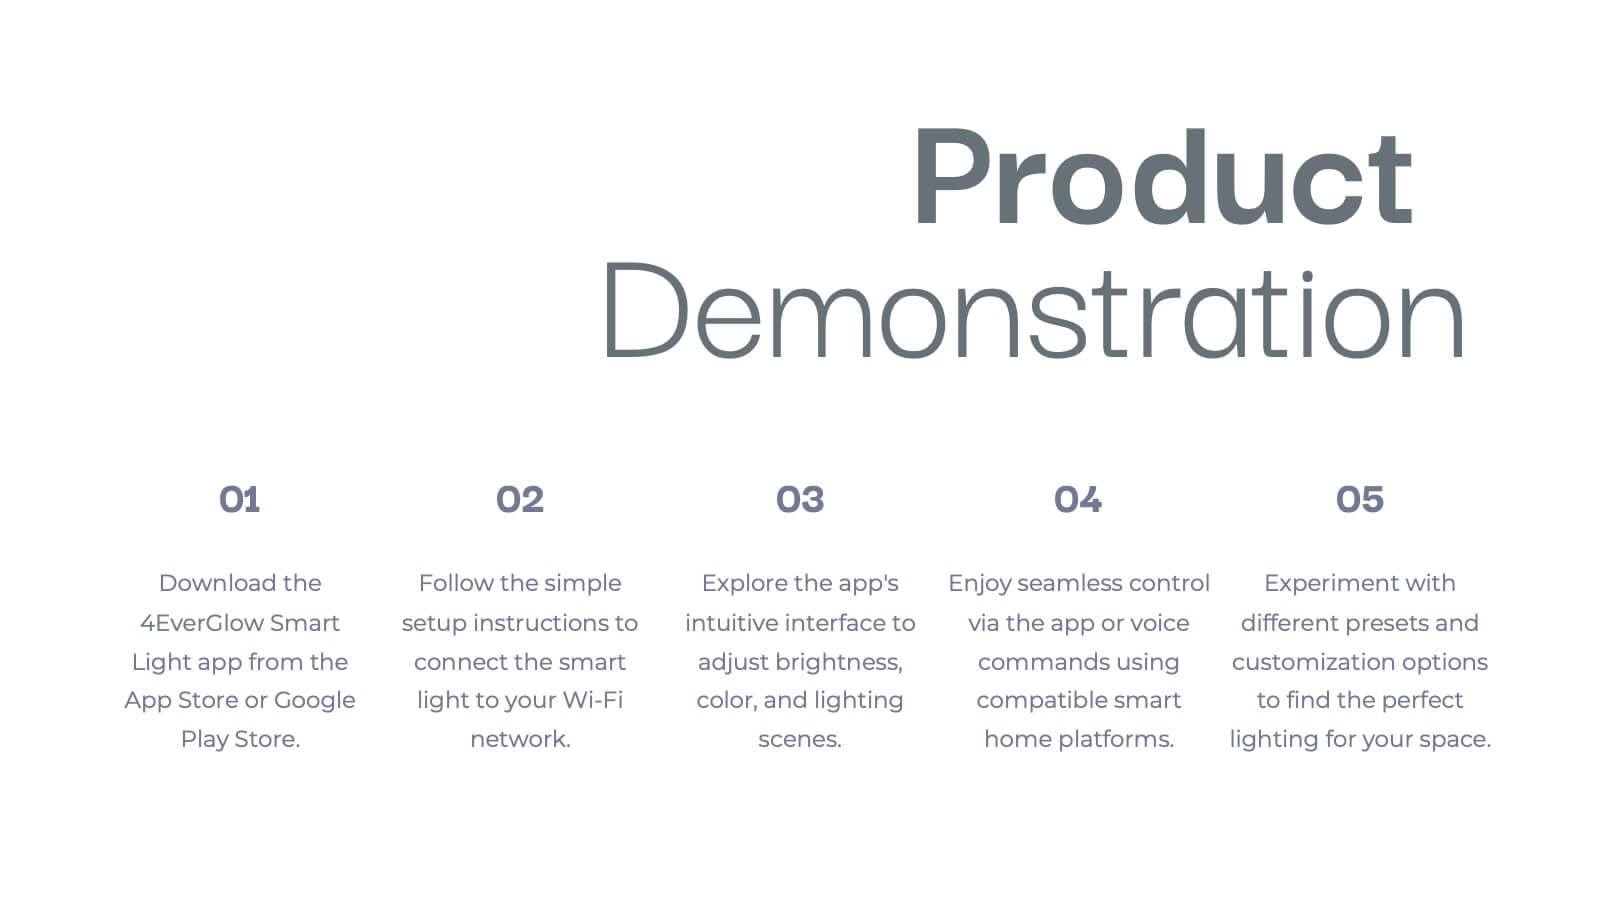
Vulcan New Product Proposal Presentation
Launch your next product with confidence using this comprehensive presentation template! Covering everything from product features and target market to pricing strategy and customer pain points, this template ensures a smooth and engaging flow for your audience. It’s ideal for product proposals, demonstrations, and marketing strategies. Compatible with PowerPoint, Keynote, and Google Slides for seamless presentations.


5 slides
Five Essential Steps for Business Success Presentation
Visualize your growth plan with the Five Essential Steps for Business Success Presentation. This step-by-step layout highlights key milestones using a modern isometric staircase design, with speech bubble markers for added clarity. Ideal for roadmaps, strategic planning, or onboarding workflows. Fully editable in PowerPoint, Keynote, and Google Slides.


5 slides
Business Influence Stakeholder Analysis
Highlight influence and interest with this layered stakeholder analysis pyramid. Designed for strategic presentations, this layout categorizes engagement levels—Pull Communications, Push Communications, Consultant, Participation, and Partnership—across a 3D stacked model. Ideal for stakeholder mapping, influence management, and communication strategy planning. Fully editable in PowerPoint, Keynote, and Google Slides.