


Features
- 9 Unique slides
- Fully editable and easy to edit in Microsoft Powerpoint, Keynote and Google Slides
- 16:9 widescreen layout
- Clean and professional designs
- Export to JPG, PDF or send by email


Do you have any questions?
Recommend


20 slides
Aether Marketing Research Report Presentation
The Marketing Research Report Presentation Template offers a sleek design with 20 fully customizable slides, ideal for presenting in-depth marketing insights. This template features sections for industry analysis, consumer behavior, emerging technologies, and marketing trends like SEO, social media, and influencer strategies. It also highlights e-commerce trends, personalization, sustainability, and storytelling techniques. The modern black-and-gold gradient aesthetic adds sophistication, making it perfect for professional reports. Compatible with PowerPoint, Keynote, and Google Slides, this template ensures a polished and engaging presentation experience.


21 slides
Somnara Full-Service Agency Project Plan Presentation
Present your agency’s expertise with a comprehensive project plan template designed to impress clients and stakeholders. This sleek and professional layout allows you to outline your mission and vision, highlight team strengths, and showcase core services with clarity. Use the client testimonials and case studies sections to establish credibility and trust. Visualize your strategic approach with dedicated slides for market analysis, creative process, and execution strategy. The template also includes detailed sections for partnership opportunities, social responsibility initiatives, and a future outlook, ensuring a holistic view of your agency’s capabilities and forward-thinking approach. Fully editable and compatible with PowerPoint, Google Slides, and Keynote, this template is perfect for full-service agencies seeking to elevate their presentations. Customize each slide to reflect your unique value and deliver impactful, results-oriented proposals.


26 slides
Fintech Presentation
Venture into the dynamic world of financial technology with this electrifying presentation template, designed to captivate and inform. The contrast of bold colors against a dark backdrop represents the innovative spirit of fintech, inviting a journey into the digital transformation of finance. Each slide, adorned with vibrant splashes and futuristic motifs, serves as a beacon guiding the audience through the complex landscape of mobile payments, blockchain, and peer-to-peer lending. Intended for entrepreneurs, investors, and educators, this template bridges the gap between complex financial concepts and accessible understanding. Infographics illuminate trends and statistics, while vivid images capture the essence of modern finance — all in a format that's as engaging as it is educational. Perfect for seminars, webinars, or classroom settings, this template offers a visual narrative of fintech's rise, its impact on economies, and the boundless potential of this booming industry. Embrace the fintech revolution and lead the charge towards a tech-savvy financial future.


6 slides
Goal Setting and Strategic Planning Presentation
Present objectives and action plans with the Goal Setting and Strategic Planning template. Featuring a modern segmented design, this layout is perfect for outlining priorities, initiatives, and milestones. Fully editable in Canva, PowerPoint, and Google Slides, allowing you to adapt colors, icons, and text to match your business vision.


3 slides
Persona Mapping for Target Audience Presentation
Get clear on who you're speaking to with this visual persona mapping slide. Ideal for marketing plans, customer research, or segmentation strategies, this layout helps you define and compare target audience types with clean icons and text space. Fully editable and works with PowerPoint, Keynote, and Google Slides.


4 slides
Business Role Structure Diagram Presentation
Bring your team structure to life with a clear, engaging visual that makes every role instantly understandable. This presentation helps you map relationships, outline responsibilities, and communicate workflow with ease. Designed for simple customization and professional clarity, it supports PowerPoint, Keynote, and Google Slides for seamless editing across platforms.


26 slides
Tempo Brand Identity Presentation
Introduce and elevate your brand with this versatile presentation template designed to reflect your company's vision and values. Perfect for businesses looking to showcase their brand strategy, components, and touchpoints with clarity and professionalism. This presentation features thoughtfully designed slides covering brand identity components, visual guidelines, target audience insights, and future development plans. Use dedicated sections to outline your unique selling proposition, positioning, and strategy. With its clean layout and attention to detail, it's ideal for presenting a cohesive and impactful brand narrative. Compatible with PowerPoint, Google Slides, and Keynote, this template is fully customizable. Edit colors, text, and images to align with your brand aesthetics and messaging. Deliver your presentation with confidence, ensuring your audience is inspired by a polished and professional brand identity.


13 slides
Simple Sales Proposal Presentation
This proposal template provides a streamlined approach for presenting sales strategies and solutions. Starting with a visually striking cover slide, it sets the scene for an engaging pitch. The template meticulously organizes content from the initial problem identification to the presentation of real numbers that underscore the proposal's validity. Each section, from the elucidation of the problem to the detailed solutions and real-world case studies, is laid out for maximum impact and understanding. Personable touches are incorporated through the 'Meet Our Team' segment, bolstering the proposal with credibility. The template culminates with a strong call to action, urging the audience to seize the collaborative opportunity, and is rounded off with a polite 'Thank You' to leave a lasting impression. This template is a boon for sales professionals seeking to communicate their value proposition with clarity and persuasiveness.


4 slides
Human Resources KPI Dashboard Presentation
Bring your metrics to life with this clean and modern dashboard designed to highlight essential HR performance insights. It helps you present key indicators clearly, making data easy to compare and understand at a glance. Perfect for HR reviews or internal updates, and fully compatible with PowerPoint, Keynote, and Google Slides.


6 slides
Customer Satisfaction Smile Chart Presentation
Bring your data to life with a slide that instantly shows how customers feel, blending clean visuals with an intuitive emotion scale. This presentation helps you communicate feedback trends, highlight satisfaction levels, and support decision-making with clarity. Ideal for reports, reviews, and strategy updates. Fully compatible with PowerPoint, Keynote, and Google Slides.


2 slides
Corporate Identity and Services Overview Presentation
Clearly showcase your company’s offerings with the Corporate Identity and Services Overview Presentation. This modern, minimalist layout is ideal for highlighting key services, team roles, or business pillars with clarity and visual appeal. Fully editable in Canva, PowerPoint, and Google Slides for quick customization and professional results.


6 slides
State-by-State Business Distribution Map Presentation
Visualize regional performance with this State-by-State Business Distribution Map template. Ideal for showcasing business coverage, sales territories, or demographic trends across the U.S. Each state is color-coded for clarity, with editable text and icons. Fully compatible with PowerPoint, Keynote, and Google Slides—perfect for executives, marketers, or analysts.


6 slides
Evolution of an Industry Through Time Presentation
Visualize industry transformation with the Evolution of an Industry Through Time Presentation. This timeline-style layout is perfect for highlighting key milestones, technological shifts, or growth stages across decades. Ideal for consultants, educators, or corporate strategists. Fully editable in Canva, PowerPoint, Keynote, and Google Slides for easy adaptation.


5 slides
Lean Startup Business Presentation
A fresh, energetic layout brings your ideas to life, making it easy to present streamlined processes and early-stage strategies with clarity. This presentation highlights key steps, insights, and goals in a clean, modern flow designed for fast-moving teams. Fully compatible with PowerPoint, Keynote, and Google Slides.


20 slides
Creative Marketing Proposal Presentation
Elevate your business proposals with this sleek marketing proposal template, designed in dynamic purple tones. It comprehensively covers everything from company overview to pricing structures, making it perfect for detailing your marketing strategies effectively. Compatible with PowerPoint, Google Slides, and Keynote, it's ideal for professionals aiming to impress clients and secure projects.


21 slides
Astral Startup Business Plan Presentation
This sleek and professional Startup Business Plan template is designed to help you convey your startup’s potential to investors and stakeholders effectively. With a minimalist design and a structured flow, it covers all essential aspects of your business plan, from mission and vision to financial overview and growth plan. Each slide is crafted to present critical information in a clear and concise manner, making it easier for your audience to grasp the key points. This template is fully compatible with PowerPoint, Keynote, and Google Slides, allowing you to customize it to suit your branding and presentation style. Use this template to create a compelling and impactful presentation that will leave a lasting impression on your audience.
4 slides
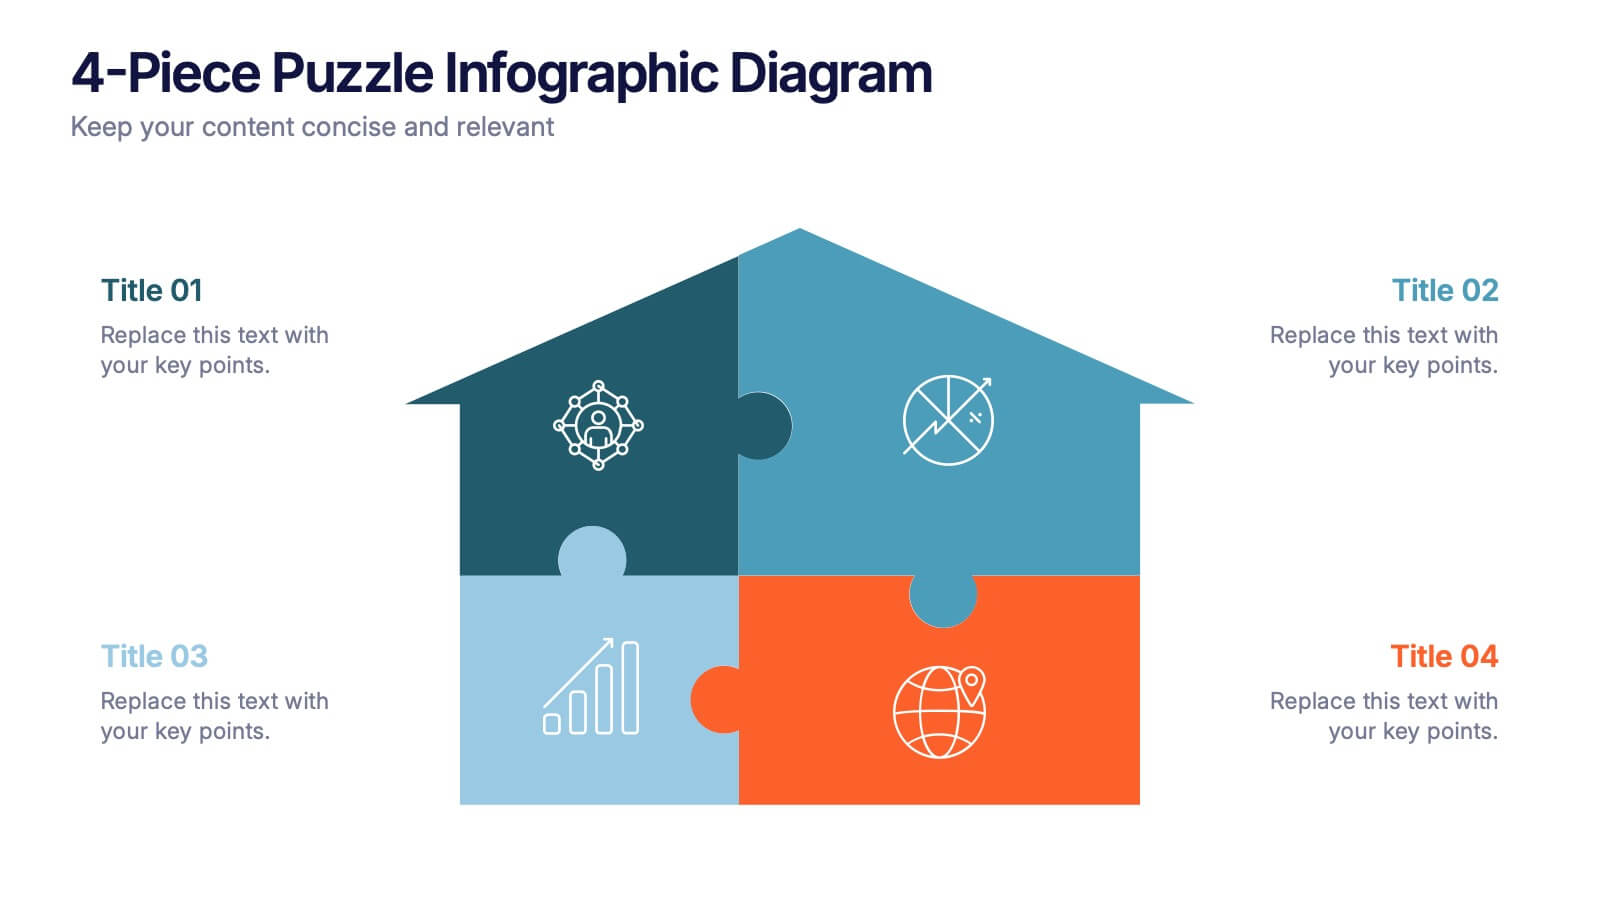
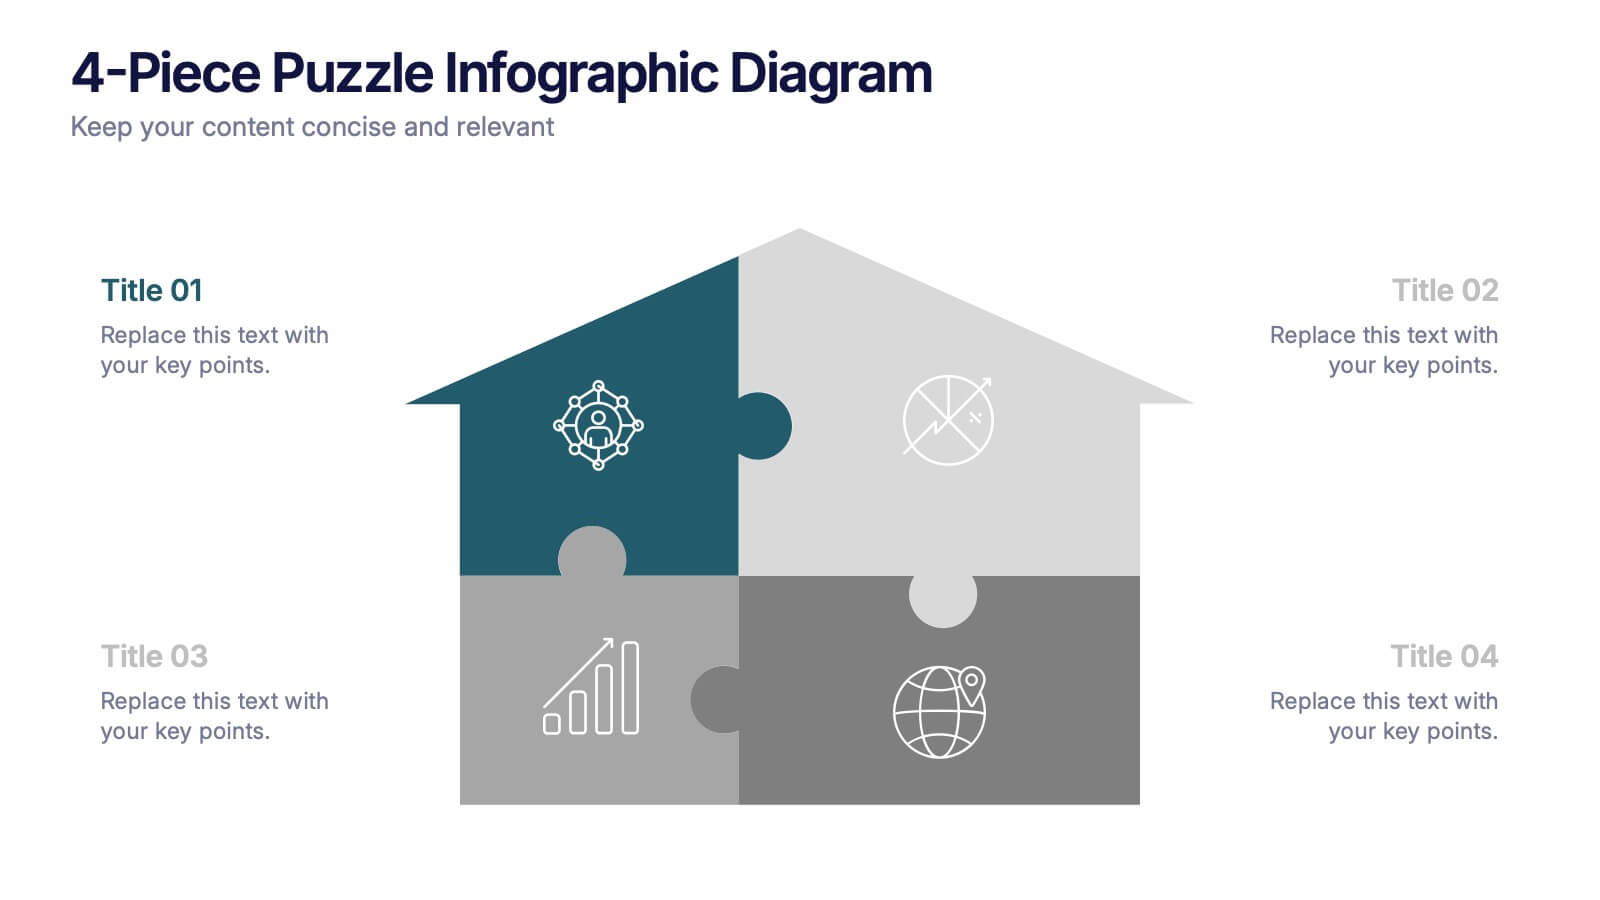
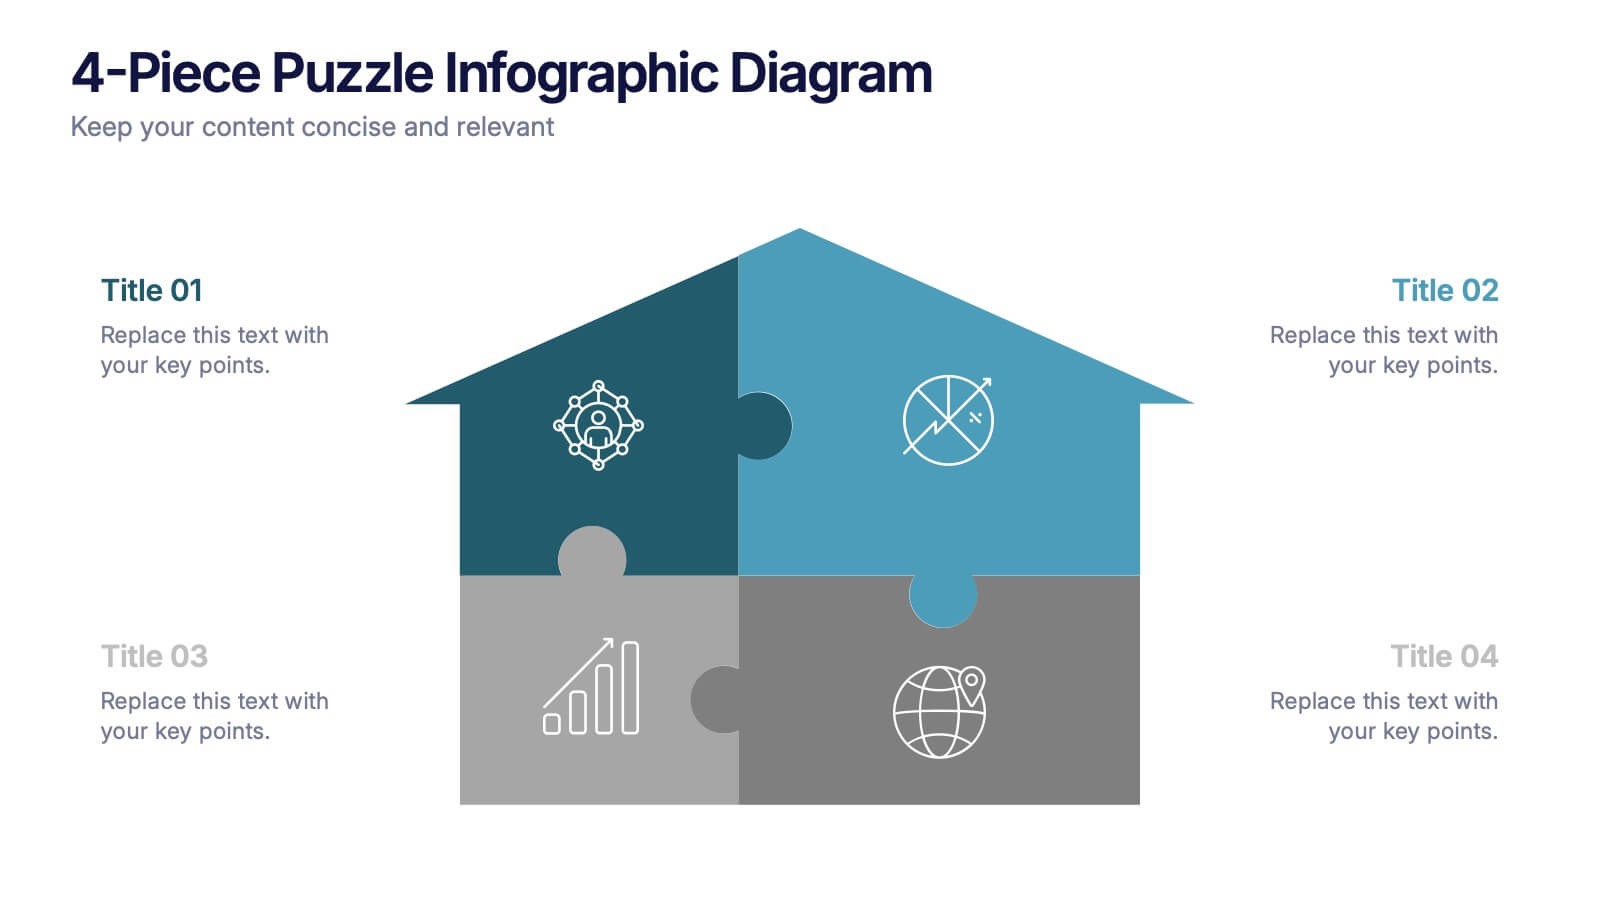
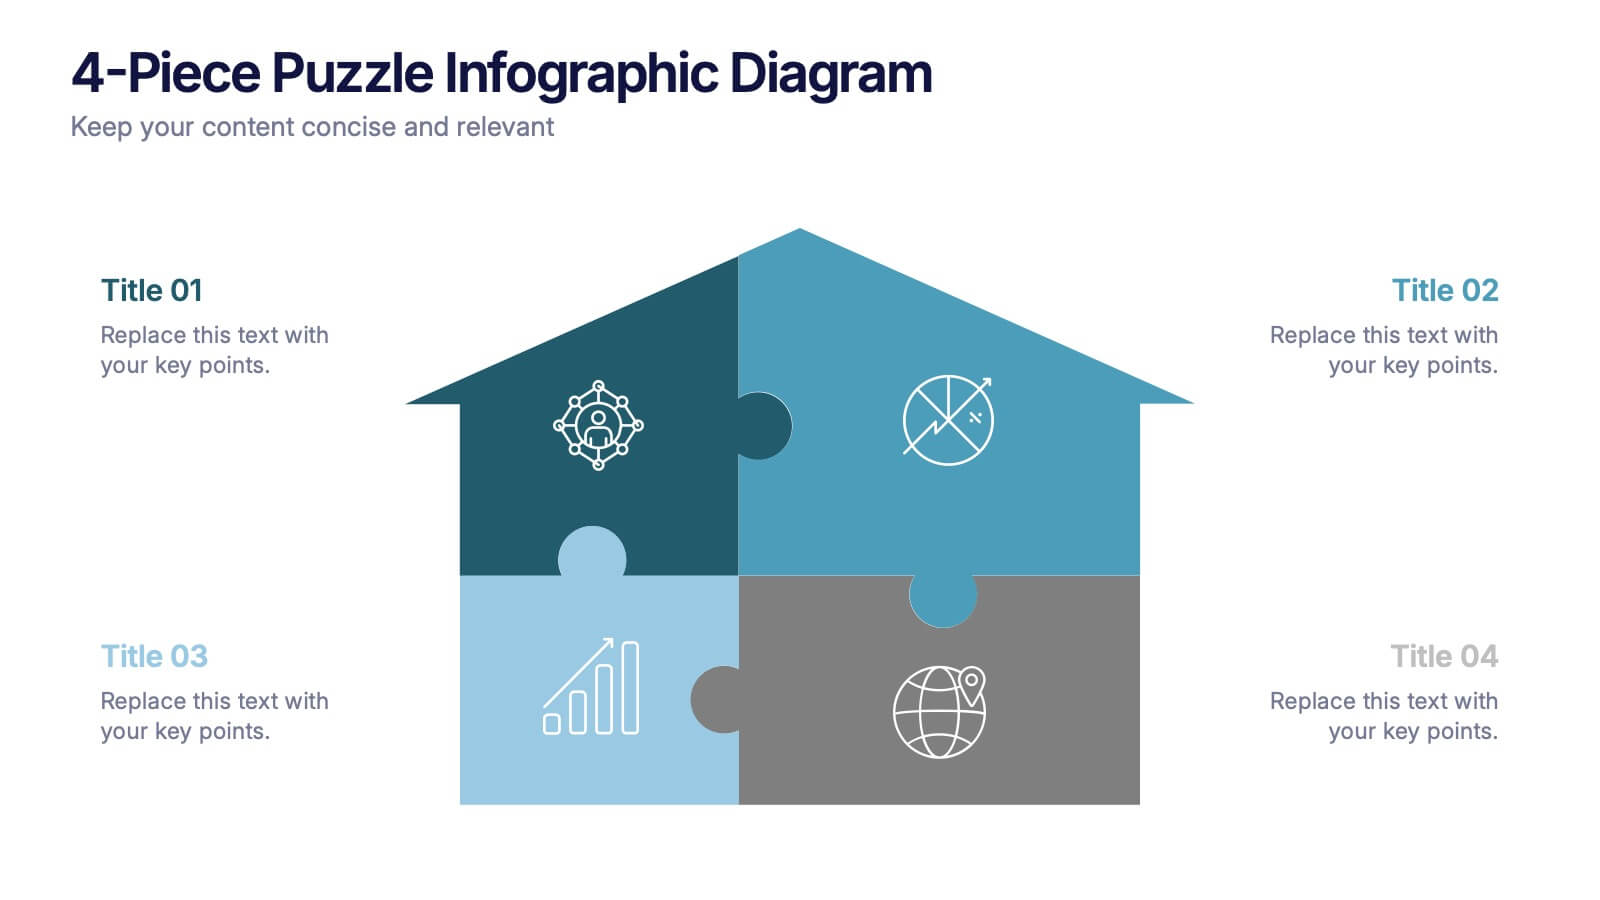
4-Piece Puzzle Infographic Diagram Presentation
Bring clarity and impact to your message with a visual layout that snaps big ideas together like a puzzle. This presentation helps you break complex concepts into four connected sections, making explanations easier and more engaging for any audience. Ideal for planning, insights, or strategy sessions. Fully compatible with PowerPoint, Keynote, and Google Slides.