


Features
- 4 Unique slides
- Fully editable and easy to edit in Microsoft Powerpoint, Keynote and Google Slides
- 16:9 widescreen layout
- Clean and professional designs
- Export to JPG, PDF or send by email


Do you have any questions?
Recommend


2 slides
Designer Portfolio for Client Showcase Presentation
Showcase your creative work with the Designer Portfolio for Client Showcase Presentation. This sleek layout emphasizes visual storytelling, making it ideal for graphic designers, illustrators, and creatives presenting to potential clients. Highlight your projects in a clean, modern format. Compatible with Canva, PowerPoint, Keynote, and Google Slides for full customization.


5 slides
Creative Problem Solving with Design Thinking Presentation
Bring your innovation process to life with the Creative Problem Solving with Design Thinking Presentation. This visual layout uses gear and bulb icons to highlight four essential stages in the design thinking approach. Perfect for brainstorming sessions, innovation pitches, and product development workshops. Easily editable in Canva, PowerPoint, Google Slides, and Keynote.


26 slides
Economic Market Analysis Simple Presentation
Delve into the dynamics of the marketplace with this professionally crafted economic market analysis presentation template. Designed for clarity and impact, it features a compelling blend of bold color blocks and fluid shapes, encapsulating the movement and rhythm of economic trends. The slides are tailored for versatility, from in-depth data visualizations like charts and graphs to conceptual diagrams and strategic layouts. High-resolution imagery of financial symbols reinforces the analytical theme, while the structured design makes complex information accessible and engaging. Whether presenting to stakeholders or students, the template promises to convey the intricacies of market forces with precision and authority. Offering seamless functionality across PowerPoint, Keynote, and Google Slides, it’s the perfect tool for anyone looking to articulate economic concepts with both confidence and sophistication. It's not just a presentation; it's a conversation starter, setting the stage for informed decision-making and insightful discussions.


8 slides
Task Management Process Presentation
Bring clarity and momentum to every workflow with this clean, step-by-step layout designed to break down tasks, handoffs, and progress stages. This presentation helps teams visualize responsibilities and streamline execution with ease. Fully customizable and ready to use in PowerPoint, Keynote, and Google Slides.


7 slides
Aviation Infographic Presentation Template
Featuring our light, vibrant and eye-catching aviation infographic template compatible with PowerPoint. The theme is designed to show you the key facts and figures about your topic, so you can easily produce a stunning presentation. This infographic is a visual representation of information related to aviation, presented in a clear and visually appealing way. With this template cover topics such as aviation history or the economic impact of the aviation industry. The information in the template can be in the form of statistics, data visualizations, timelines, maps, or other graphical elements.


2 slides
Stylish Title Cover Presentation for Reports Presentation
Set the tone with a title slide that means business—without being boring. This stylish cover layout gives your report presentations a polished, modern look while keeping the focus clear and professional. Ideal for executive updates or client-facing decks, it’s fully editable and works perfectly in PowerPoint, Keynote, and Google Slides.


4 slides
Construction Project Planning
Streamline your workflow and improve clarity with this vibrant project planning wheel designed for construction professionals. This slide helps visualize key phases—such as planning, team coordination, and logistics—using color-coded segments and editable icons. Perfect for architects, contractors, and project managers. Fully customizable in PowerPoint, Keynote, and Google Slides.


5 slides
Country Data Mapping in South America Presentation
Present data with impact using the Country Data Mapping in South America Presentation. This clean, professional slide highlights key statistics across up to five countries using labeled connectors, icons, and a gradient-based map. Ideal for showcasing regional growth, KPIs, or operational breakdowns across South America. Fully editable and compatible with PowerPoint, Keynote, Google Slides, and Canva.


4 slides
Business Executive Summary Report
Get straight to the point with a clean, colorful slide designed to capture big-picture business insights at a glance. Perfect for summarizing key metrics, strategies, and results, this executive summary template keeps your presentation sharp, structured, and impactful. Fully compatible with PowerPoint, Keynote, and Google Slides for maximum flexibility.


7 slides
Project Summary Infographic
This collection of project summary slides is designed to streamline the presentation of project outcomes and statuses effectively. The slides feature a variety of layouts tailored to emphasize critical data and conclusions, making them an ideal choice for project managers and teams who need to report on progress and results. Each slide is crafted with a clear focus on visual hierarchy, which helps in directing the viewer's attention to the most important information. Use of bullet points, charts, and infographics enhances the viewer's understanding by breaking down complex data into easy-to-digest visuals. Color coding is effectively utilized to differentiate between themes or topics, which aids in quick comprehension. These slides are versatile enough to be used in various scenarios, such as end-of-project presentations, stakeholder updates, or team meetings. They provide a professional and polished way to showcase project achievements, timelines, and future steps. Overall, these summary slides are a valuable tool for anyone looking to present project information clearly and concisely, ensuring that key points are communicated effectively and are memorable.


8 slides
Revenue Projection and Expense Planning Presentation
Simplify your financial forecasting with our Revenue Projection and Expense Planning template. This intuitive tool is designed for effectively mapping out revenue streams and budget allocations, making it easier to visualize and manage financial goals. Ideal for businesses and finance professionals, it's compatible with PowerPoint, Keynote, and Google Slides, ensuring seamless integration into any presentation workflow.


7 slides
Editable Gantt Timeline Presentation
Stay on top of your project deadlines with this Editable Gantt Timeline Presentation. Designed with a clean monthly layout and six task rows, it makes scheduling and tracking progress simple. Customize task names, durations, and icons easily. Perfect for PowerPoint, Keynote, or Google Slides for professional project planning.

22 slides
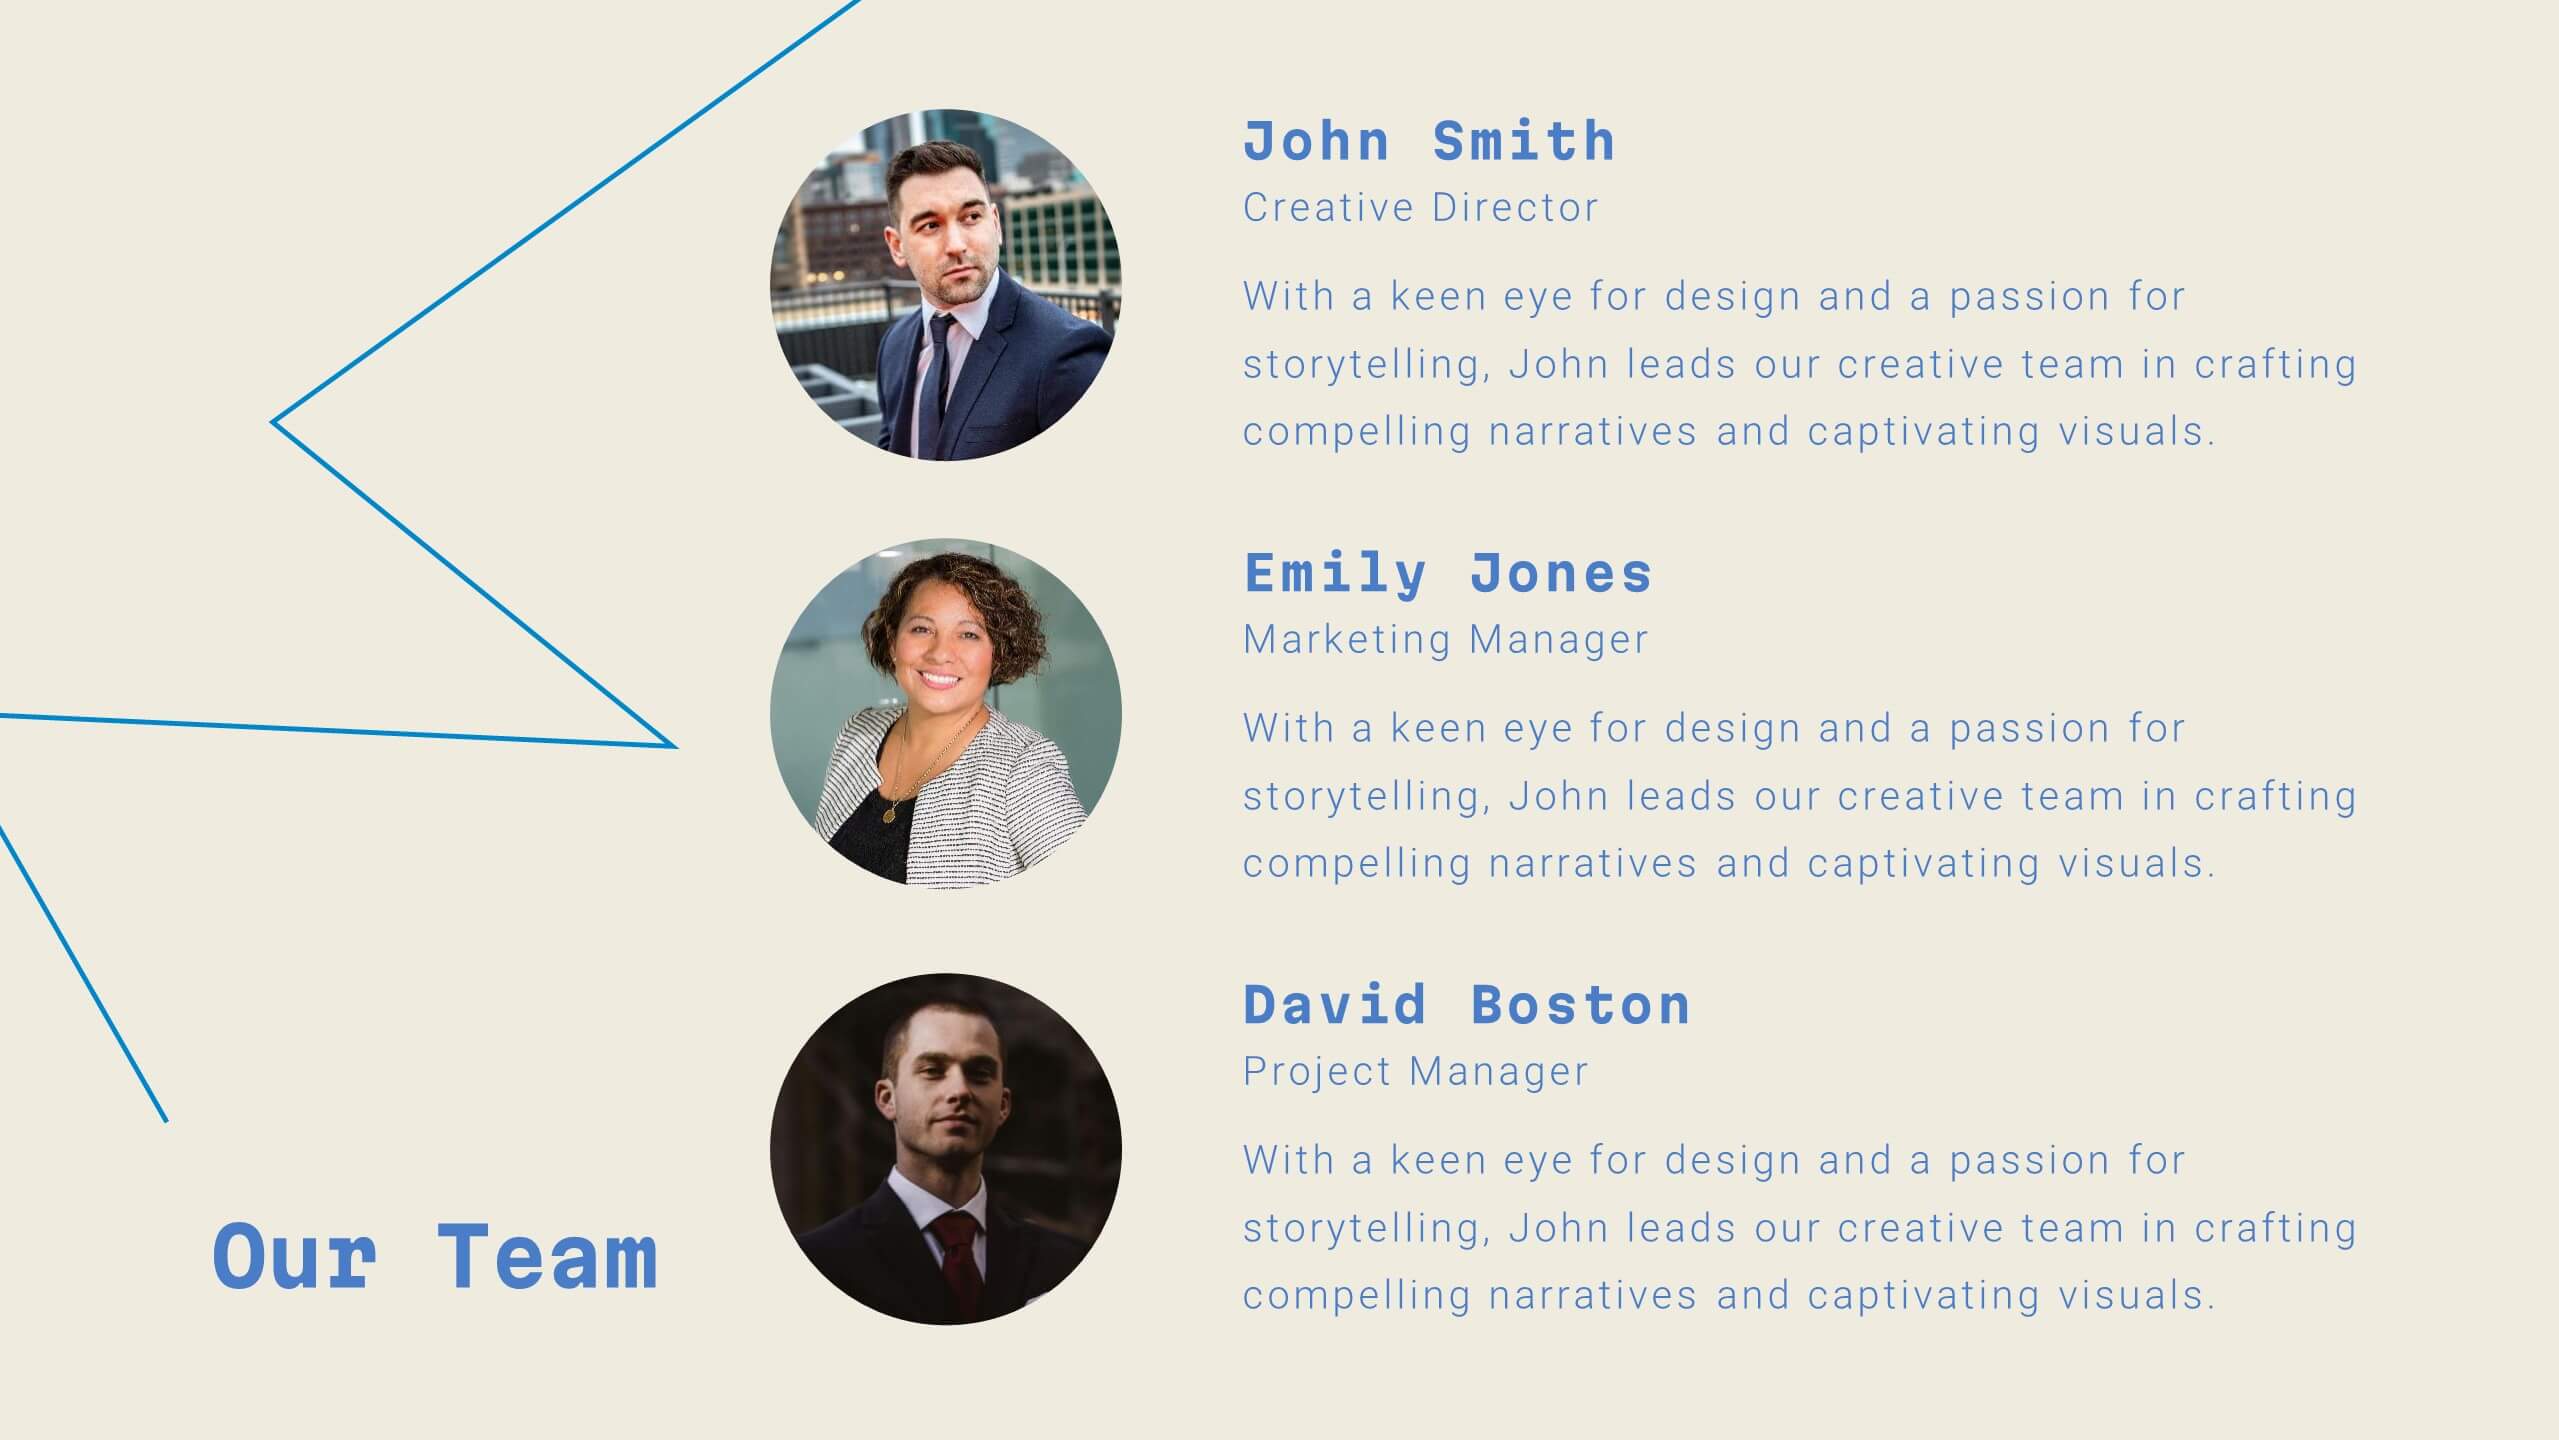
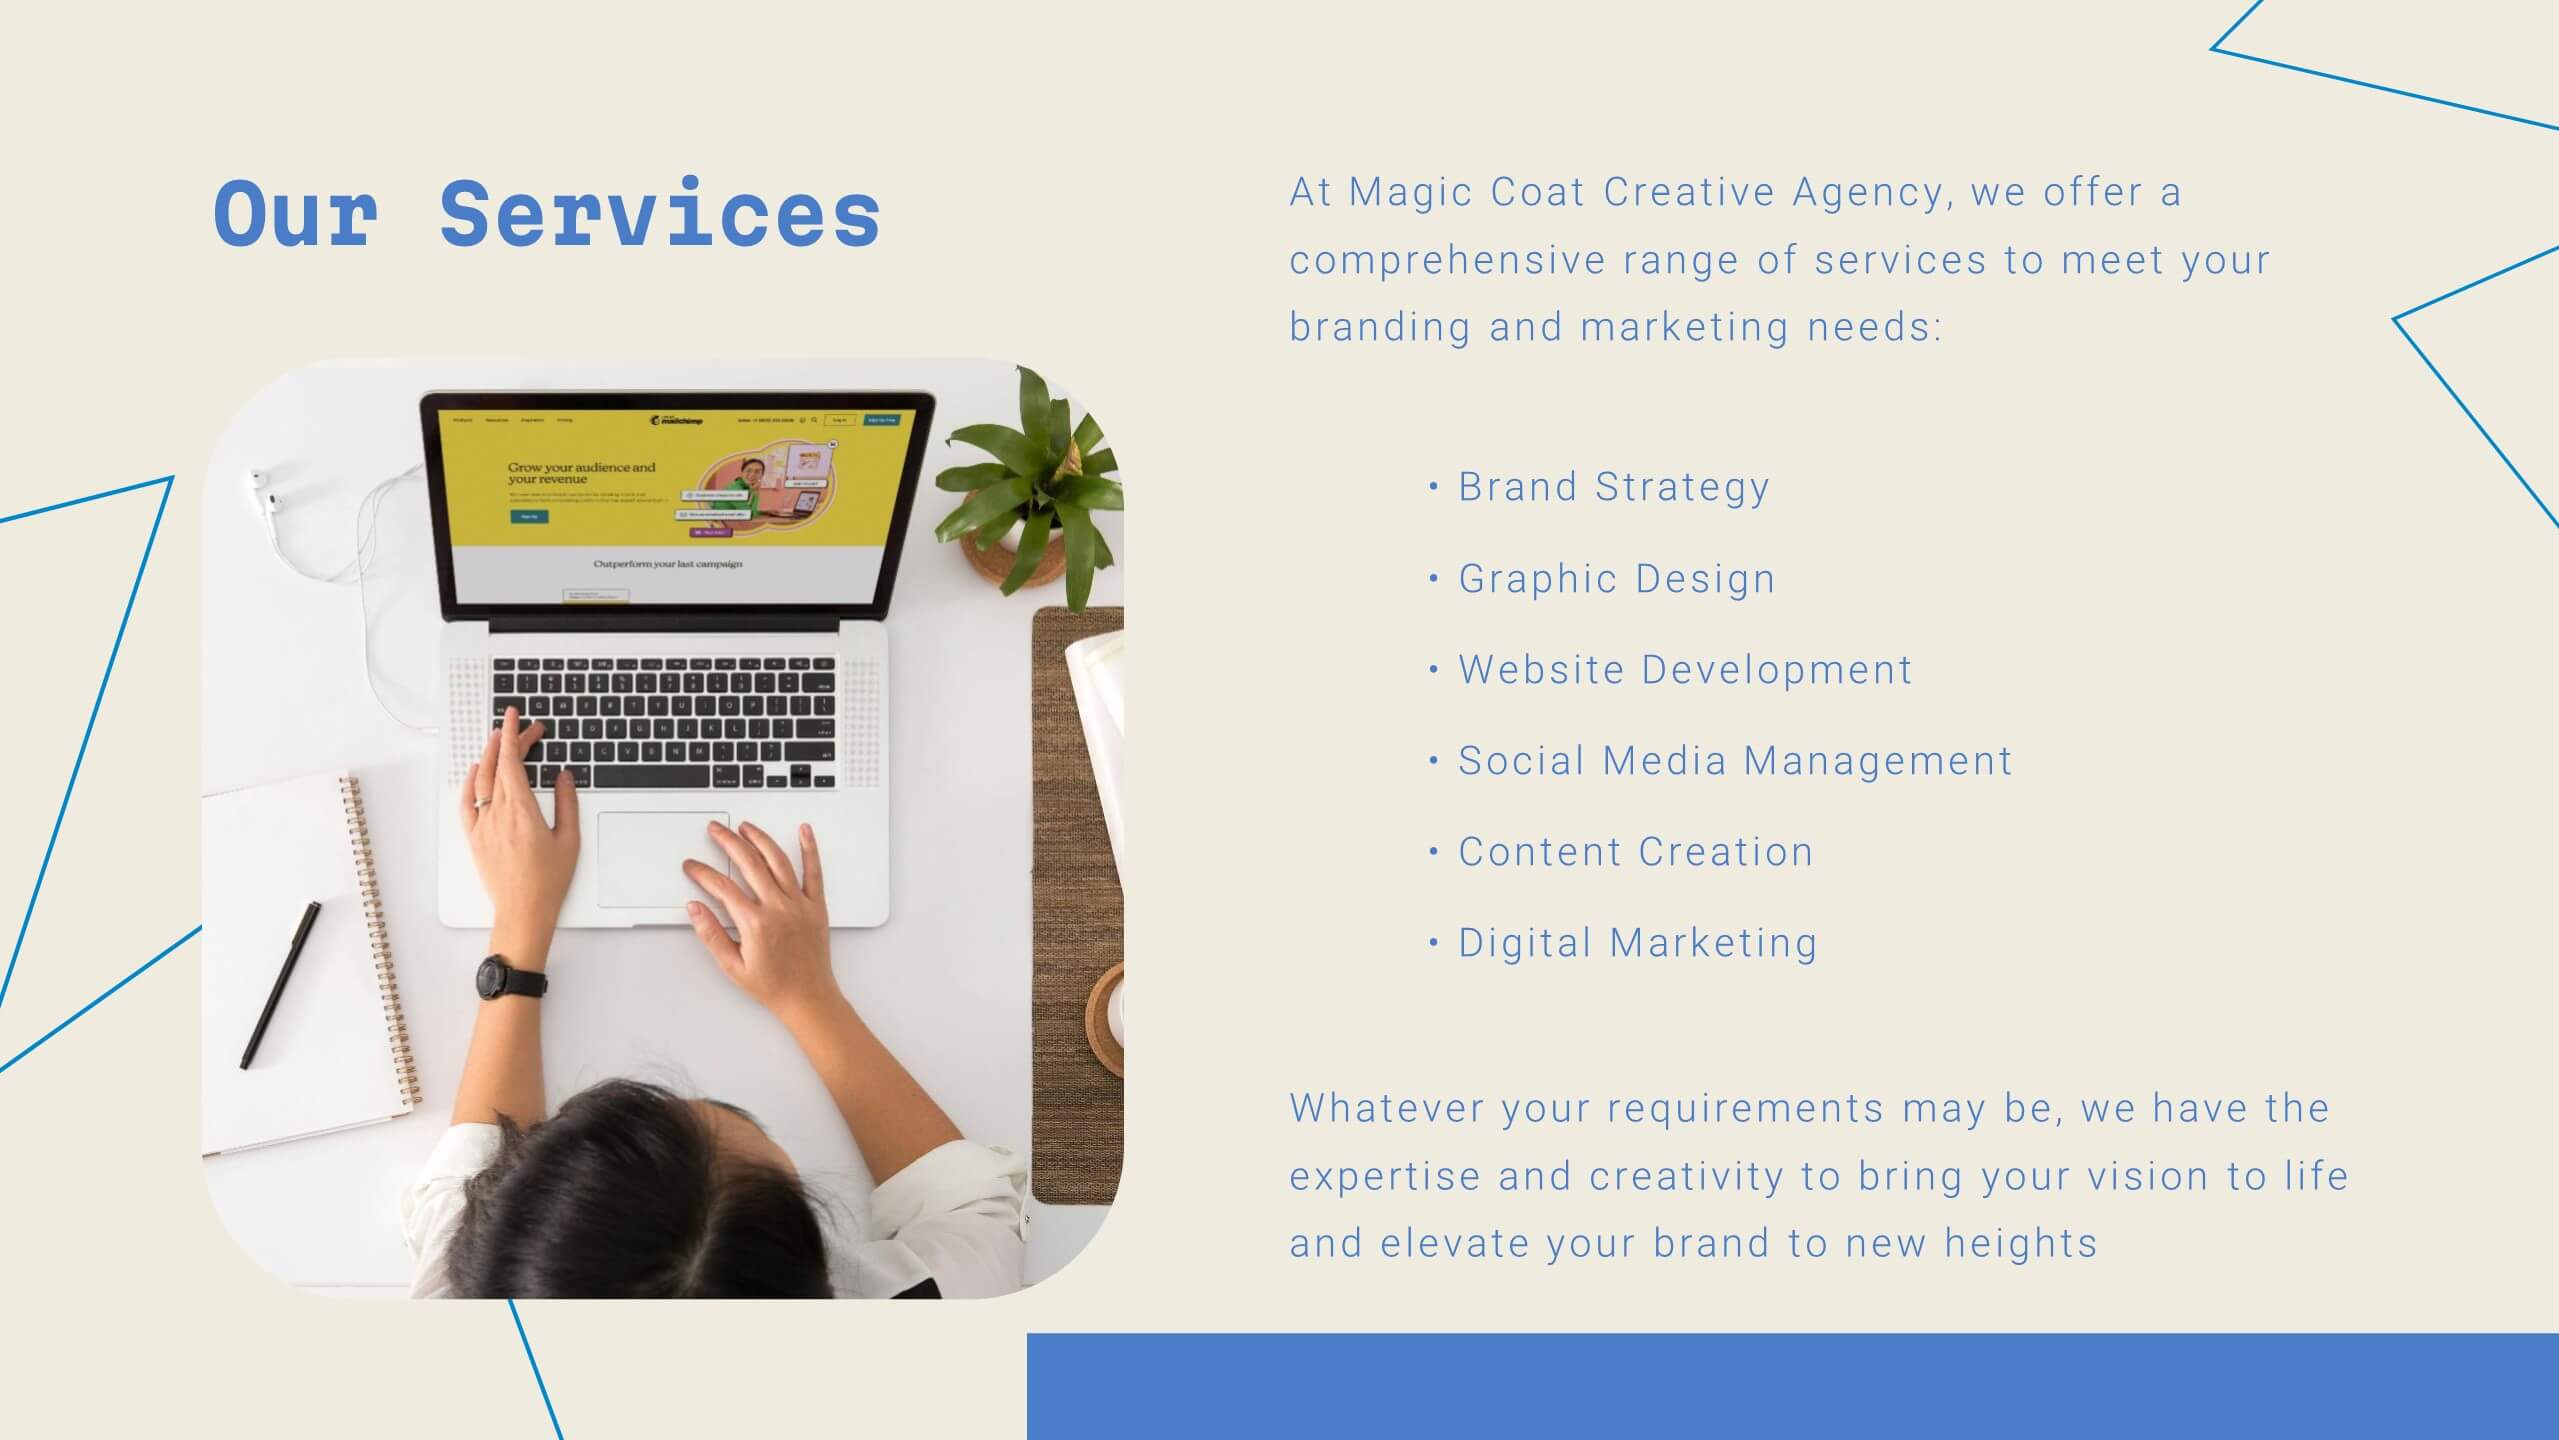
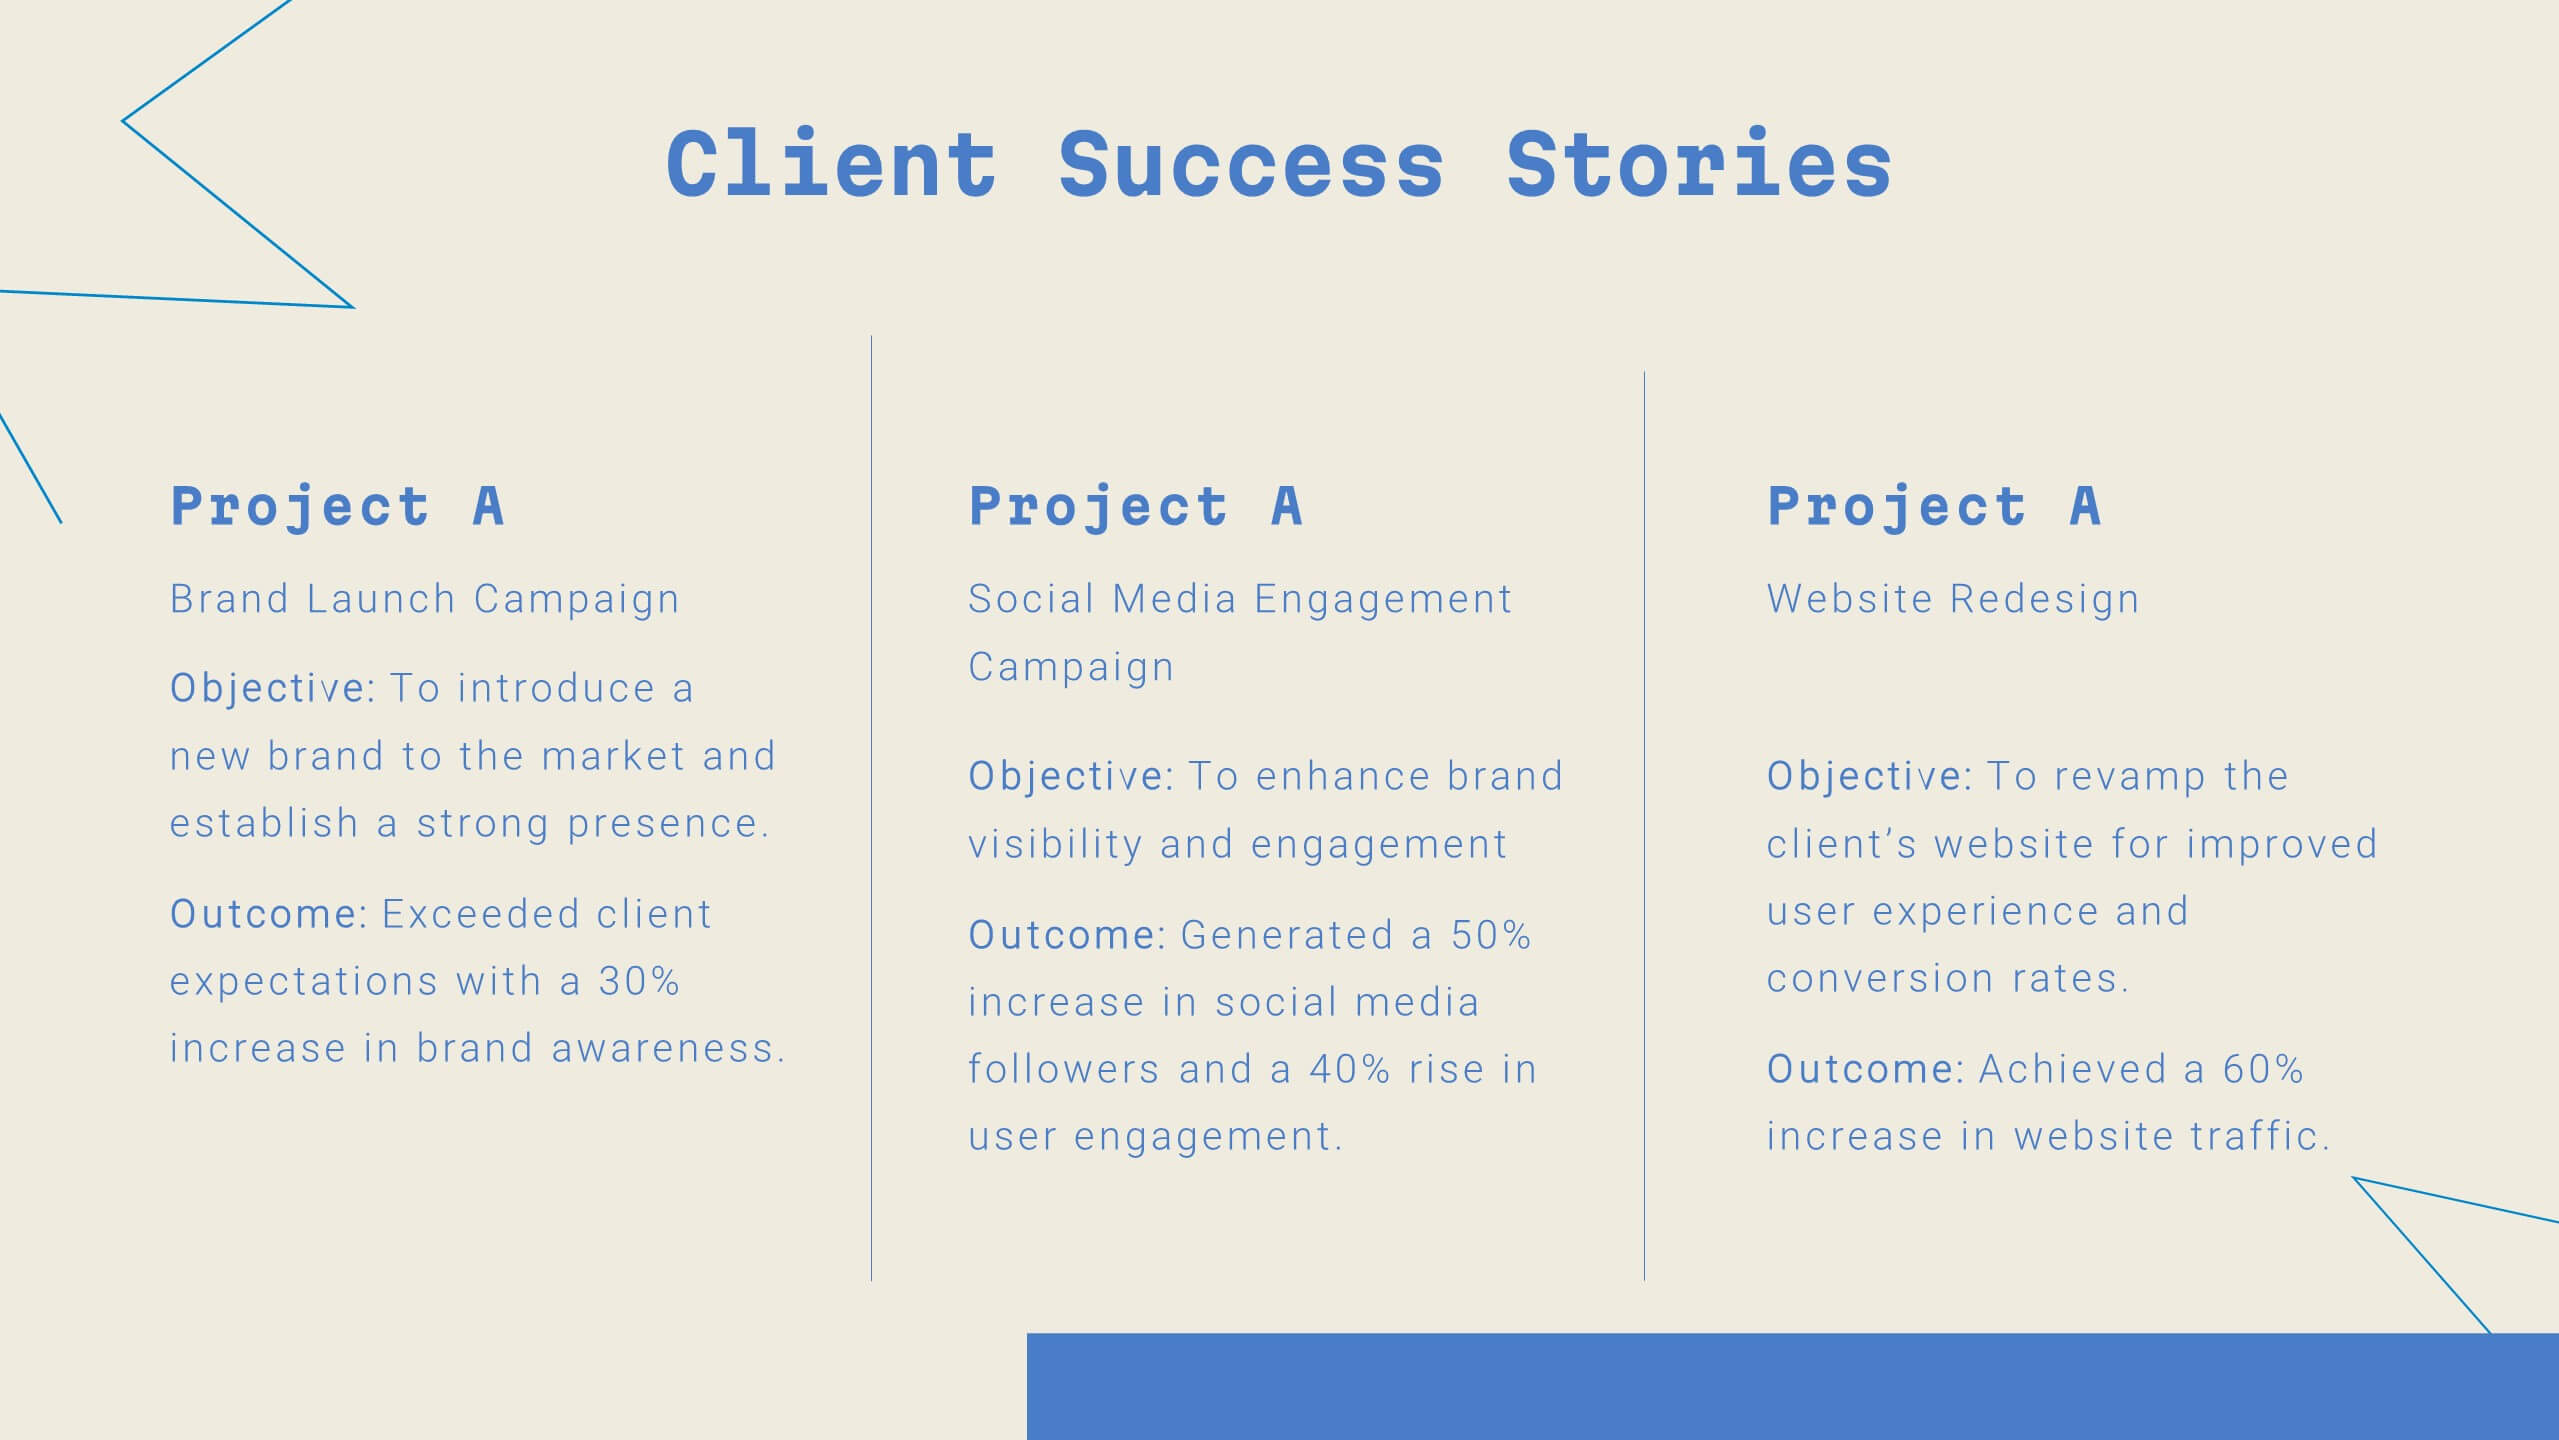
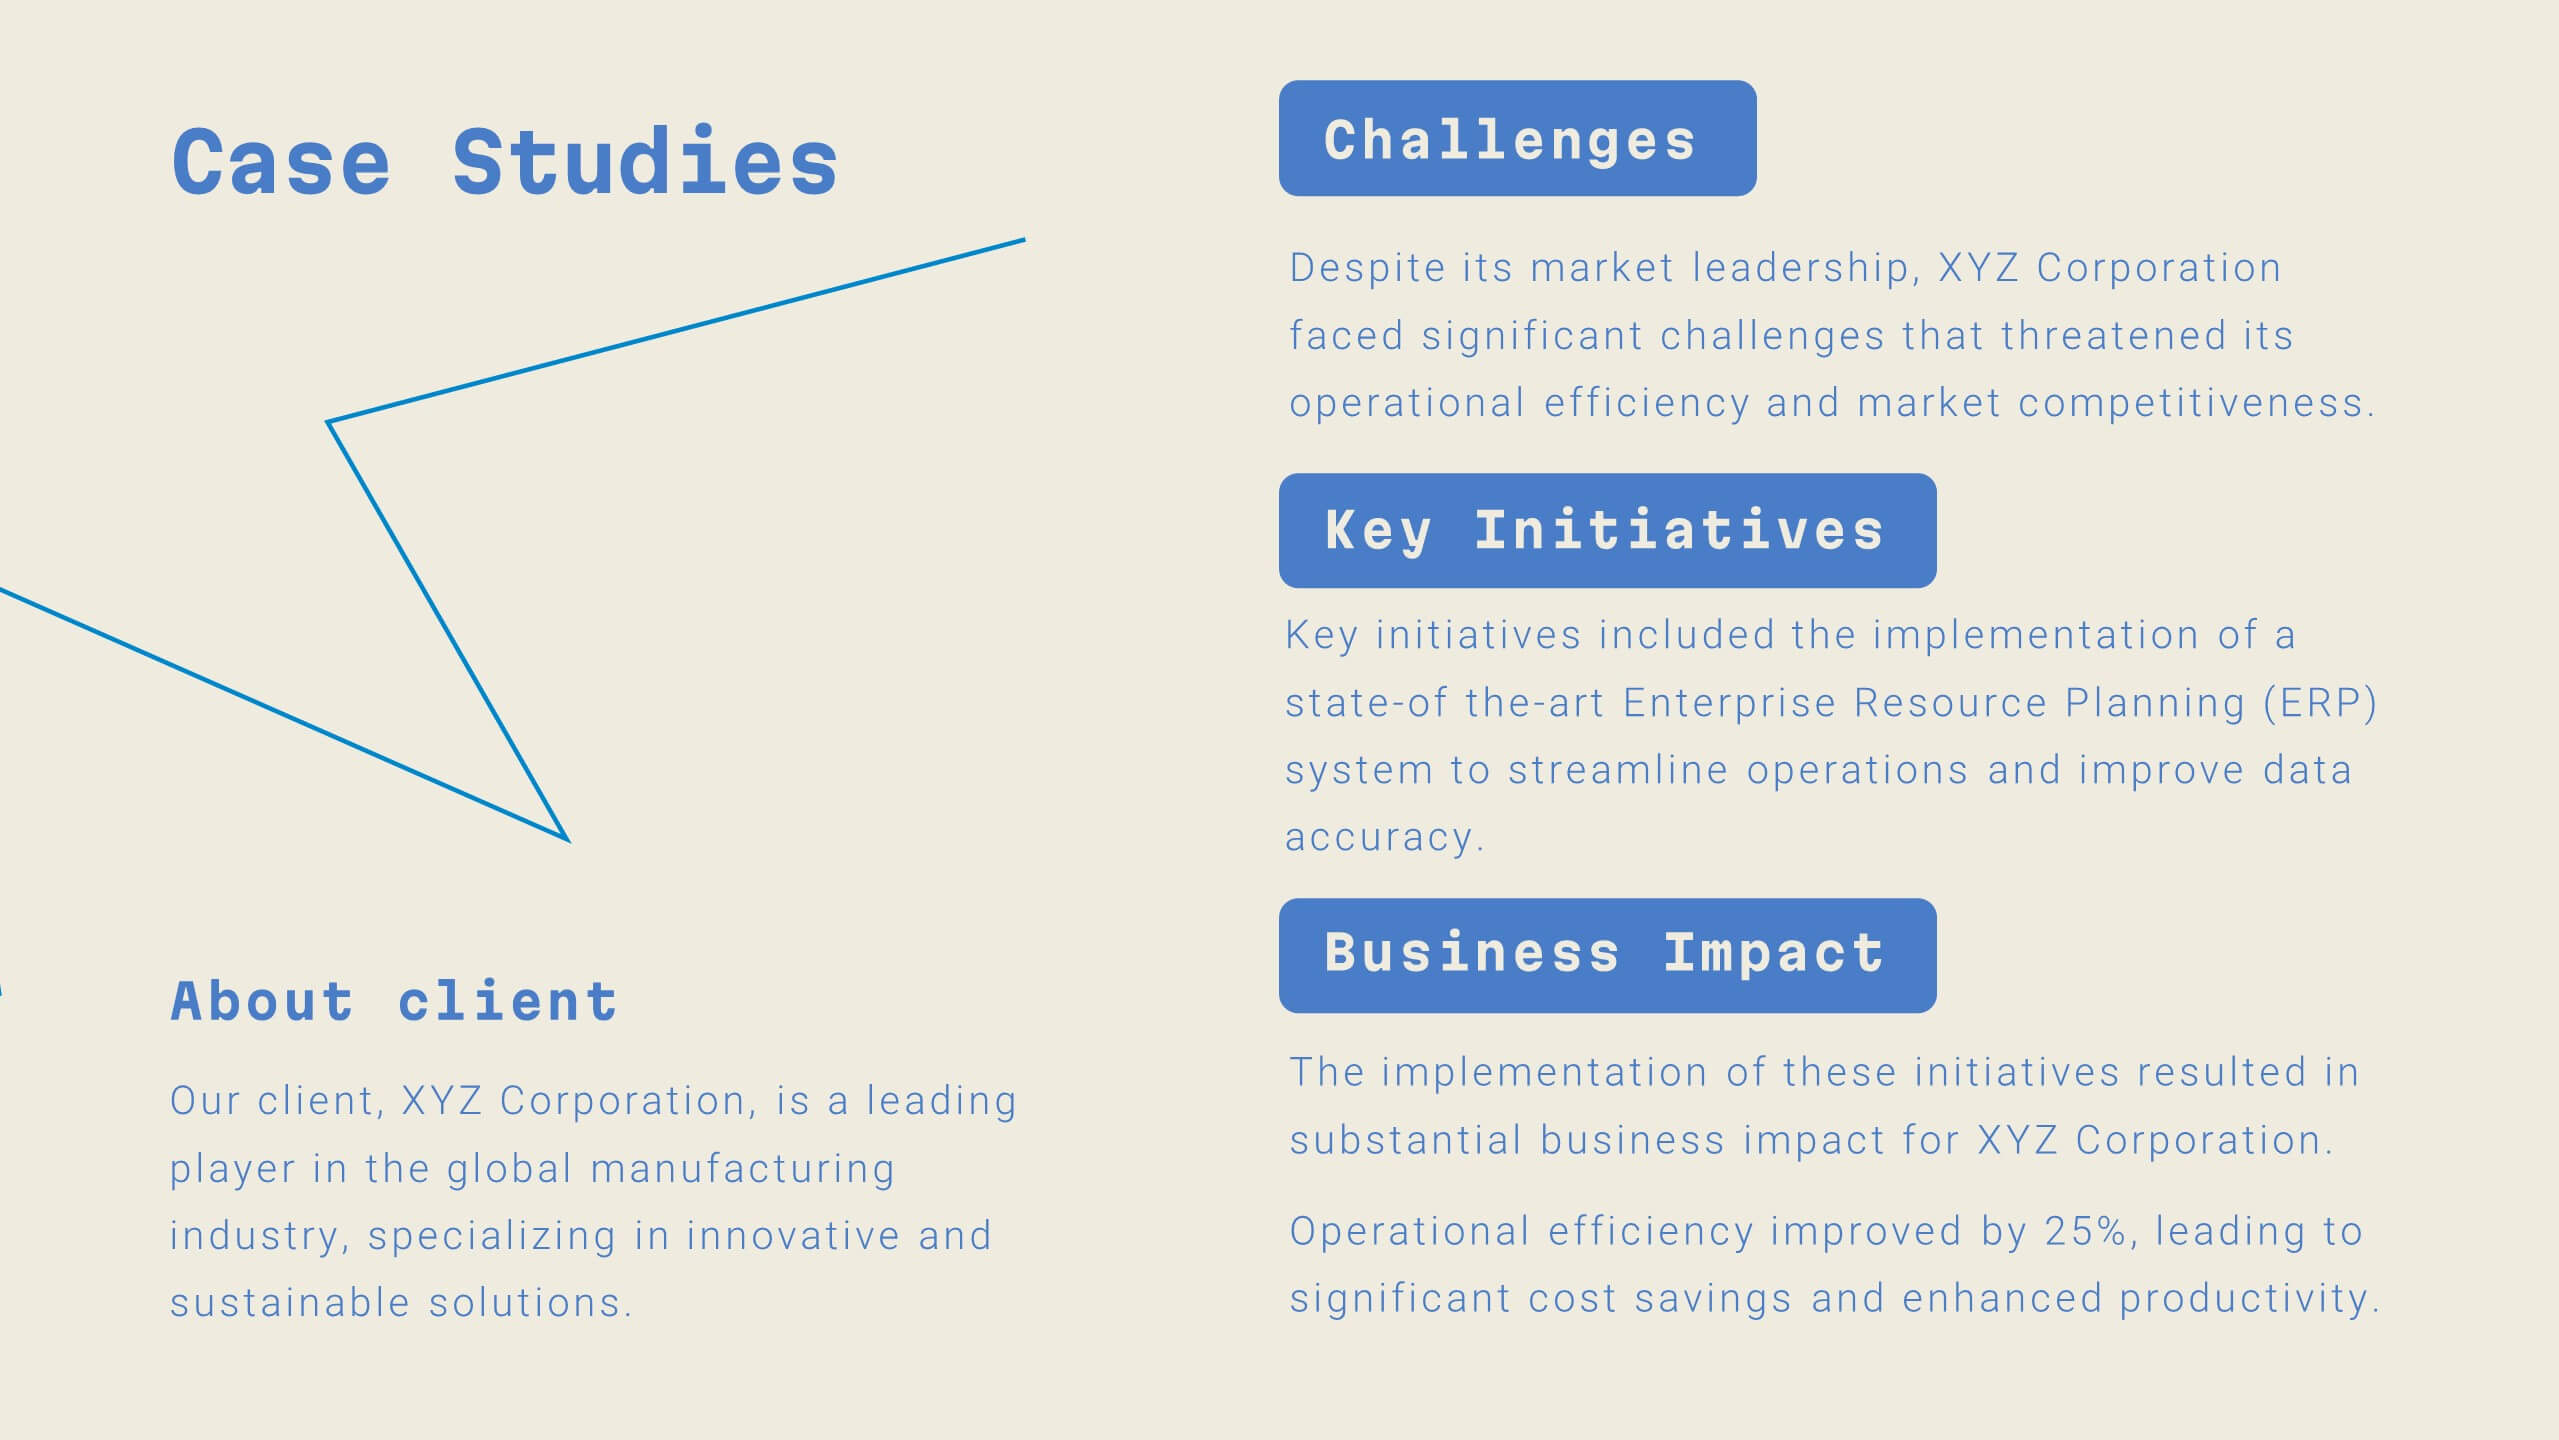
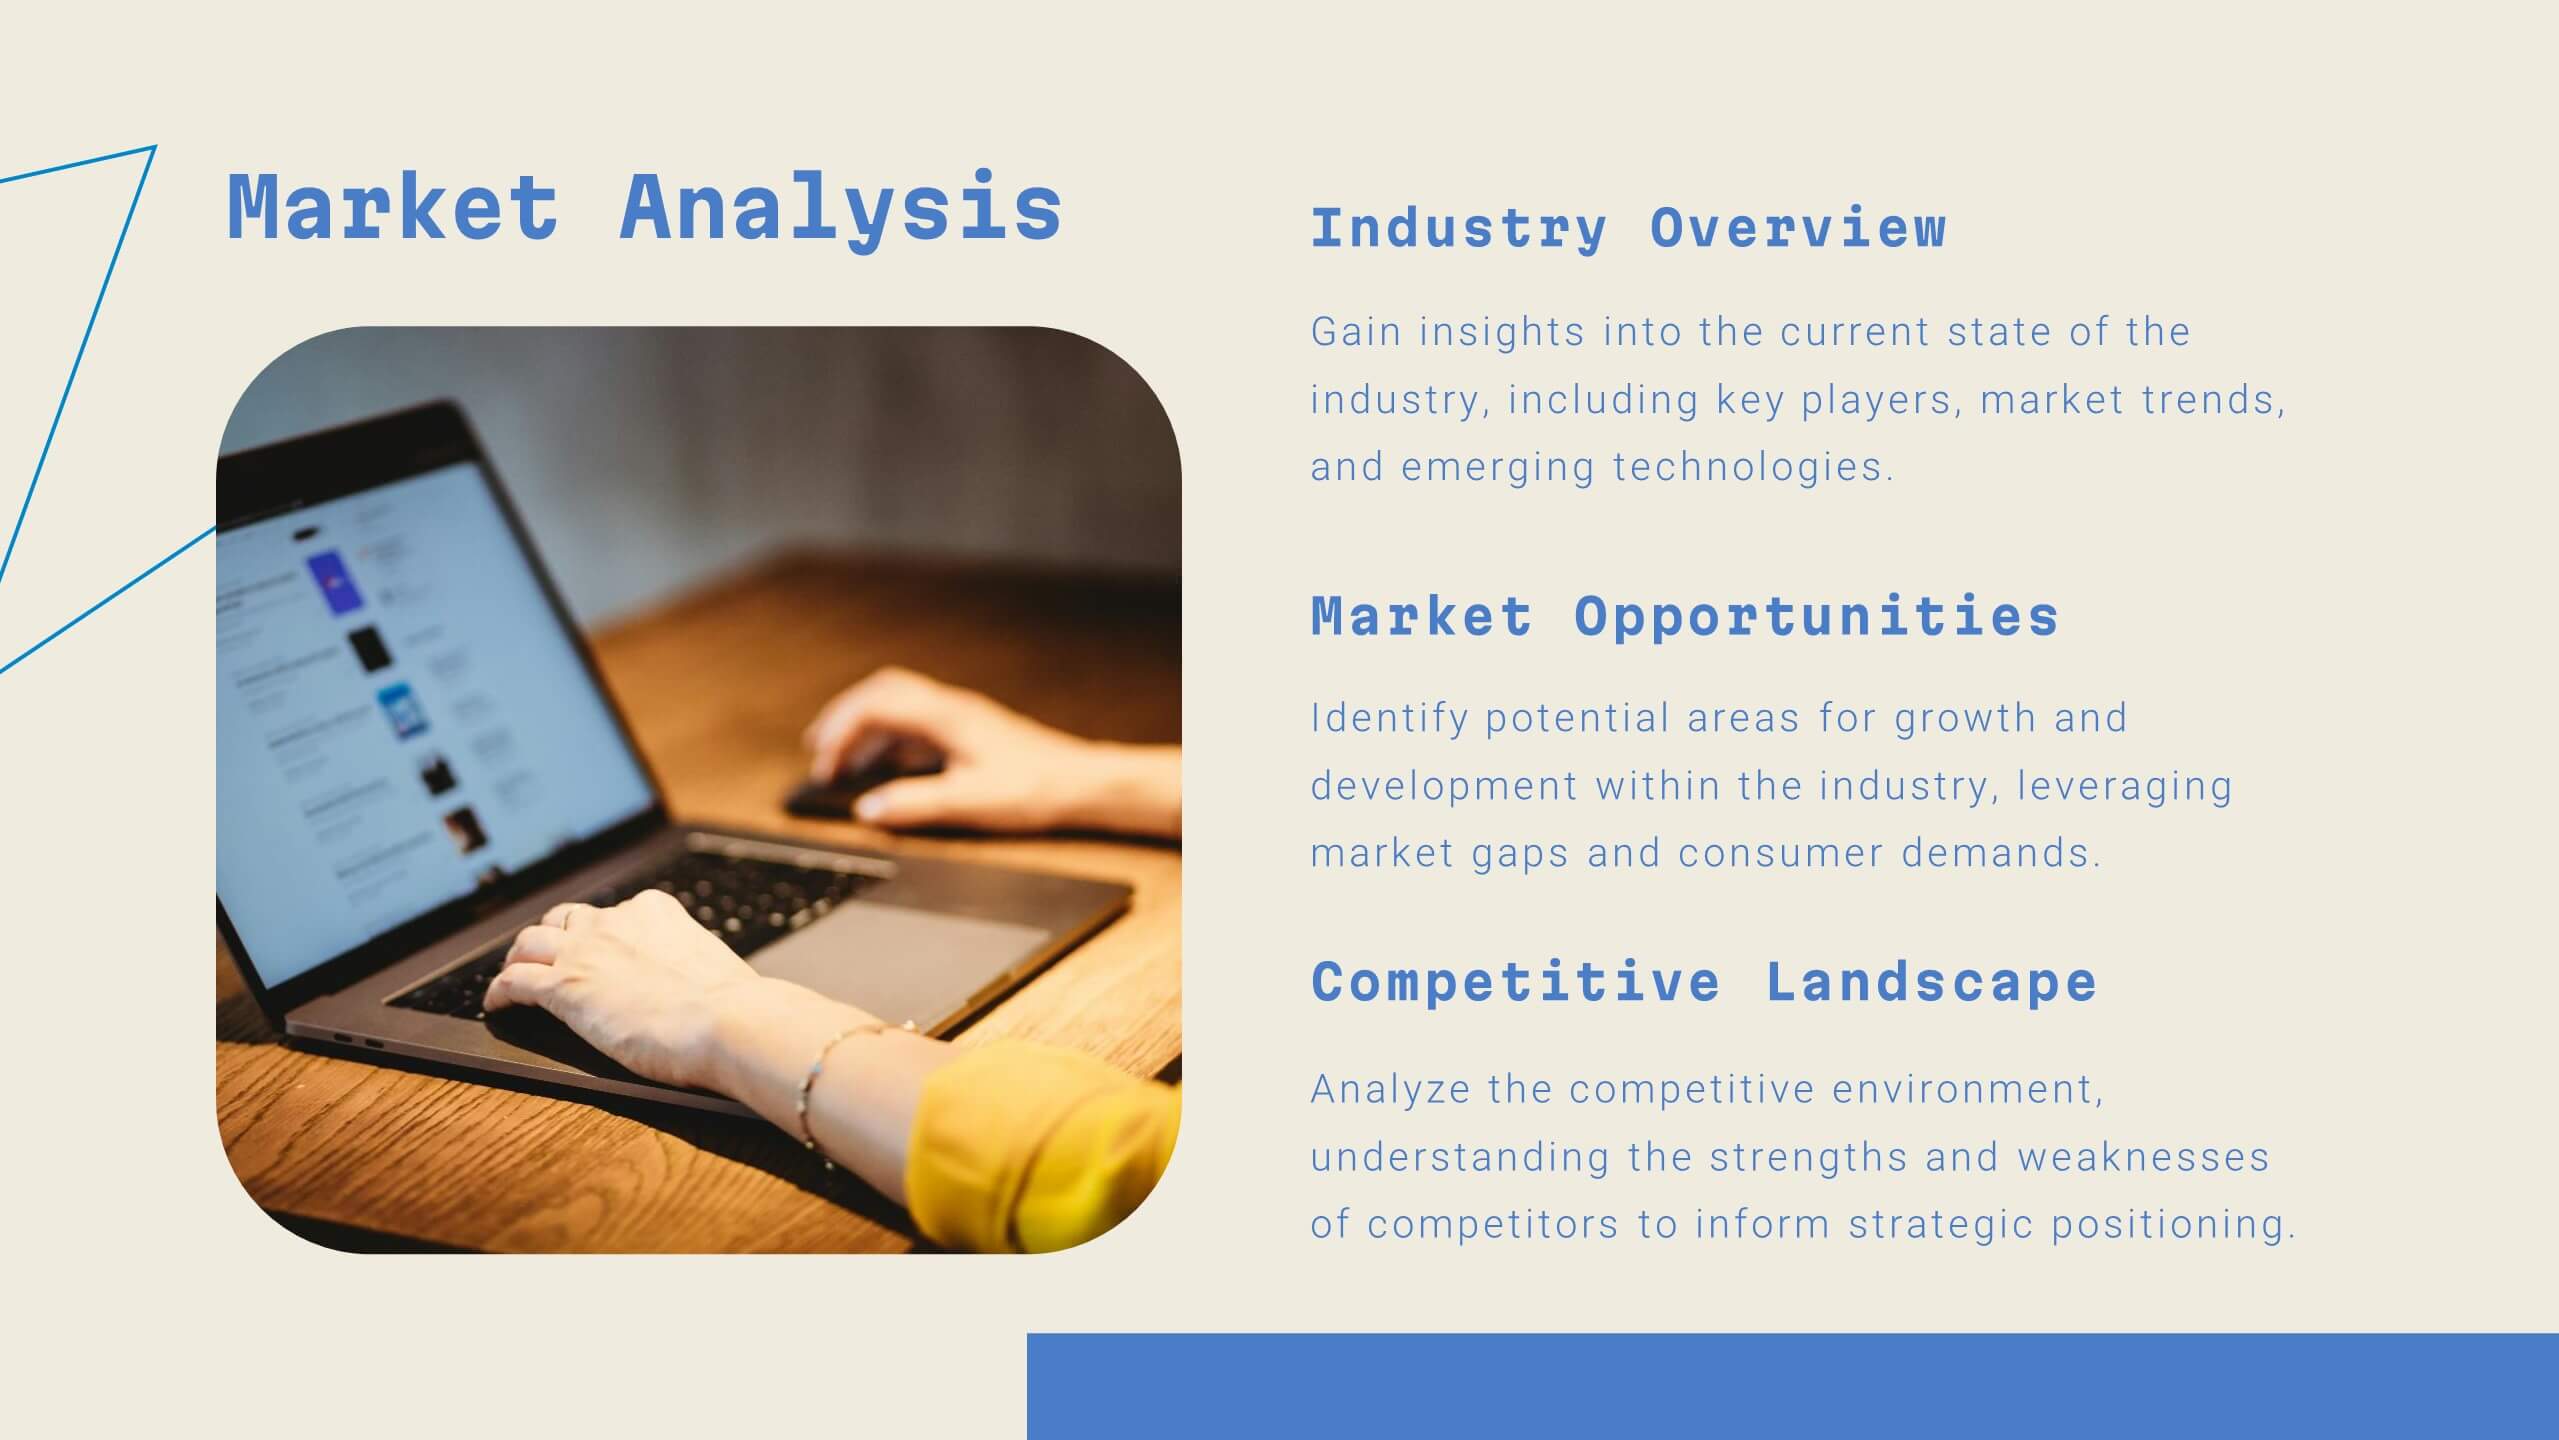
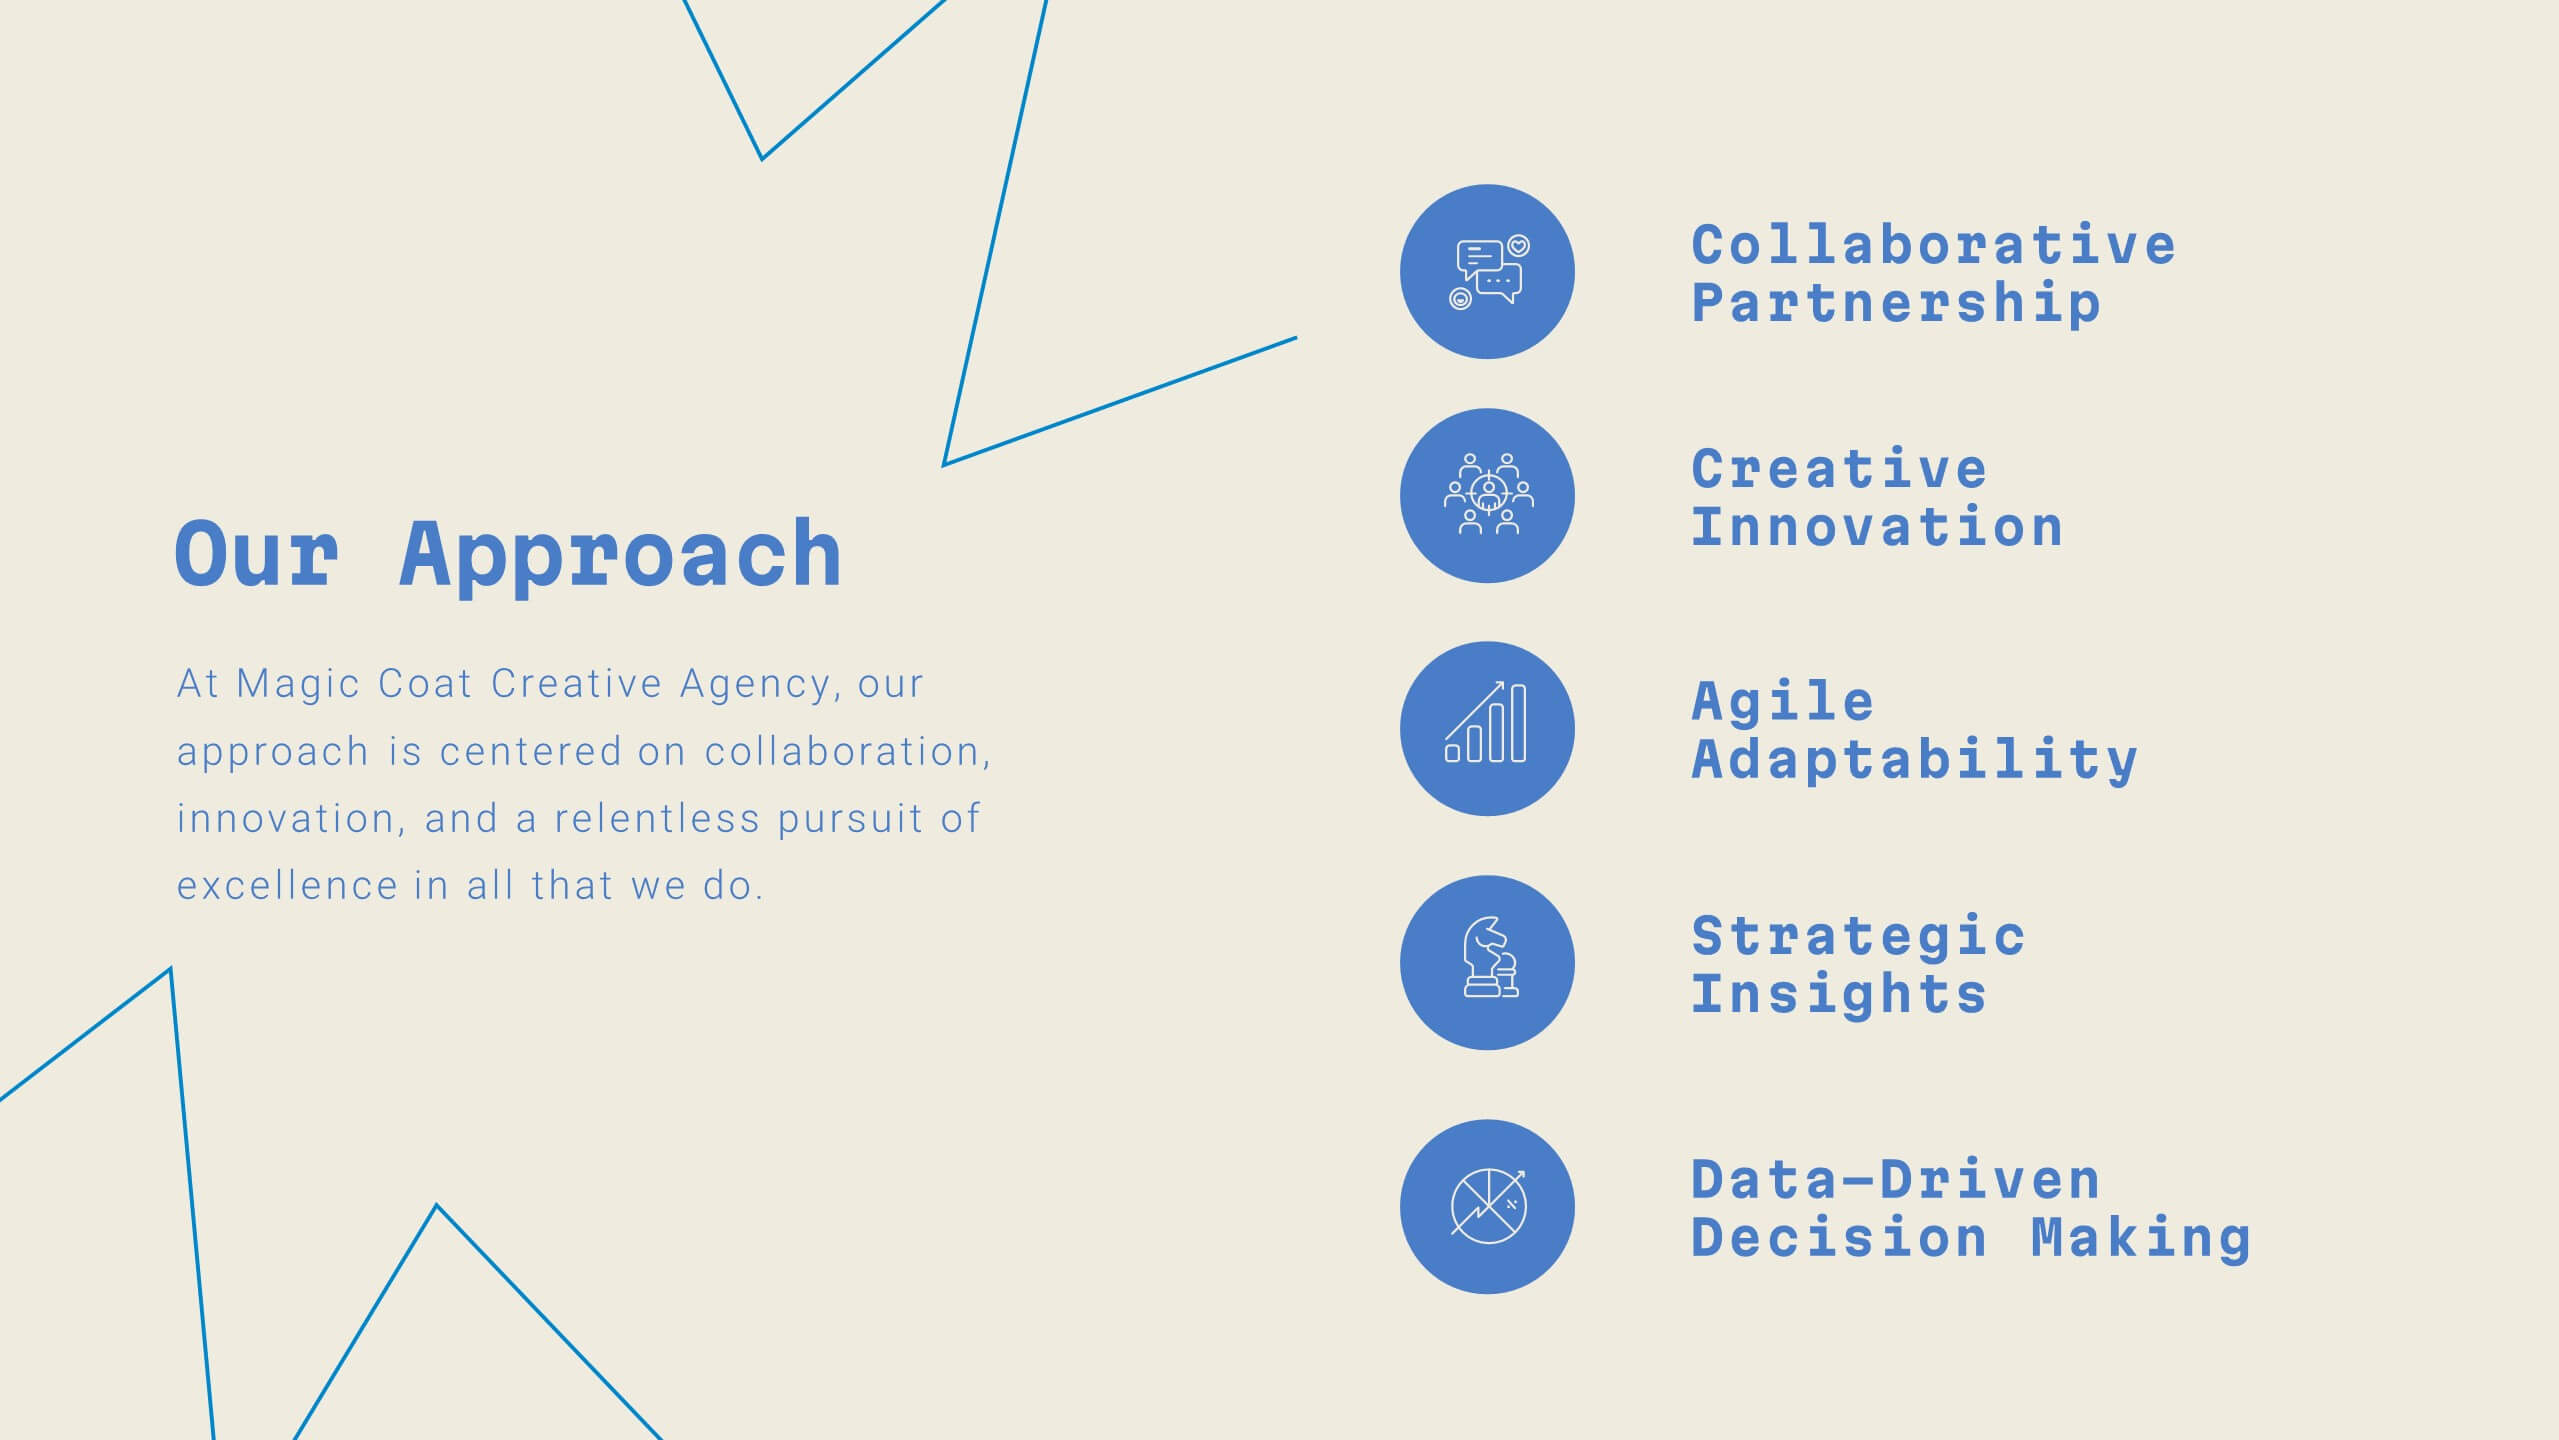
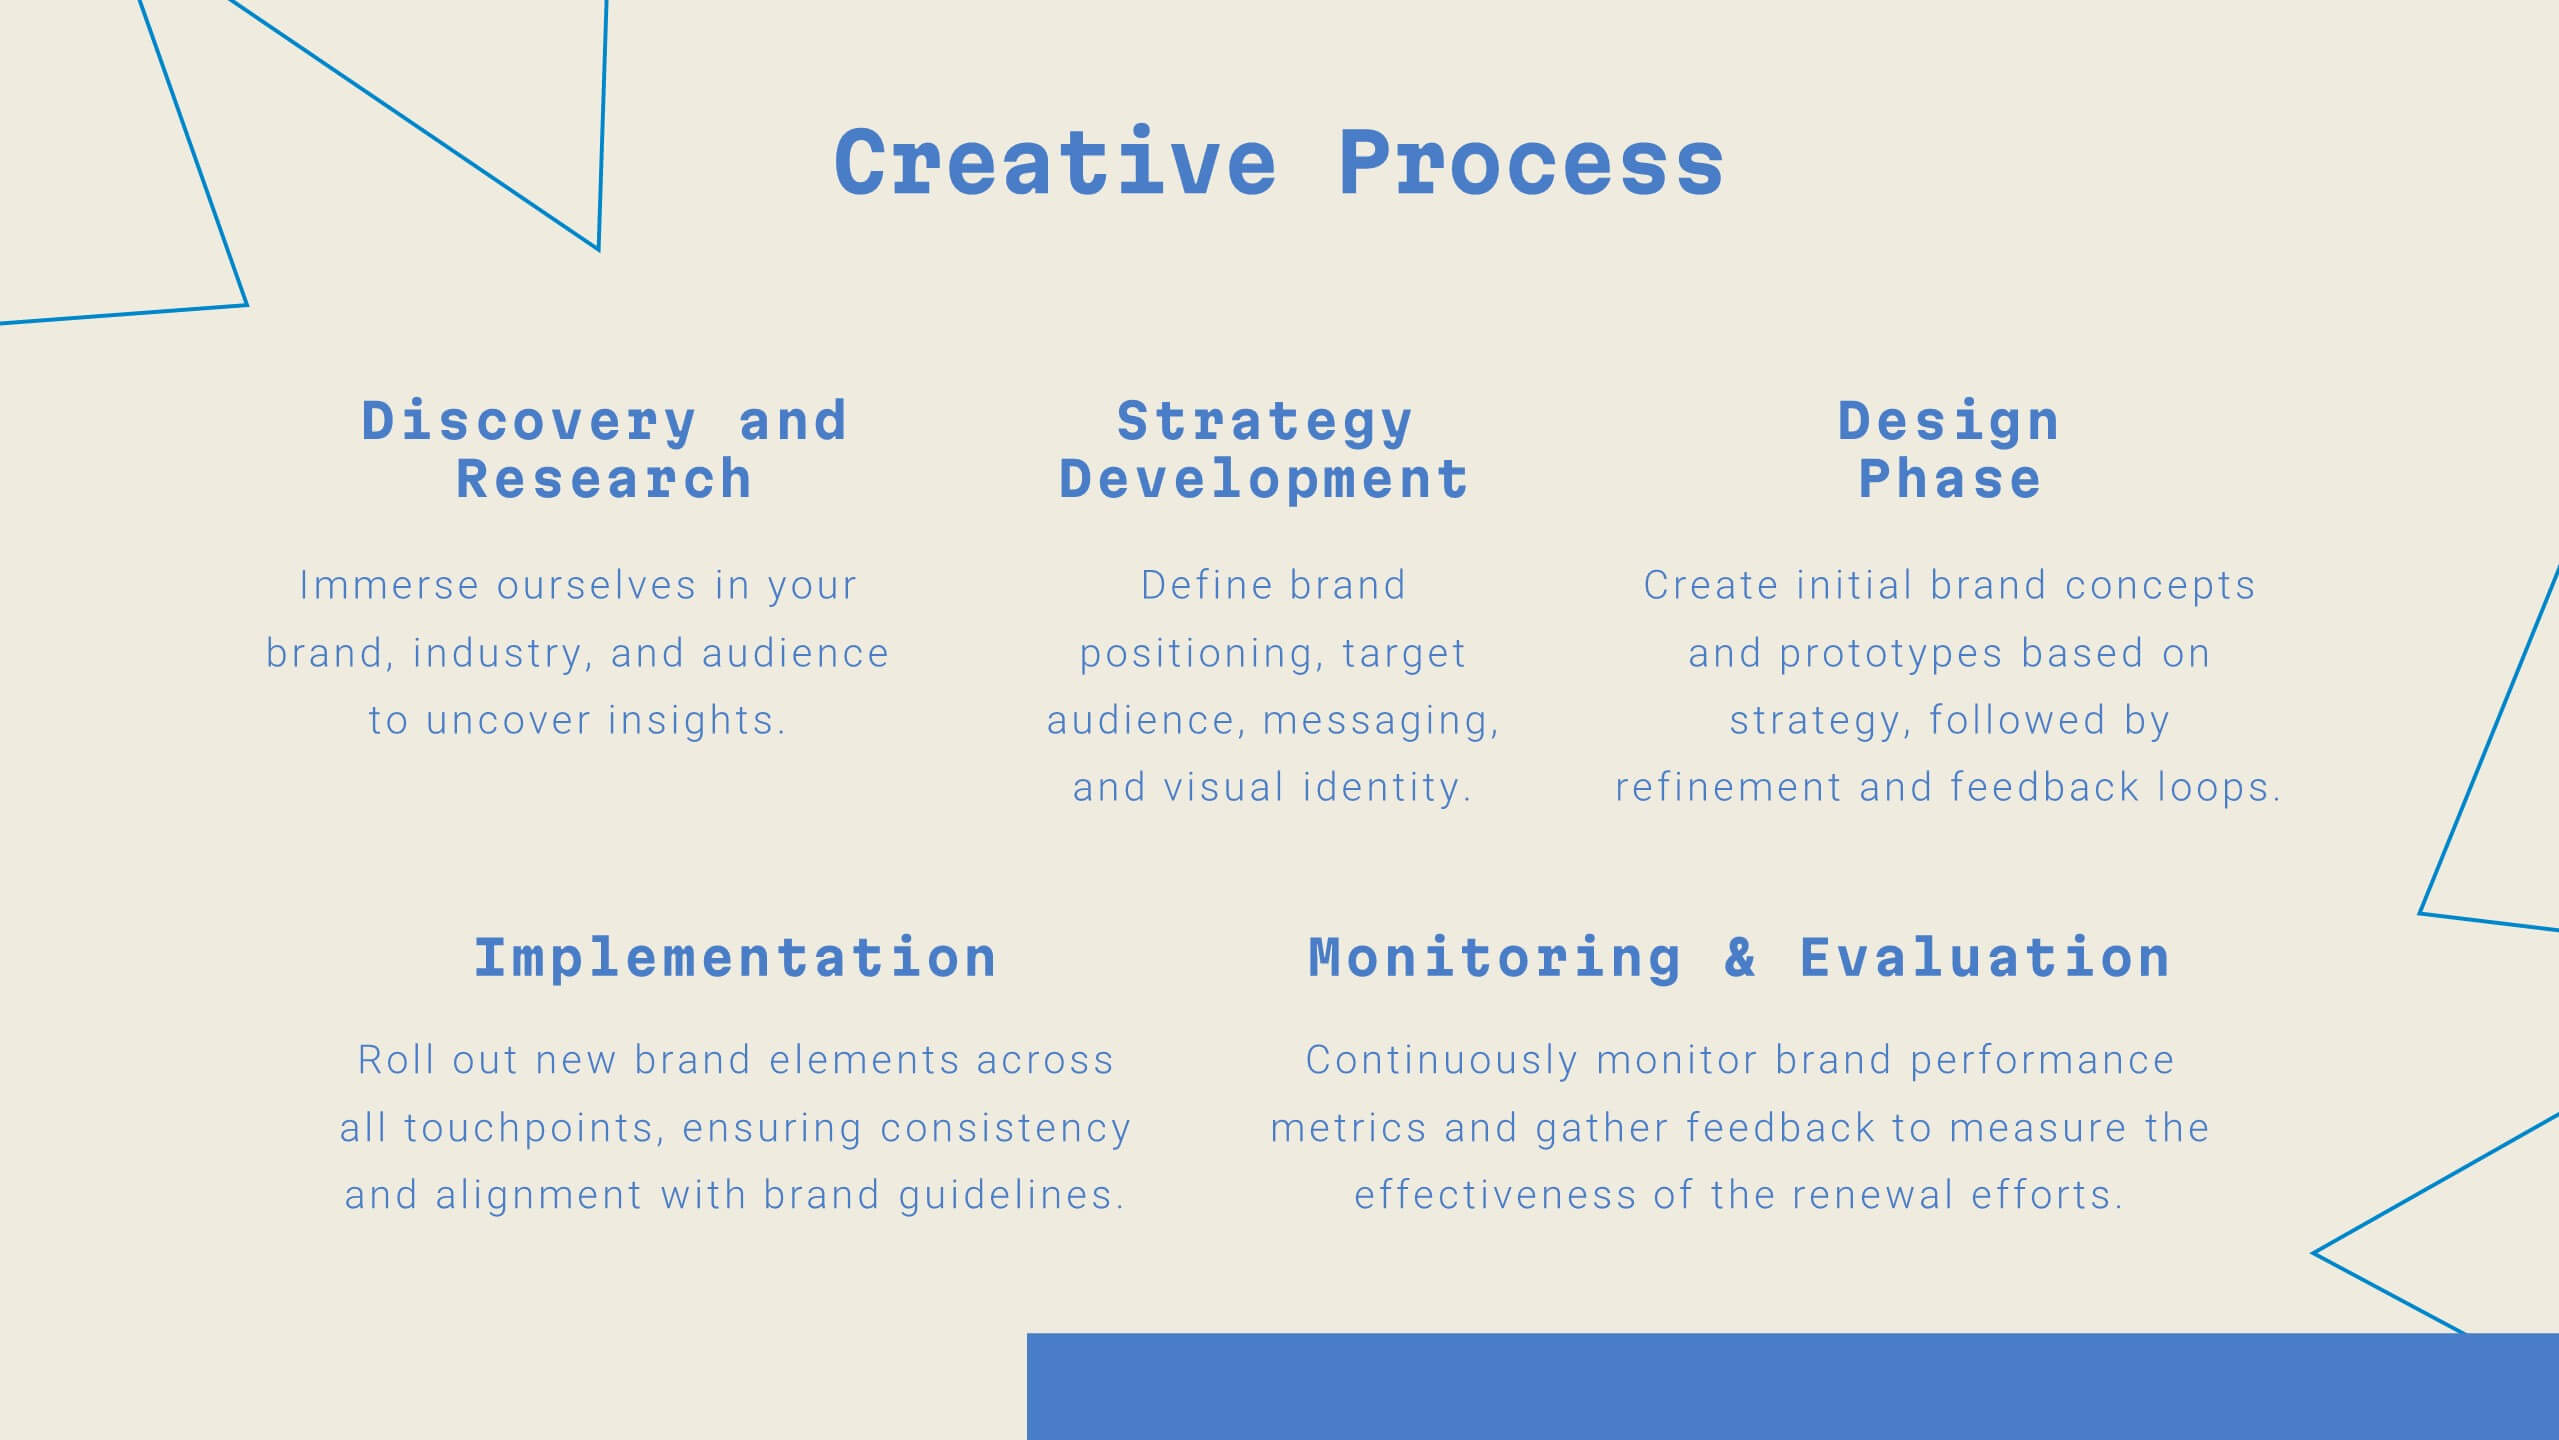
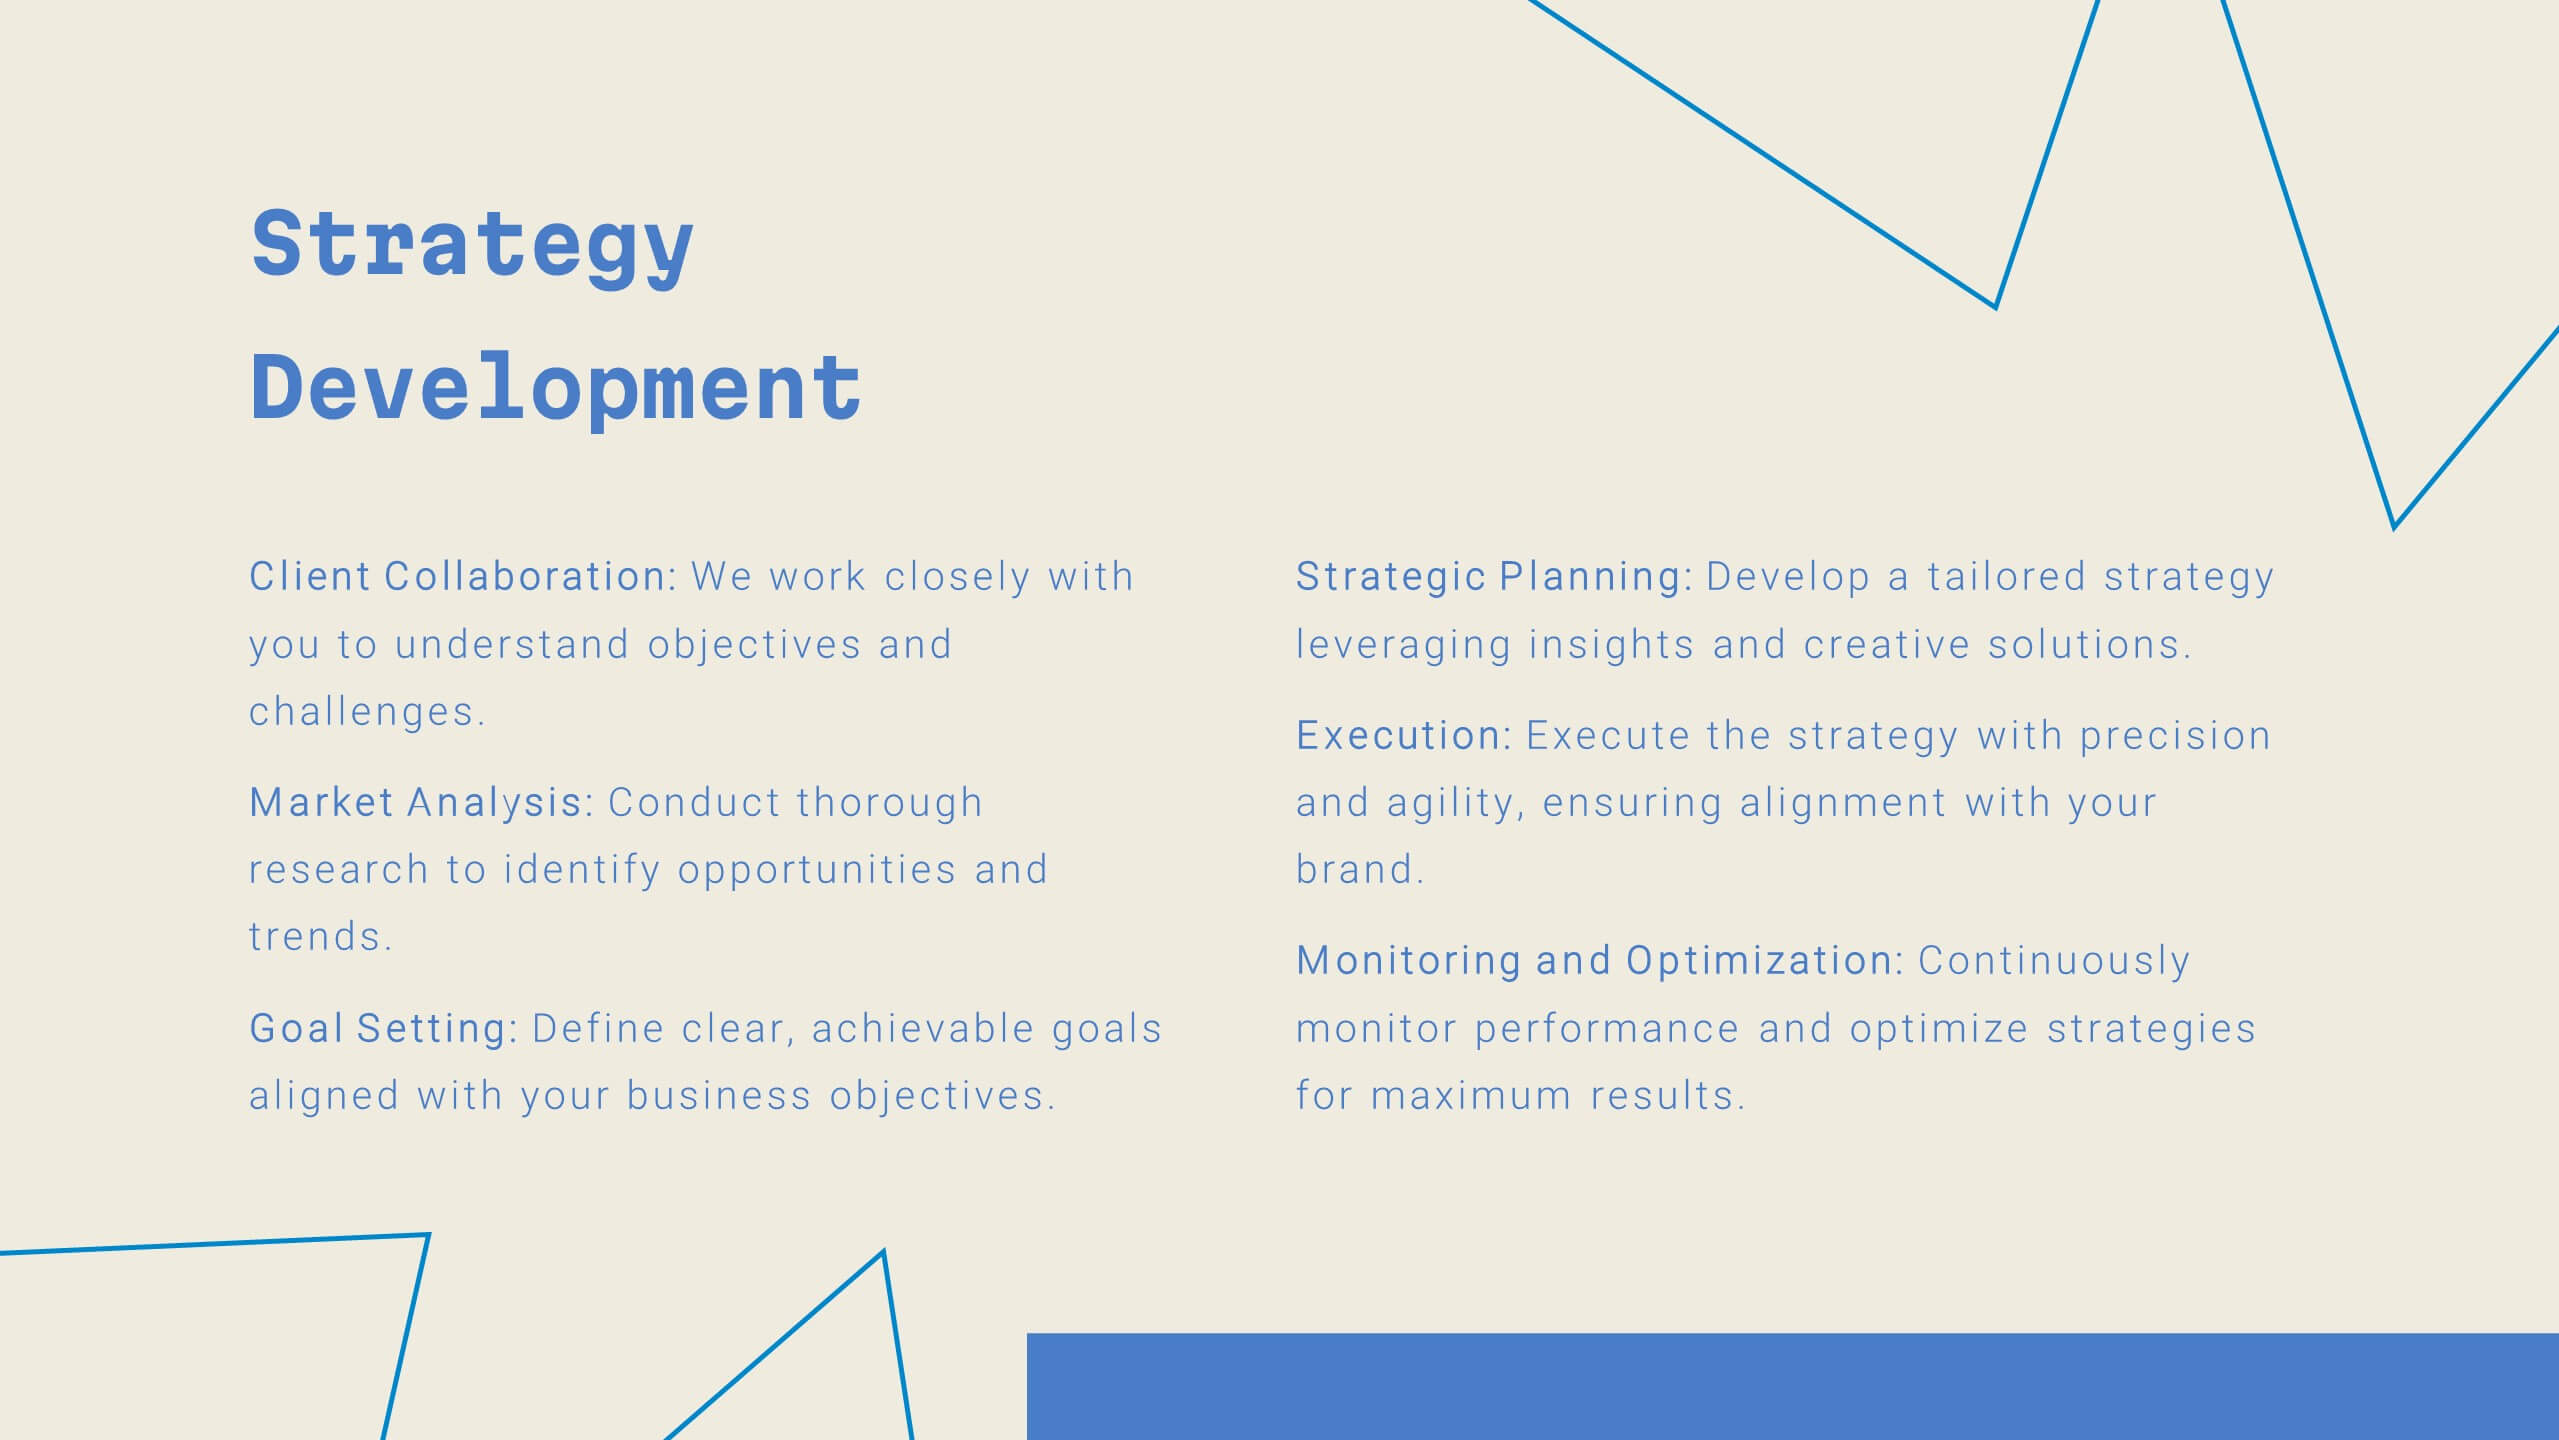
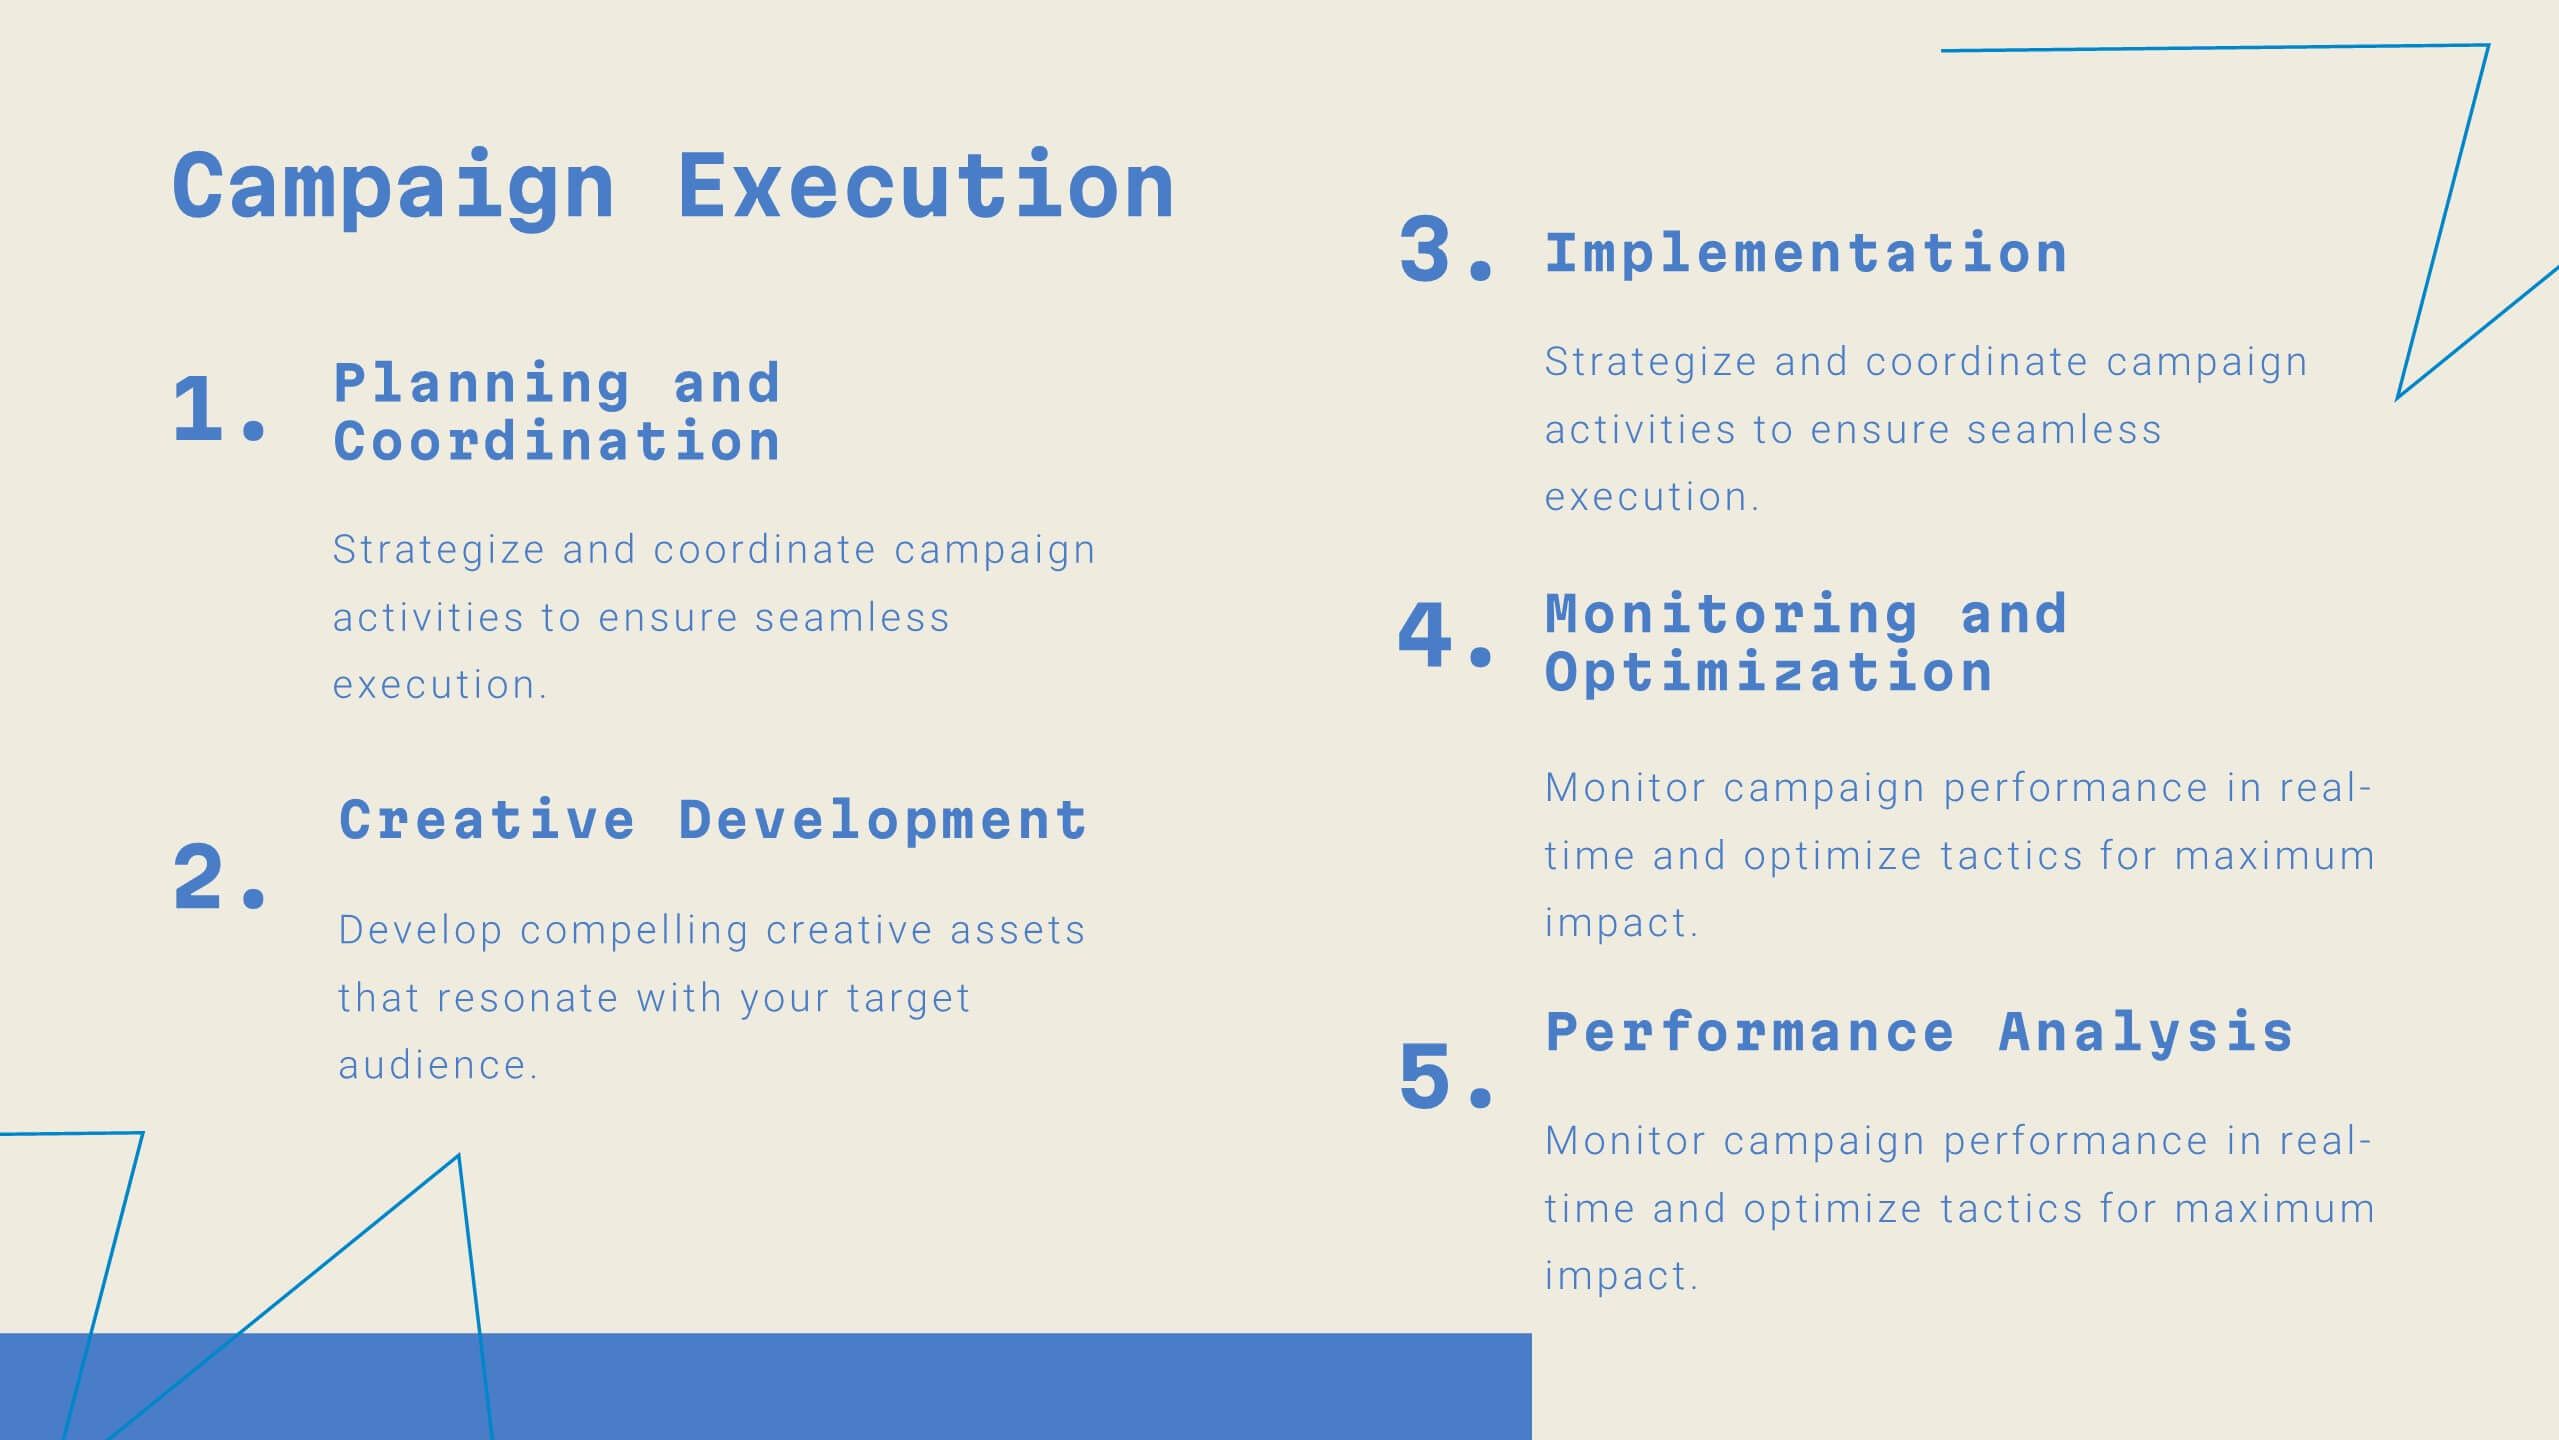
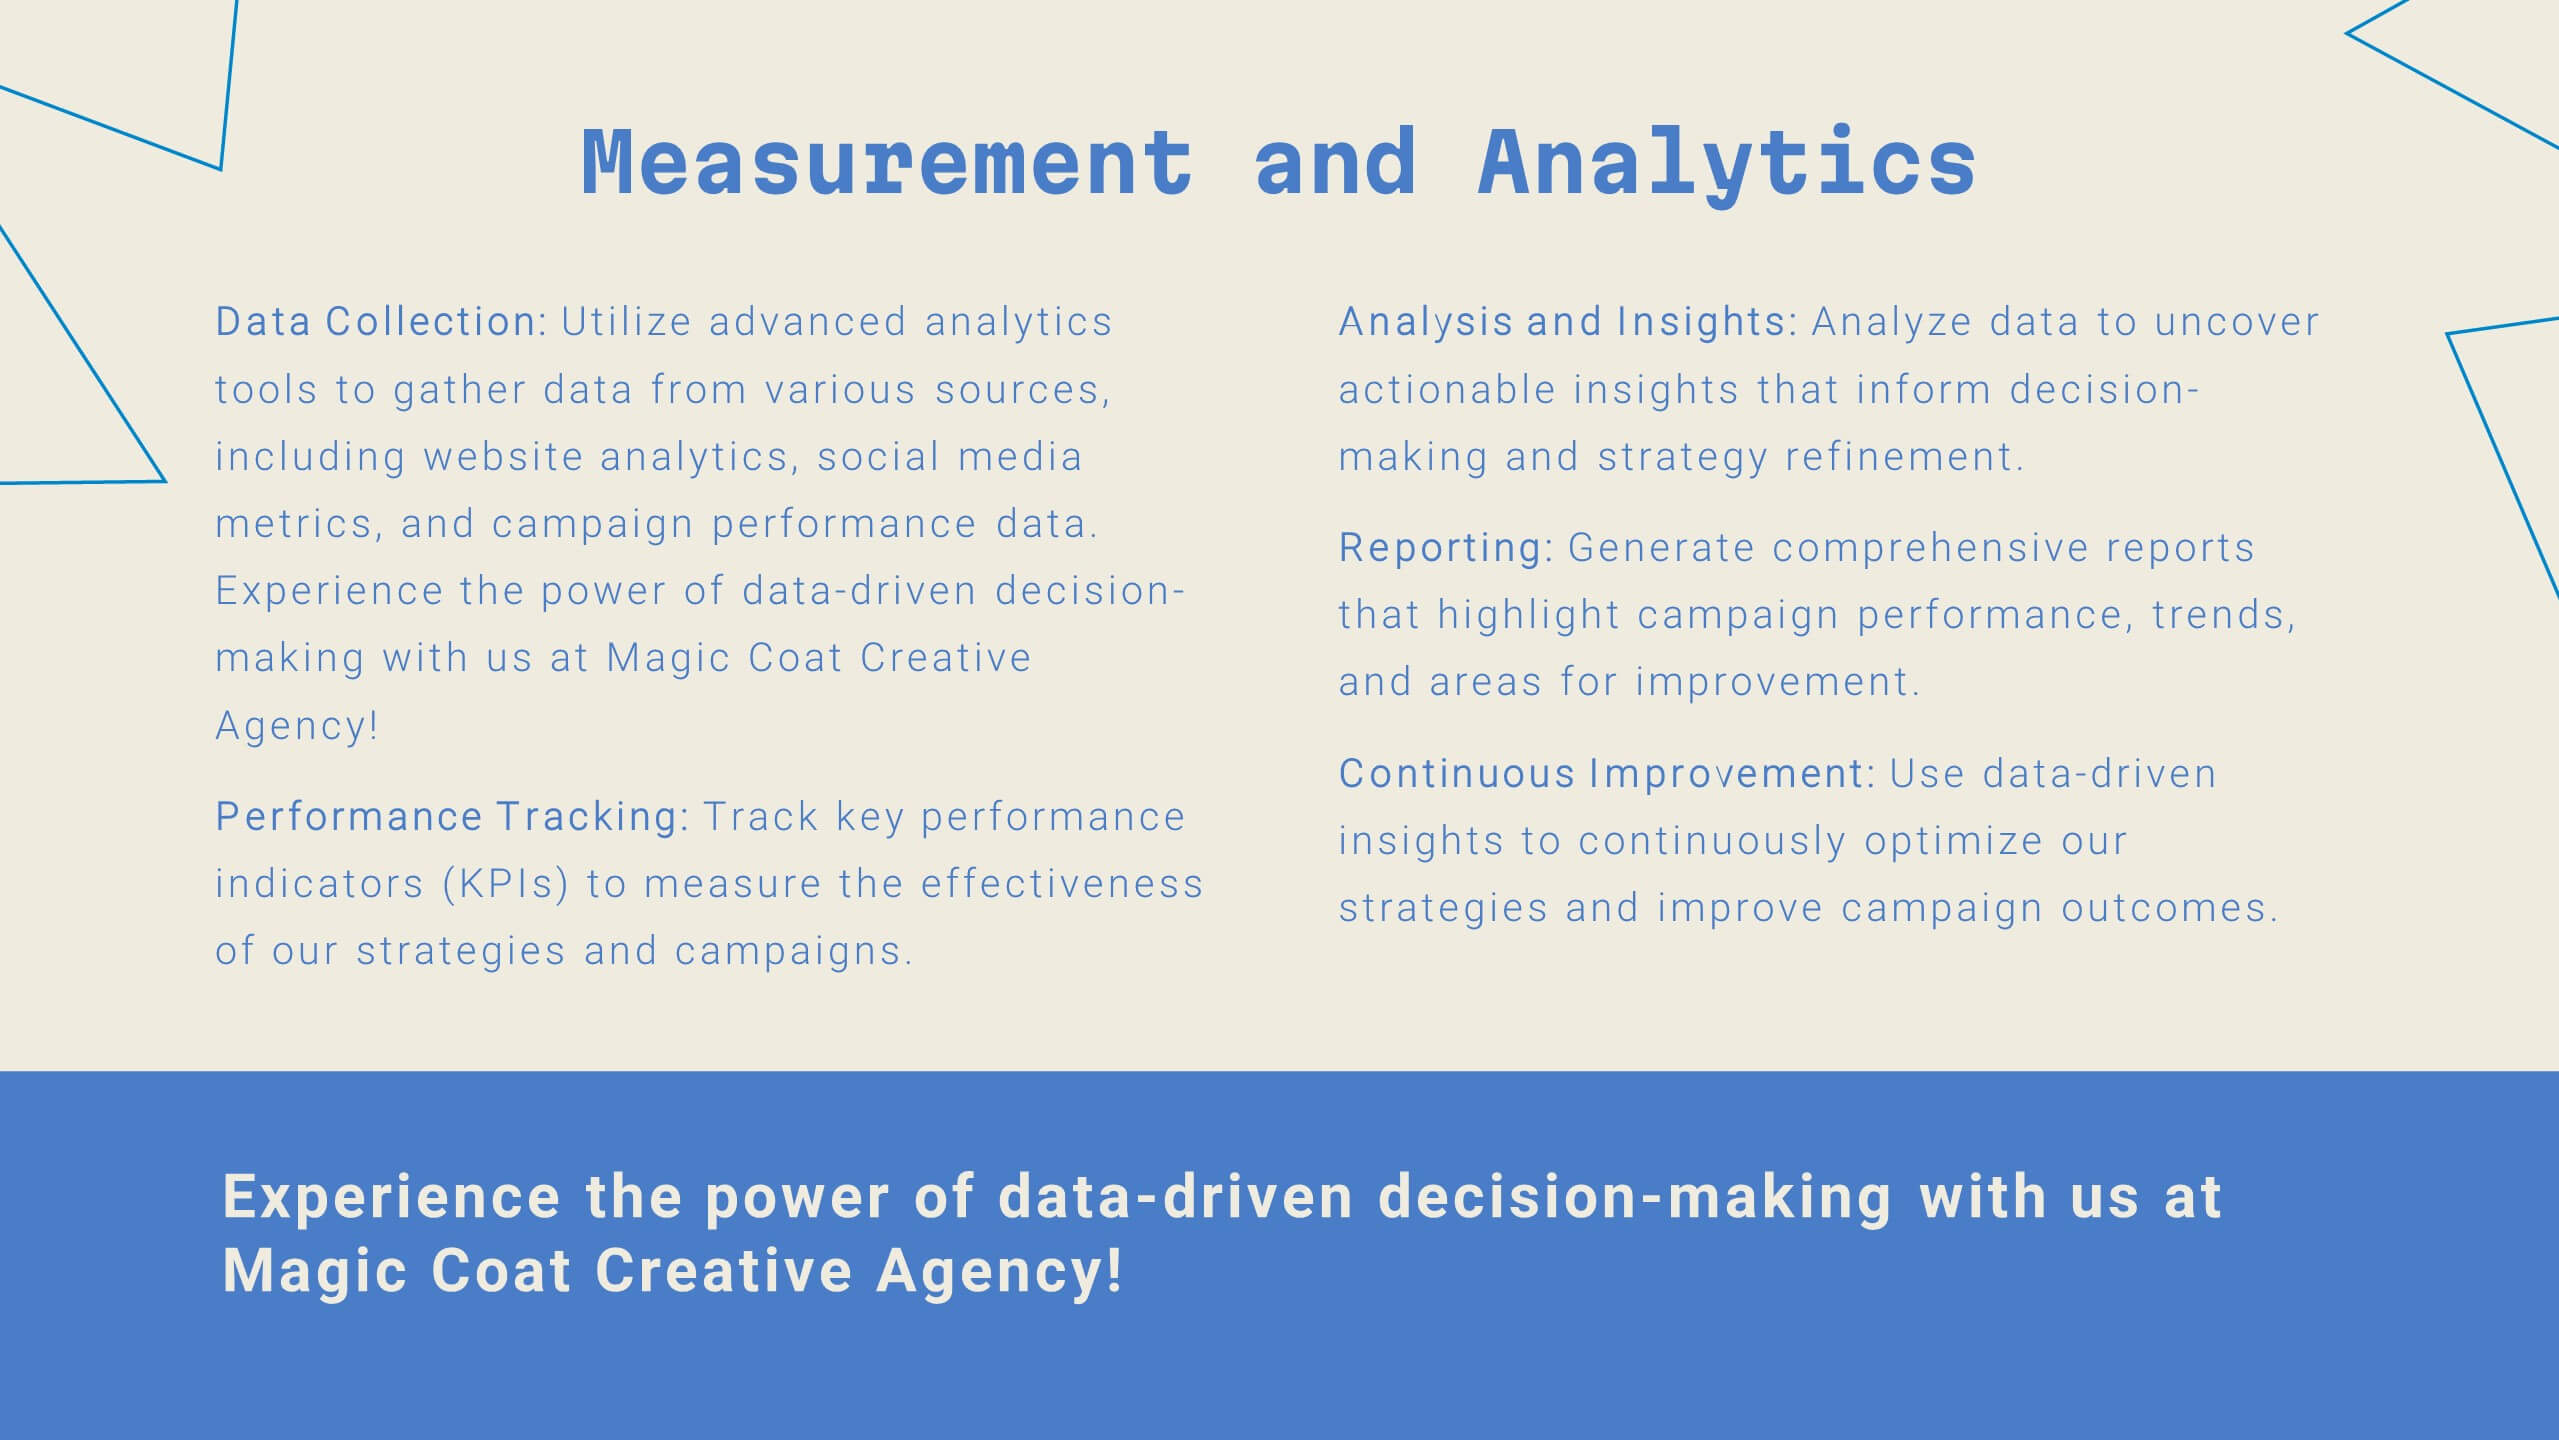
Unity Digital Agency Strategy Plan Presentation
Step into the future of digital marketing with this sleek template! From case studies to strategy development, it offers a comprehensive guide for creating impactful presentations. Highlight client success stories, industry trends, and creative processes with ease. Perfect for showcasing your agency's expertise. Compatible with PowerPoint, Keynote, and Google Slides.


7 slides
Meeting Infographic Presentation Template
Meetings are an important part of workplace culture. They help people build relationships, share ideas and make decisions. This template is a great way to show the importance of meetings to your managers and employees. This presentation can be used in a workplace to show how meetings help team members share knowledge and work. By providing an open dialogue, they can also be a useful tool for making employees feel valued and heard. Using the fun customizable illustrations provided in the template, keep your team members engaged on meetings and boost the entire team’s work ethic.


6 slides
Business Growth Metrics Butterfly Chart
Highlight performance patterns and opportunities with the Business Growth Metrics Butterfly Chart Presentation. This engaging layout uses mirrored radial segments to present six growth indicators—ideal for tracking progress across two categories, departments, or timeframes. The butterfly-shaped curves draw the viewer’s attention to the center, making comparisons intuitive and visually balanced. Fully customizable in PowerPoint, Keynote, and Google Slides, this template is perfect for showcasing KPI trends, sales metrics, or marketing performance.


2 slides
Creative Presentation Opening Title Slides
Step into a world of innovation with the "Creative Presentation" title slides, where vibrant geometric shapes meet clean, modern design. Perfect for showcasing your ideas and transforming them into impactful solutions, these slides set the stage for inspiration. Compatible with PowerPoint, Keynote, and Google Slides, they're ideal for anyone looking to make a memorable impression.


6 slides
Virtual Meeting Best Practices Presentation
Master your online meetings with this sleek, illustrated layout featuring a character graphic and clear content blocks. Designed to share virtual etiquette, tools, or steps for effective communication, it’s ideal for remote team briefings and onboarding. Fully editable and compatible with PowerPoint, Keynote, and Google Slides.