


Features
- 26 Unique slides
- Fully editable and easy to edit in Microsoft Powerpoint, Keynote and Google Slides
- 16:9 widescreen layout
- Clean and professional designs
- Export to JPG, PDF or send by email


Do you have any questions?
Recommend


26 slides
Personal Finance Management Presentation
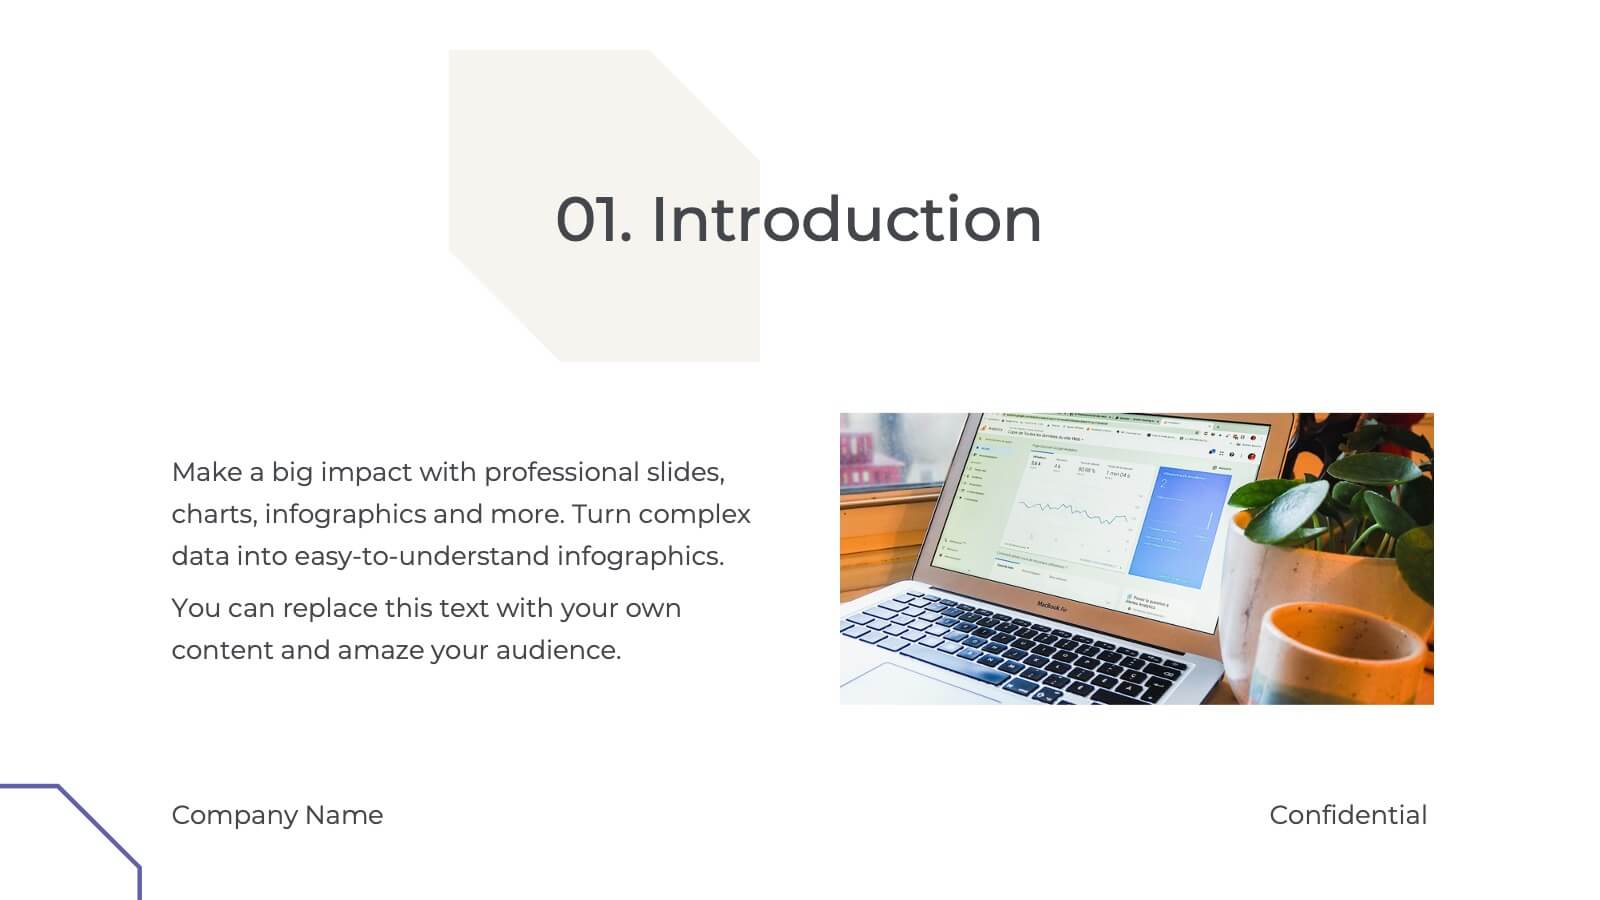
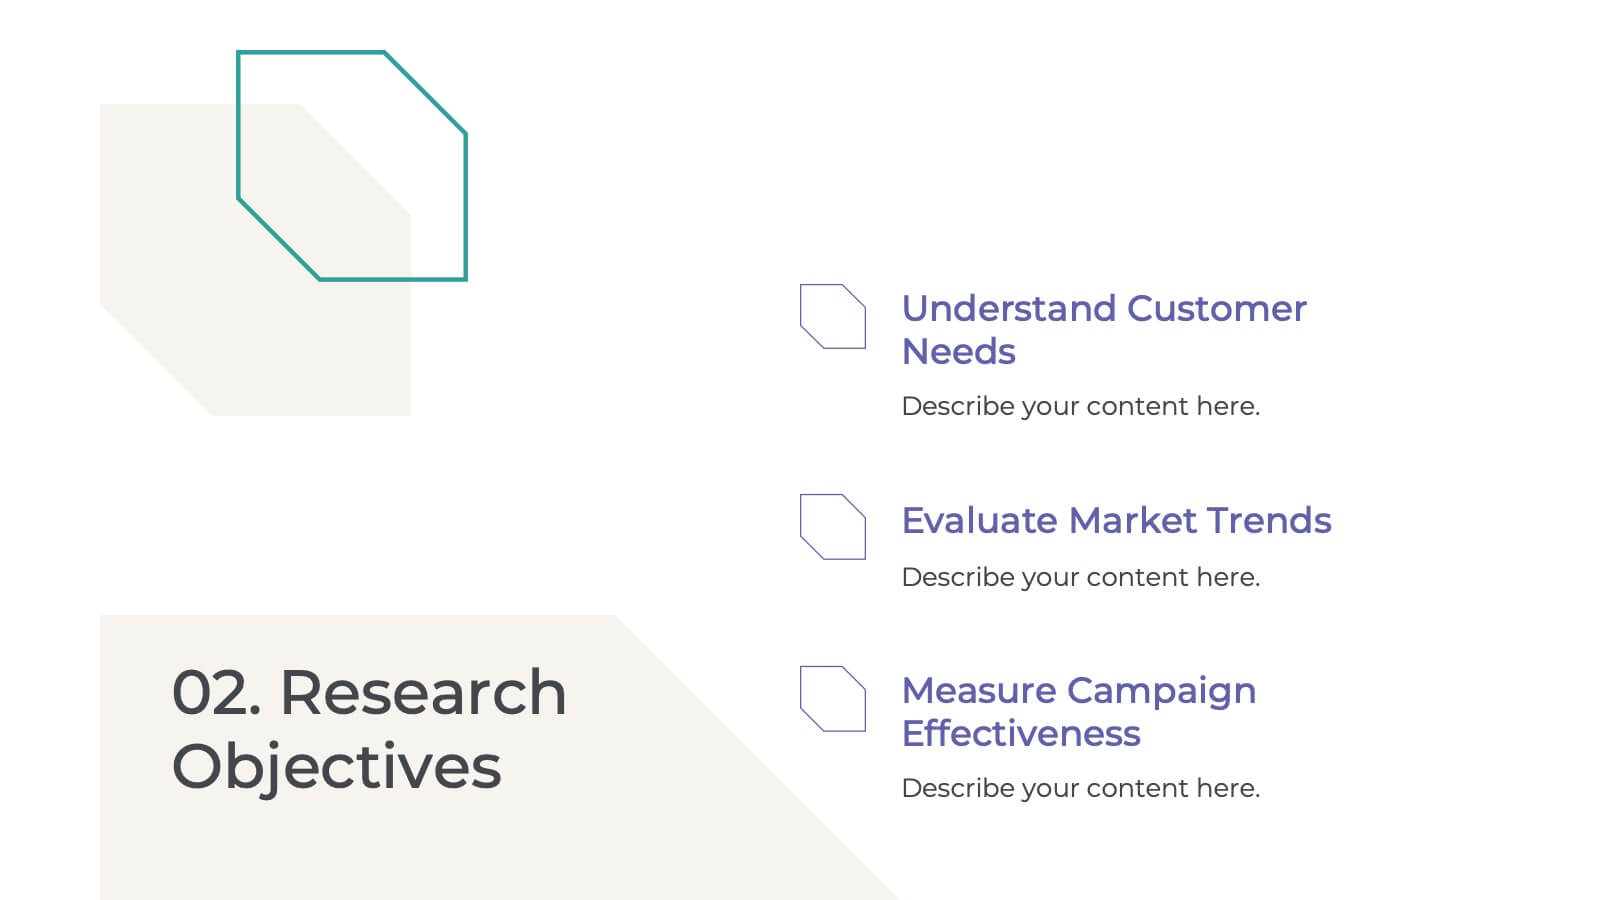
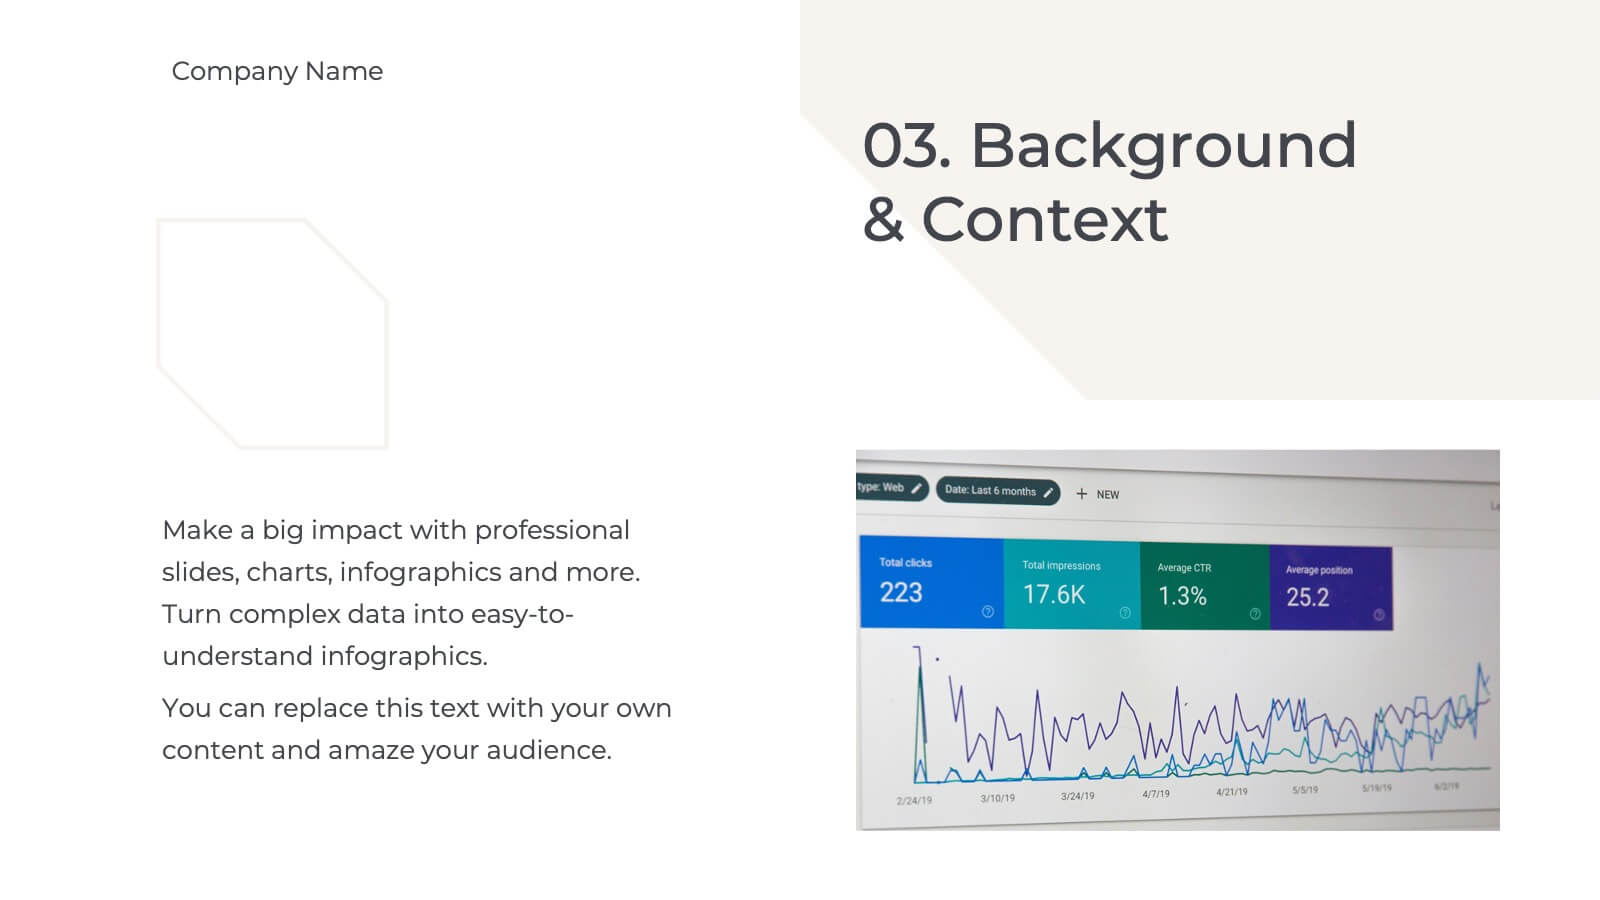
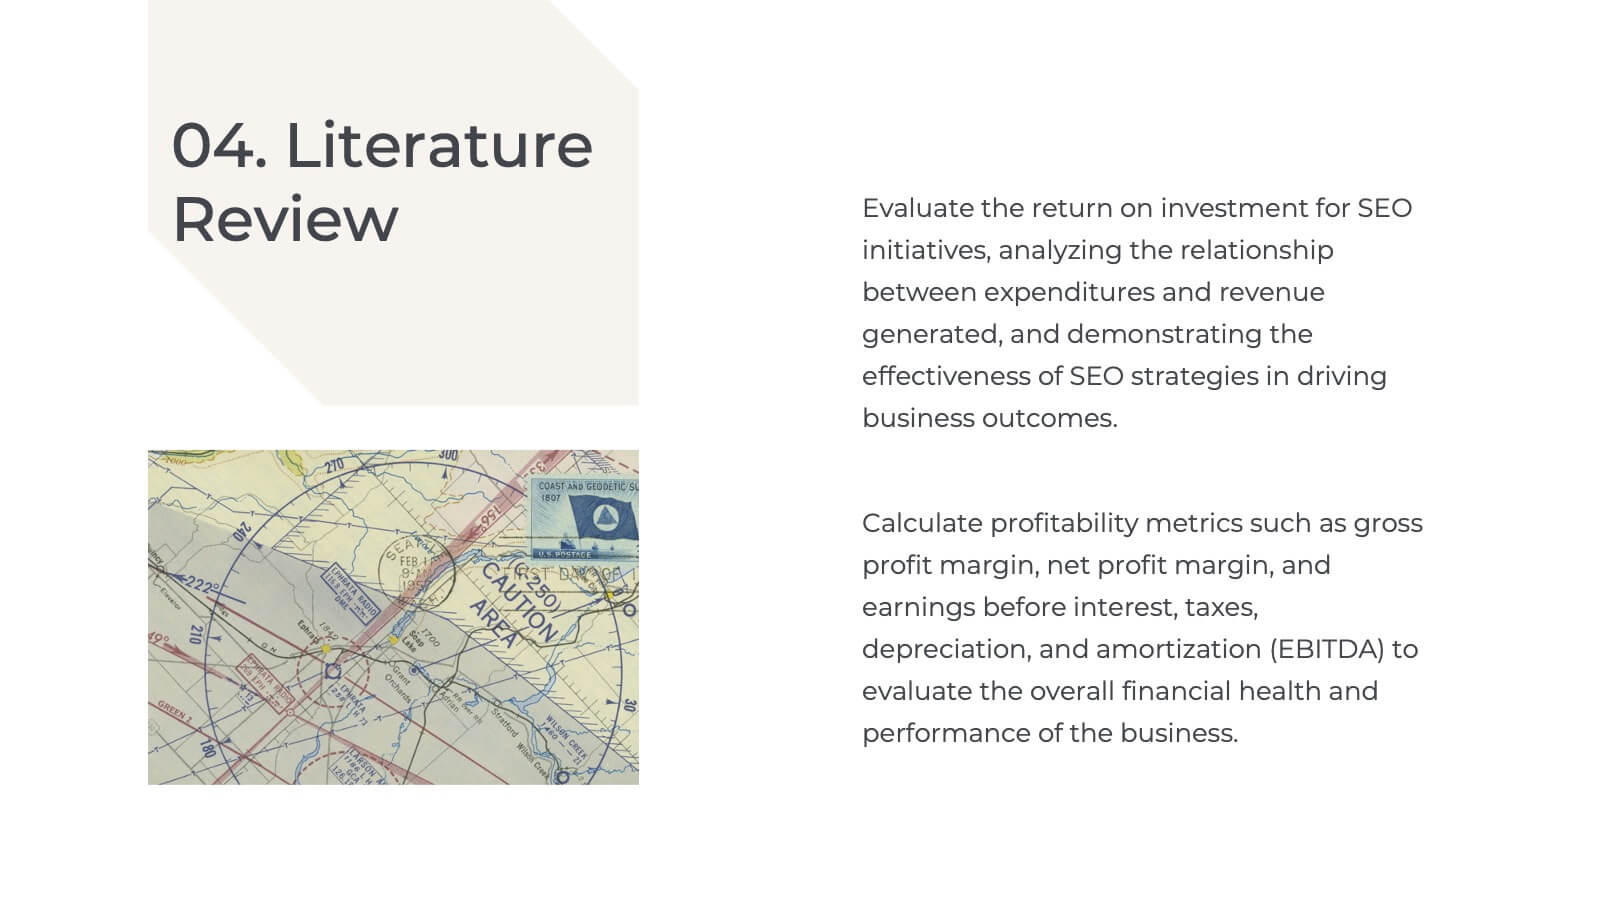
Dive into the essentials of personal finance management with this comprehensive presentation template designed to empower individuals to achieve financial stability and growth. The template begins with an introduction that outlines the importance of effective financial management and the objectives of the presentation. It serves as a roadmap for those seeking to understand and enhance their financial literacy. In the main content section, the template offers detailed slides covering a variety of topics crucial for managing personal finances, such as budgeting strategies, savings plans, investment options, and debt management. Each slide is designed with clarity and focus, using engaging visuals and concise bullet points to explain complex financial concepts in an accessible manner. Features like comparison slides, process infographics, and timeline visuals help illustrate the progression and impact of good financial practices over time. The final segment ensures the presentation is practical for all users by confirming compatibility with popular platforms like PowerPoint, Google Slides, and Keynote. This ensures that the template can be easily accessed and utilized across different devices and settings, making it a versatile tool for individuals, financial advisors, or educational workshops looking to promote sound financial habits.


6 slides
Business Strategy Pyramid Presentation
Outline your strategic priorities with clarity using the Business Strategy Pyramid Presentation. This template features a five-step 3D pyramid that highlights key business goals, initiatives, or stages. Each layer includes icons and numbered sections for easy interpretation. Ideal for strategy meetings, executive briefings, and growth plans. Fully editable in PowerPoint, Keynote, and Google Slides.


6 slides
Efficient Scheduling and Time Management Presentation
Stay on time and on target with the Efficient Scheduling and Time Management presentation slide. Designed with smartwatch graphics showing time progression, this layout visually emphasizes planning, deadlines, and time-based tasks. Ideal for outlining agendas, productivity methods, or resource allocation strategies. Each time block includes editable text fields for key milestones or steps. Compatible with PowerPoint, Keynote, and Google Slides.


22 slides
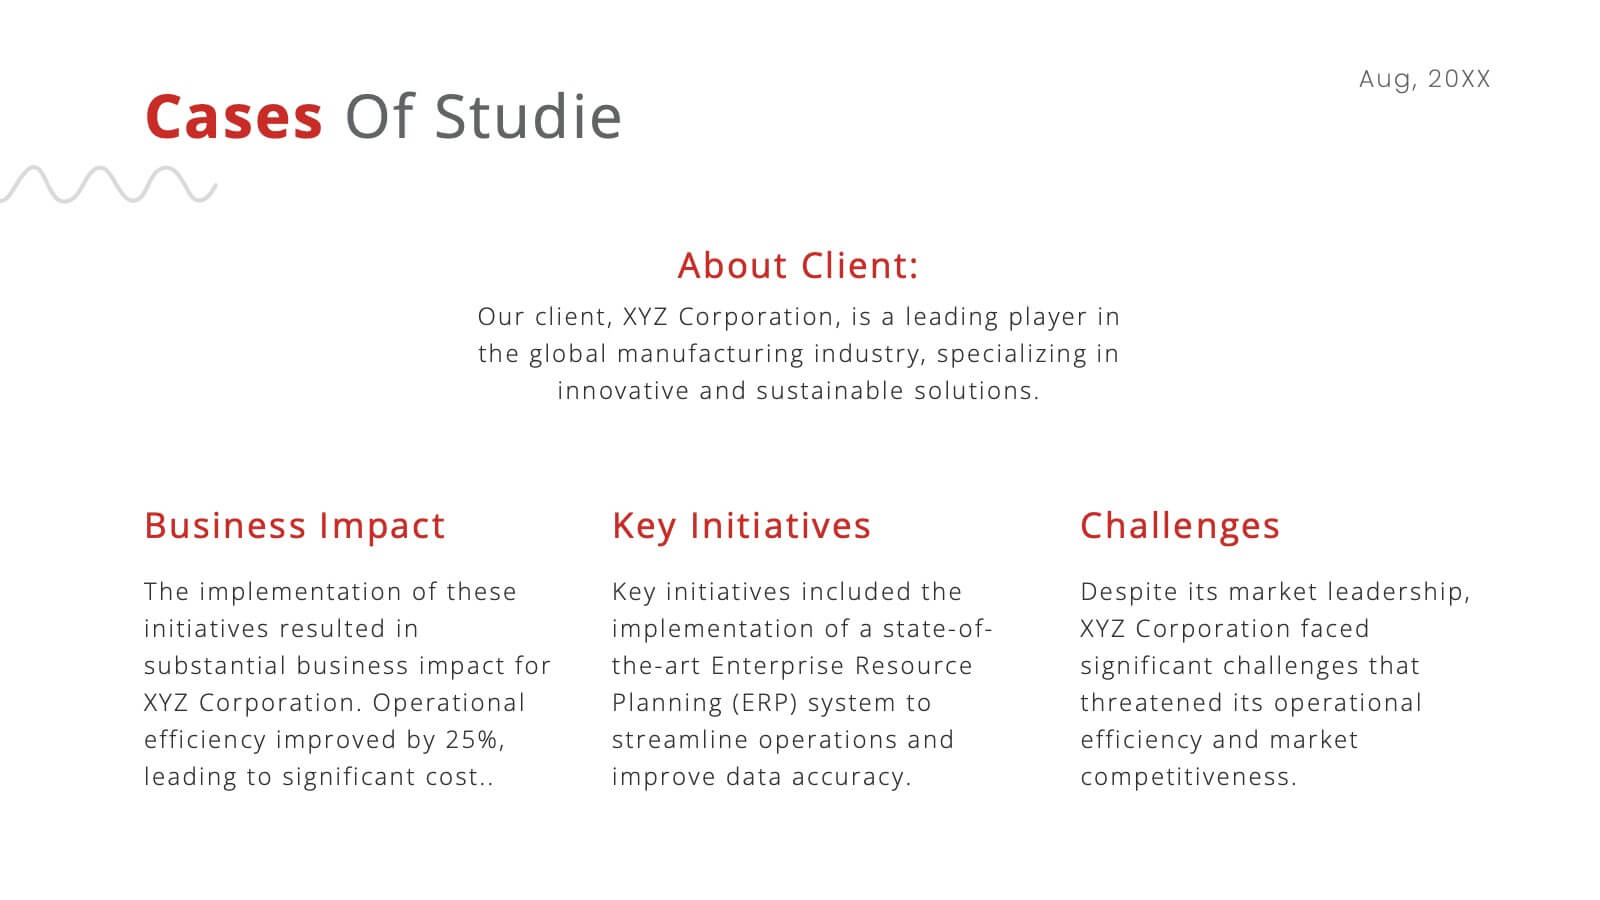
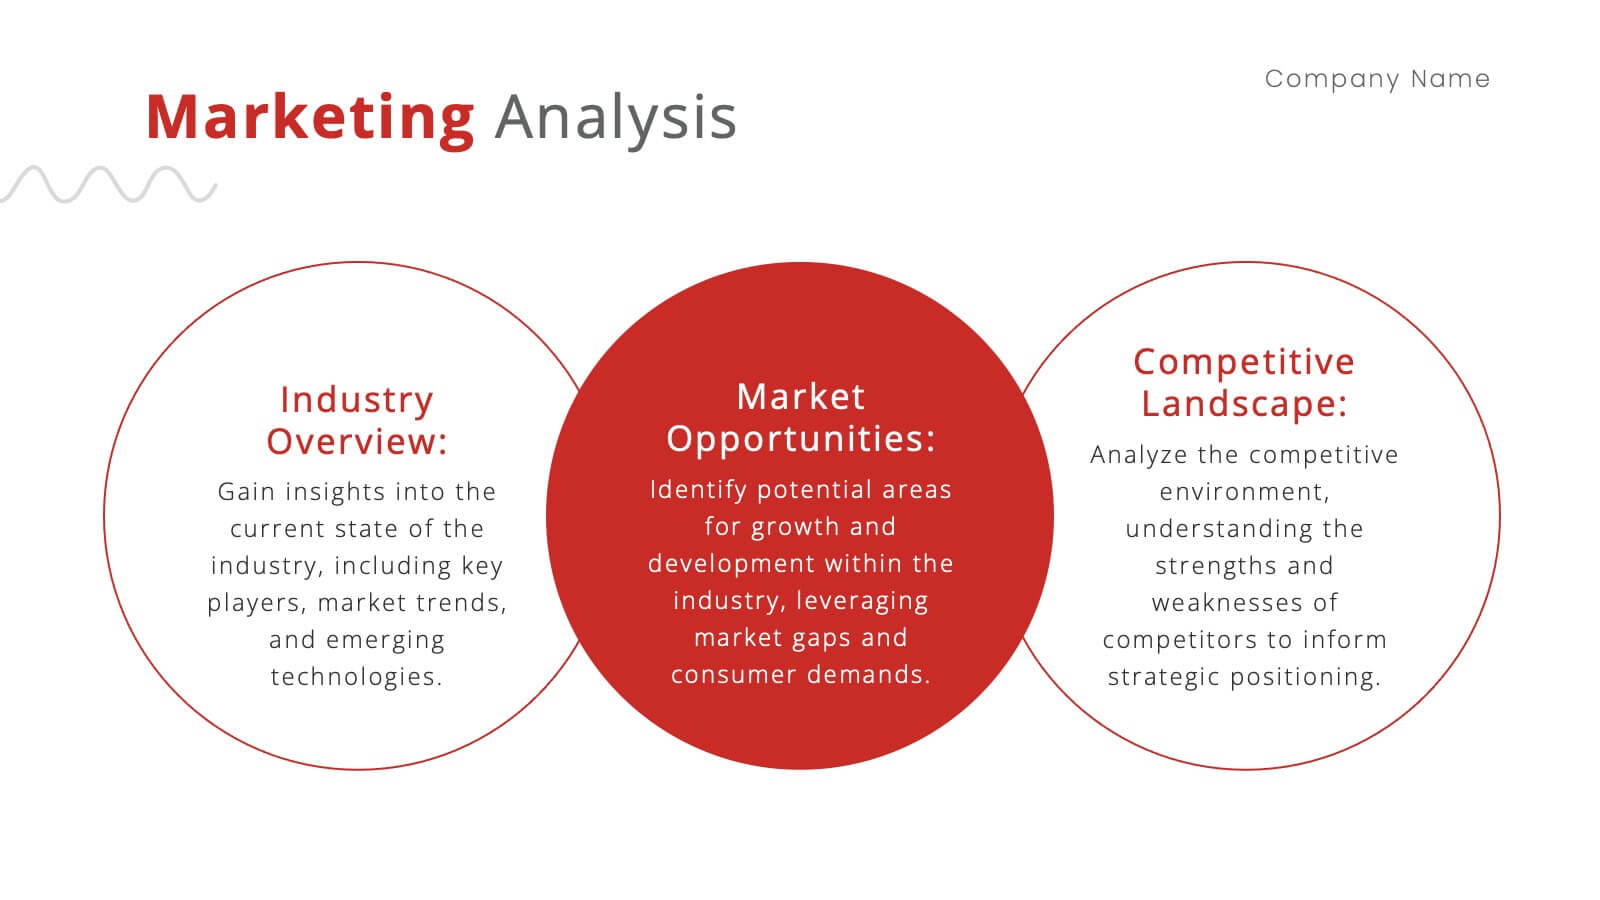
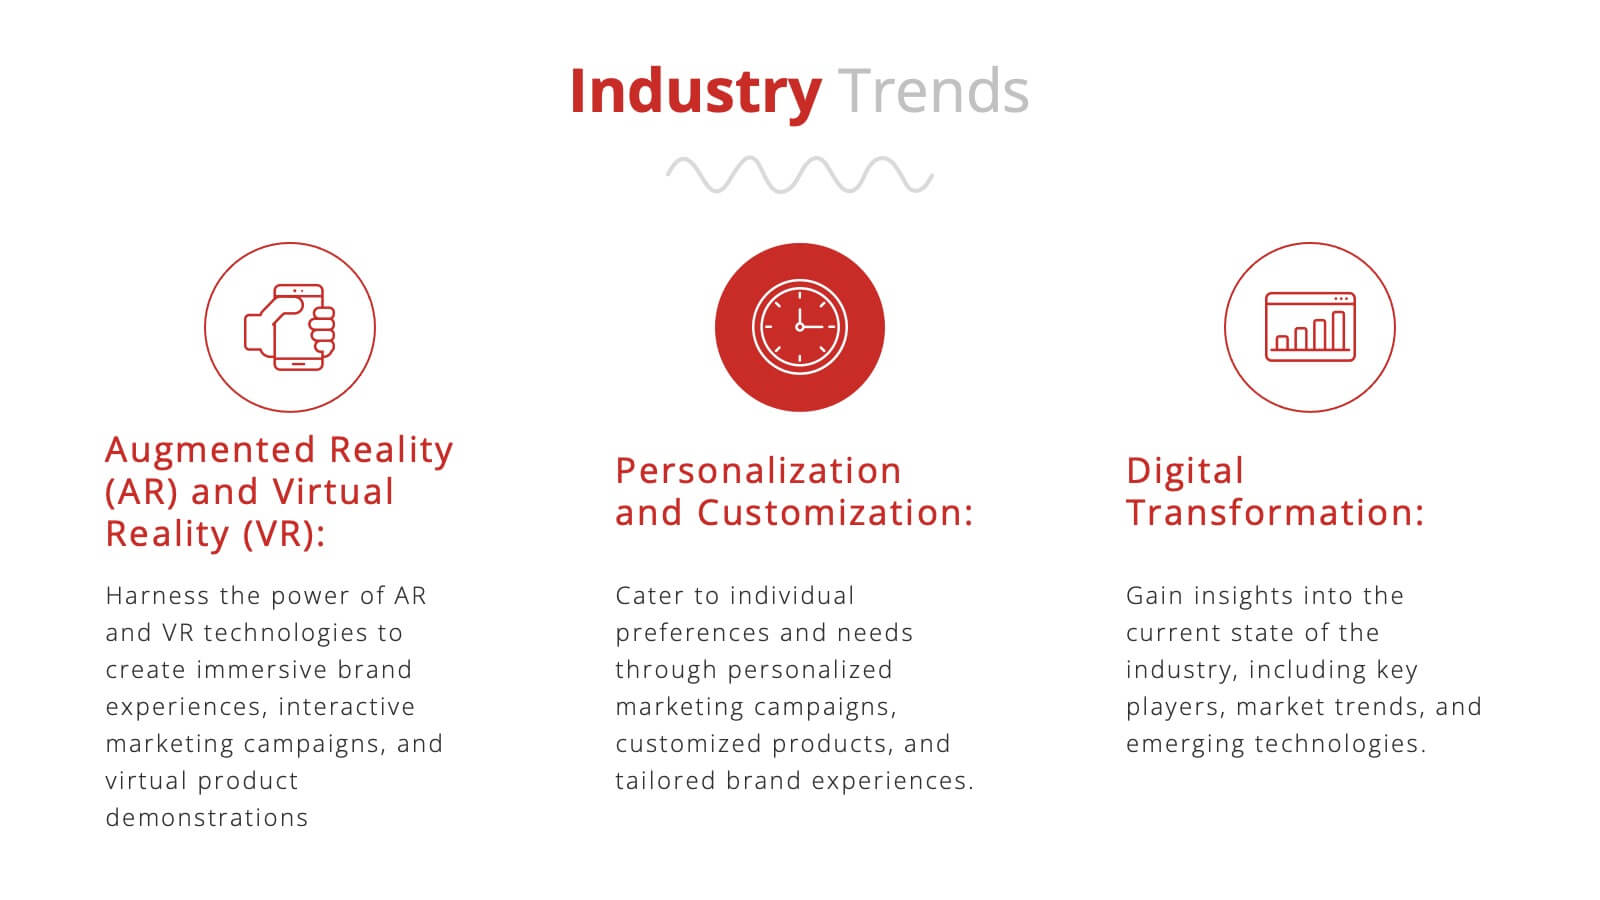
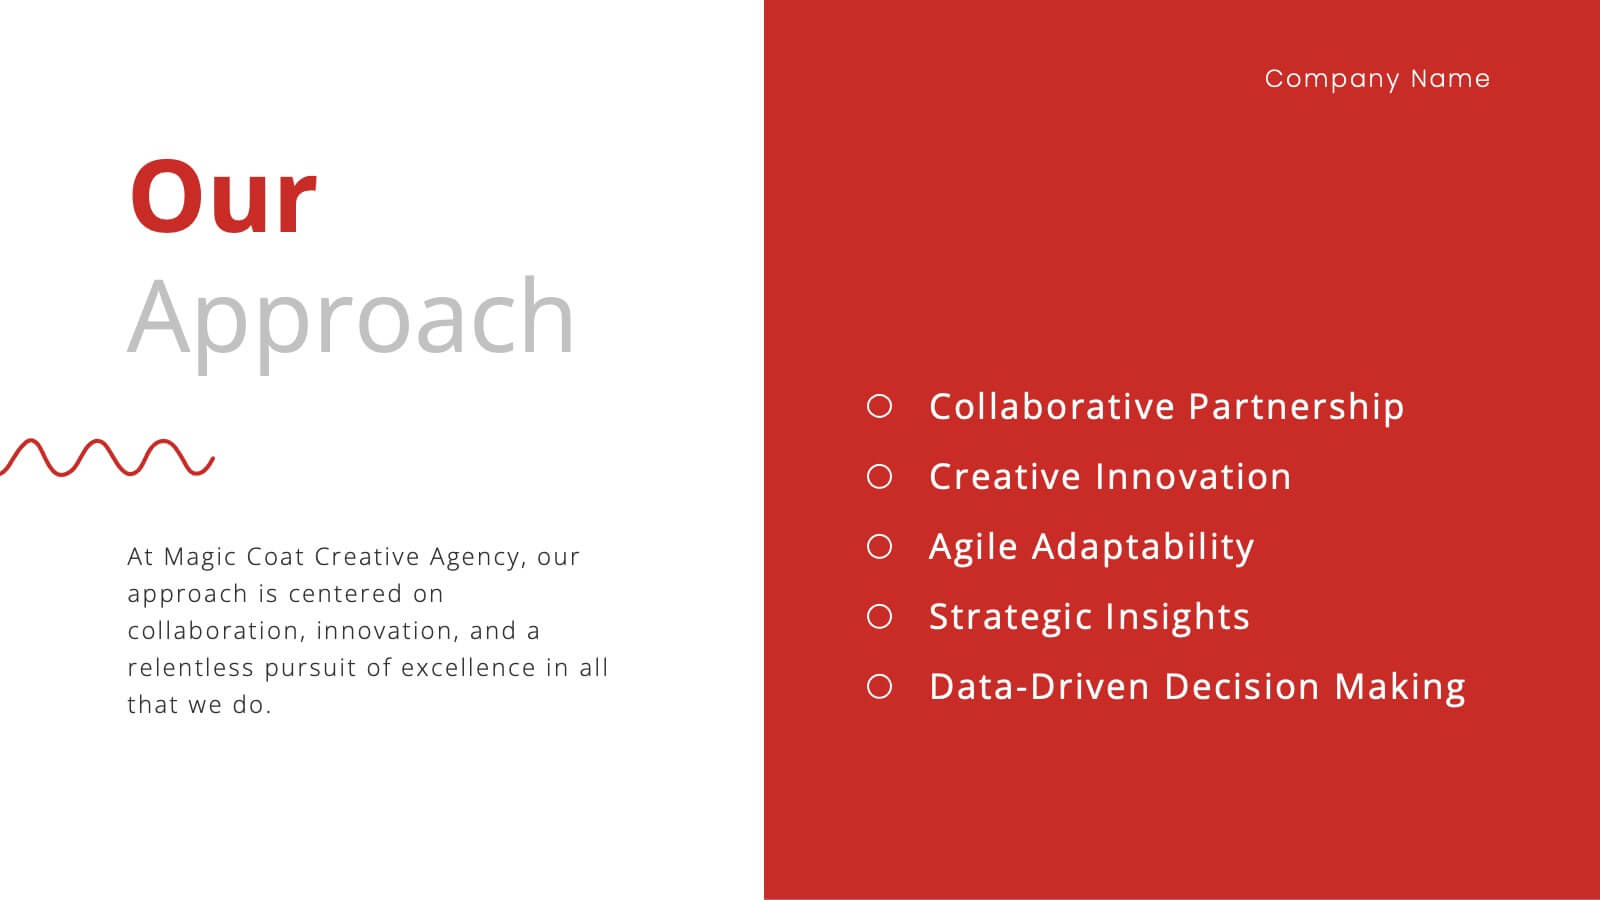
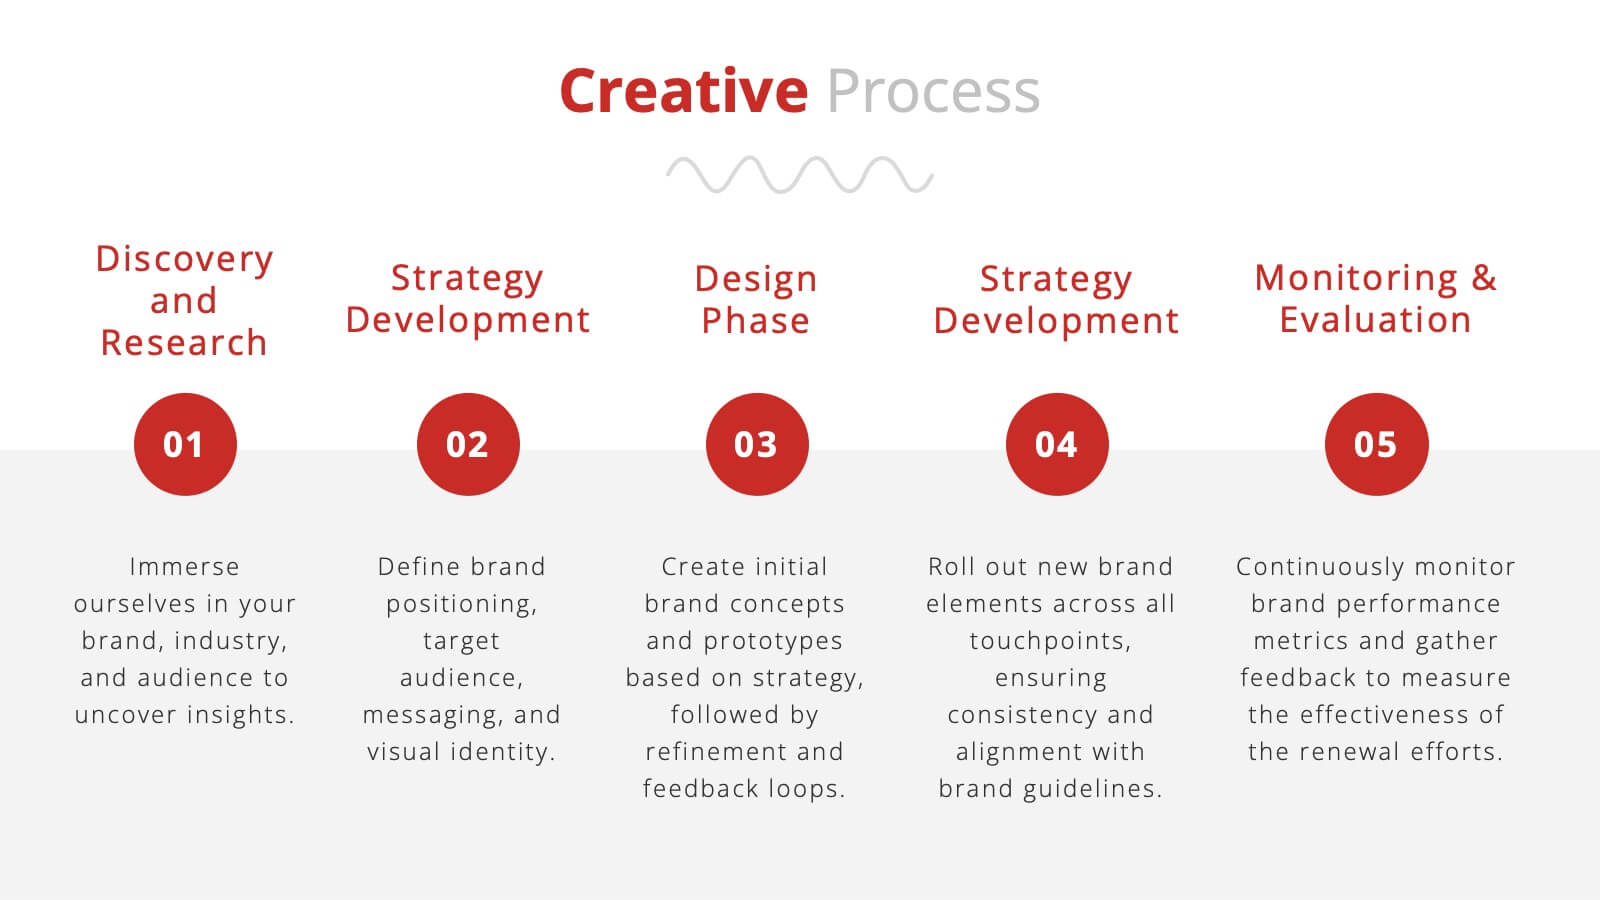
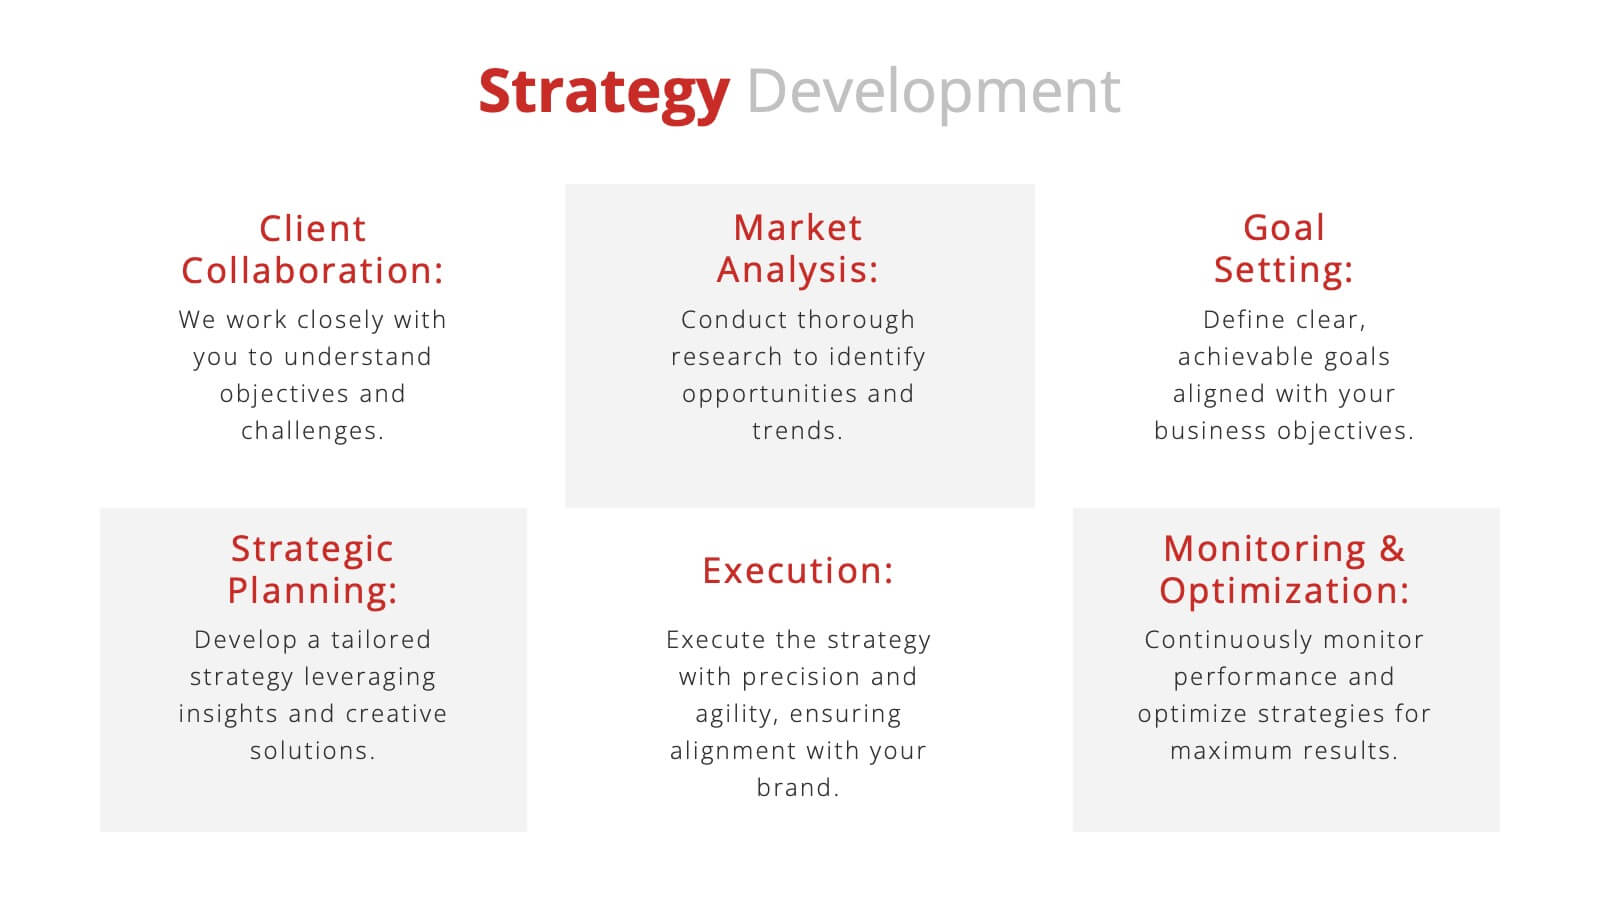
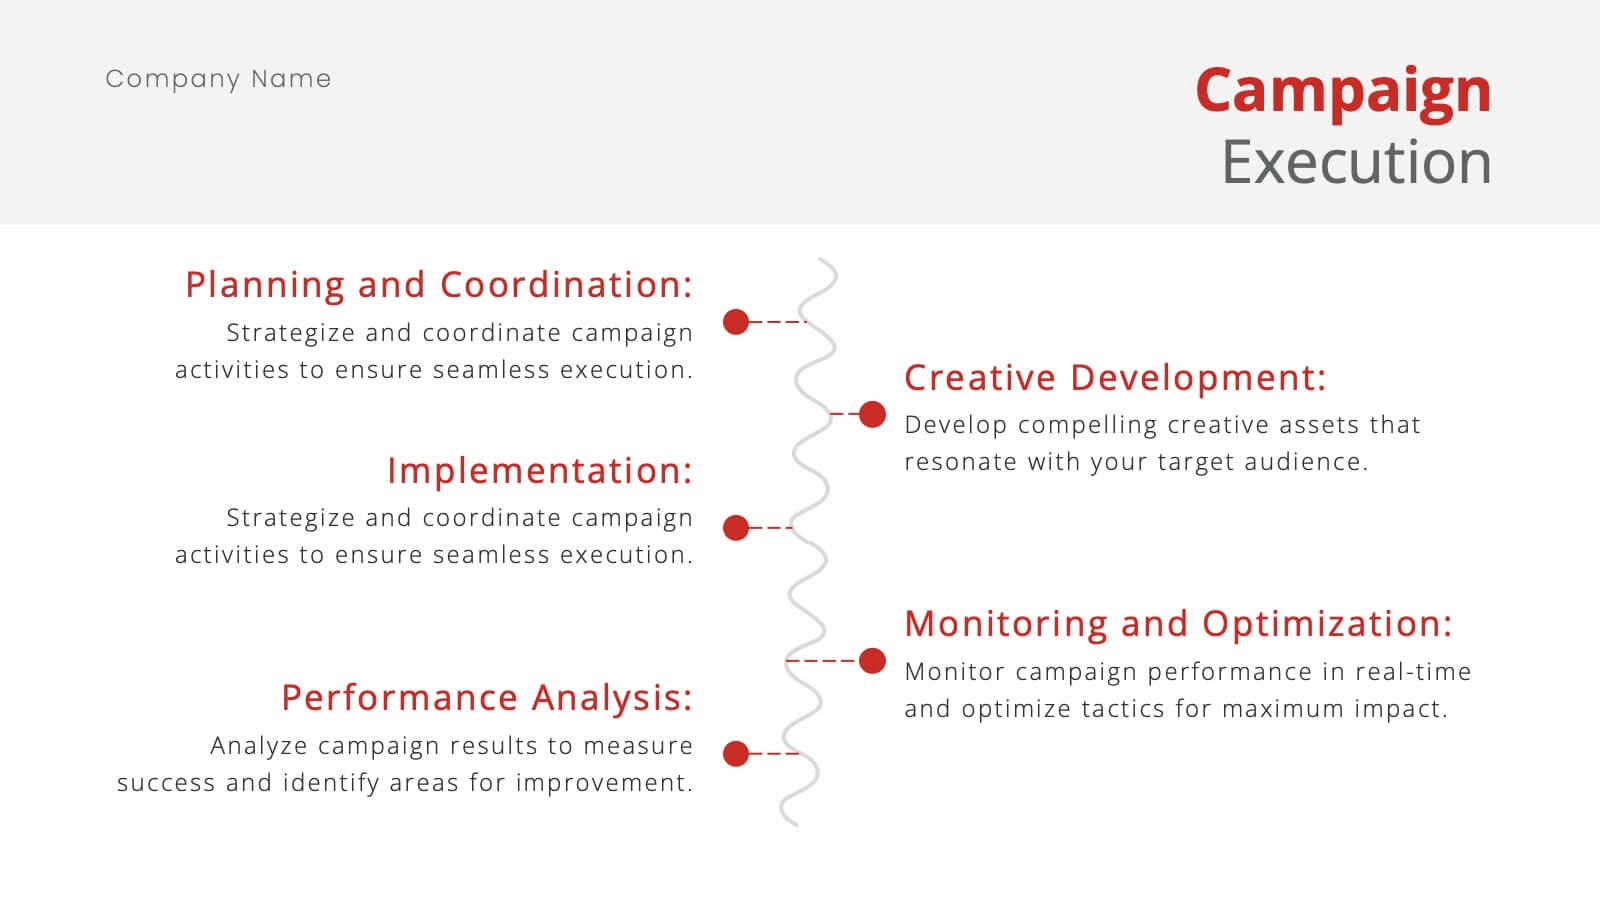
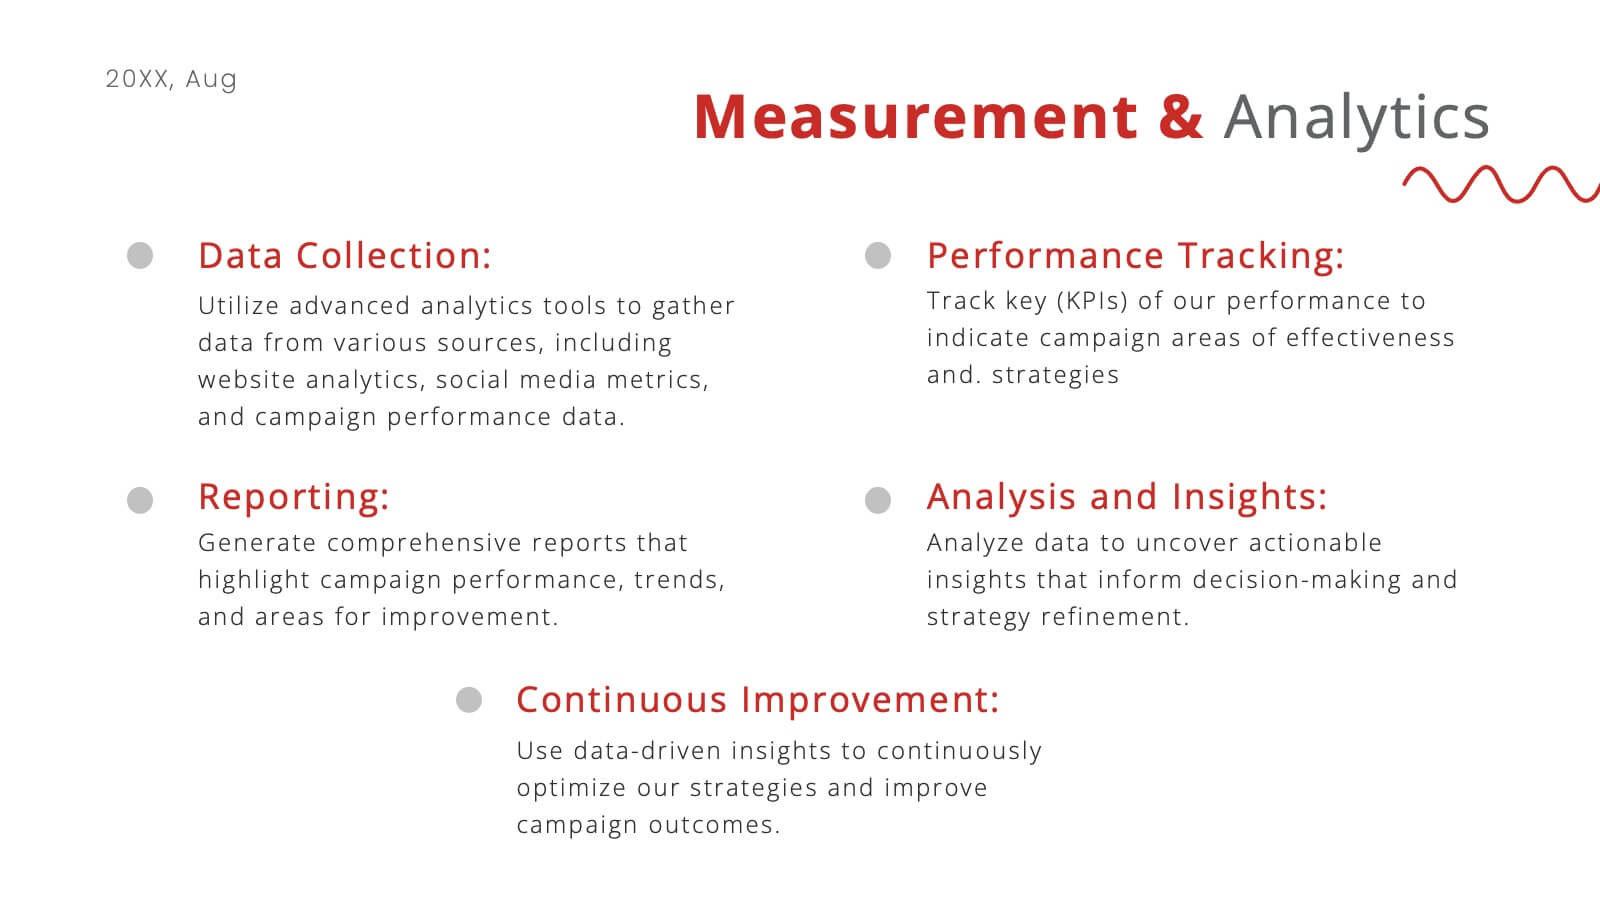
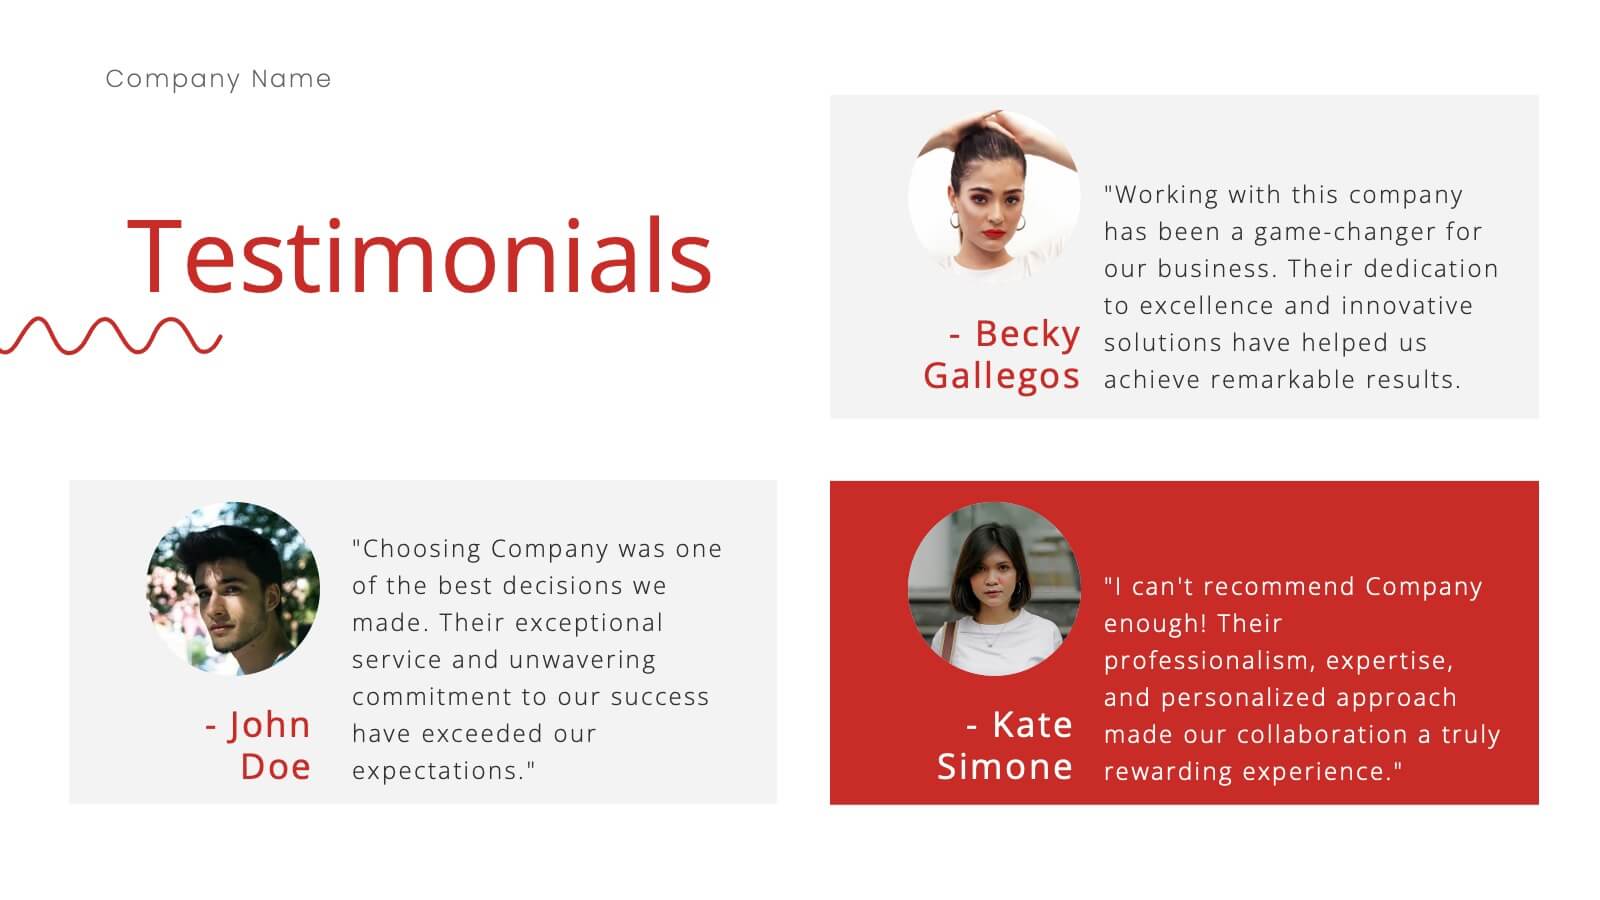
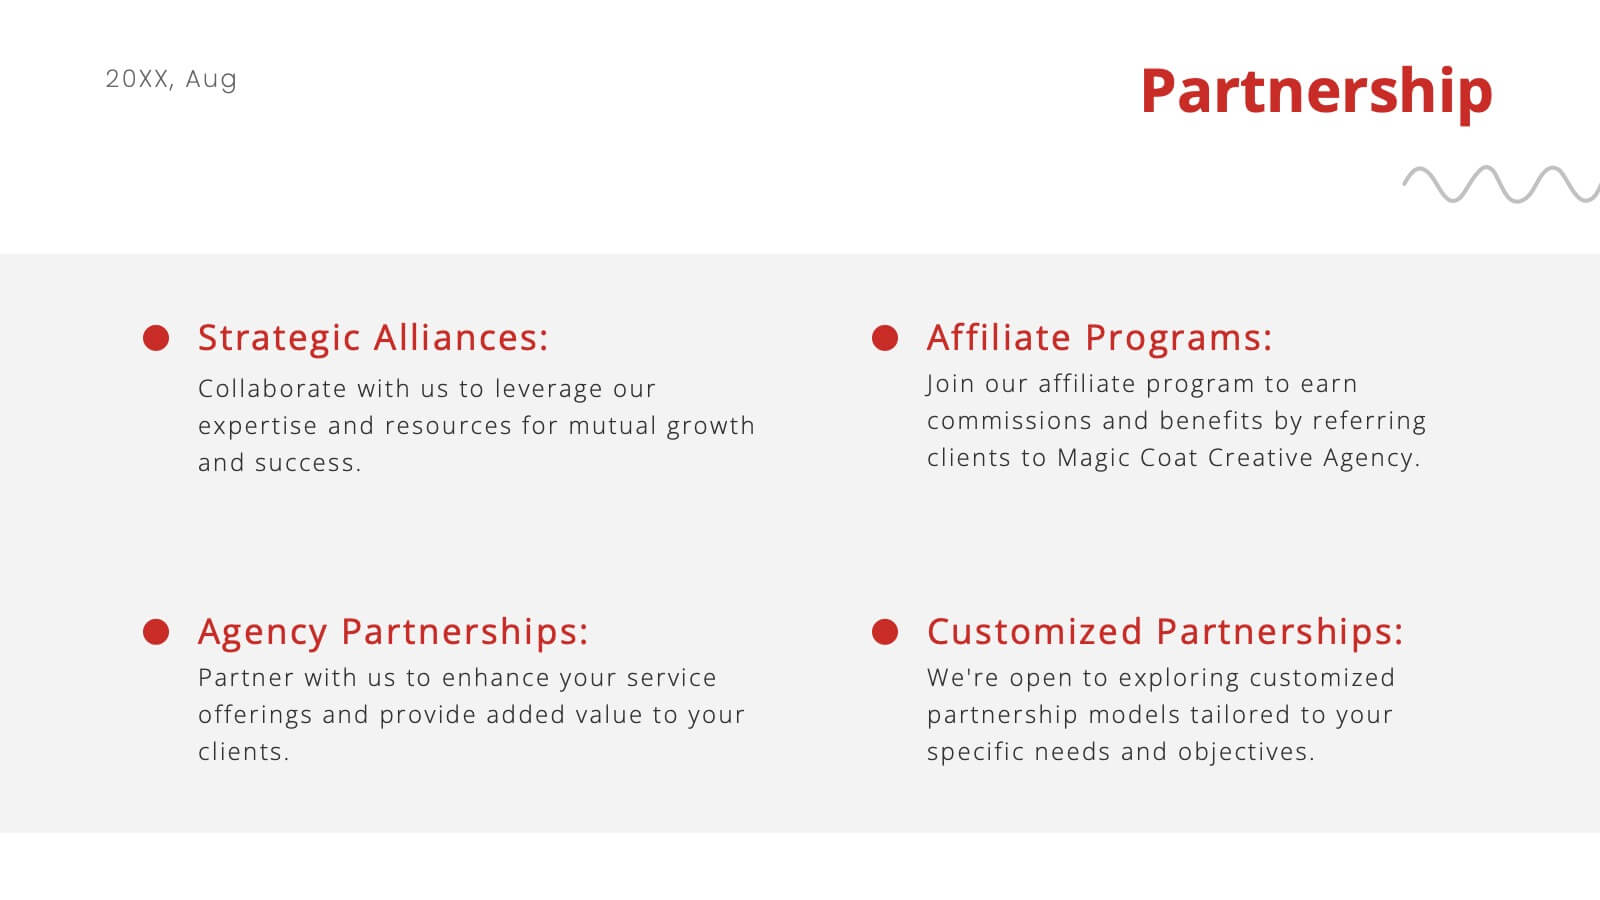
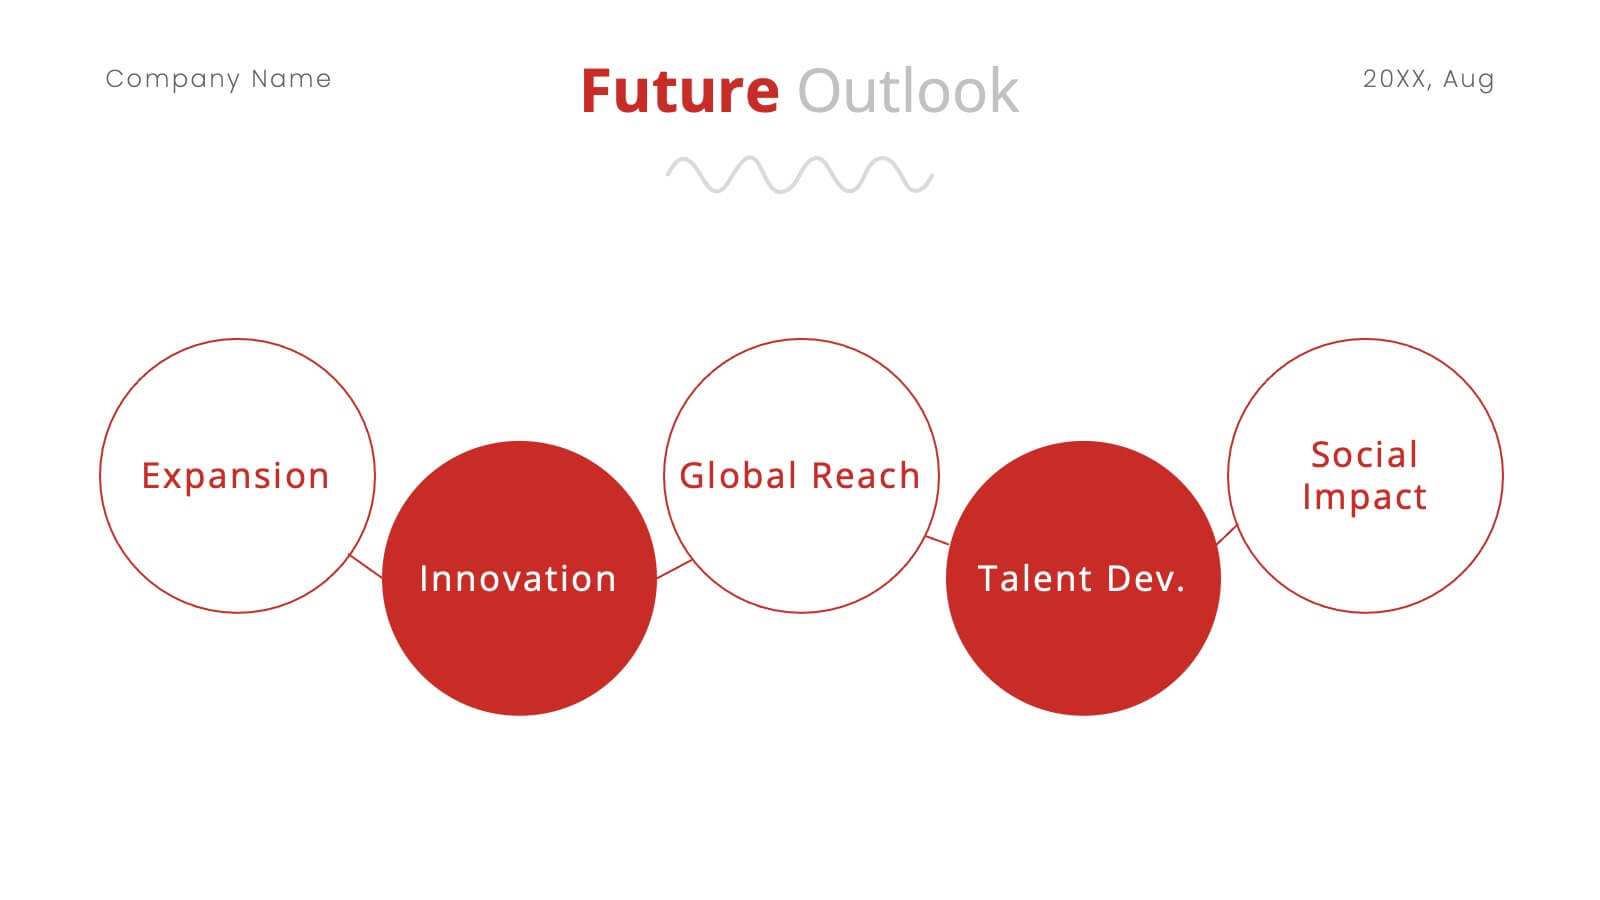
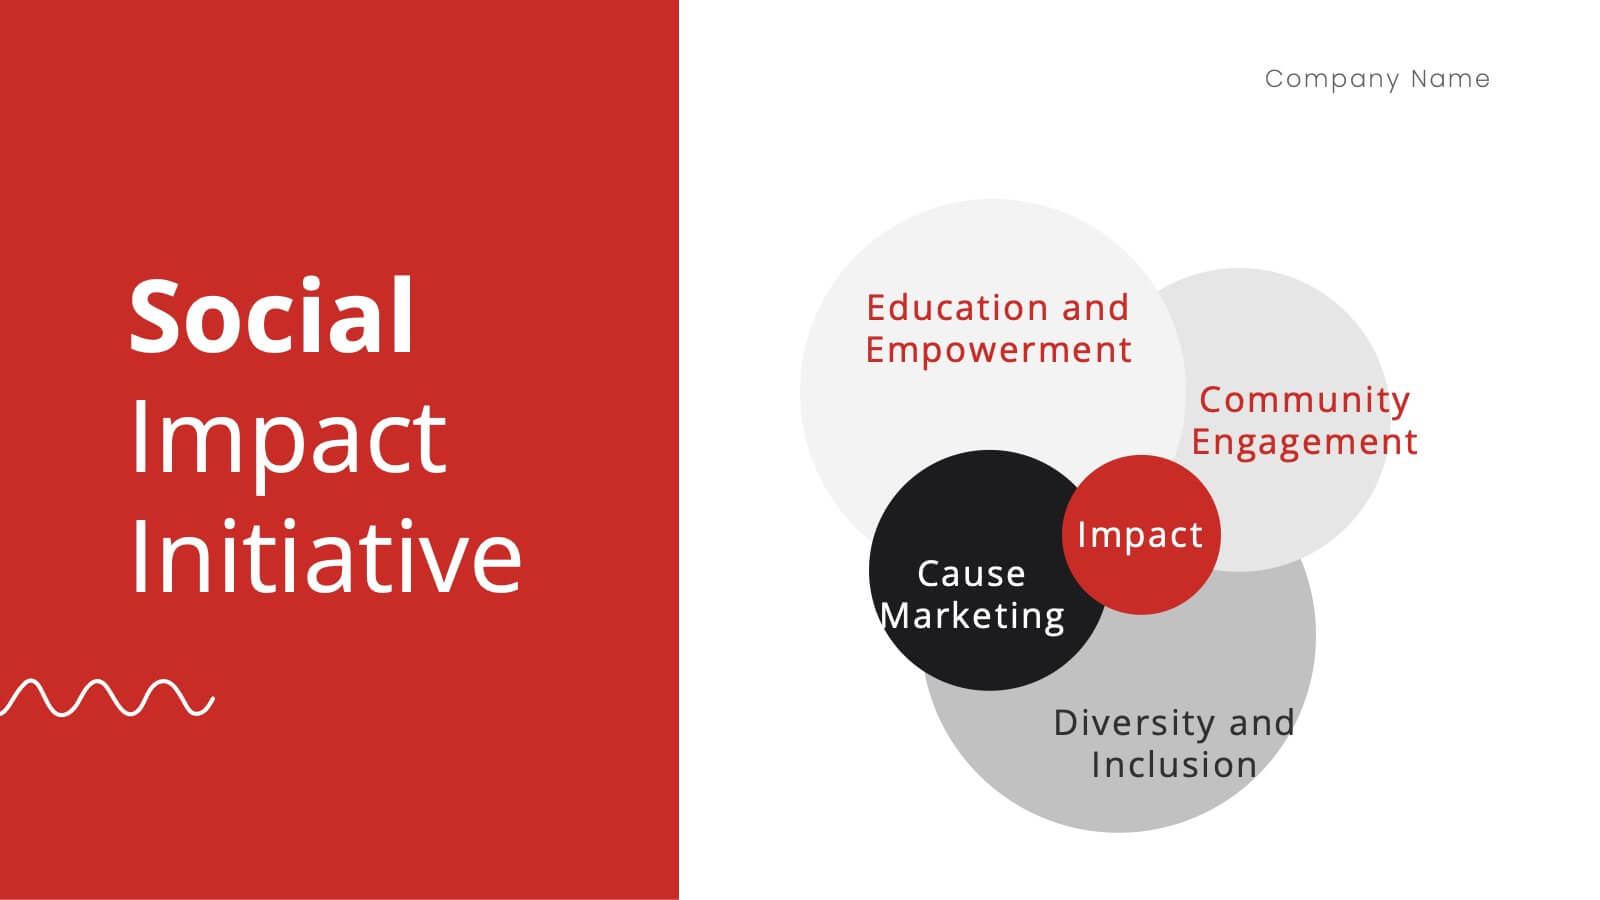
Arcflare Digital Agency Strategy Plan Presentation
Create a powerful strategy with this digital agency plan presentation! It features key sections like market analysis, industry trends, campaign execution, and client testimonials, helping you communicate your approach clearly. Perfect for strategy meetings or client pitches, this template is fully compatible with PowerPoint, Keynote, and Google Slides.


4 slides
Financial Overview Slide Presentation
Kick off your presentation with a clean, modern visual that makes financial insights easy to grasp at a glance. This slide helps you summarize key metrics, compare performance areas, and highlight important business trends in a simple, structured layout. Fully compatible with PowerPoint, Keynote, and Google Slides.


2 slides
Blue Ocean Strategy Map Presentation
Make your message stand out with a clean, visual map that instantly clarifies where opportunities lie. This presentation helps you compare value factors side-by-side, reveal market gaps, and highlight strategic advantages in a simple, structured format. Fully customizable and compatible with PowerPoint, Keynote, and Google Slides.


5 slides
Tech Stack and IT Infrastructure Presentation
Visualize your systems with this Tech Stack and IT Infrastructure Presentation. Featuring a vertical ribbon layout with five clearly defined segments, it's perfect for illustrating architecture layers, development pipelines, or infrastructure components. Easily editable in Canva, PowerPoint, or Google Slides to match your brand and IT strategy.


4 slides
Corporate Strategy Business Case Presentation
Develop a winning corporate strategy with this structured business case template! Perfect for analyzing finances, operations, market trends, and client insights, this clean and organized layout helps businesses communicate key strategies effectively. Fully customizable and compatible with PowerPoint, Keynote, and Google Slides for seamless, professional presentations.


6 slides
Strategic Business Objective Mapping Presentation
Clearly define your strategic focus with this Strategic Business Objective Mapping slide. Designed to display six core objectives around a central theme, it’s ideal for visualizing business goals, departmental priorities, or key initiatives. Fully customizable in PowerPoint, Canva, and Google Slides for seamless team collaboration.


5 slides
Feedback Collection Strategy Presentation
Engage your audience with a dynamic visual that simplifies how feedback is gathered and turned into meaningful action. This presentation helps illustrate communication loops, data flow, and process improvements with clarity and style. Fully editable and compatible with PowerPoint, Keynote, and Google Slides for seamless customization and professional delivery.


26 slides
Farming Company Profile Creative Presentation
Step onto the fertile grounds of the farming company landscape, where green fields stretch to the horizon and the golden sun promises a bountiful harvest. With a canvas painted in rich green and sunlit yellow, our template captures the heart and soul of farming life. Adorned with colorful farm-centric graphics, rustic icons, and evocative image placeholders, it's a visual ode to the age-old tradition of agriculture. Meticulously tailored for Powerpoint, Keynote, or Google Slides. Perfect for farming entrepreneurs, agricultural businesses, or anyone rooted in the rich soil of cultivation. Sow your ideas; watch your farming story grow.


7 slides
Competitive Analysis Using Strategy Wheel
Highlight your competitive edge with this dynamic strategy wheel diagram. Designed to visually compare up to six business components, this slide is ideal for showcasing strengths, weaknesses, or market positioning. Perfect for strategic planning sessions, it’s fully editable in PowerPoint, Keynote, and Google Slides.

24 slides
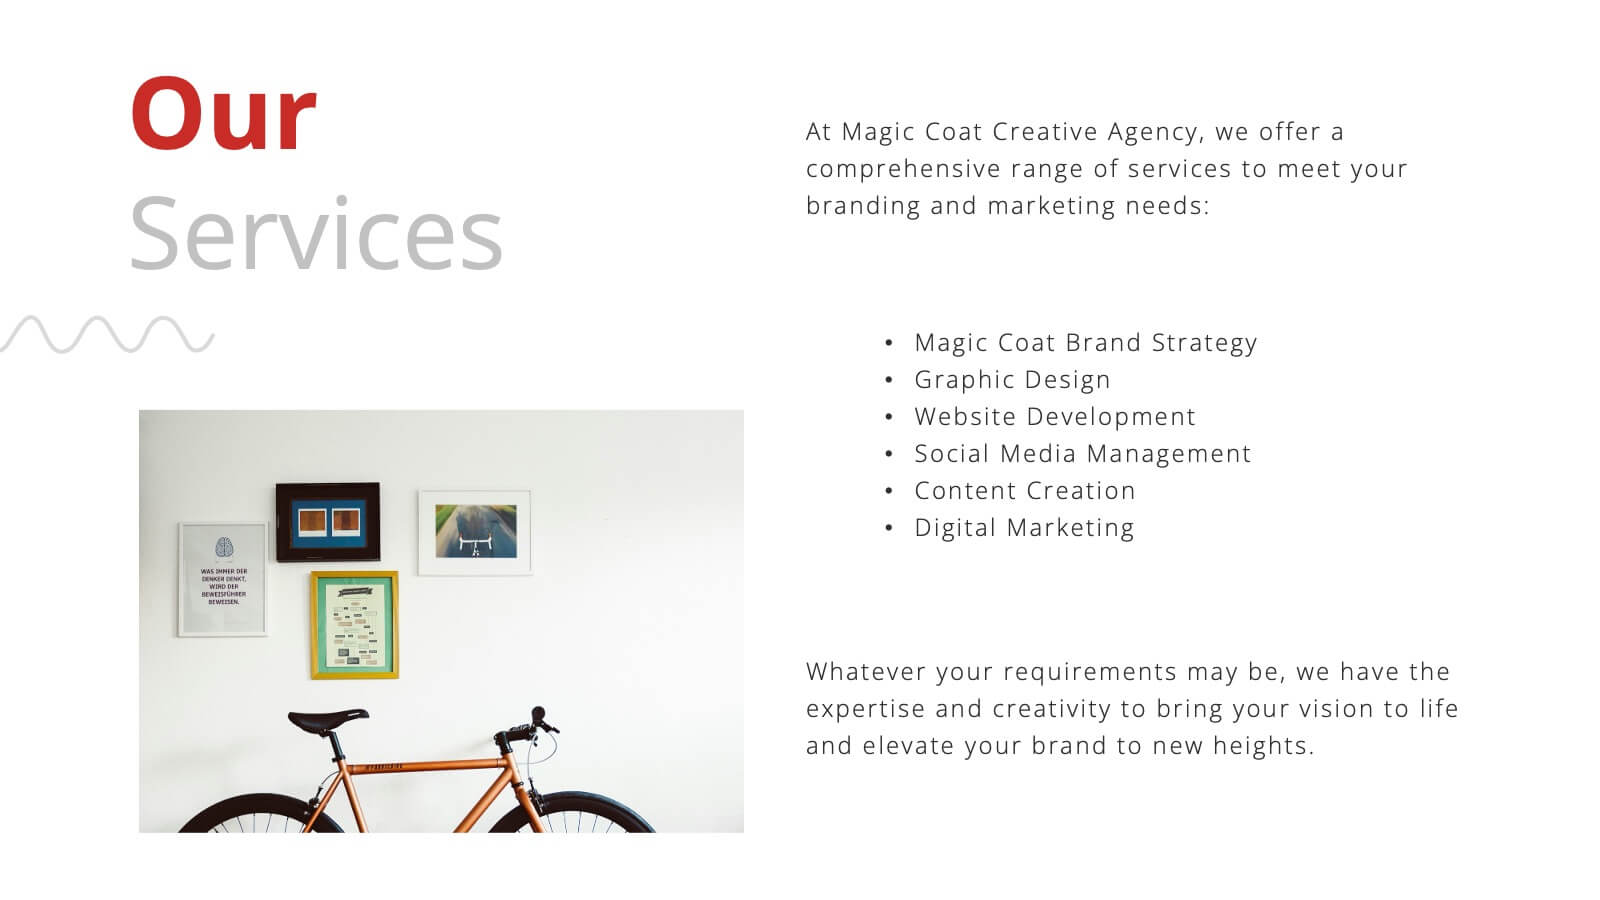
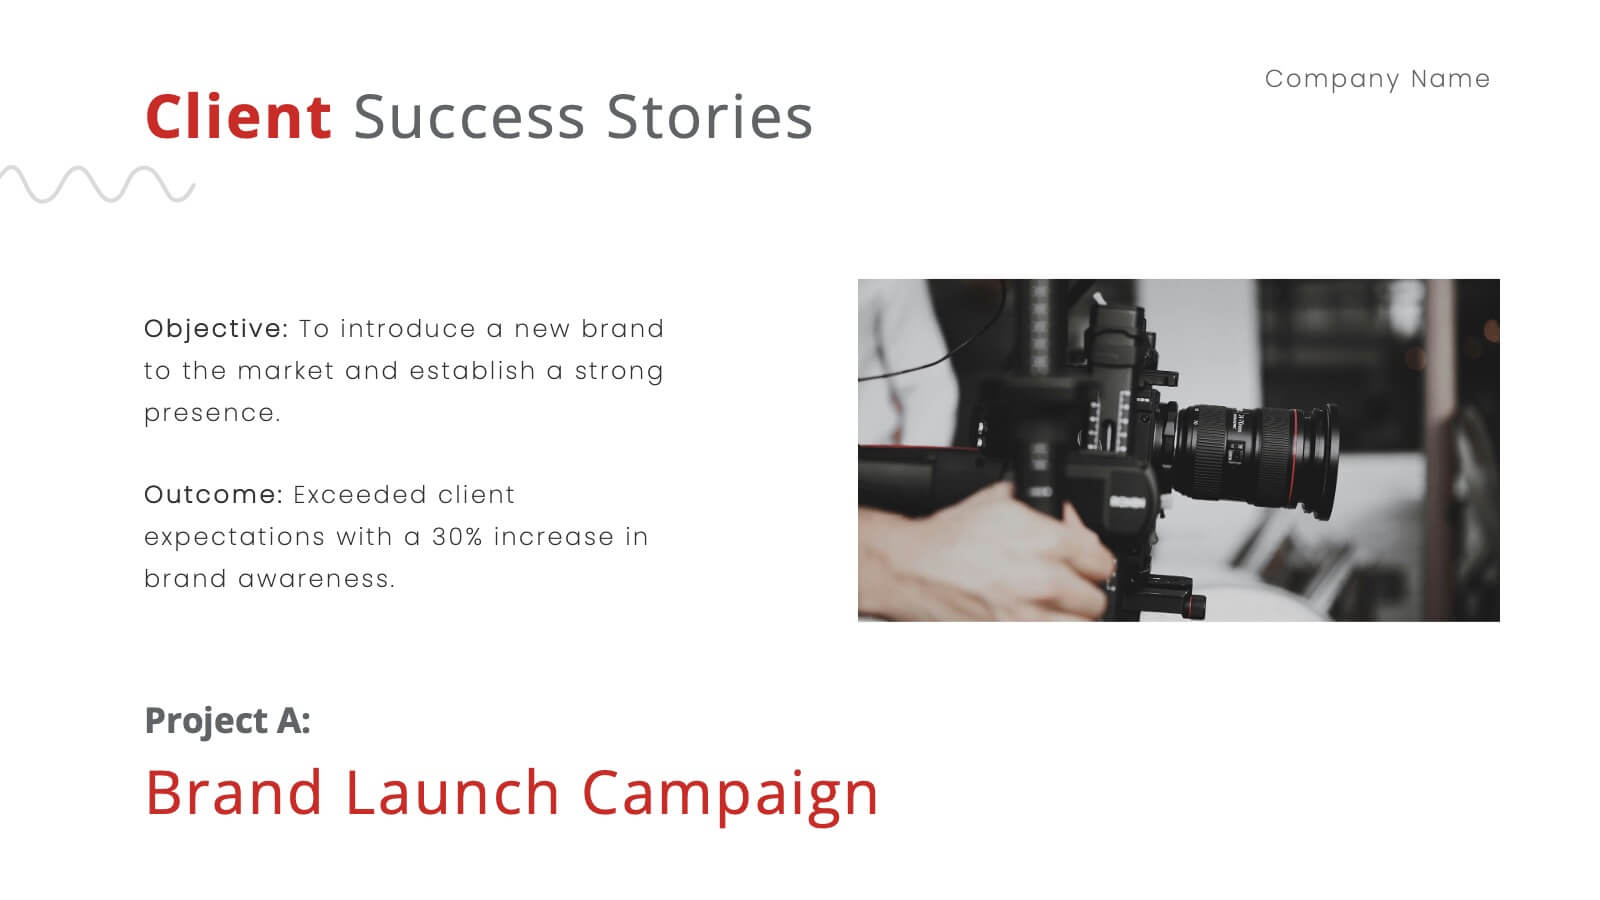
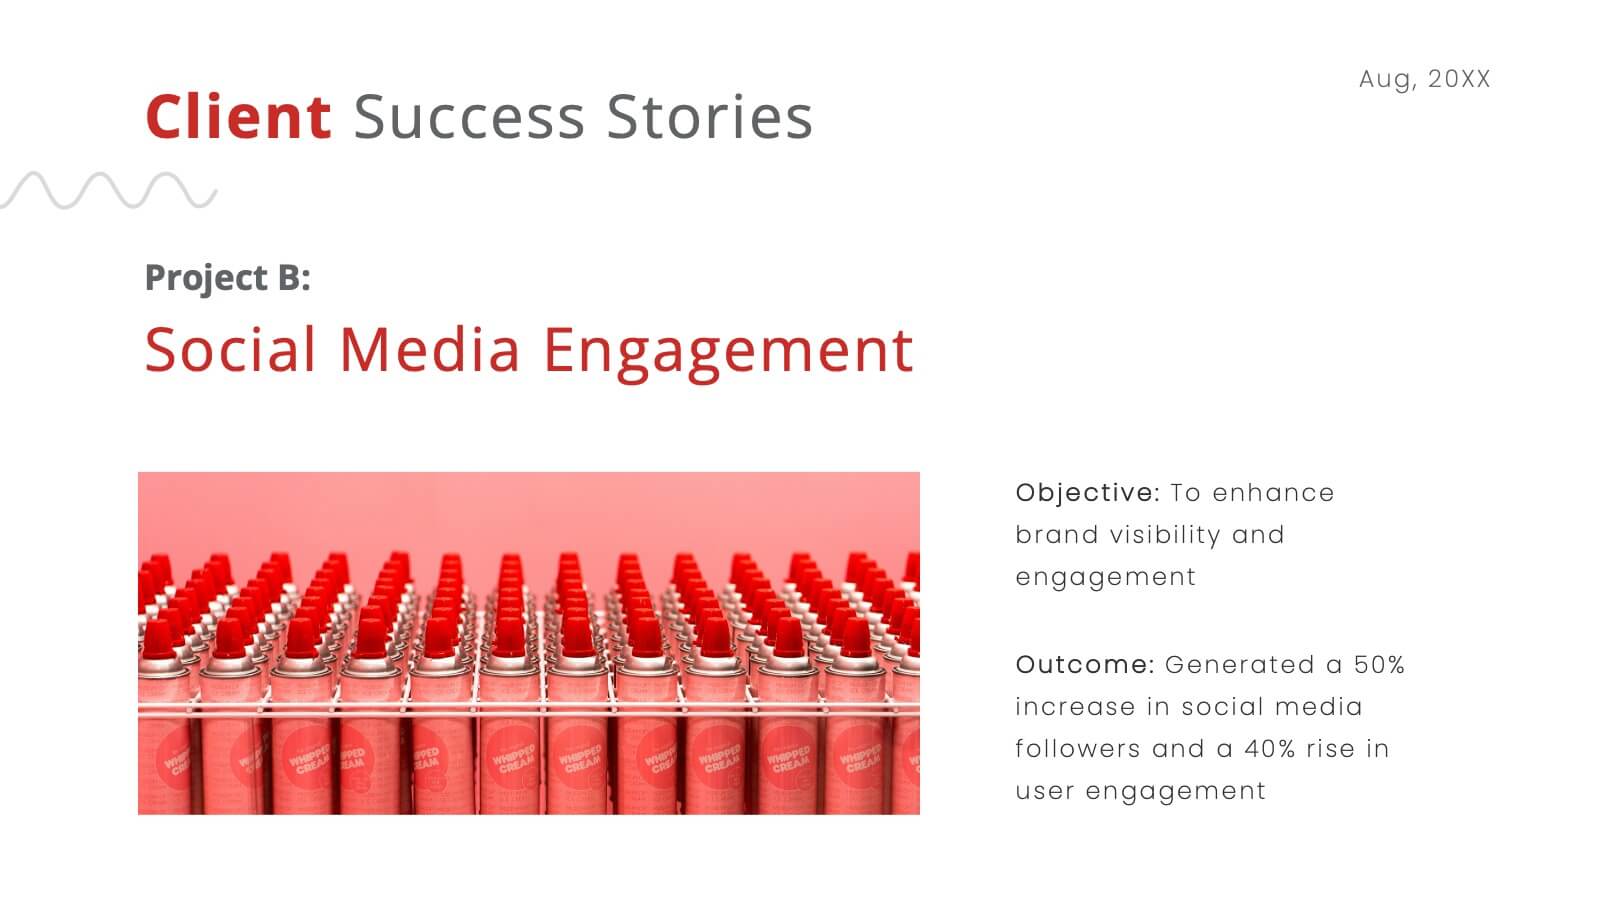
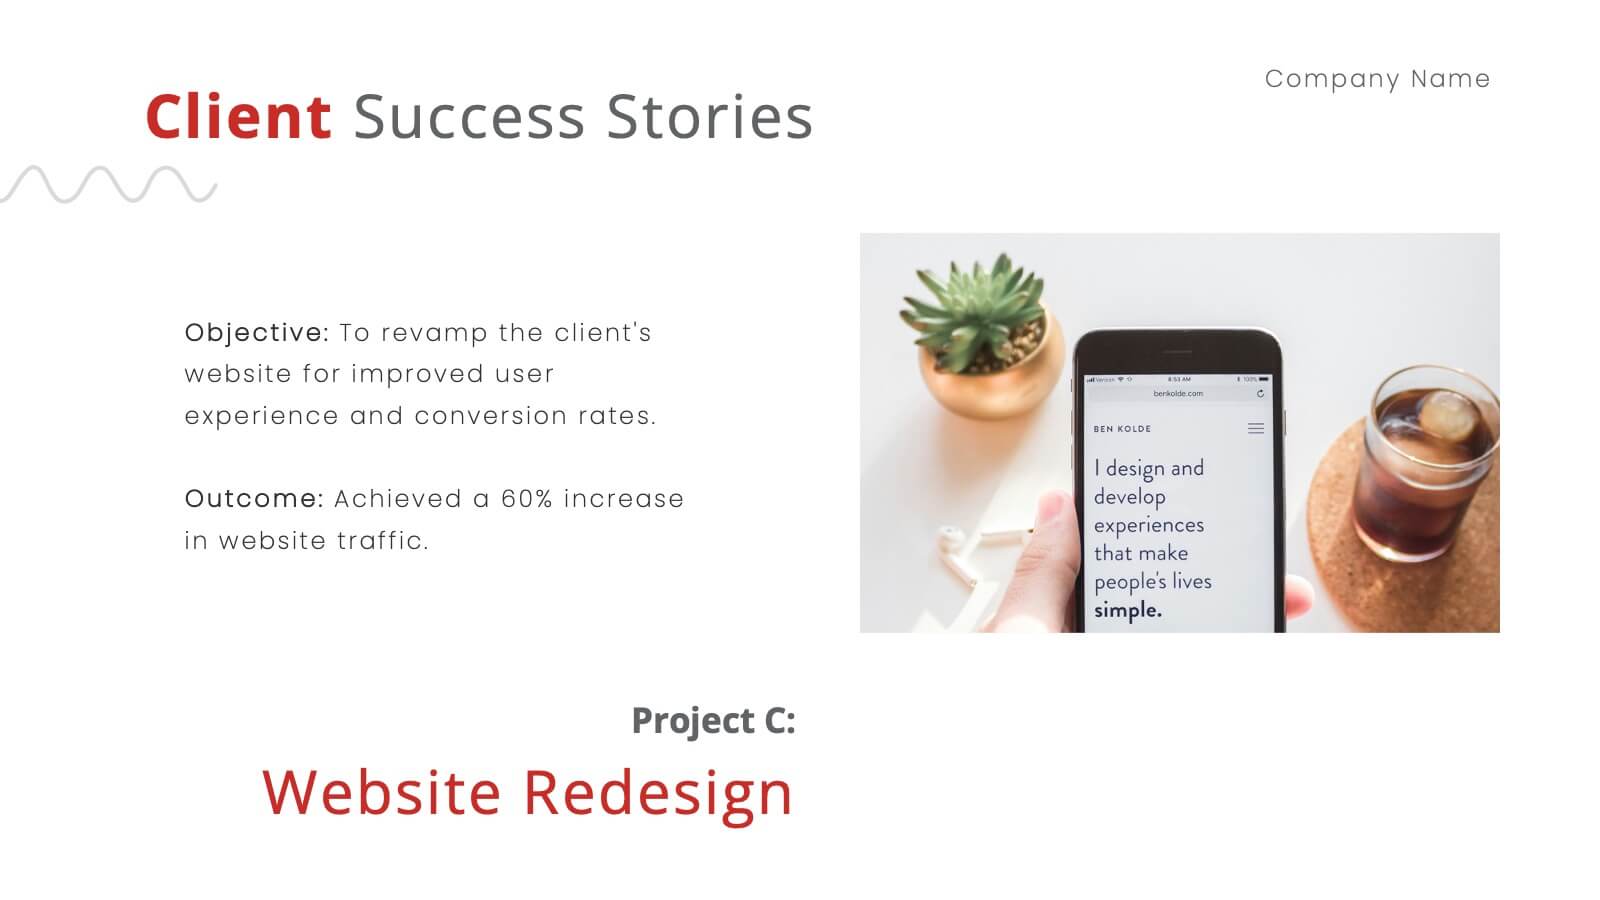
Nickel Advertising Agency Proposal Presentation
Take your advertising agency to the next level with this sleek and modern presentation template! Highlighting your services, team, success stories, and marketing strategies, it’s the perfect tool to showcase your agency’s strengths and capabilities. Fully customizable and compatible with PowerPoint, Keynote, and Google Slides, this template is ideal for impressing potential clients and partners.
22 slides
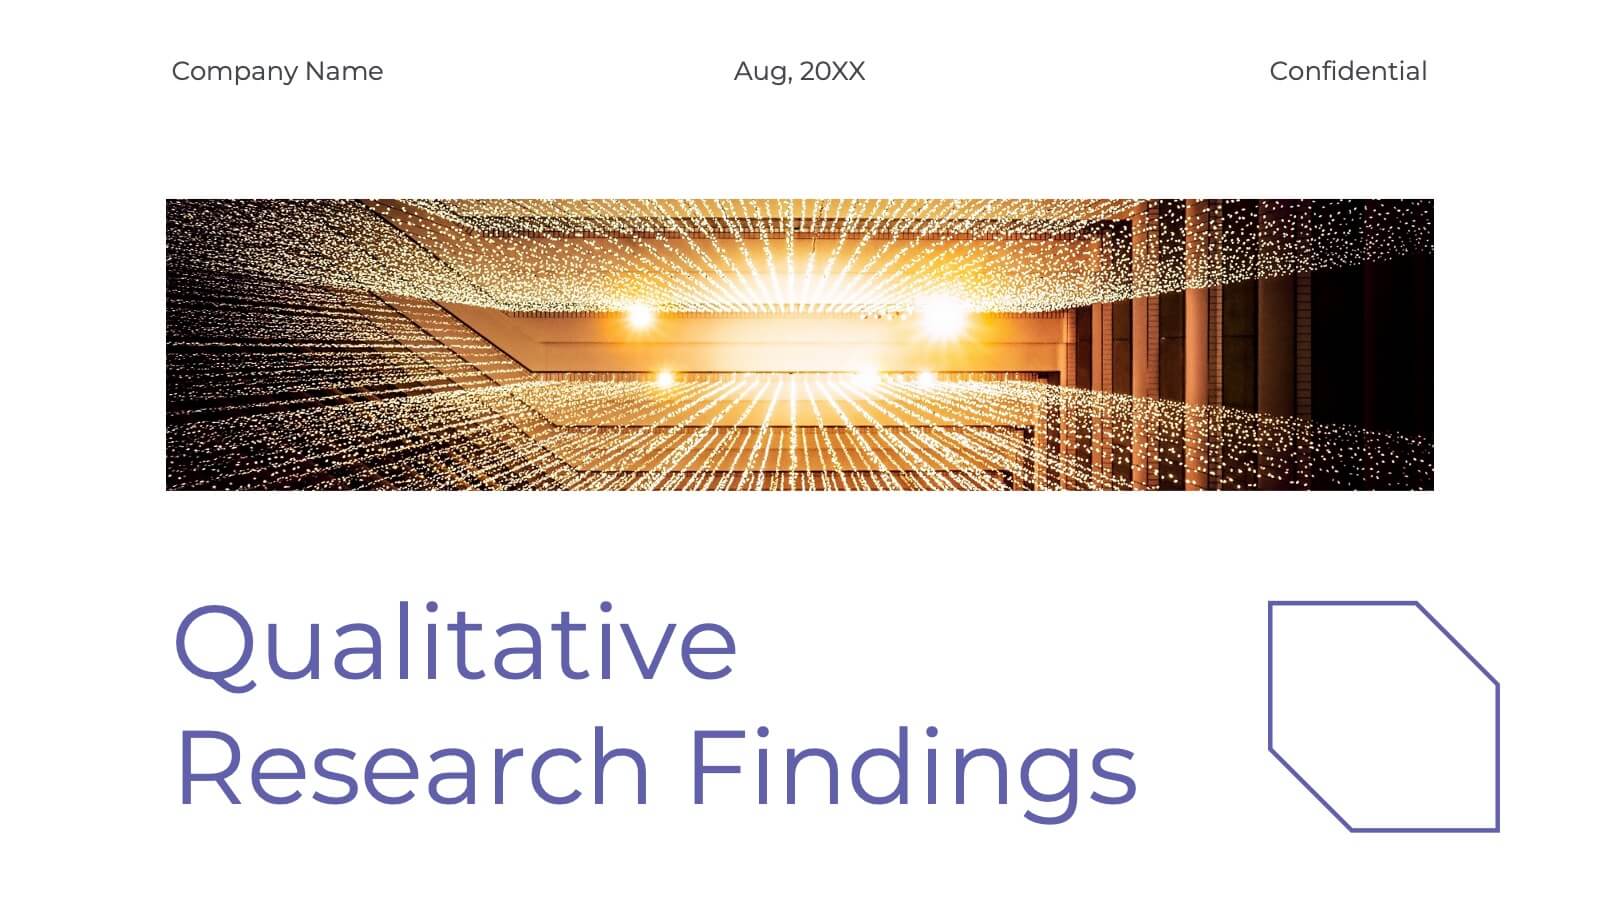
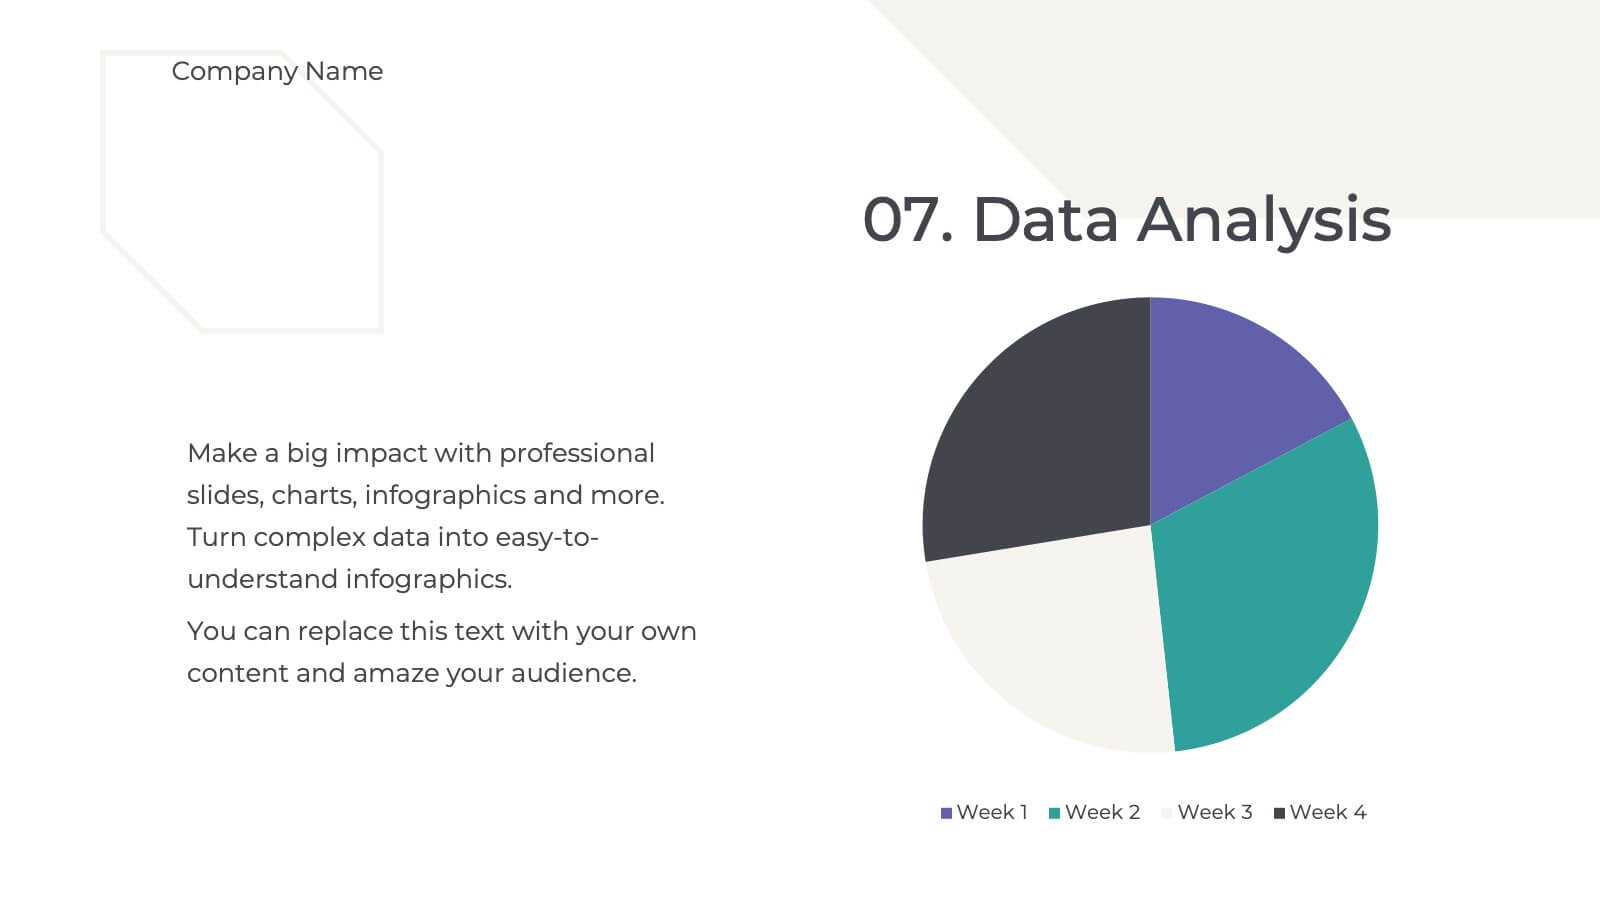
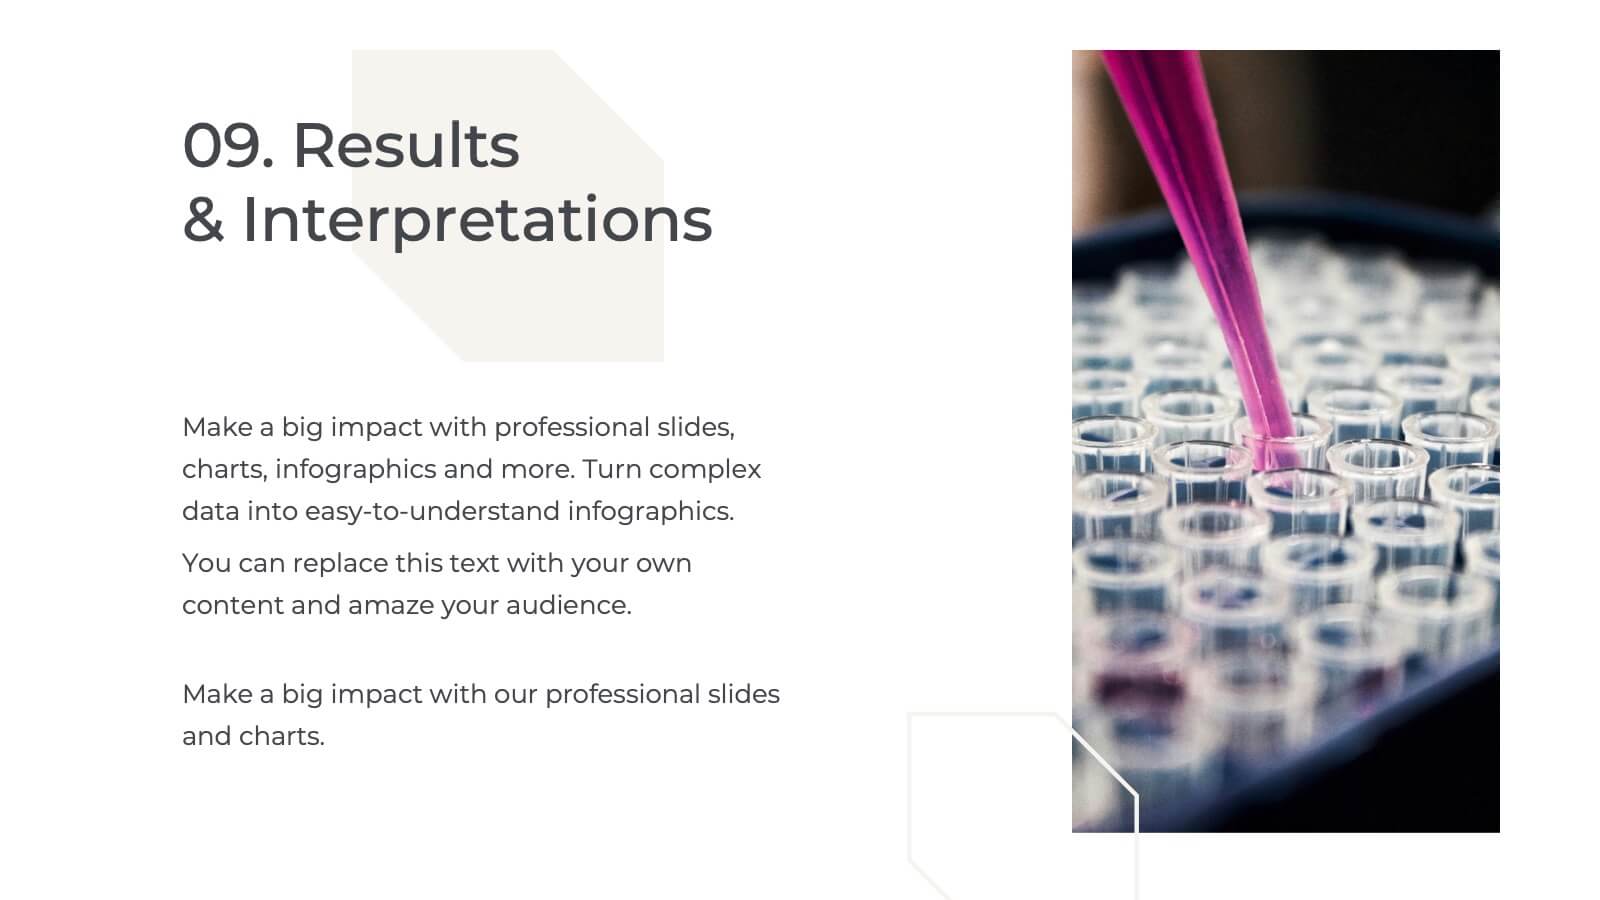
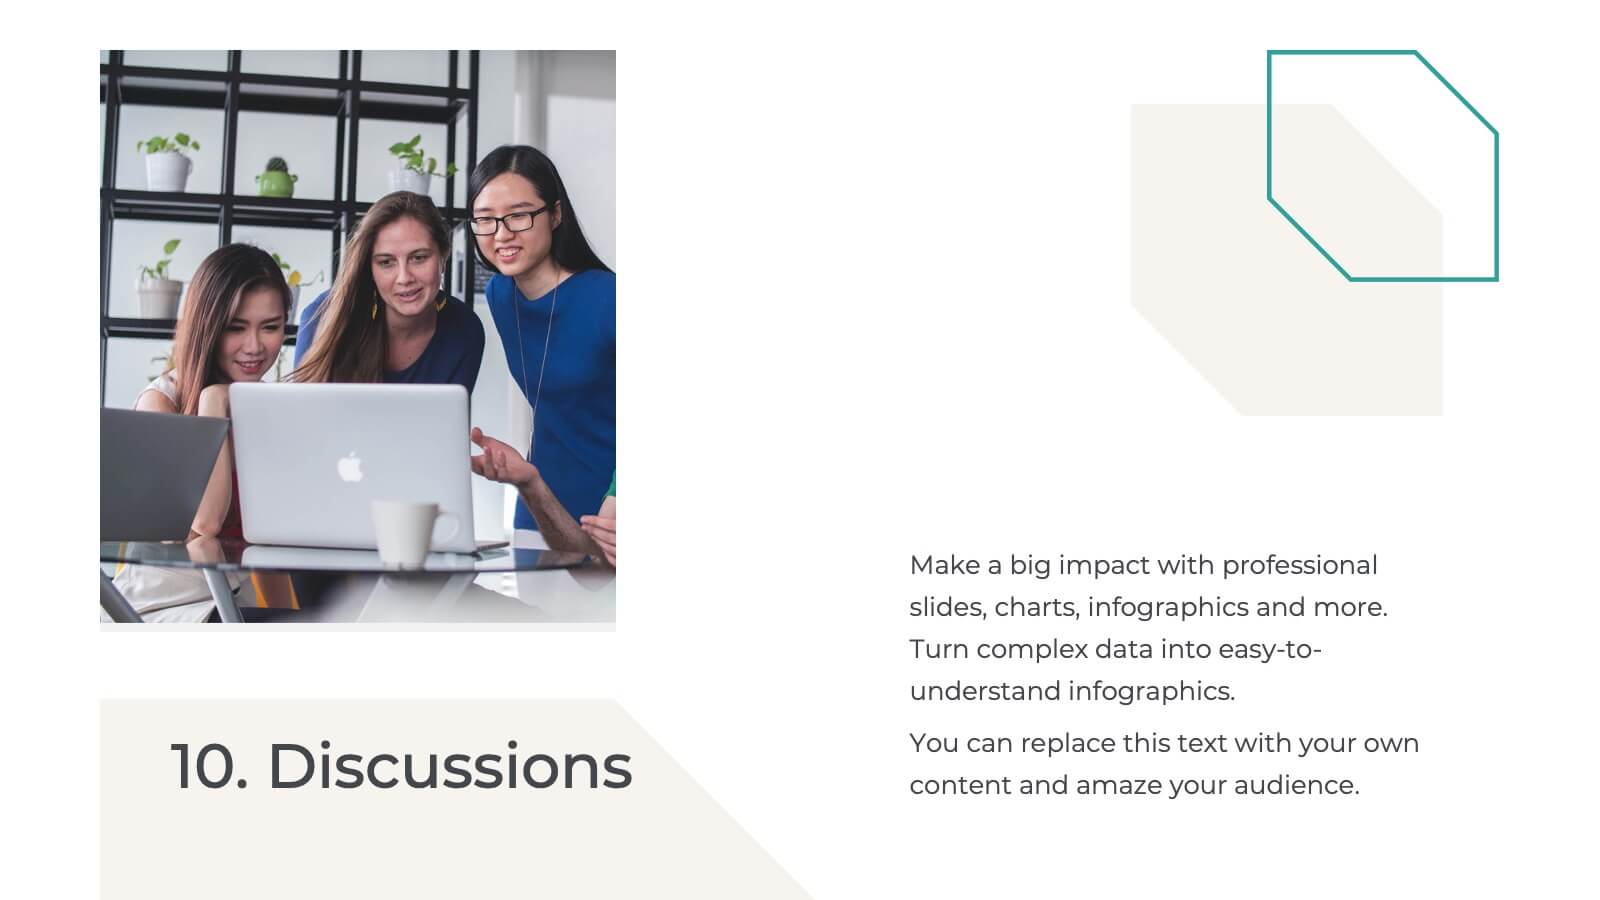
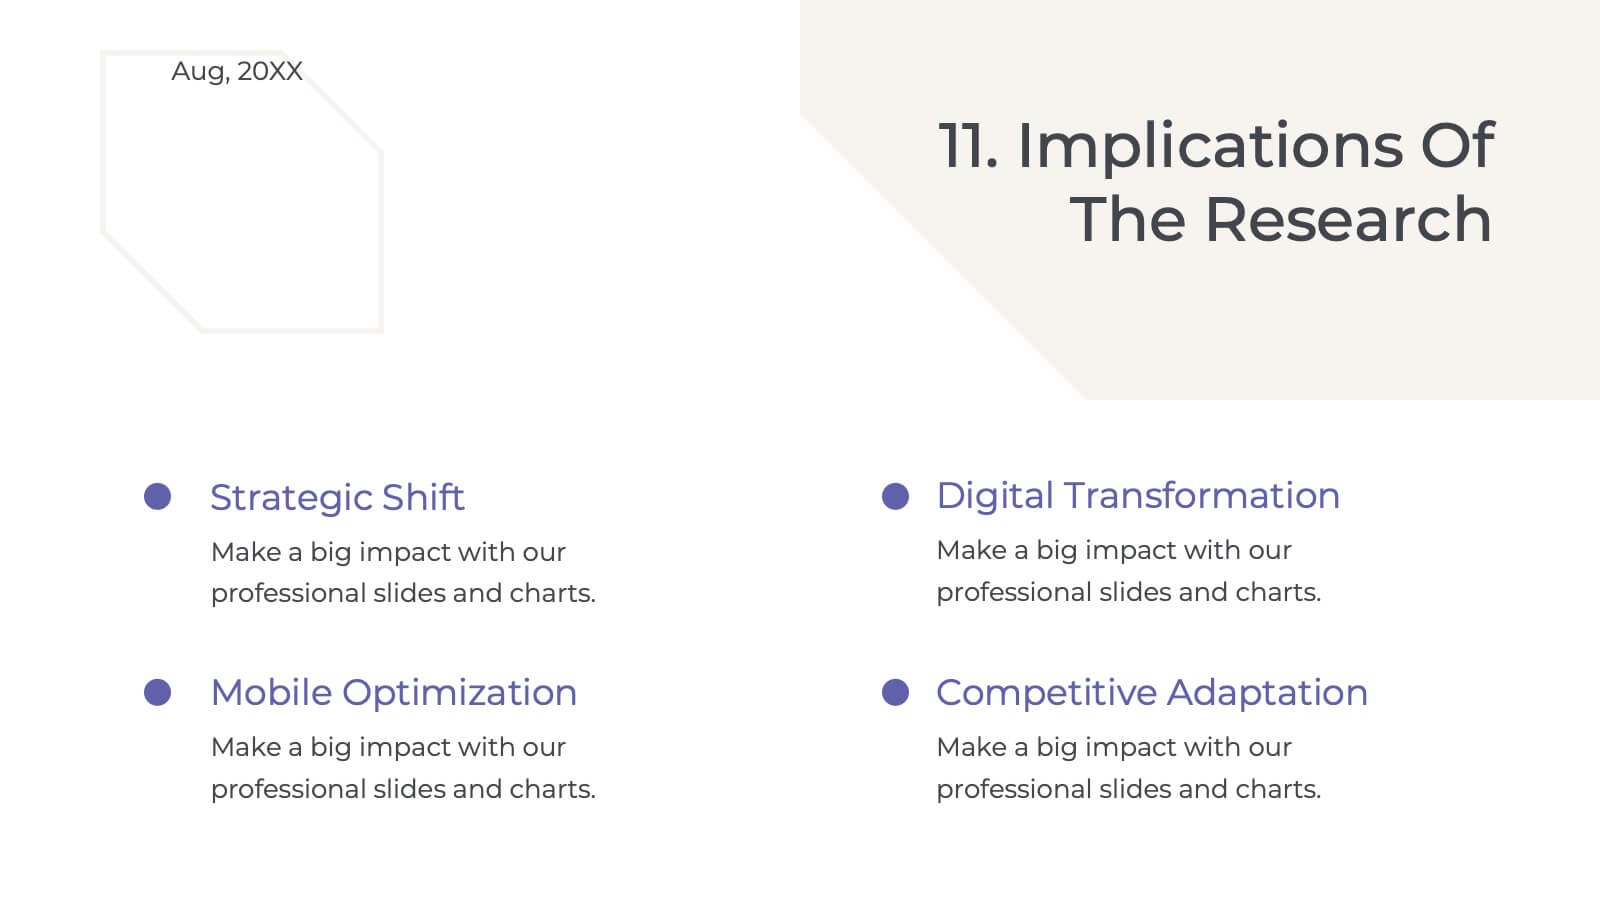
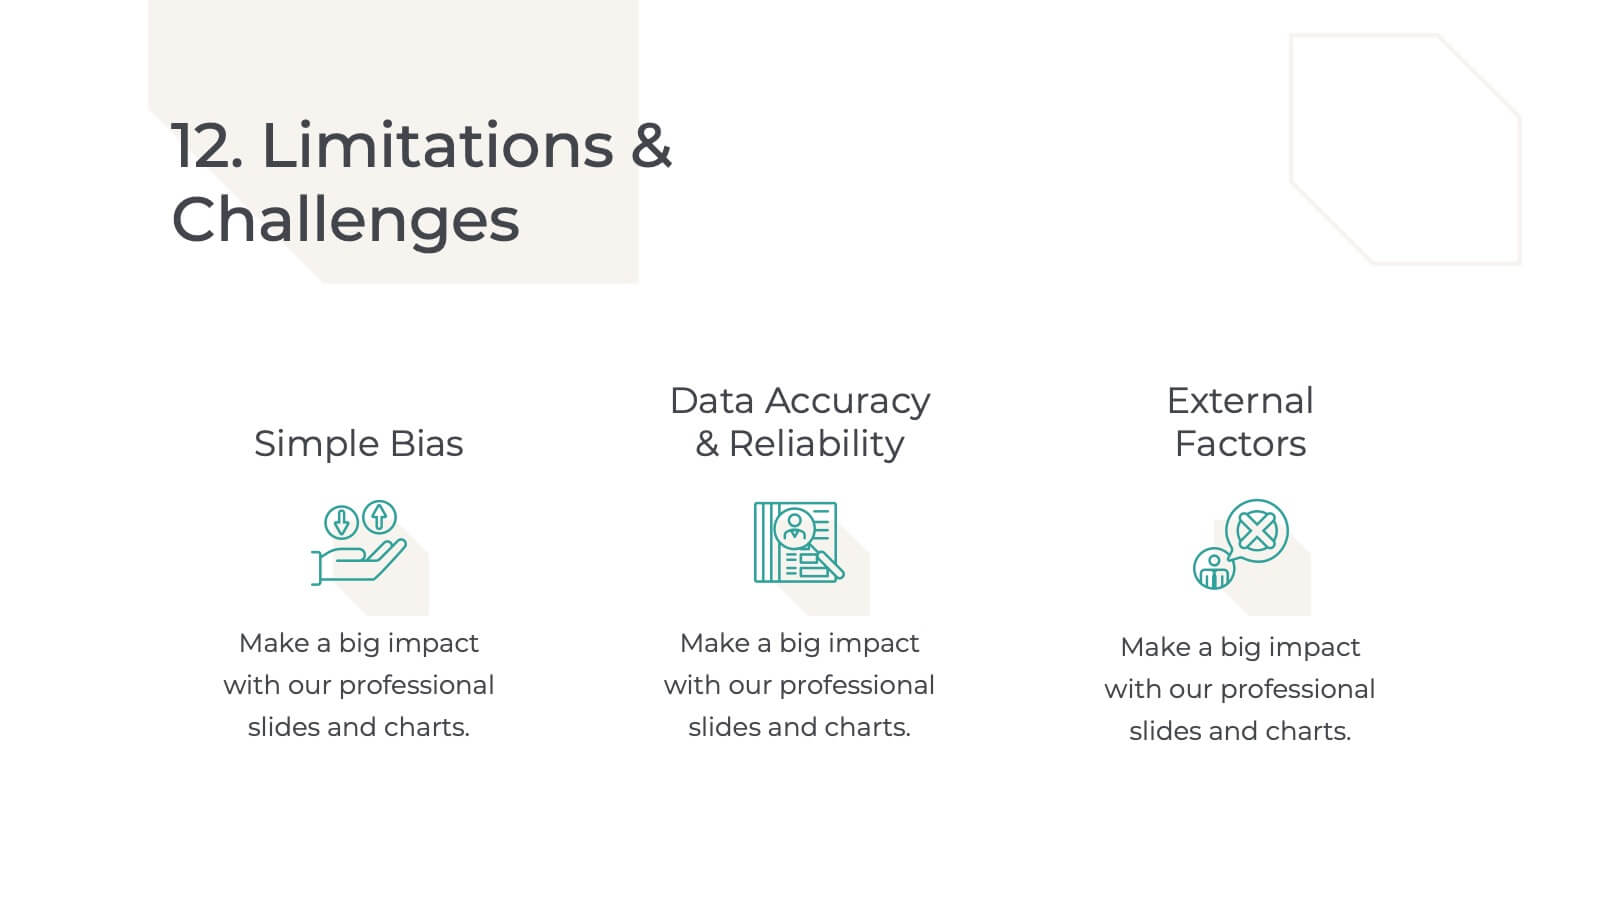
Palladium Qualitative Research Findings Presentation
Present your qualitative research findings effectively with this sleek, professional template. It includes sections for objectives, data analysis, key findings, and recommendations. Ideal for organizing research insights clearly, it's customizable and compatible with PowerPoint, Keynote, and Google Slides, ensuring smooth collaboration and impactful presentations for your audience.


26 slides
Wok Presentation Template
Want to learn about popular Chinese dishes? Wok is a fun and colorful template made for you. It includes all the essential elements of a food related template: fresh ingredients and vibrant colors. Wok was developed to meet the needs of those who want to promote their business with a clean and organized design. It has easy editing features making it simple to customize by adding company logos and other relevant details. The template is responsive, which means that it will adapt its layout based on how the user wants it displayed. This makes it easy to access the site from wherever you may be.


10 slides
Remote Work Best Practices Presentation
Streamline your team's productivity with this Remote Work Best Practices presentation. Ideal for hybrid or fully remote businesses, this layout features five key steps illustrated in a connected visual path, helping communicate structure and flow. With a clean, modern design and editable sections, it's perfect for onboarding, policy training, or workflow optimization. Compatible with PowerPoint, Keynote, and Google Slides for easy customization.


2 slides
Office Interview Scenes Illustrations
Elevate your Interview experience with our office interview scenes illustrations pack! This is a burst of high-energy and lightheartedness that infuses the often nerve-wracking interview process with a touch of excitement and fun. These illustrations seamlessly fit into PowerPoint, Google Slides, and Keynote. Add a splash of color and playfulness to the serious nature of interviews, creating an environment where both interviewers and candidates can feel at ease!