


Features
- 3 Unique slides
- Fully editable and easy to edit in Microsoft Powerpoint, Keynote and Google Slides
- 16:9 widescreen layout
- Clean and professional designs
- Export to JPG, PDF or send by email


Do you have any questions?
Recommend


21 slides
Ember Echo Graphic Design Project Plan Presentation
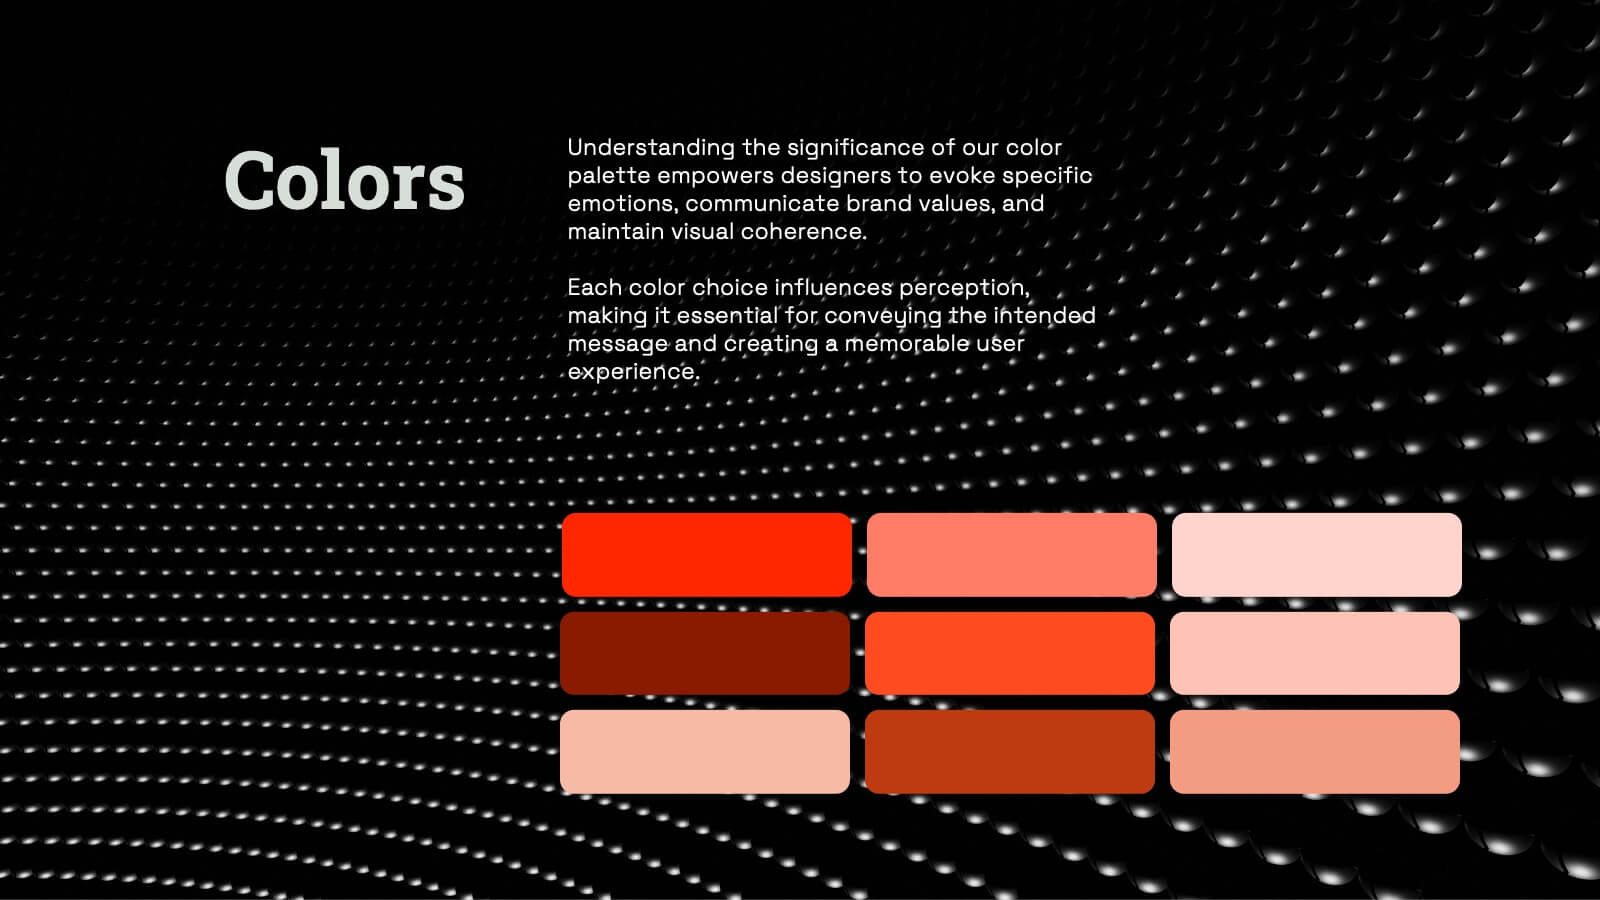
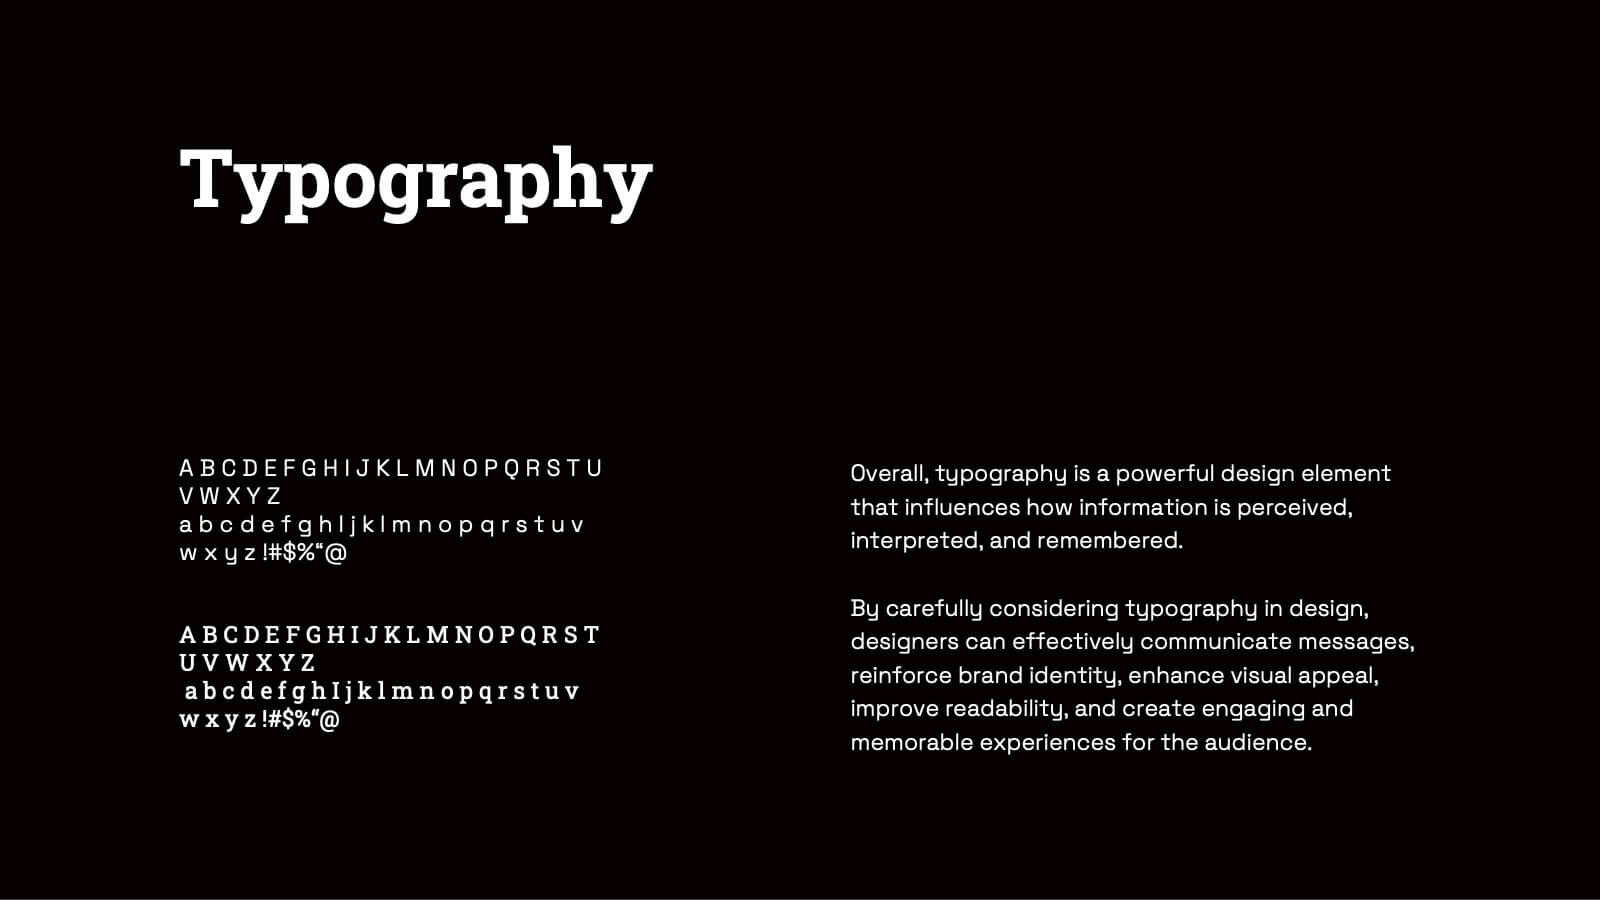
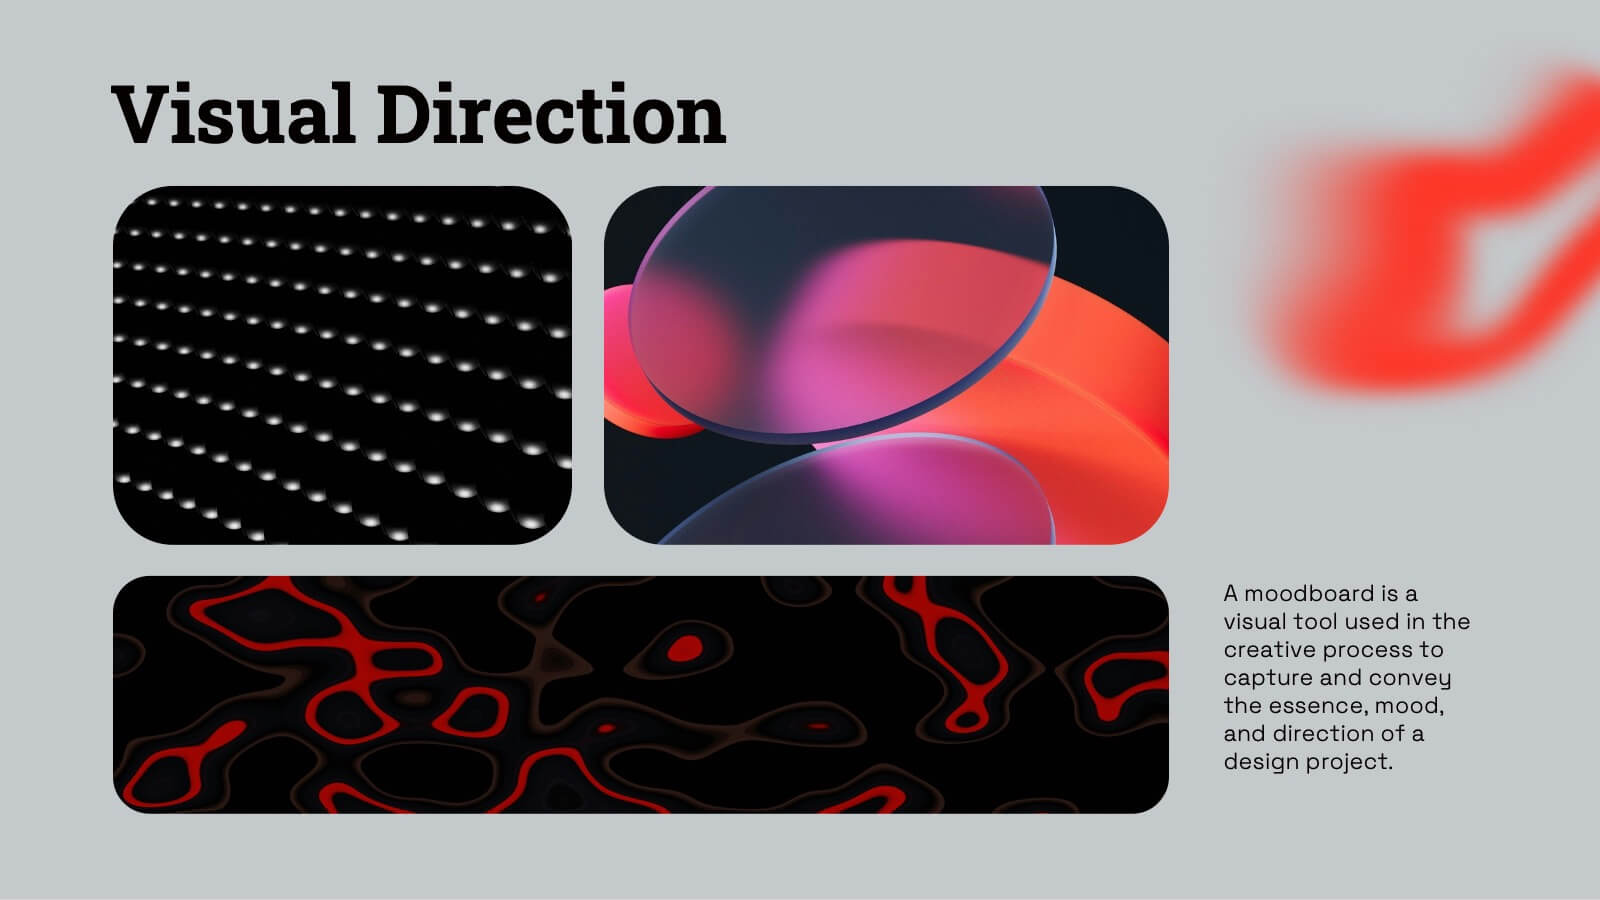
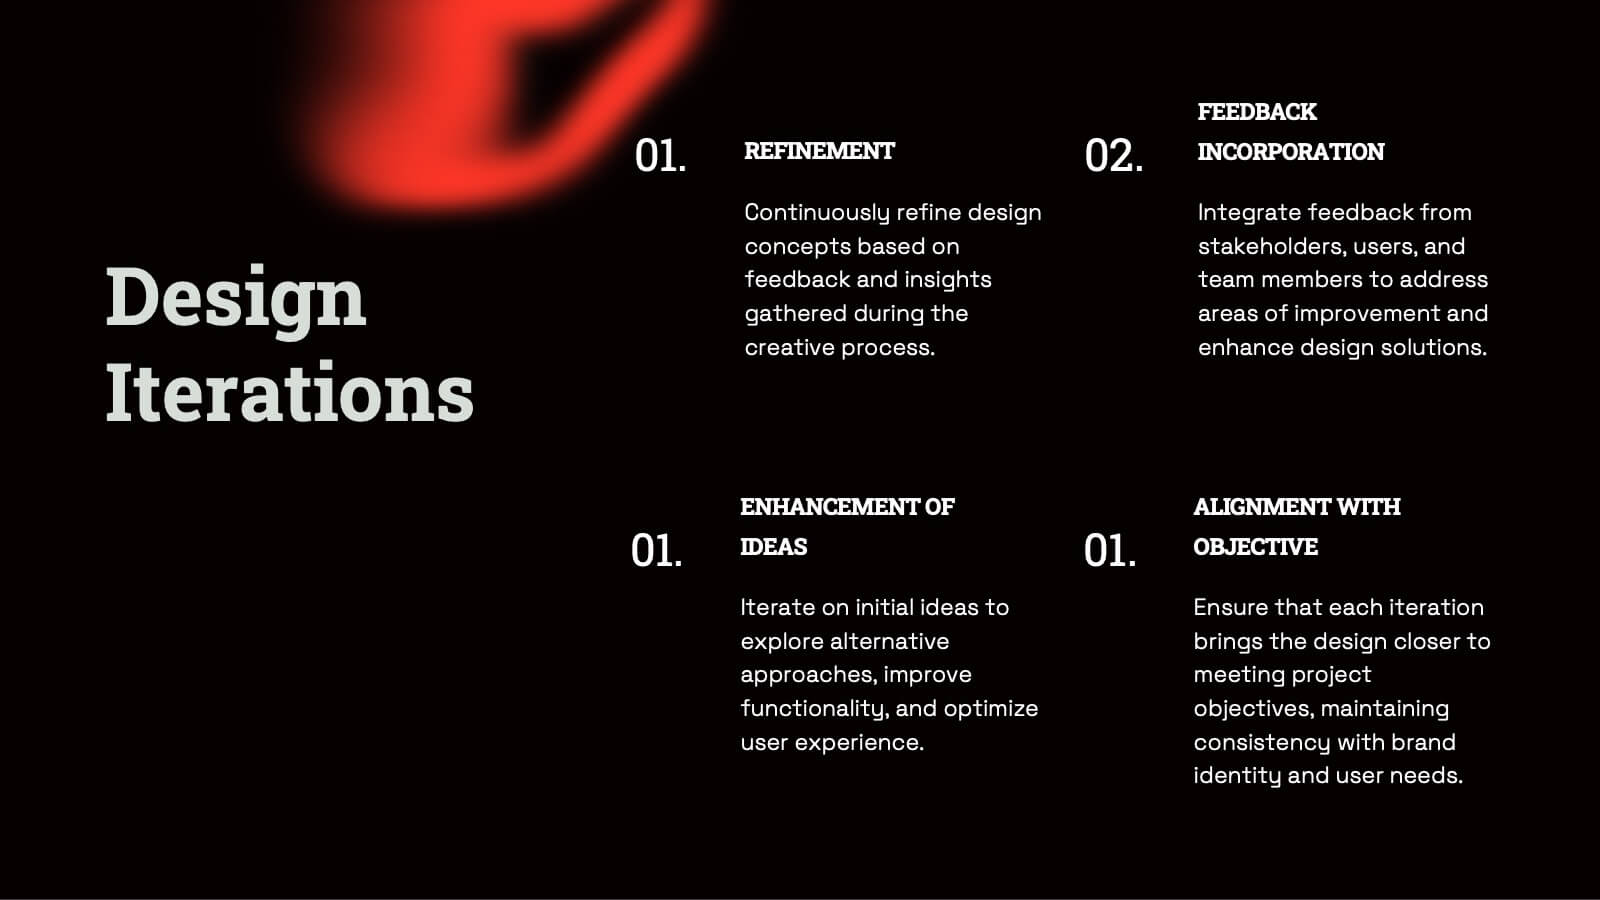
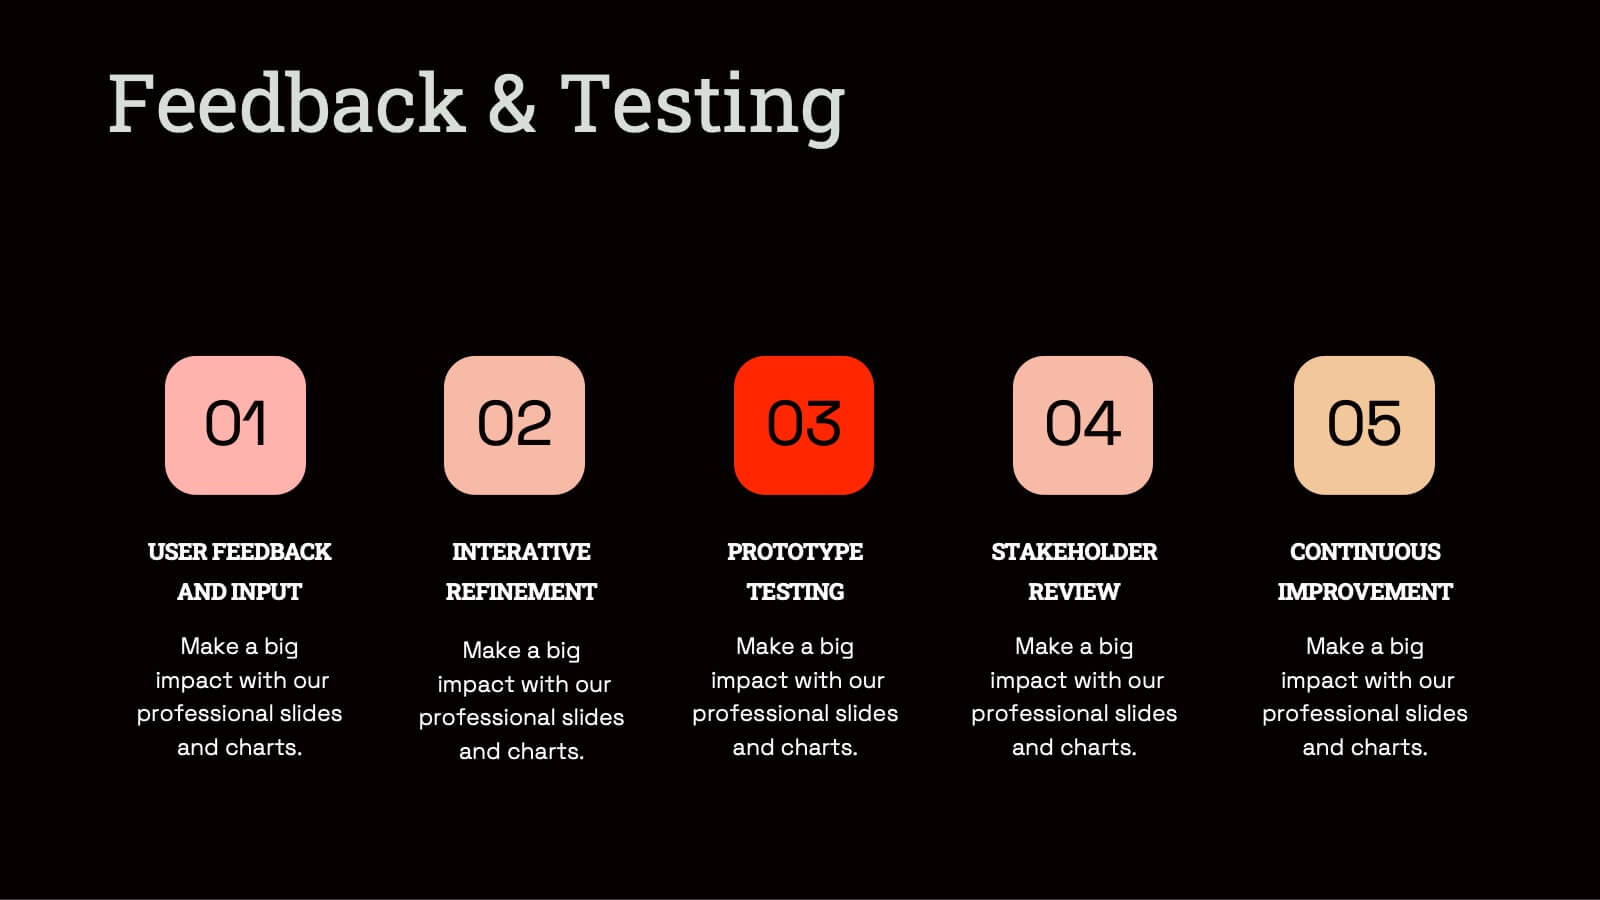
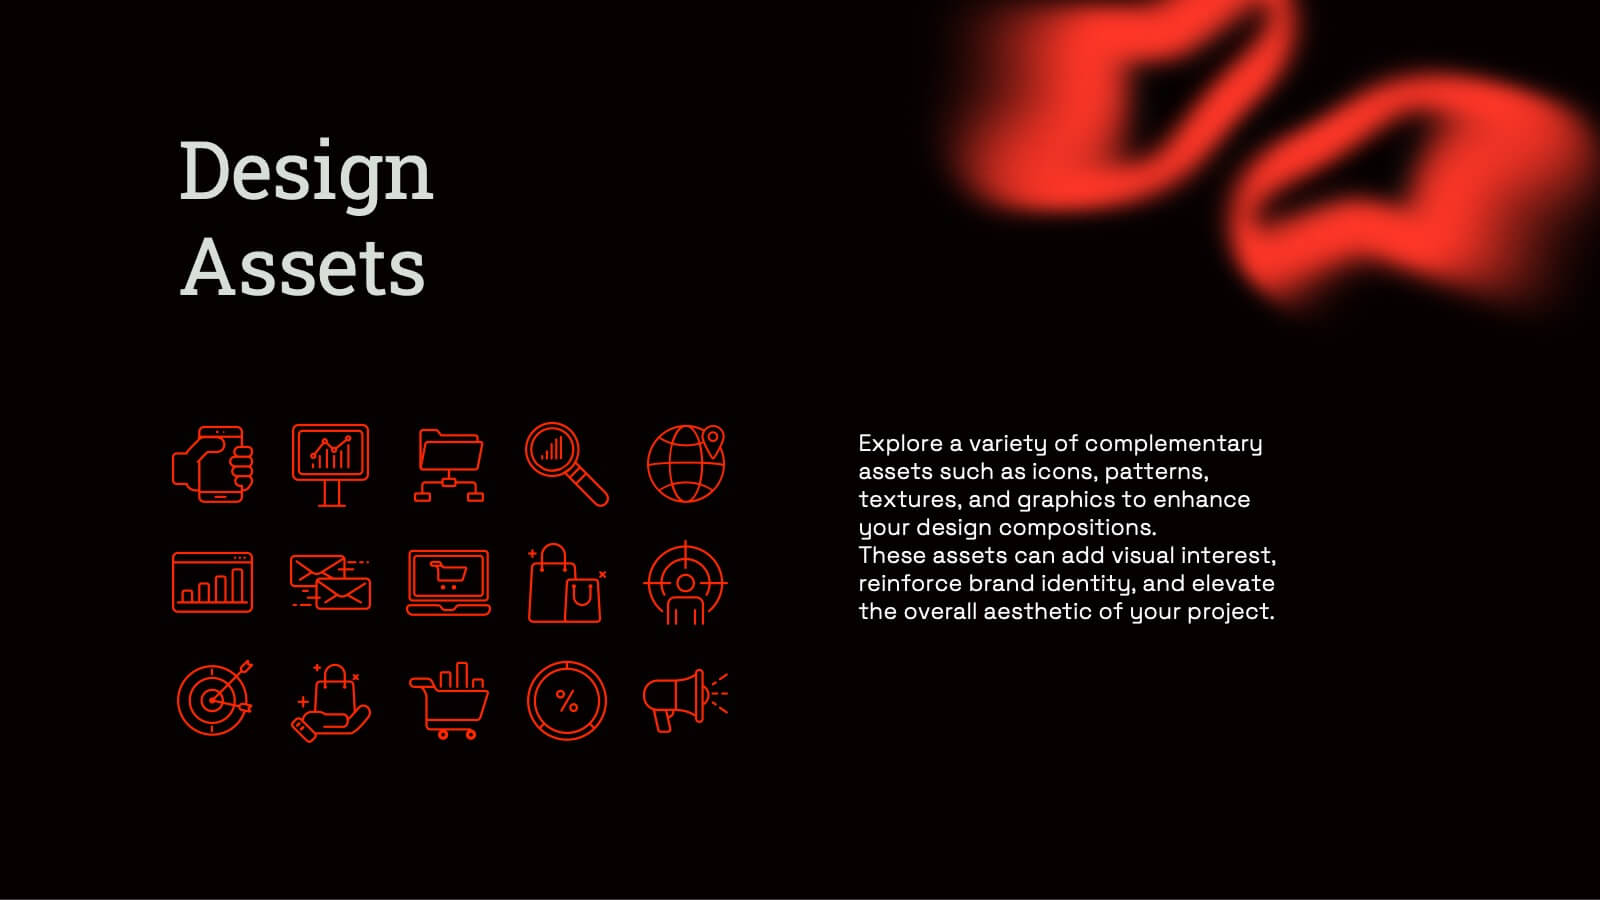
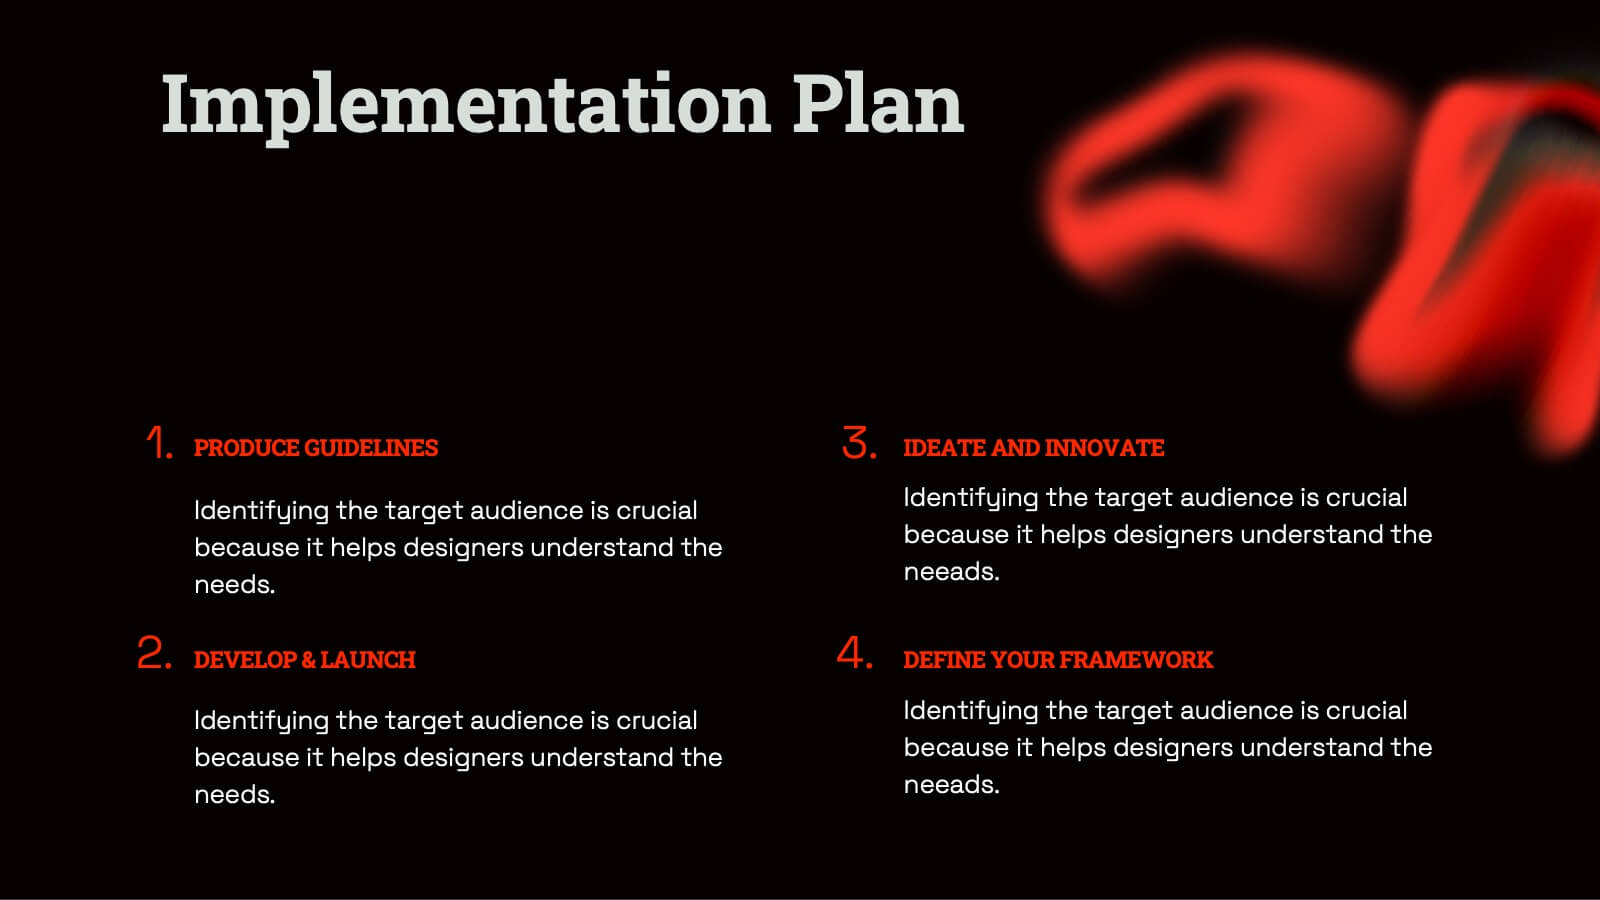
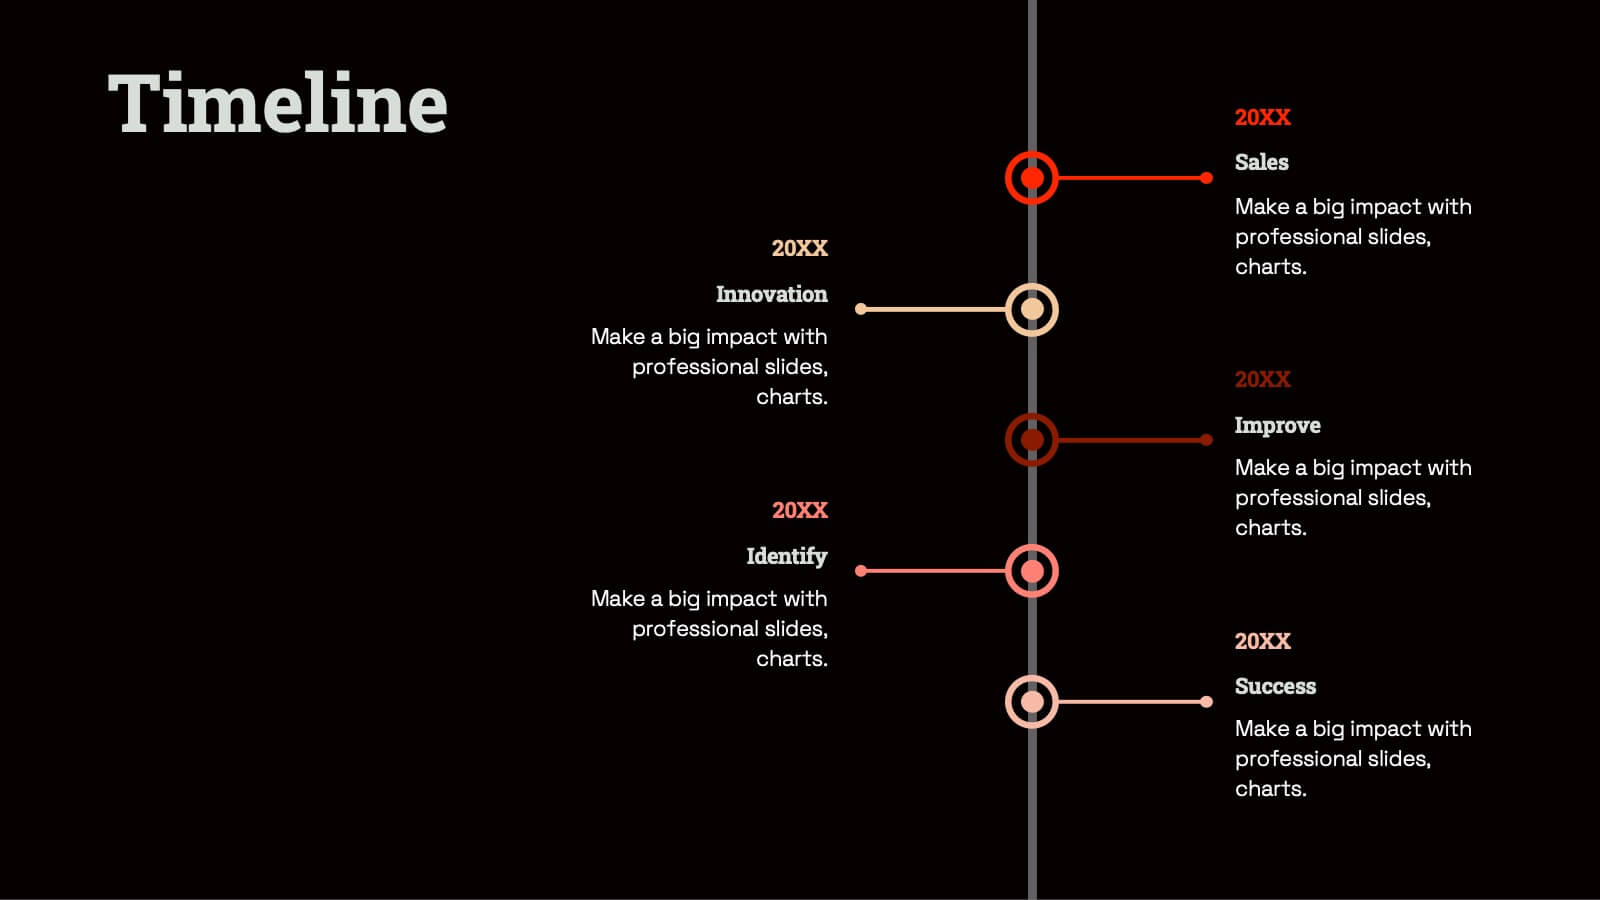
The Ember Graphic Design Project Plan template is the perfect canvas for your creative journey! Kickstart your project with a sleek and professional introduction that sets the tone for your design vision. This template is designed to guide you through every step of the design process, from the initial brief to the final presentation. Highlight your target audience, concept development, and design elements with beautifully crafted slides that capture the essence of your project. Dive into the specifics with dedicated sections for brand identity components, textures, and the design process itself, ensuring that every detail is covered. The template also includes mood boards, prototypes, and design assets, making it easy to showcase your work in progress. With feedback and testing slides, you can iterate and refine your designs before presenting the final product. This template is fully compatible with PowerPoint, Keynote, and Google Slides, making it versatile and easy to use for any creative project.


6 slides
Business People Partner Infographics
Our "Business People Partner" infographic template is a modern and dynamic tool designed for PowerPoint, Keynote, and Google Slides. This template is particularly useful for HR professionals, business consultants, and team leaders who are involved in fostering effective business partnerships. The template highlights essential elements such as organizational roles, partnership strategies, and communication channels. Its layout is thoughtfully designed to help users articulate the intricacies of business partnerships and the roles of various stakeholders in a clear and concise manner. This makes it an invaluable resource for presentations focusing on collaborative efforts and strategic alliances in the business world. Featuring a bright and inviting color scheme, the design of this template is both contemporary and engaging. It reflects the dynamic and collaborative nature of business partnerships, making your presentation not just informative but also visually appealing. Whether you're presenting to executives, partners, or team members, this template ensures your message is delivered with clarity and impact.


6 slides
Enterprise Loyalty Program Infographic
A loyalty program is a structured marketing strategy designed to encourage customers to continue doing business with a company or brand by offering various incentives, rewards, and benefits for their ongoing loyalty and repeat purchases. This infographic template is a visual representation of the key components, benefits, and features of a loyalty program designed for a large-scale business or enterprise. This template visually conveys the value of the program, encourages participation, and showcases the benefits that customers can enjoy by becoming loyal members. This is compatible with Powerpoint, Keynote, and Google Slides.


5 slides
Creative Alphabet Display Template
Make your message memorable with the Creative Alphabet Display Template Presentation. This slide uses bold, interlocking letter shapes to showcase four key ideas in a linear, eye-catching format—perfect for step-by-step processes, value breakdowns, or themed concepts. Fully editable in PowerPoint, Keynote, and Google Slides.


6 slides
Business Revenue Break-Even Strategy
Visualize profitability with clarity using this dynamic break-even strategy template. Ideal for business analysts, finance teams, and consultants, this diagram highlights the balance between cost, loss, and profit at the break-even point. With intuitive icons and space for key metrics, it's fully editable in PowerPoint, Keynote, and Google Slides.


2 slides
Long-Term Vision Strategy Presentation
Spark forward momentum with a clean, modern slide that turns long-range planning into a story your audience can instantly follow. This presentation helps teams outline future goals, strategic priorities, and the actions needed to stay aligned over time. Fully compatible with PowerPoint, Keynote, and Google Slides.


23 slides
Kale Market Research Presentation
Elevate your market research presentation with this sleek template! Includes sections for introduction, objectives, data collection, analysis, key findings, and recommendations. Perfect for presenting insights, implications, and future research directions. Compatible with PowerPoint, Keynote, and Google Slides, ensuring a visually appealing and professional look. Make your data shine!


6 slides
TAM SAM SOM Market Infographic
TAM, SAM, and SOM are terms used in business and marketing to represent different levels of market potential and segmentation. This Infographic is a visual representation that explains the concepts of Total Addressable Market (TAM), Serviceable Available Market (SAM), and Serviceable Obtainable Market (SOM) in the context of business and market analysis. This template will encourage your audience to share this infographic to help make informed decisions about market strategies and growth potential. Compatible with Powerpoint, Keynote, and Google Slides. Summarize the benefits of the TAM SAM SOM in market analysis concepts.


7 slides
Business Plan Process Infographic
Unveil the roadmap to entrepreneurial success with our business plan process infographic. This simple and streamlined infographic encapsulates the quintessential steps to draft a robust business plan, guiding entrepreneurs and business professionals on their journey to creating a successful enterprise. This infographic is an indispensable tool for budding entrepreneurs, business consultants, educators, and anyone looking to gain insights into the formulation of a business plan. Designed for seamless integration with PowerPoint, Keynote, or Google Slides, this template promises a presentation that is both engaging and educative.


6 slides
Innovative Idea Pitching Guide Presentation
Present your ideas with clarity using the Innovative Idea Pitching Guide Presentation. This dynamic five-step circular flow design is perfect for showcasing pitch stages, idea development, or startup concepts. Each section includes icons and text blocks to clearly explain key points, keeping your message organized and impactful. Fully editable in Canva, PowerPoint, Keynote, and Google Slides.


6 slides
RACI Matrix Management Infographics
Streamline your project management with our RACI Matrix Management infographic template, compatible with PowerPoint, Keynote, and Google Slides. This template is a valuable tool for project managers, team leaders, and professionals involved in collaborative projects. Our template distinctly outlines the four key roles of RACI - Responsible, Accountable, Consulted, and Informed. Each section is clearly demarcated, making it easy to assign and display roles and responsibilities within your team. This structured approach ensures that everyone involved in a project understands their tasks and the hierarchy of accountability. The color scheme of the template is subtle and business-like, ideal for a corporate environment. It enhances readability and comprehension, ensuring that the RACI matrix is not only informative but also visually appealing. This template is an essential asset for efficient team management, enabling clear communication and organization in any project.


22 slides
Radiant Graphic Design Project Plan Presentation
Unleash your creativity with this bold and dynamic graphic design project plan template! Perfect for showcasing design elements, textures, and typography, this template guides you through every phase, from concept development and prototyping to feedback and final presentations. Ideal for visual direction and design asset management, it’s fully compatible with PowerPoint, Keynote, and Google Slides for seamless use.


5 slides
Operational Process Logic Map
Visualize how every function interconnects with the Operational Process Logic Map Presentation. This template uses a radial node structure to break down workflows, responsibilities, or systems into logical clusters, showing how different units or steps interact within an operational framework. Each node is color-coded and icon-marked for clarity, ideal for explaining process flows, department roles, or system dependencies. Fully editable in PowerPoint, Keynote, and Google Slides.


5 slides
Vaccine Myths Infographic
Vaccine Myths are false or misleading claims about vaccines that can contribute to vaccine hesitancy and misinformation. These infographic templates are designed to debunk common misconceptions and myths surrounding vaccines. These visually appealing and informative templates are ideal for healthcare professionals, educators, and organizations aiming to promote accurate information about vaccines and combat vaccine hesitancy. These infographics aim to educate and empower individuals to make informed decisions about vaccination and contribute to public health efforts. Compatible with Powerpoint, Keynote, and Google Slides.


20 slides
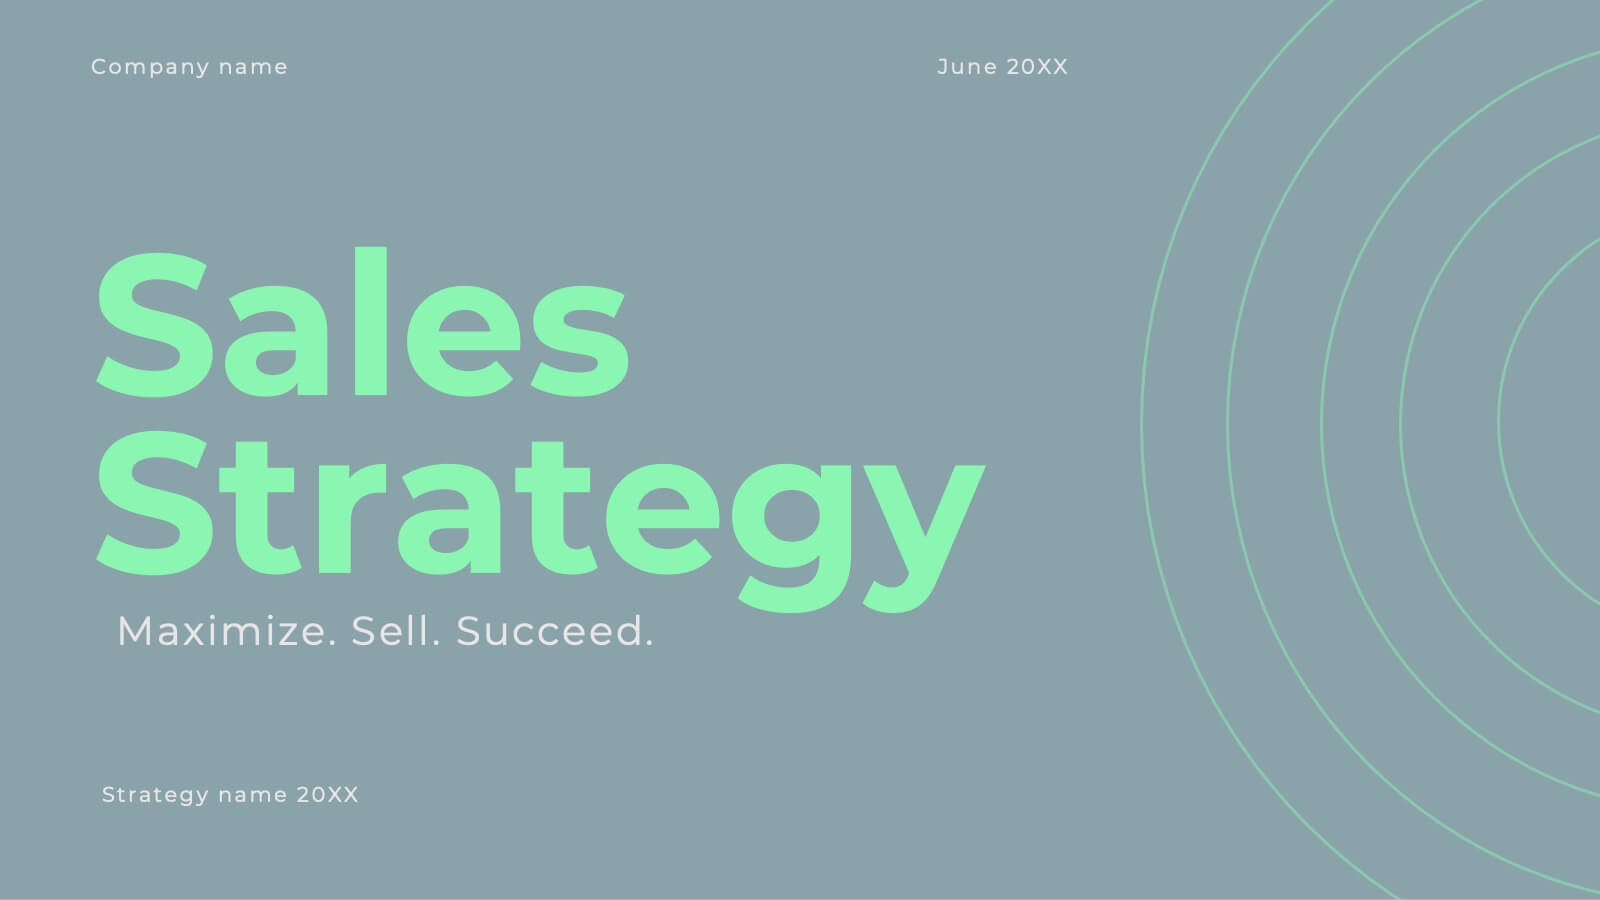
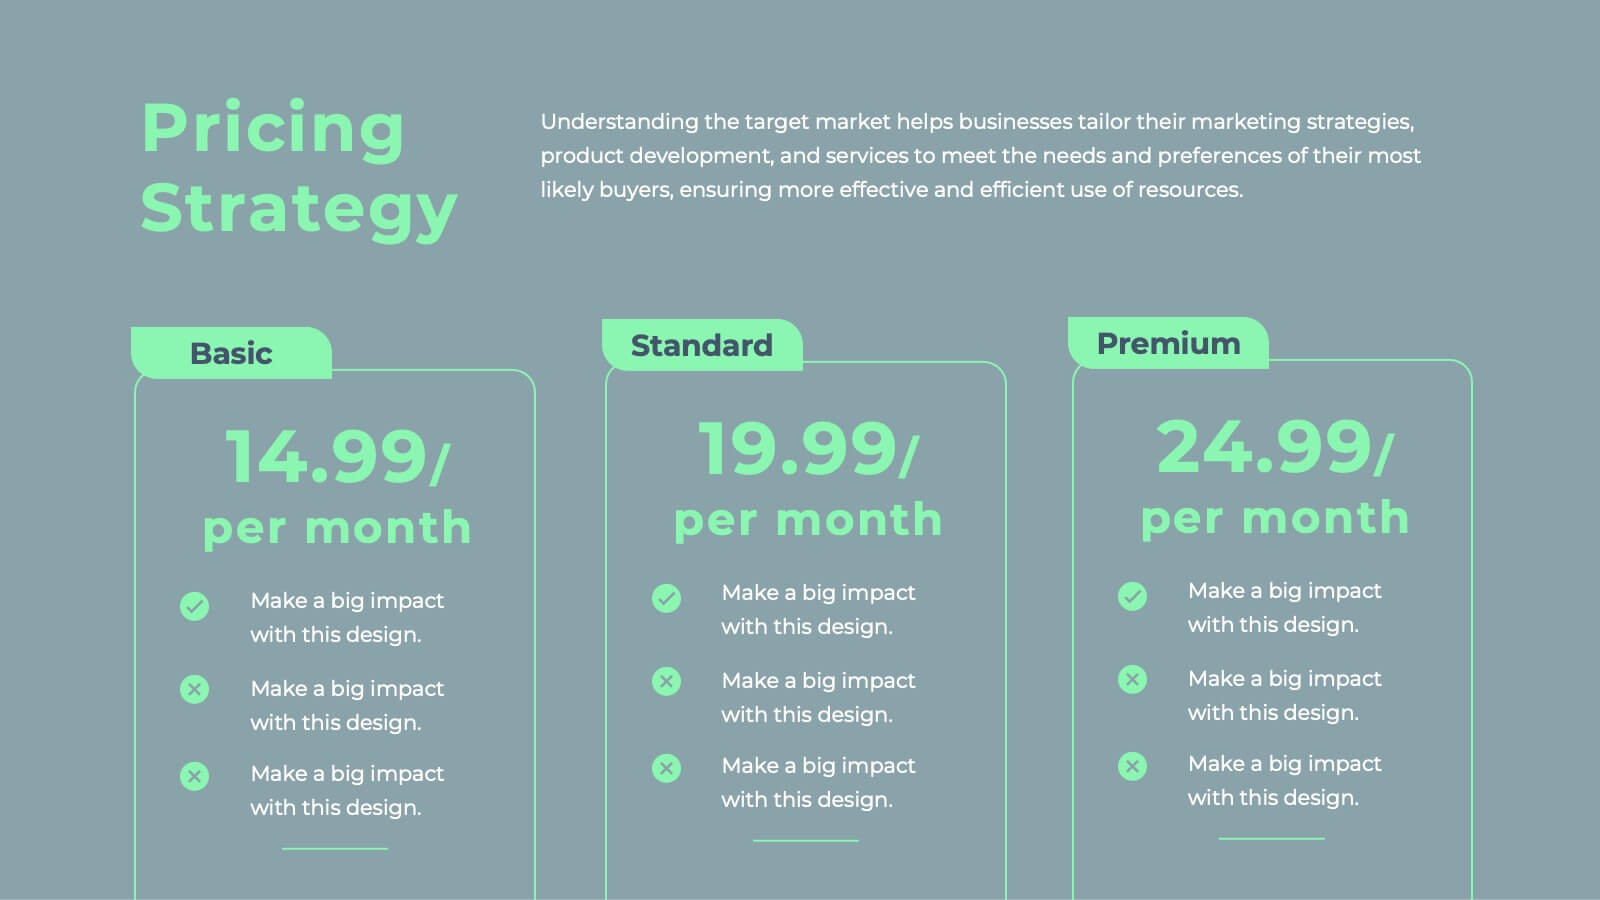
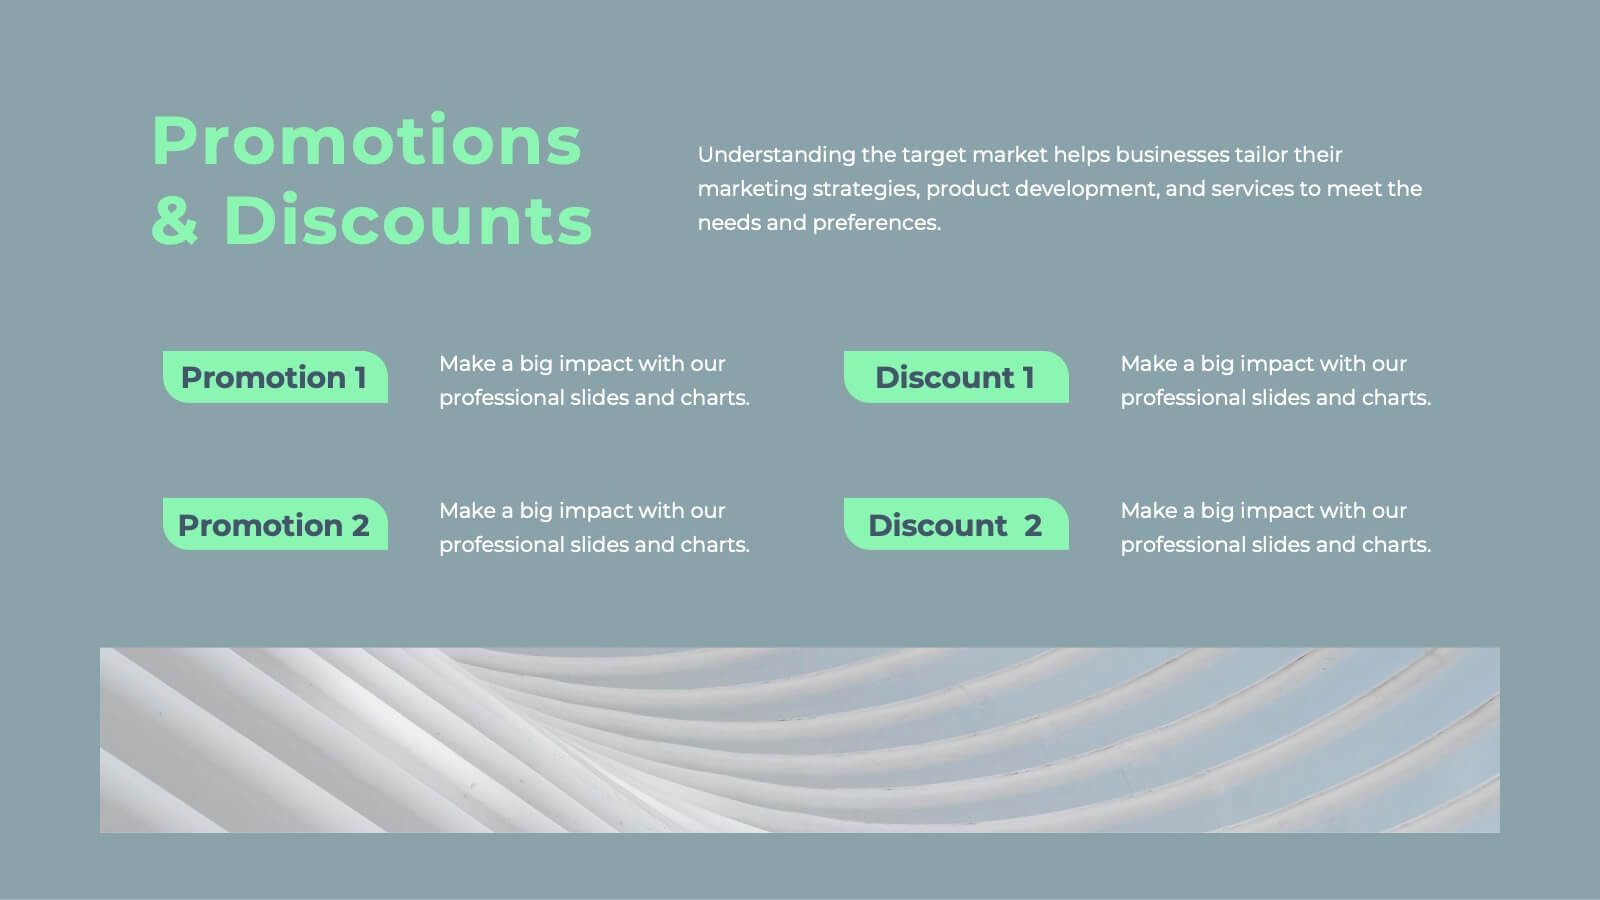
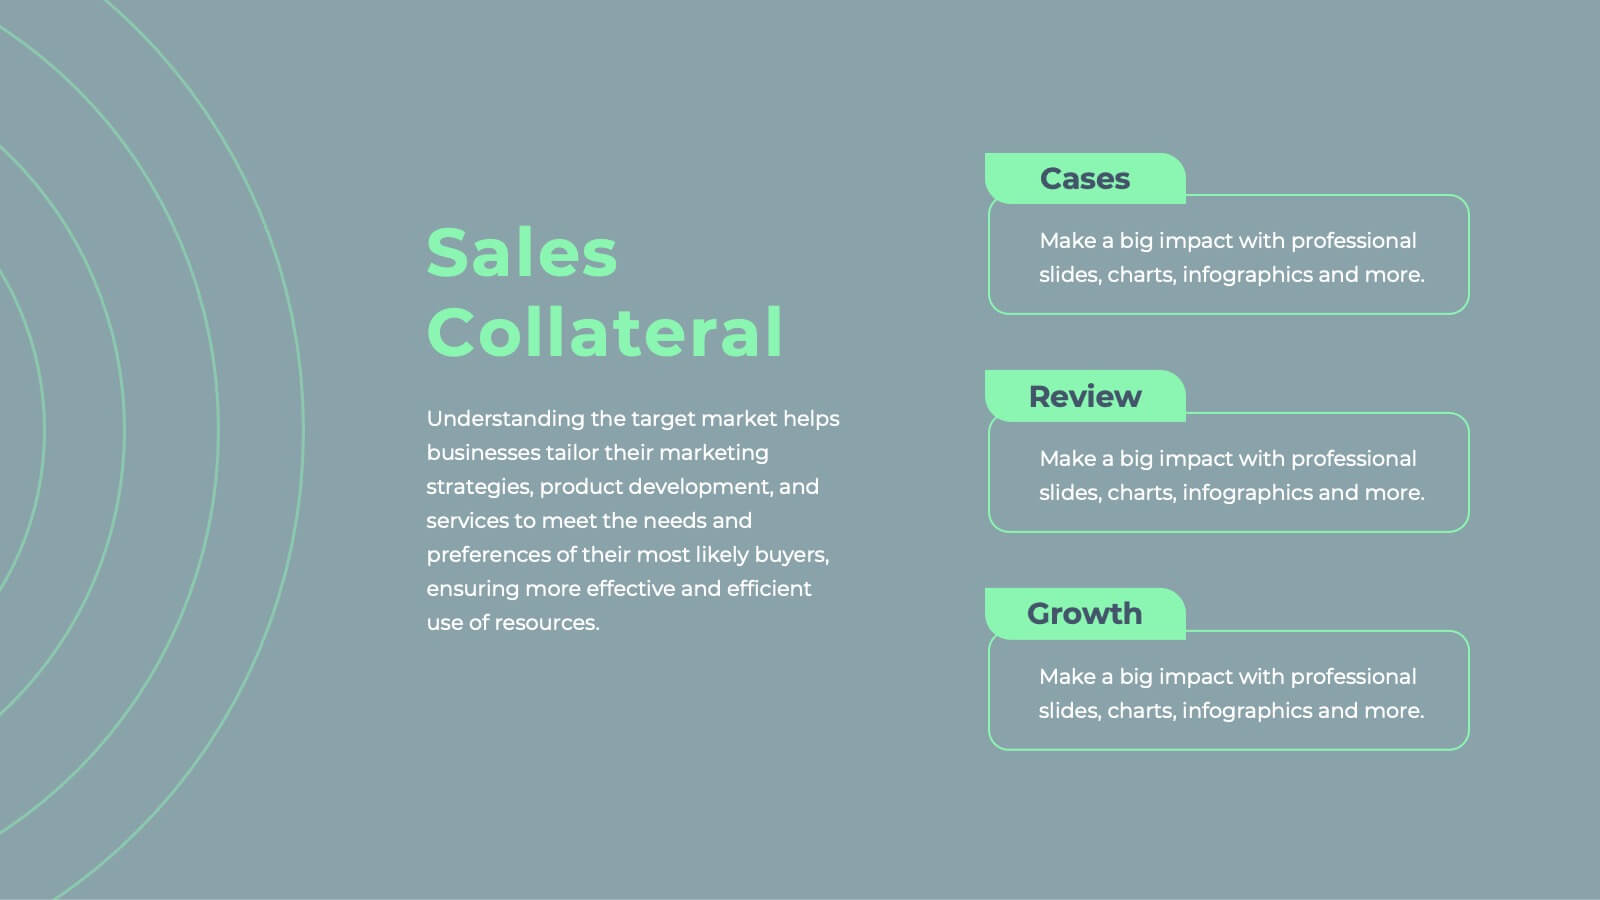
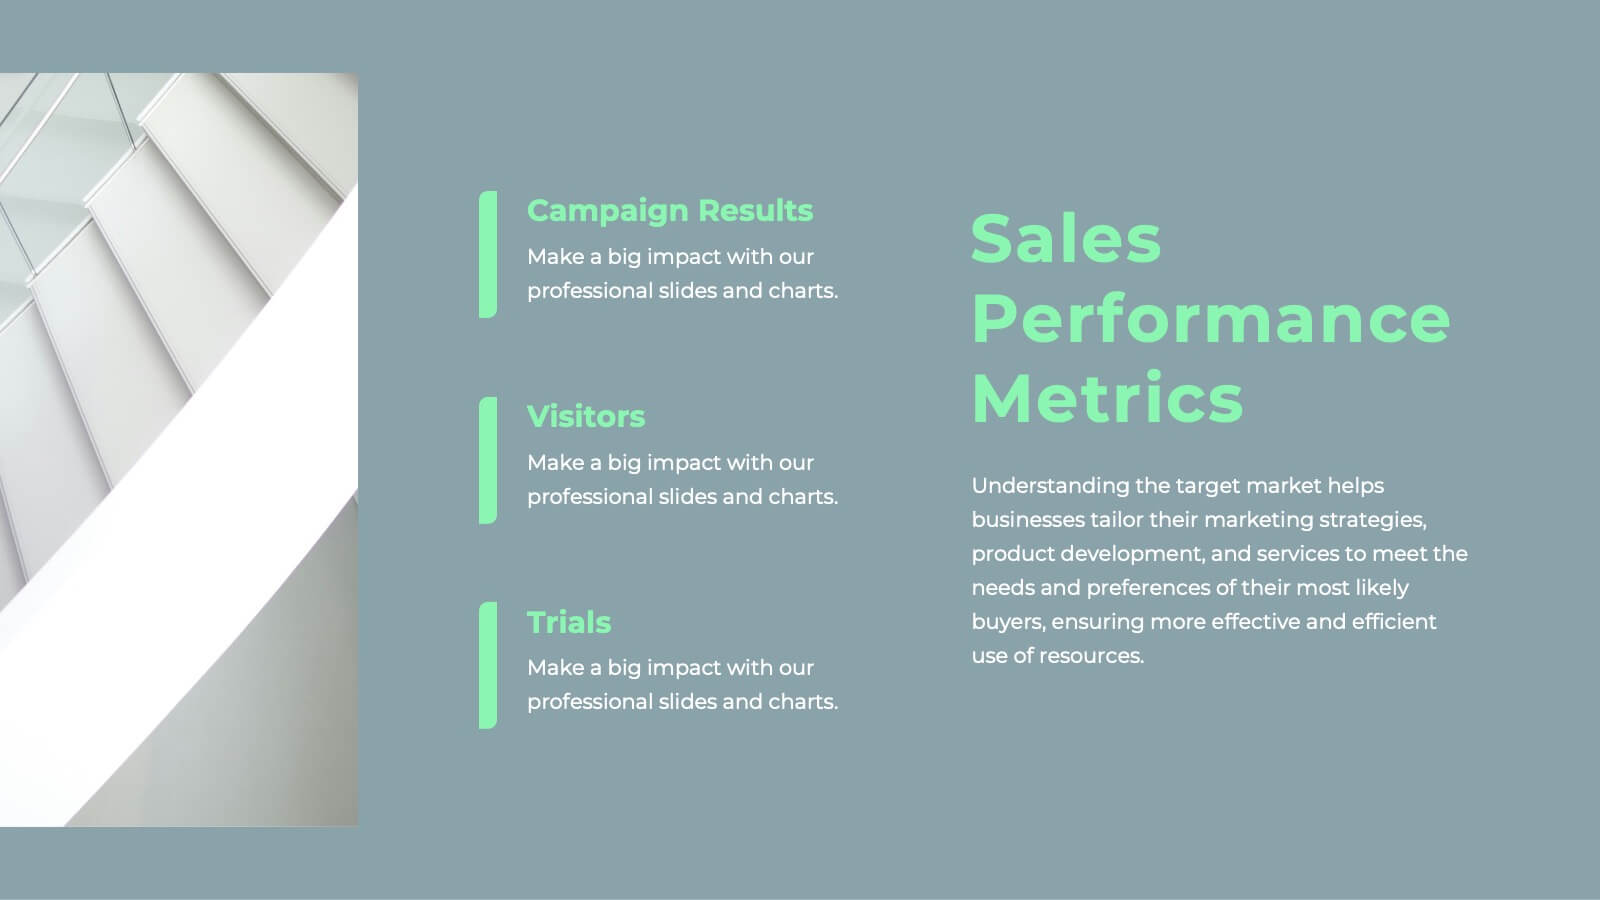
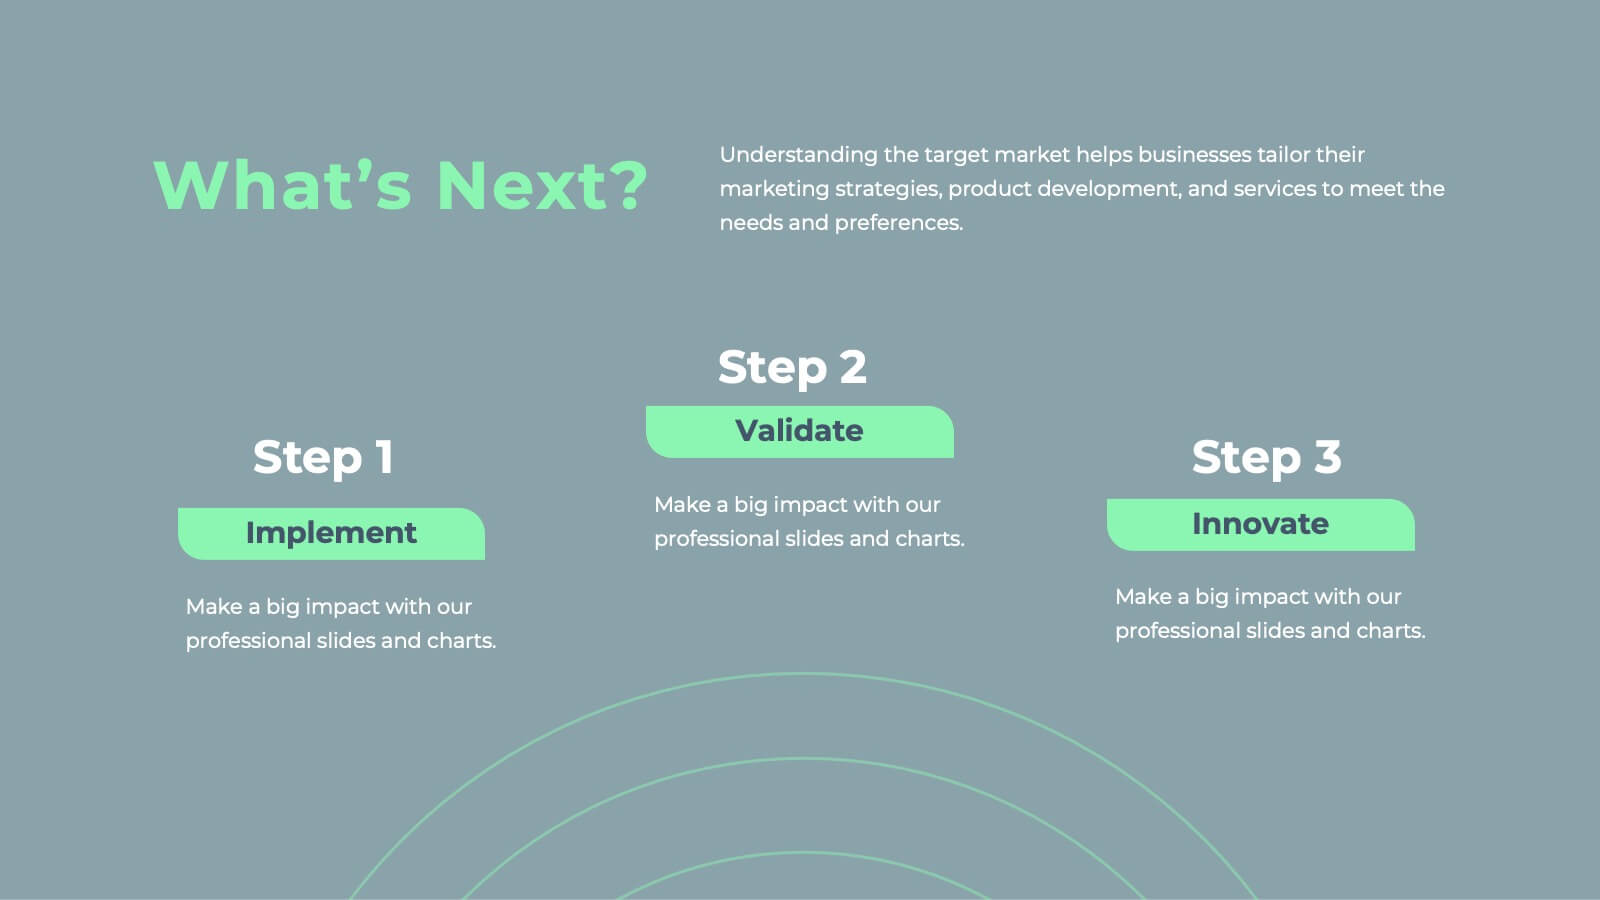
Javelin Sales Strategy Presentation
Boost your sales strategy with this sleek template! Perfect for outlining objectives, processes, performance metrics, and future opportunities. Tailored for impactful presentations to clients and teams. Fully customizable and compatible with PowerPoint, Keynote, and Google Slides.


5 slides
Digital Marketing Plan Presentation
Build momentum for your online strategy with a clean, structured layout that turns complex ideas into clear, stackable steps. This presentation helps outline goals, channels, and campaign actions in a visual flow that’s easy to follow and adapt. Fully customizable for PowerPoint, Keynote, and Google Slides.


5 slides
Benefits of Insurance Infographics
The purpose of insurance is to mitigate the financial impact of unexpected events or circumstances that may result in financial loss. These infographic templates are versatile and effective tools to convey the value of insurance to your audience. These are perfect to highlight the various advantages and importance of having insurance coverage. This serves as an engaging tool to educate and inform your audience about the benefits of different types of insurance policies. This makes it easy for viewers to understand the benefits and importance of insurance in various aspects of life. Compatible with Powerpoint, Keynote, and Google Slides.