


Features
- 4 Unique slides
- Fully editable and easy to edit in Microsoft Powerpoint, Keynote and Google Slides
- 16:9 widescreen layout
- Clean and professional designs
- Export to JPG, PDF or send by email


Do you have any questions?
Recommend


7 slides
Office Scenes Interview Infographic
Office Scenes refer to various activities, situations, or interactions that occur within a typical office environment. Embark on a visual journey through the dynamic world of interviews and office scenes with our office scenes interview infographic template. This visually appealing and informative template is tailored to give insights into the art of interviews, providing valuable tips and tricks for success within the corporate sphere. Compatible with Powerpoint, Keynote, and Google Slides. This template presents an enticing introduction to the world of interviews, setting the stage for a journey towards success and career growth.


7 slides
Artificial Intelligence Education Infographic Presentation
Artificial Intelligence is an important field of study and development that has the potential to revolutionize many aspects of modern life. A great way to display your ideas in a visual manner, this AI Infographic Template can be used by businesses and corporations who want to communicate their team vision in a clear and dynamic way. This template is completely editable, allowing you to customize it with your own information and photos. It includes icons and graphs to illustrate your points, as well as text boxes and slide titles. It is compatible with Powerpoint, Keynote and Google Slides.


5 slides
Cognitive Behavioral Therapy Overview Presentation
Help your audience connect the dots between thoughts, feelings, and behaviors with this clean, illustrated layout. Designed to simplify complex mental health concepts, this CBT infographic template is perfect for educators, coaches, or therapists. Fully editable and compatible with PowerPoint, Keynote, and Google Slides for effortless customization.

21 slides
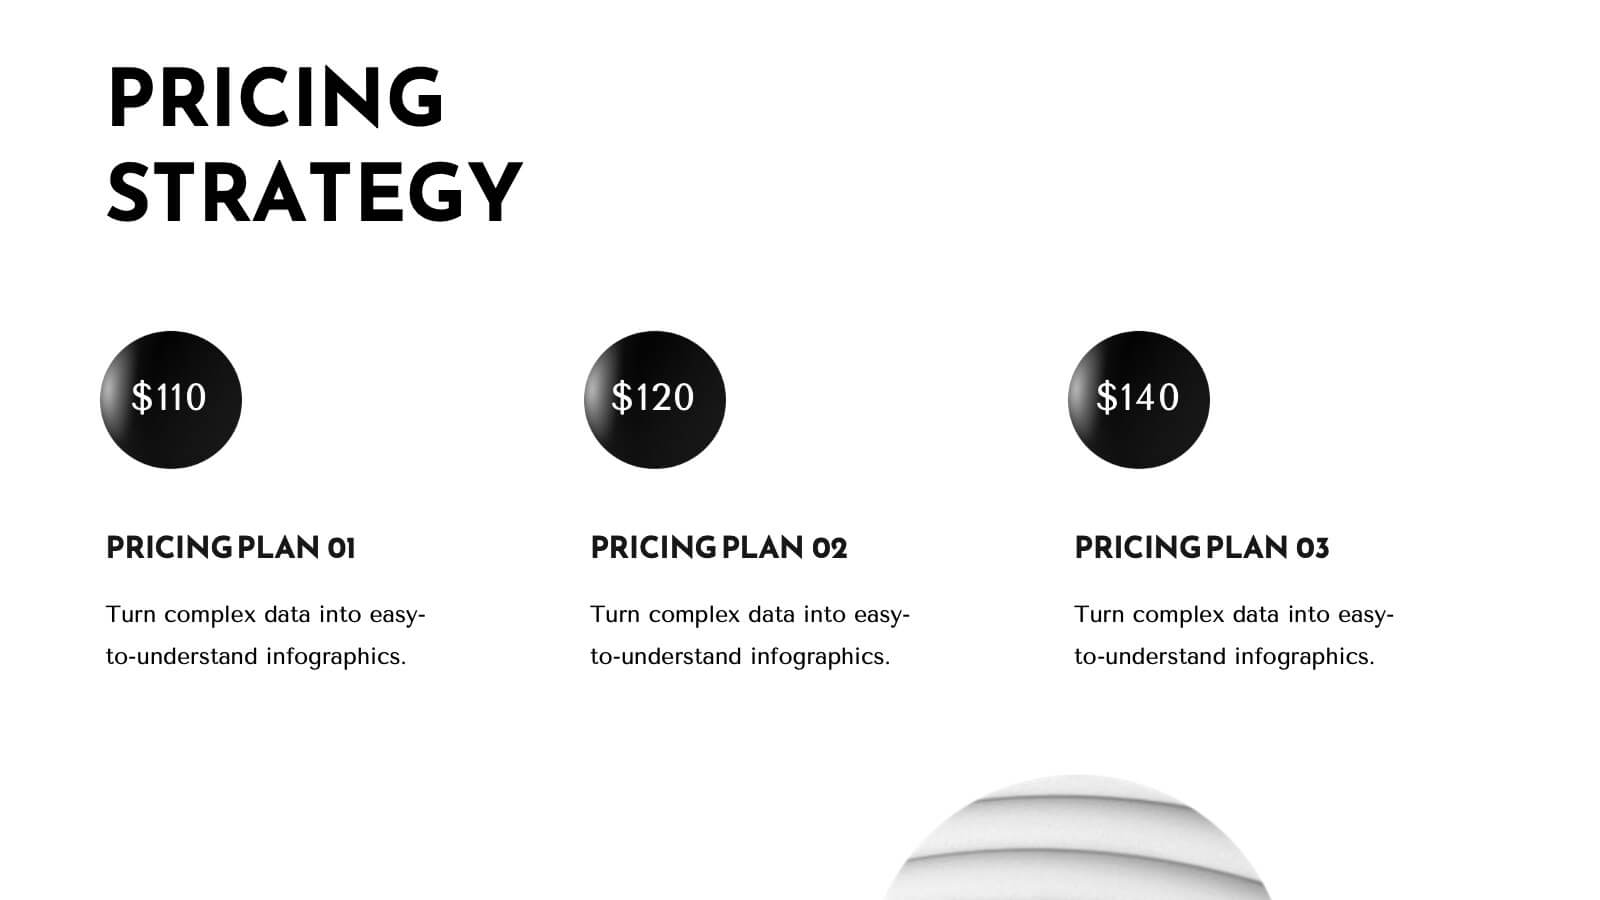
Trident Product Development Plan Presentation
Present your product development strategy with this sleek, professional template! Highlight company overview, product features, and unique selling proposition. Ideal for showcasing market analysis, pricing strategy, and production process. Perfect for developers and project managers. Compatible with PowerPoint, Keynote, and Google Slides.


12 slides
Real Estate House Market Trends Presentation
Analyze Real Estate House Market Trends with this insightful presentation template. Featuring a house-shaped hexagonal layout, this design helps illustrate key factors such as market demand, property values, investment opportunities, and housing policies. Ideal for real estate professionals, investors, and analysts looking to present market insights with clarity and impact. Fully customizable and compatible with PowerPoint, Keynote, and Google Slides.


7 slides
Pillar Points Infographic Presentation
A Pillar Infographic presents information on a specific topic or subject in a clear and organized manner. It consists of several sections or "pillars" that are interconnected and support the overall message of the infographic. In this template each pillar can be used to represent different aspects of the topic being discussed. Each section contains relevant data, statistics, and other information that illustrates the aspect. This can be used in marketing and advertising to promote products or services, as well as in education and journalism to explain complex ideas in a visually appealing way.


4 slides
Stakeholder Analysis Matrix Example Presentation
Make every relationship in your project strategy crystal clear with this smart and colorful matrix design. Perfect for mapping influence, interest, and engagement levels, it helps teams identify priorities and manage communication effectively. Fully editable and compatible with PowerPoint, Keynote, and Google Slides for seamless customization.


7 slides
Customer Question for Support Infographic
Step into the spotlight with our vibrant Infographic Template, where every inquiry is a star! Designed to dazzle, this template offers a show-stopping way to address customer queries with flair and precision. Imagine vibrant backdrops and playful fonts that turn ordinary support interactions into captivating visual stories.Tailor-made for businesses eager to shine in customer service, this template transforms FAQs into eye-popping, memorable visuals. Whether it’s tech glitches, product how-tos, or service details, your answers will not only be seen—they’ll be remembered. Customize to fit your brand’s personality, deploying colors and styles that resonate with your audience.Ideal for help centers, product support pages, or digital kiosks, it makes customer support not just helpful, but spectacularly engaging. Ready for use with popular graphic design tools, it’s your backstage pass to standing ovations in customer care.


4 slides
Business Framework Strategies Presentation
Bring your ideas to life with a smooth, flowing sequence that makes complex strategies feel simple and intuitive. This presentation guides audiences through each stage of your business framework with clear visuals and focused messaging, helping you communicate structure, goals, and direction effortlessly. Fully compatible with PowerPoint, Keynote, and Google Slides.


26 slides
Entrepreneurship in the Digital Age Presentation Template
Navigate the evolving world of business with this modern and engaging presentation template focused on entrepreneurship in the digital age. Featuring sleek layouts, dynamic infographics, and data-driven visuals, this template is perfect for exploring digital strategies, startup growth, and innovation trends. Whether you're presenting business plans, sharing insights on market dynamics, or showcasing case studies, each slide is fully customizable to suit your needs. The professional yet creative design ensures your message stands out, inspiring your audience to embrace the opportunities of the digital era. Fully compatible with PowerPoint, Keynote, and Google Slides, this template is an essential tool for impactful and compelling presentations.


5 slides
Benefits of Recycling Infographics
Recycling offers numerous benefits for the environment, society, and the economy. These vertical infographics highlights the numerous advantages of recycling for both the environment and society. This infographic serves as an educational tool to raise awareness about the positive impact of recycling on our planet and encourages individuals and businesses to participate in recycling efforts. The infographics are divided into clear and distinct sections, each focusing on a specific benefit of recycling. These sections are designed with vibrant colors and appealing visuals to capture the audience's attention.


5 slides
AIDA Marketing Funnel Presentation
The "AIDA Marketing Funnel Presentation" template is expertly designed to streamline the visualization of the AIDA model, which stands for Attention, Interest, Desire, and Action. This template aids marketers in presenting and analyzing the effectiveness of marketing strategies to capture the consumer's journey from awareness to the final action of purchasing. Each stage of the funnel is clearly defined and color-coded, making it simple to insert specific strategies or results that relate to each step of the consumer engagement process. Ideal for marketing presentations, this template helps in explaining complex concepts in a digestible format, ensuring that the audience can easily follow along and understand key marketing tactics and outcomes.


4 slides
Minimal Title Page Variations Presentation
Highlight key ideas with style using the Minimal Title Page Variations Presentation. These clean and colorful layouts feature bold numbers, pastel text boxes, and abstract 3D artwork to instantly draw attention. Perfect for agendas, summaries, or content previews. Includes multiple layout options and is fully editable in PowerPoint, Keynote, and Google Slides.


22 slides
Muse UX Case Study Presentation
Deliver compelling UX case studies with a sleek presentation template designed to highlight your design journey and results. Ideal for showcasing your user-centered approach, it includes dedicated slides for project overview, user research, personas, journey mapping, wireframes, prototyping, and user testing. Clearly communicate your design principles and decision-making processes with visual design elements and brand guidelines. With specific sections for feedback, accessibility considerations, and project outcomes, this template ensures every aspect of your UX process is captured in a structured and visually engaging manner. Whether you're presenting to clients, stakeholders, or design teams, this template is fully editable and compatible with PowerPoint, Google Slides, and Keynote. Its modern design and professional layout provide an effortless way to convey the value of your UX work, making a lasting impact on your audience. Tailor it to your brand, and elevate your case studies today!


12 slides
Customer Satisfaction Smile Rating Presentation
Measure customer happiness with this engaging customer satisfaction smile rating template! Featuring a visual scale from dissatisfaction to delight, this design helps businesses track feedback and identify improvement areas. Ideal for reports, surveys, and performance reviews. Fully customizable and compatible with PowerPoint, Keynote, and Google Slides.


6 slides
Community Network Infographic
A community network is a localized, often root-driven, communication infrastructure that connects individuals, organizations, and institutions within a specific geographical area or community. This Infographic template visually represents the connections, relationships, and interactions within a community, often focusing on its members, resources, and activities. This template is a powerful way to showcase the dynamics and vitality of a community. This highlights the central theme or purpose of the community at the center of the infographic. This is fully customizable and compatible with Powerpoint, Keynote, and Google Slides.


5 slides
Human Resource Functions Infographics
Illuminate the complexities of people management with our human resource functions infographics template. Cast in the professional yet warm palette of black, orange, pink, and red, this template is an essential tool for HR professionals, corporate trainers, and business leaders. It elegantly dissects various HR realms with its sleek graphics, intuitive icons, and dedicated image placeholders, making it perfect for showcasing recruitment processes, employee engagement strategies, or organizational culture principles. Its creative, vertical style is designed to hold the attention and fuel the imagination, turning any HR presentation into a compelling narrative.