


Features
- 5 Unique slides
- Fully editable and easy to edit in Microsoft Powerpoint, Keynote and Google Slides
- 16:9 widescreen layout
- Clean and professional designs
- Export to JPG, PDF or send by email


Do you have any questions?
Recommend


23 slides
Glimmer Sales Pitch Deck Presentation
Get ready to wow investors with this dynamic pitch deck! Perfect for startups and entrepreneurs, it covers company overview, market opportunity, revenue models, and more. Designed to highlight your business potential and secure funding. Compatible with PowerPoint, Keynote, and Google Slides, it’s your ultimate tool for impactful presentations.


4 slides
Environmental Sustainability Best Practices Presentation
Promote eco-friendly initiatives with the Environmental Sustainability Best Practices Presentation template. This clean and modern slide deck is designed to highlight sustainable business strategies, green initiatives, and environmental impact assessments. Featuring an intuitive layout with clearly defined sections, this fully editable design is ideal for corporate sustainability leaders, educators, and environmental advocates. Compatible with PowerPoint, Keynote, and Google Slides for seamless customization and presentation.


8 slides
3-Layered Circular Logic Presentation
Visualize layered processes with this 3-step circular logic diagram. Perfect for illustrating progressive systems, tiered strategies, or interrelated components. Each ring represents a distinct phase, complete with editable icons and text. Compatible with PowerPoint, Keynote, and Google Slides—ideal for business models, strategic frameworks, or simplified logic breakdowns.


4 slides
Strategic Business Plan Presentation
Bring your long-term vision to life with a clean, modern presentation that turns complex planning into an easy-to-follow growth path. This layout helps you explain goals, strategies, and key steps with clarity and confidence. Fully editable and compatible with PowerPoint, Keynote, and Google Slides.


4 slides
USA, Canada & Mexico Business Reach Presentation
Showcase your regional presence with the USA, Canada & Mexico Business Reach Presentation. This slide helps you pinpoint key business activities or initiatives across North America using colorful map markers and customizable icons. Ideal for market updates or growth plans. Fully editable in Canva, PowerPoint, and Google Slides.


4 slides
Step-by-Step Company Workflow Map Presentation
Visually track business processes with this step-by-step workflow map. Each stage is illustrated as a vertical bar, representing progression and task hierarchy. Ideal for project managers, operations teams, and onboarding sessions. Fully editable in PowerPoint, Keynote, and Google Slides for quick customization of labels, icons, and stage descriptions to fit your goals.


6 slides
Five Key Pillars of Organizational Strength Presentation
Highlight the foundational strengths of your business with the Five Key Pillars of Organizational Strength presentation. This visual framework uses classical column structures to represent five core principles, ideal for showcasing leadership values, corporate strategy, operational focus, or departmental roles. Each pillar is clearly labeled and customizable, making it easy to align with your organization’s unique message. Fully editable in PowerPoint, Keynote, and Google Slides, this template is perfect for board meetings, company culture decks, or executive planning sessions.
21 slides
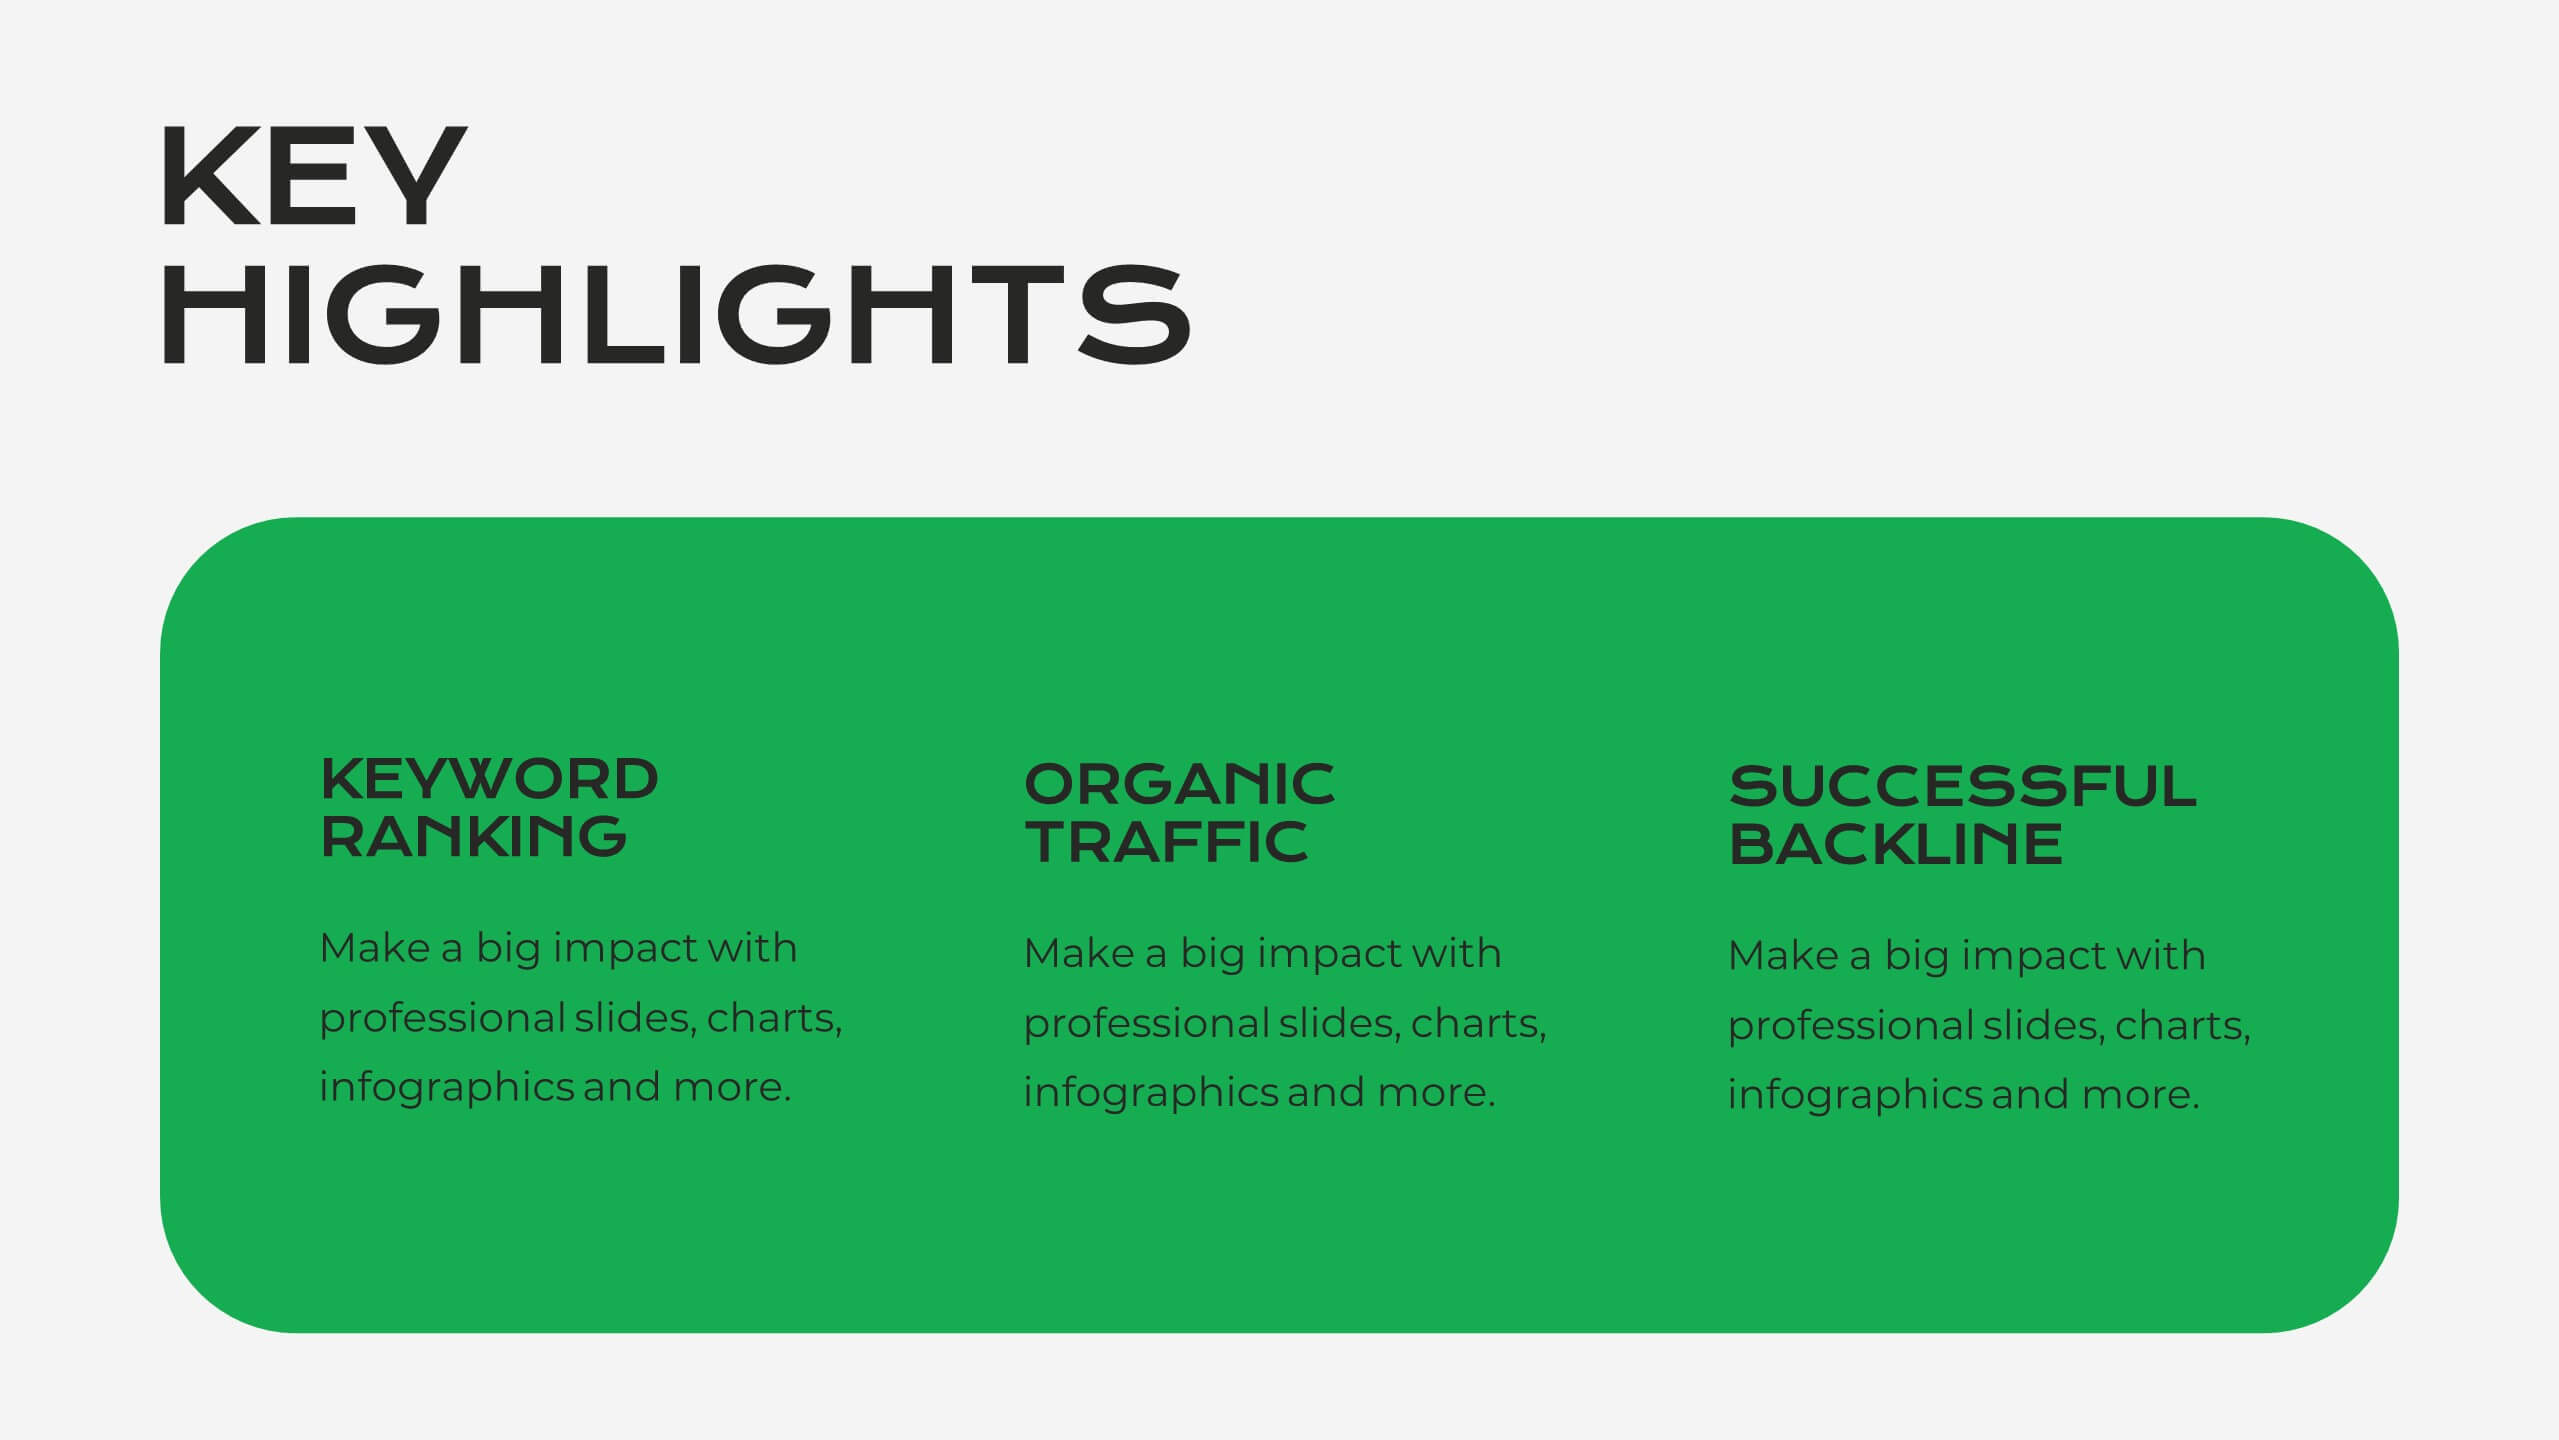
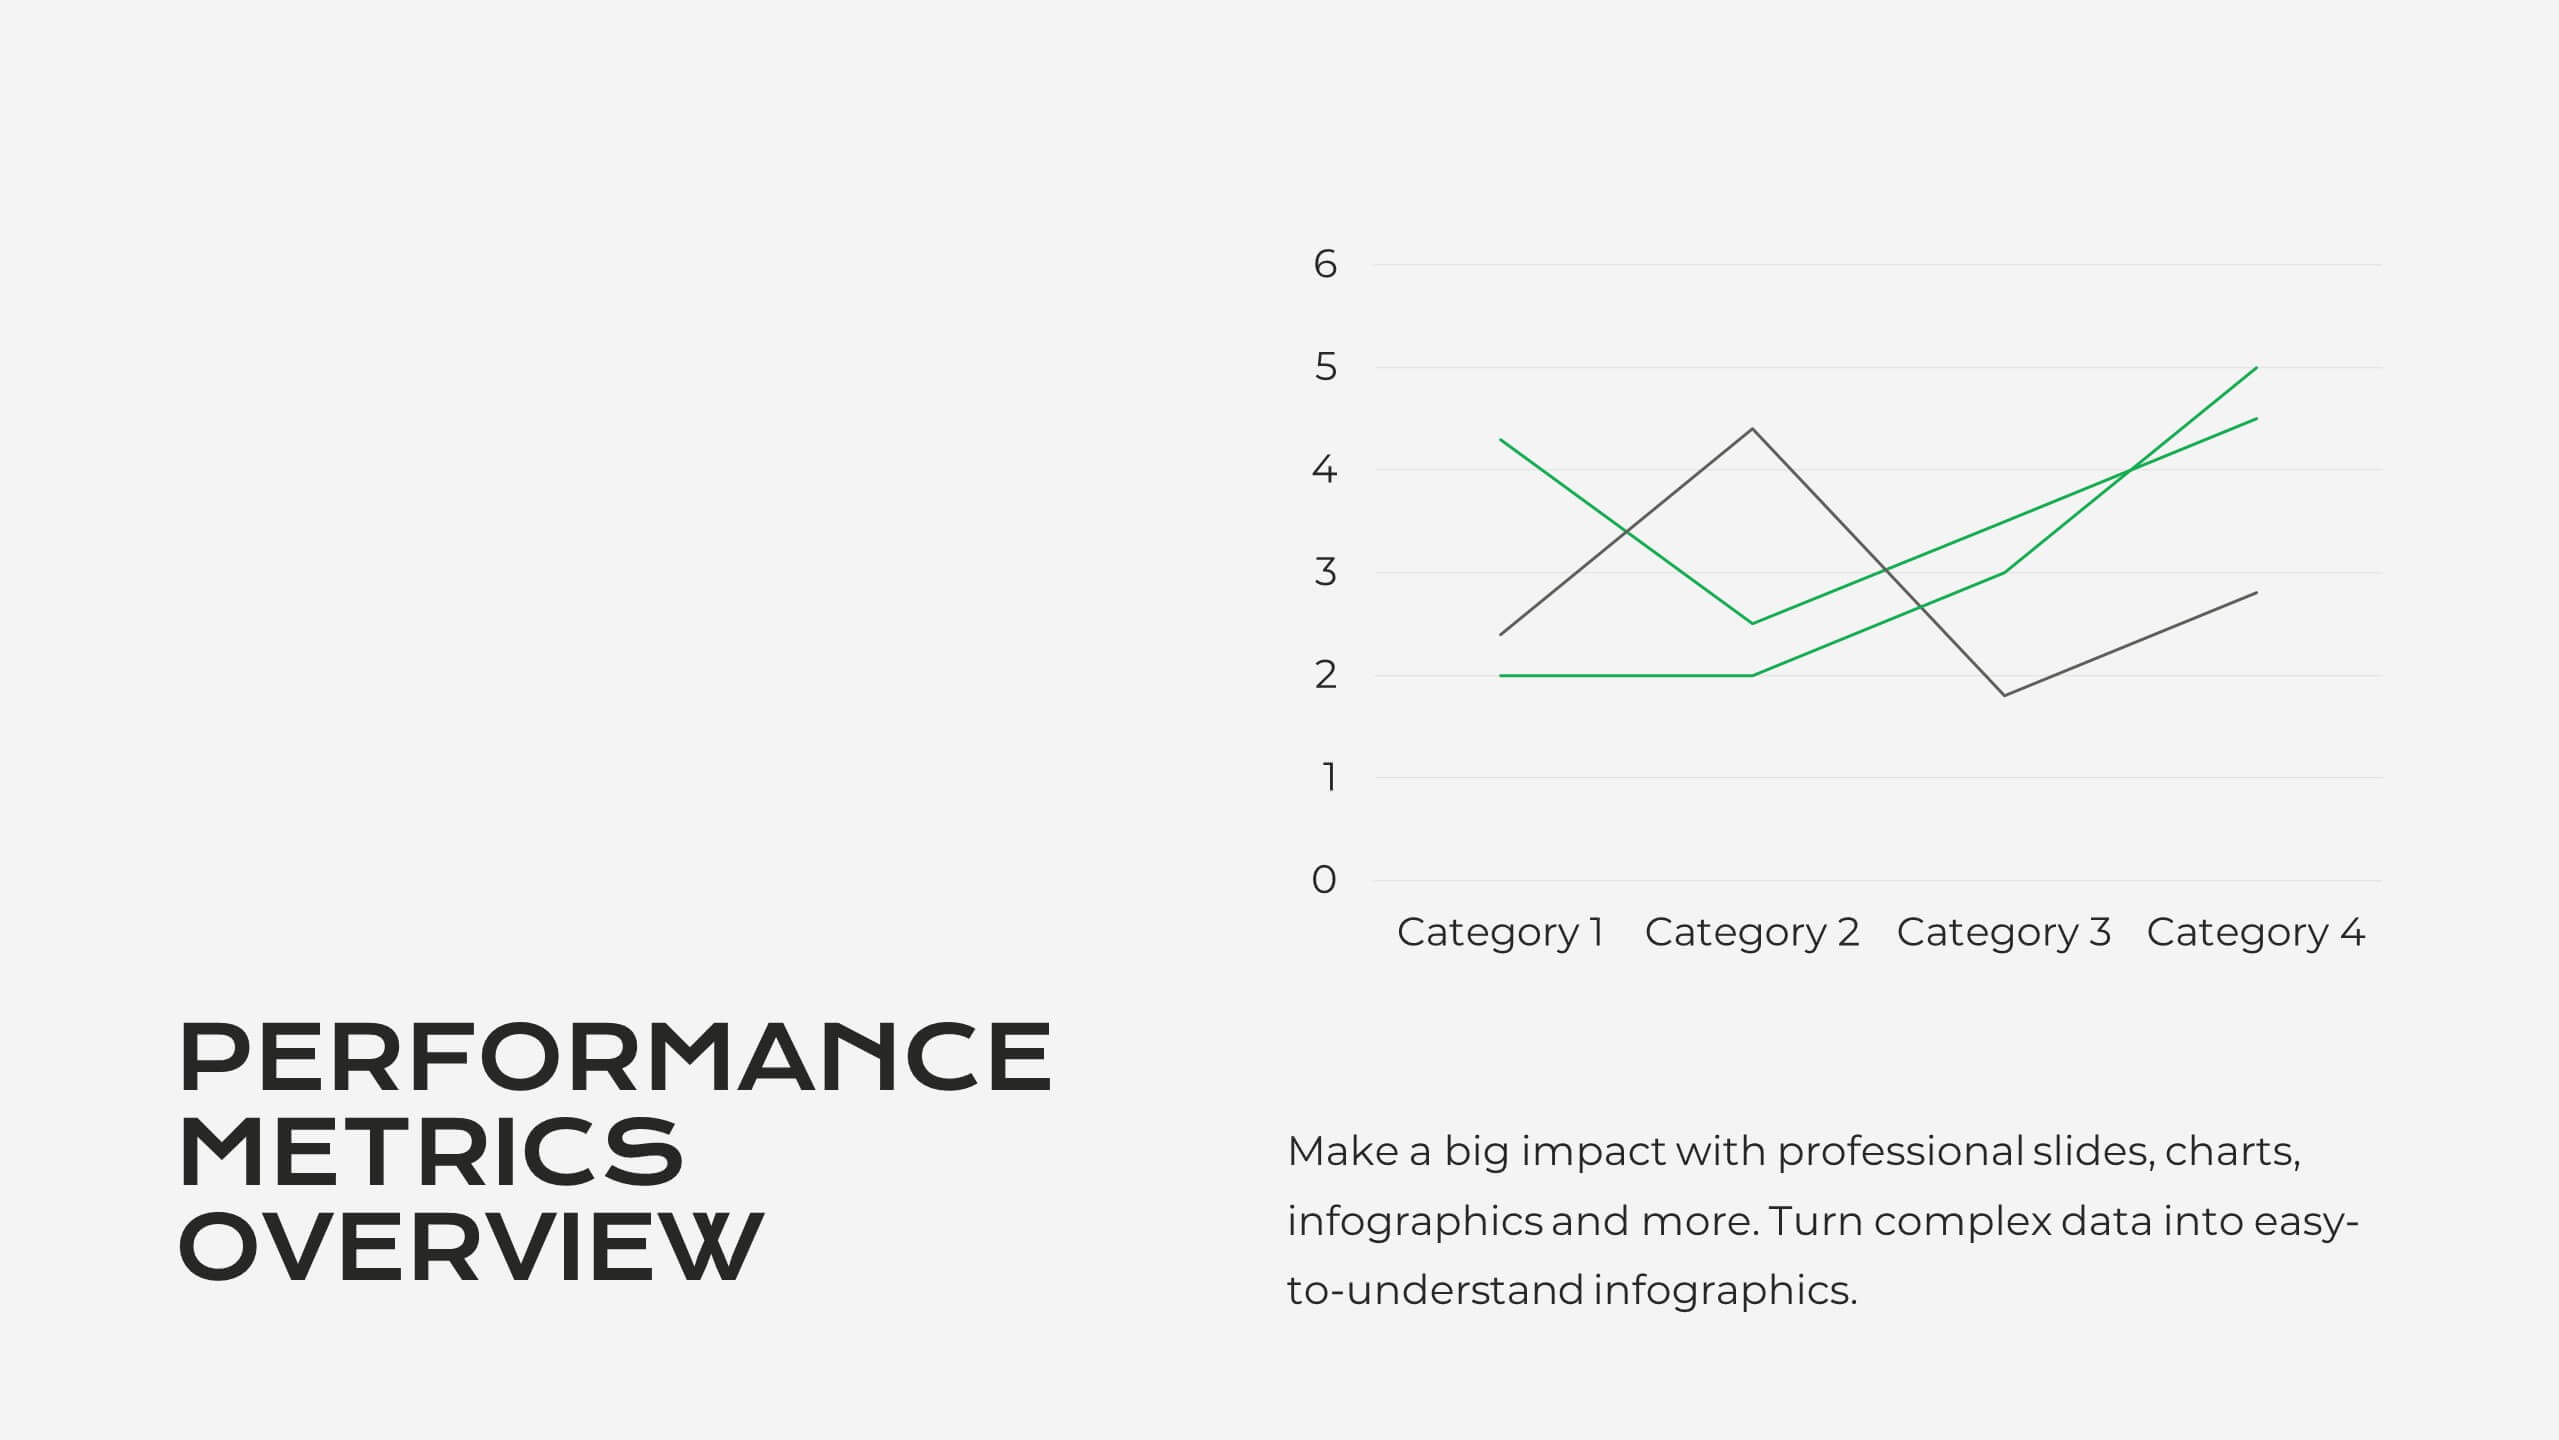
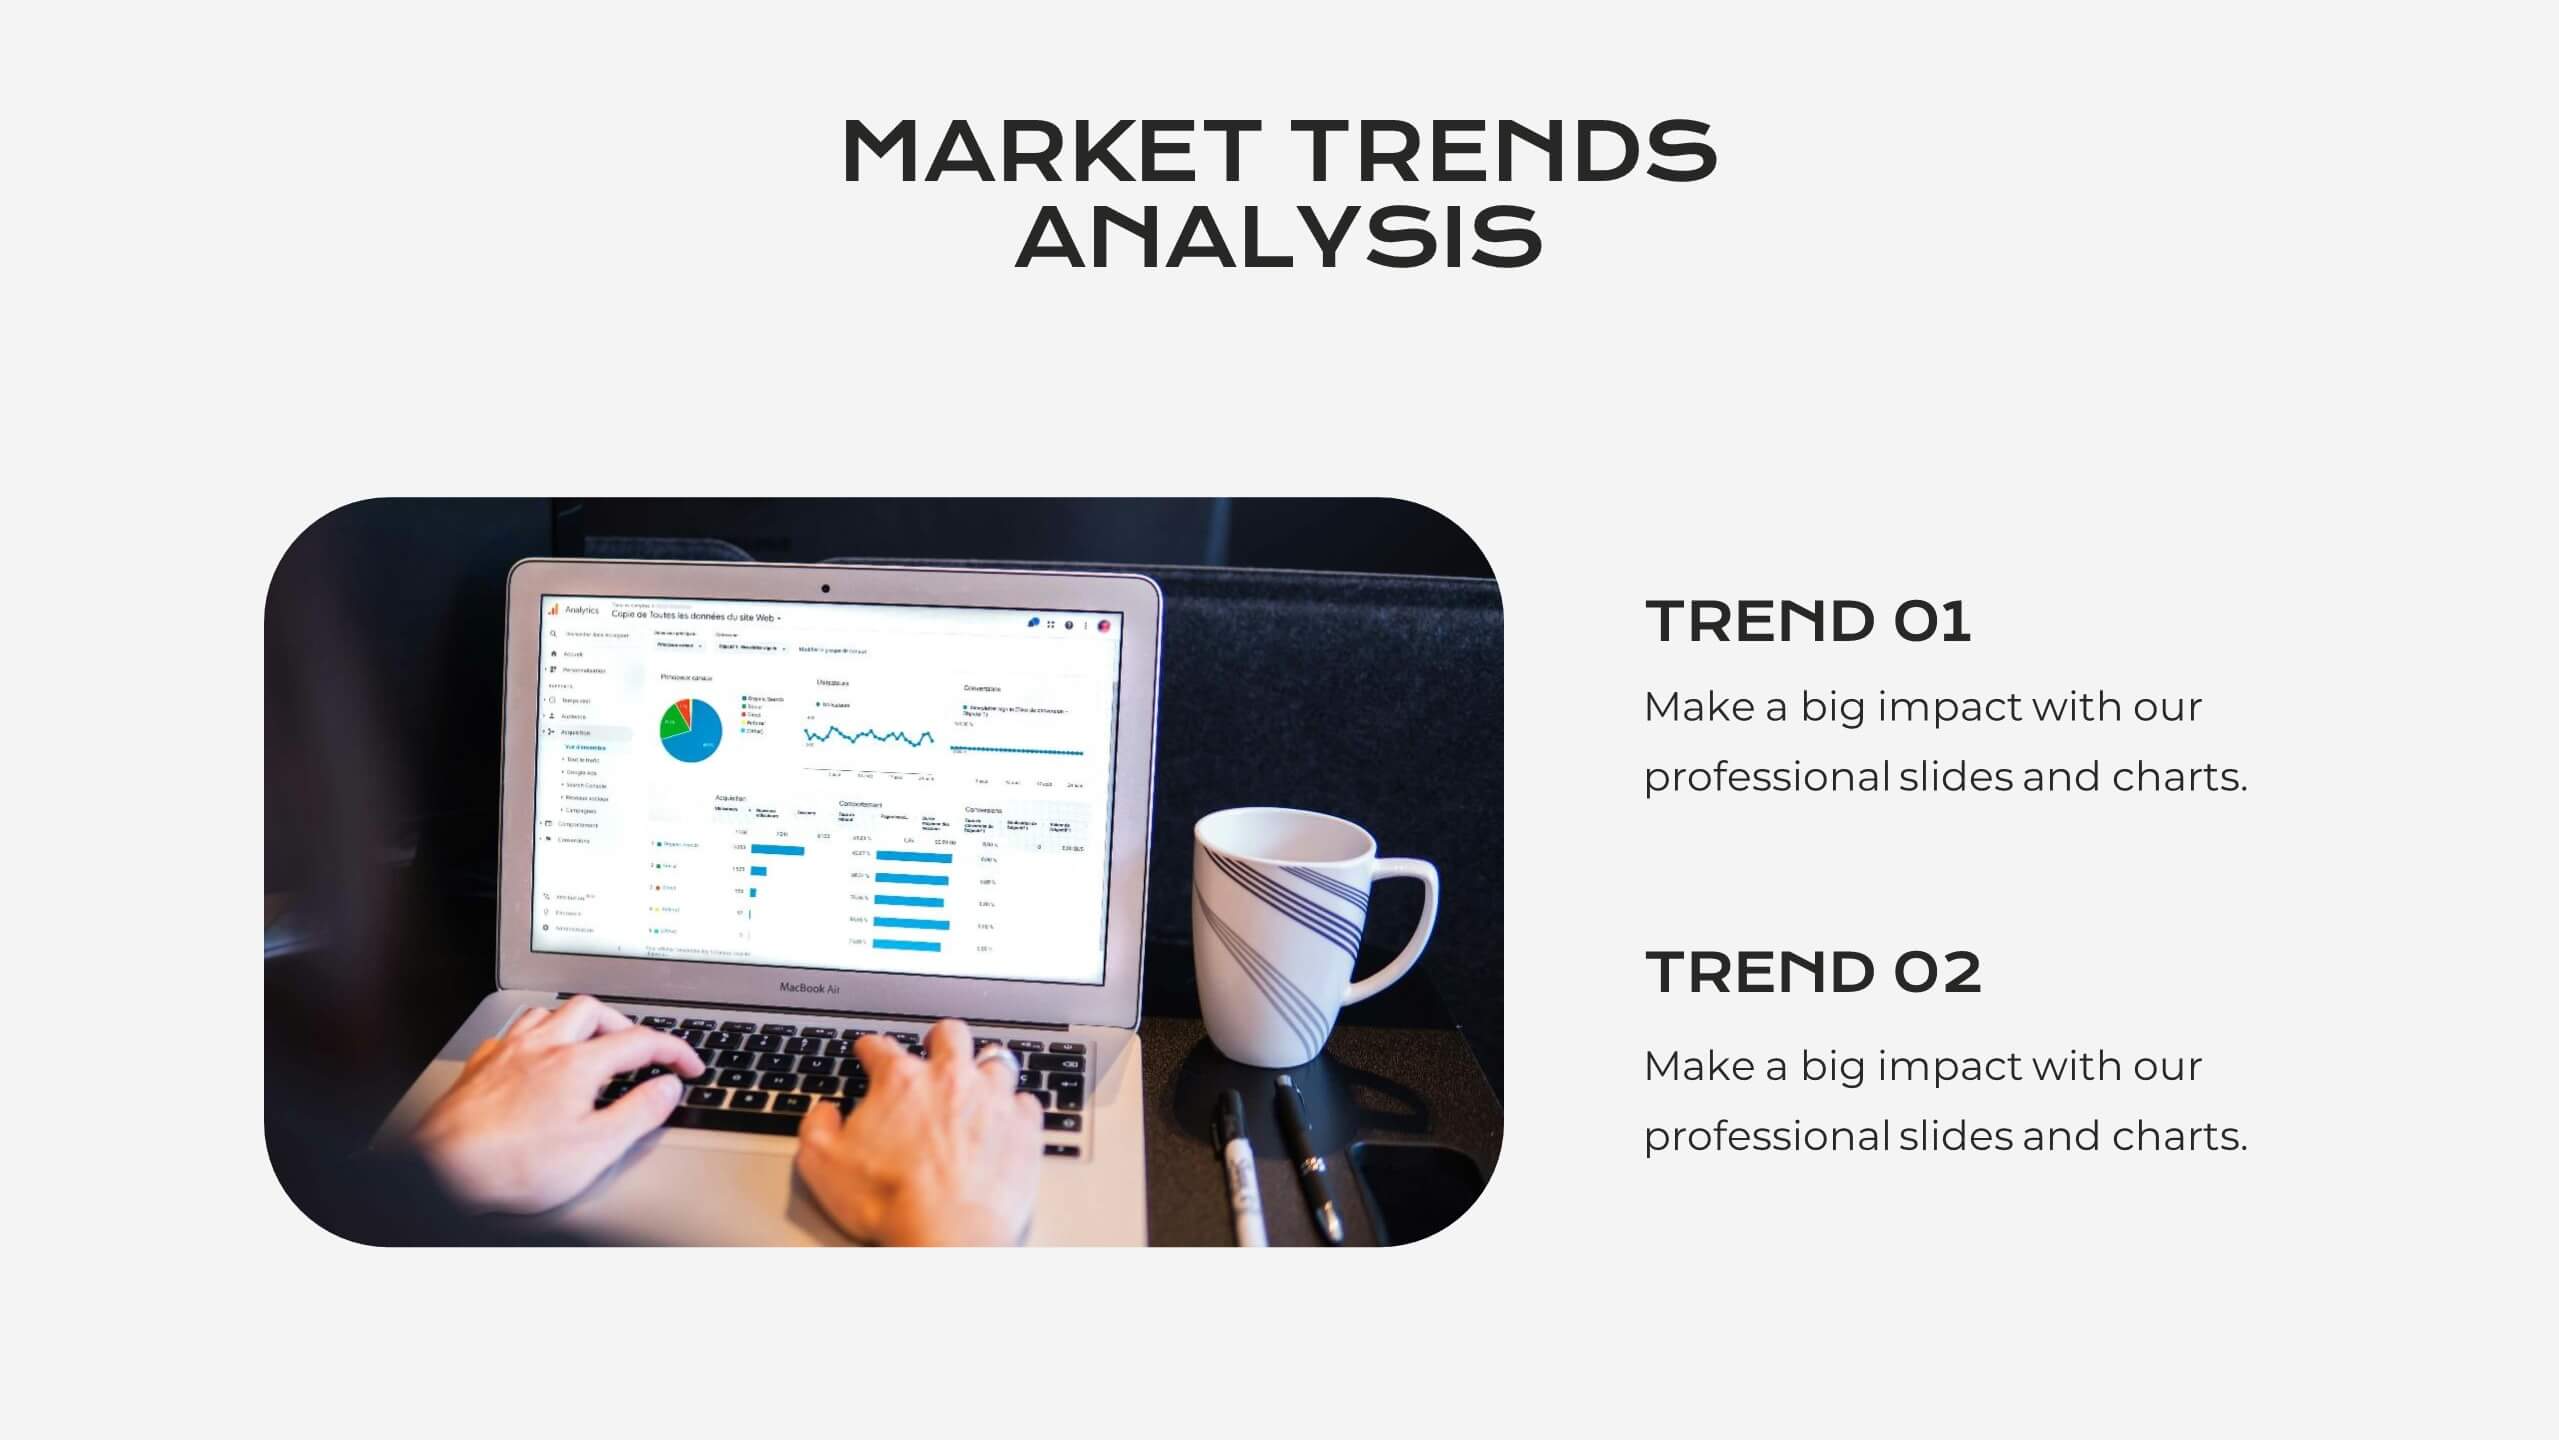
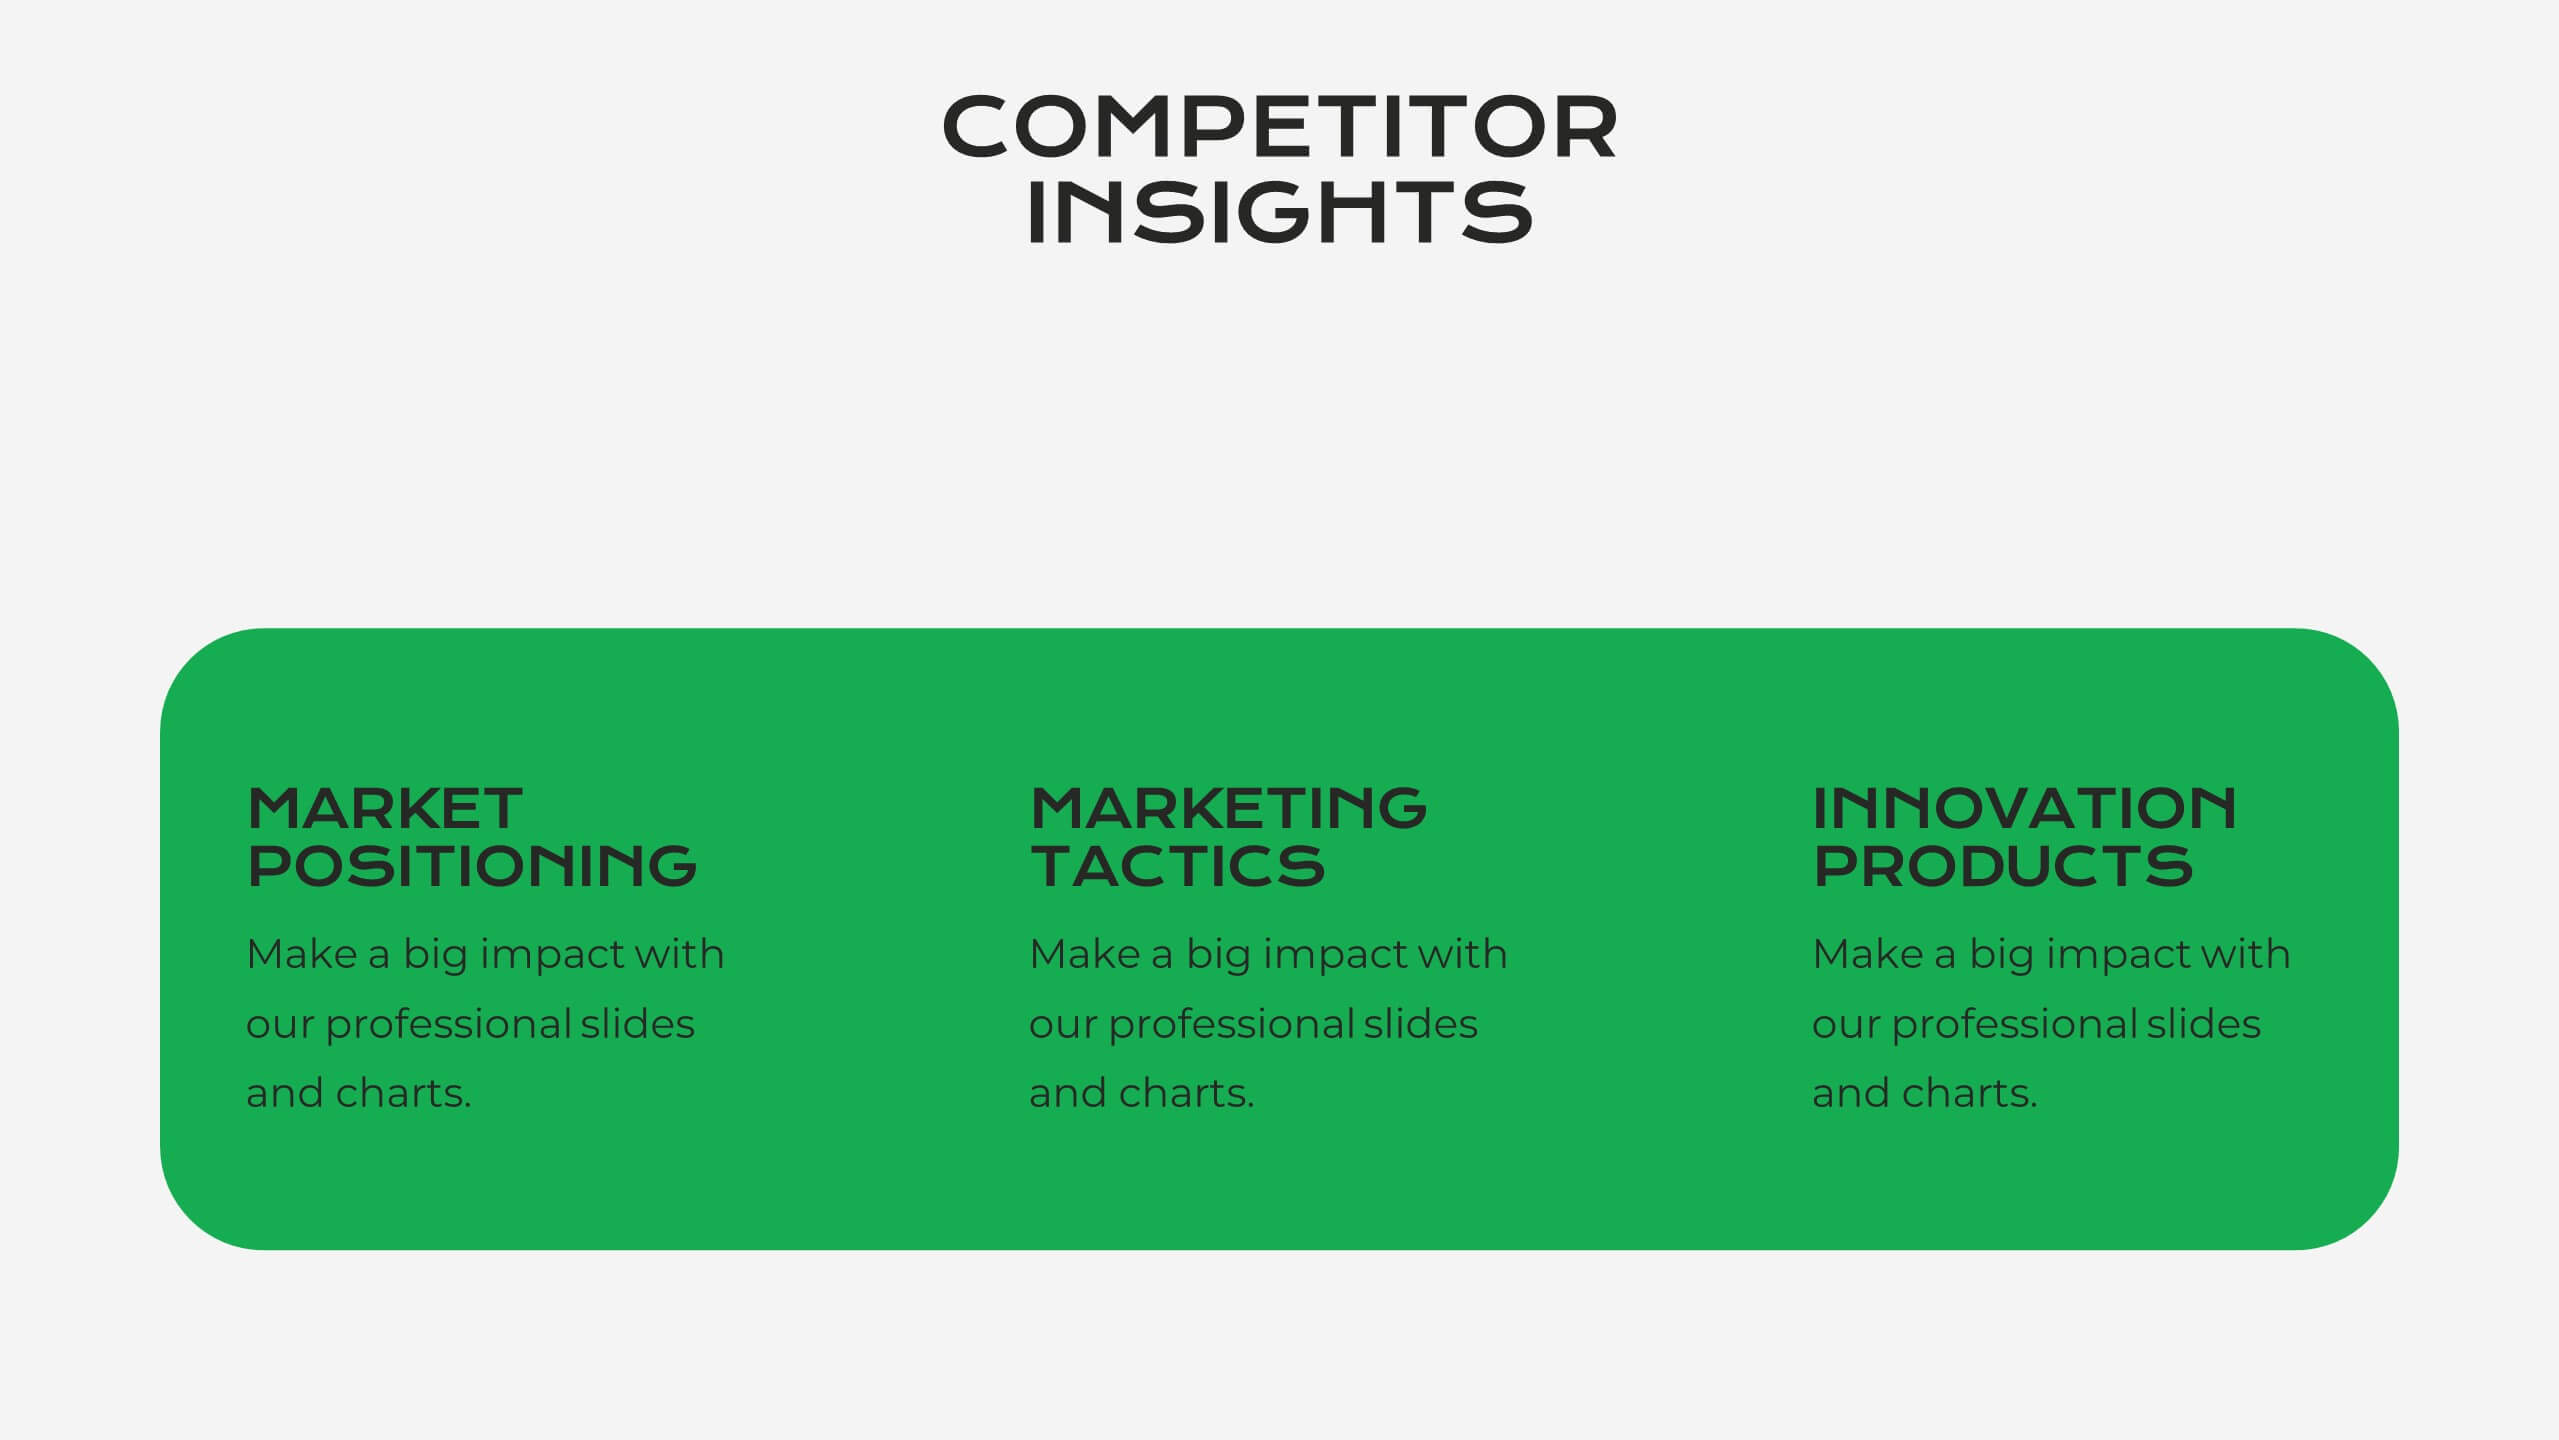
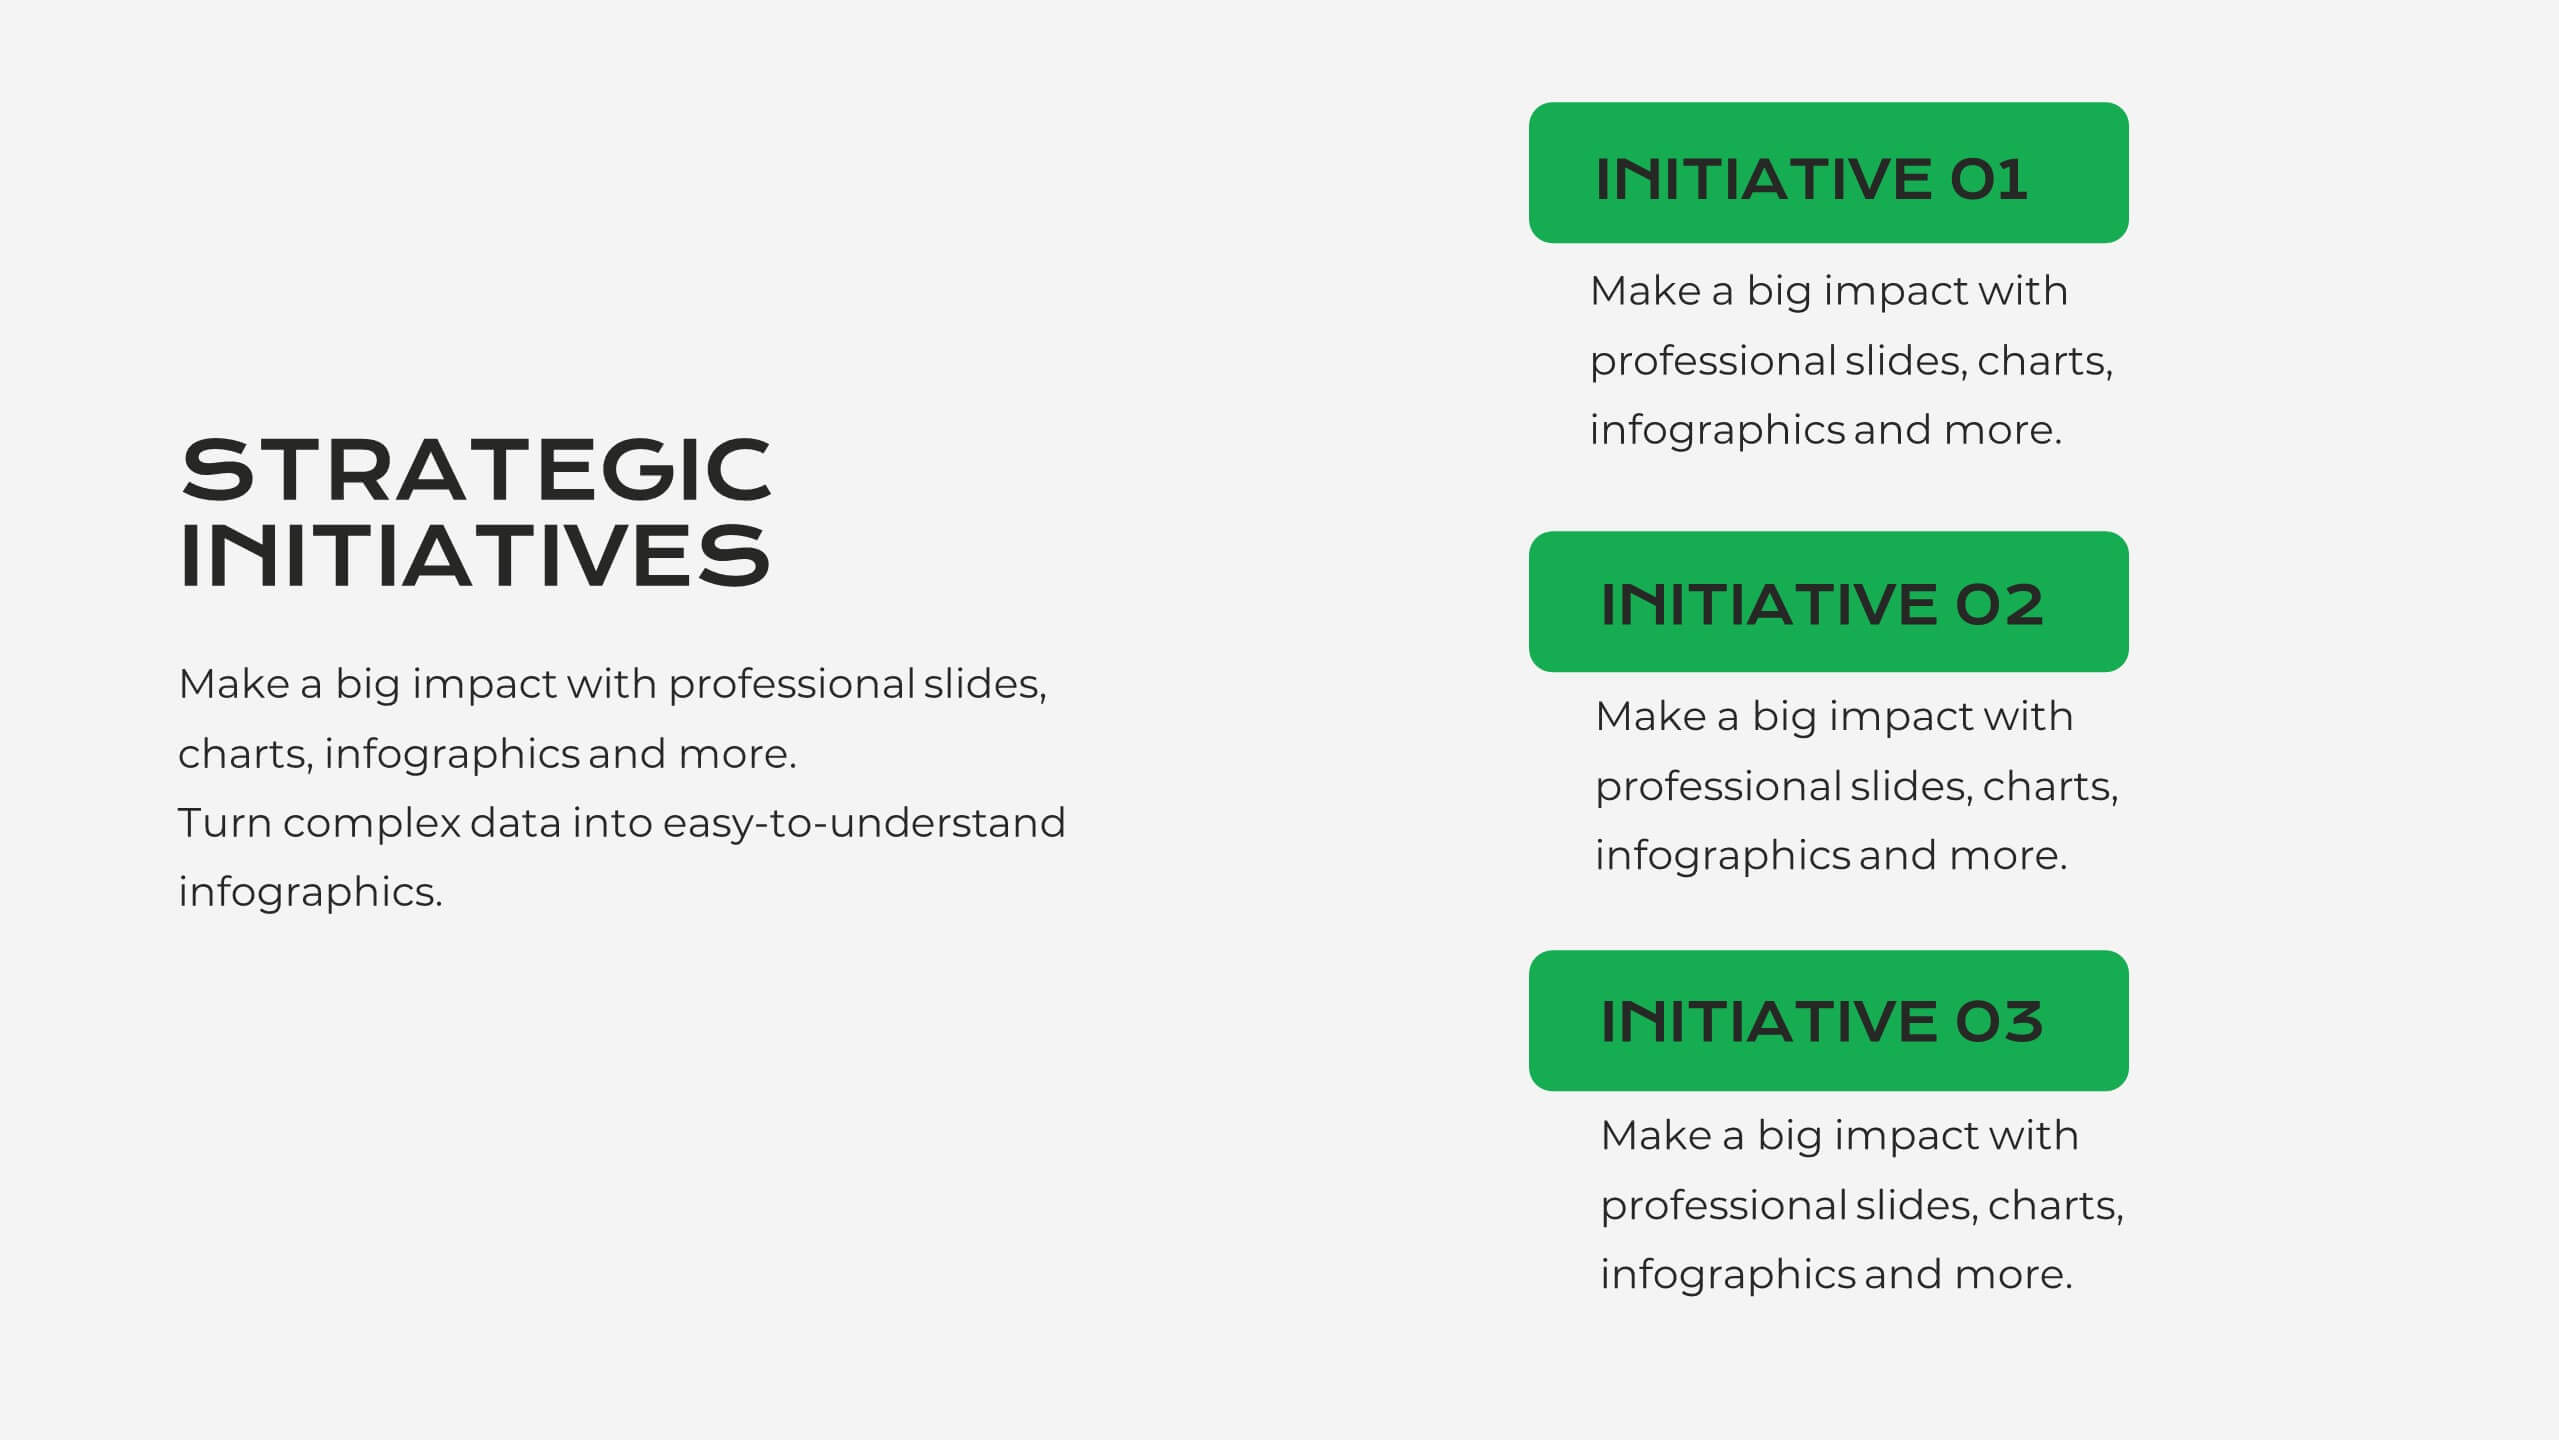
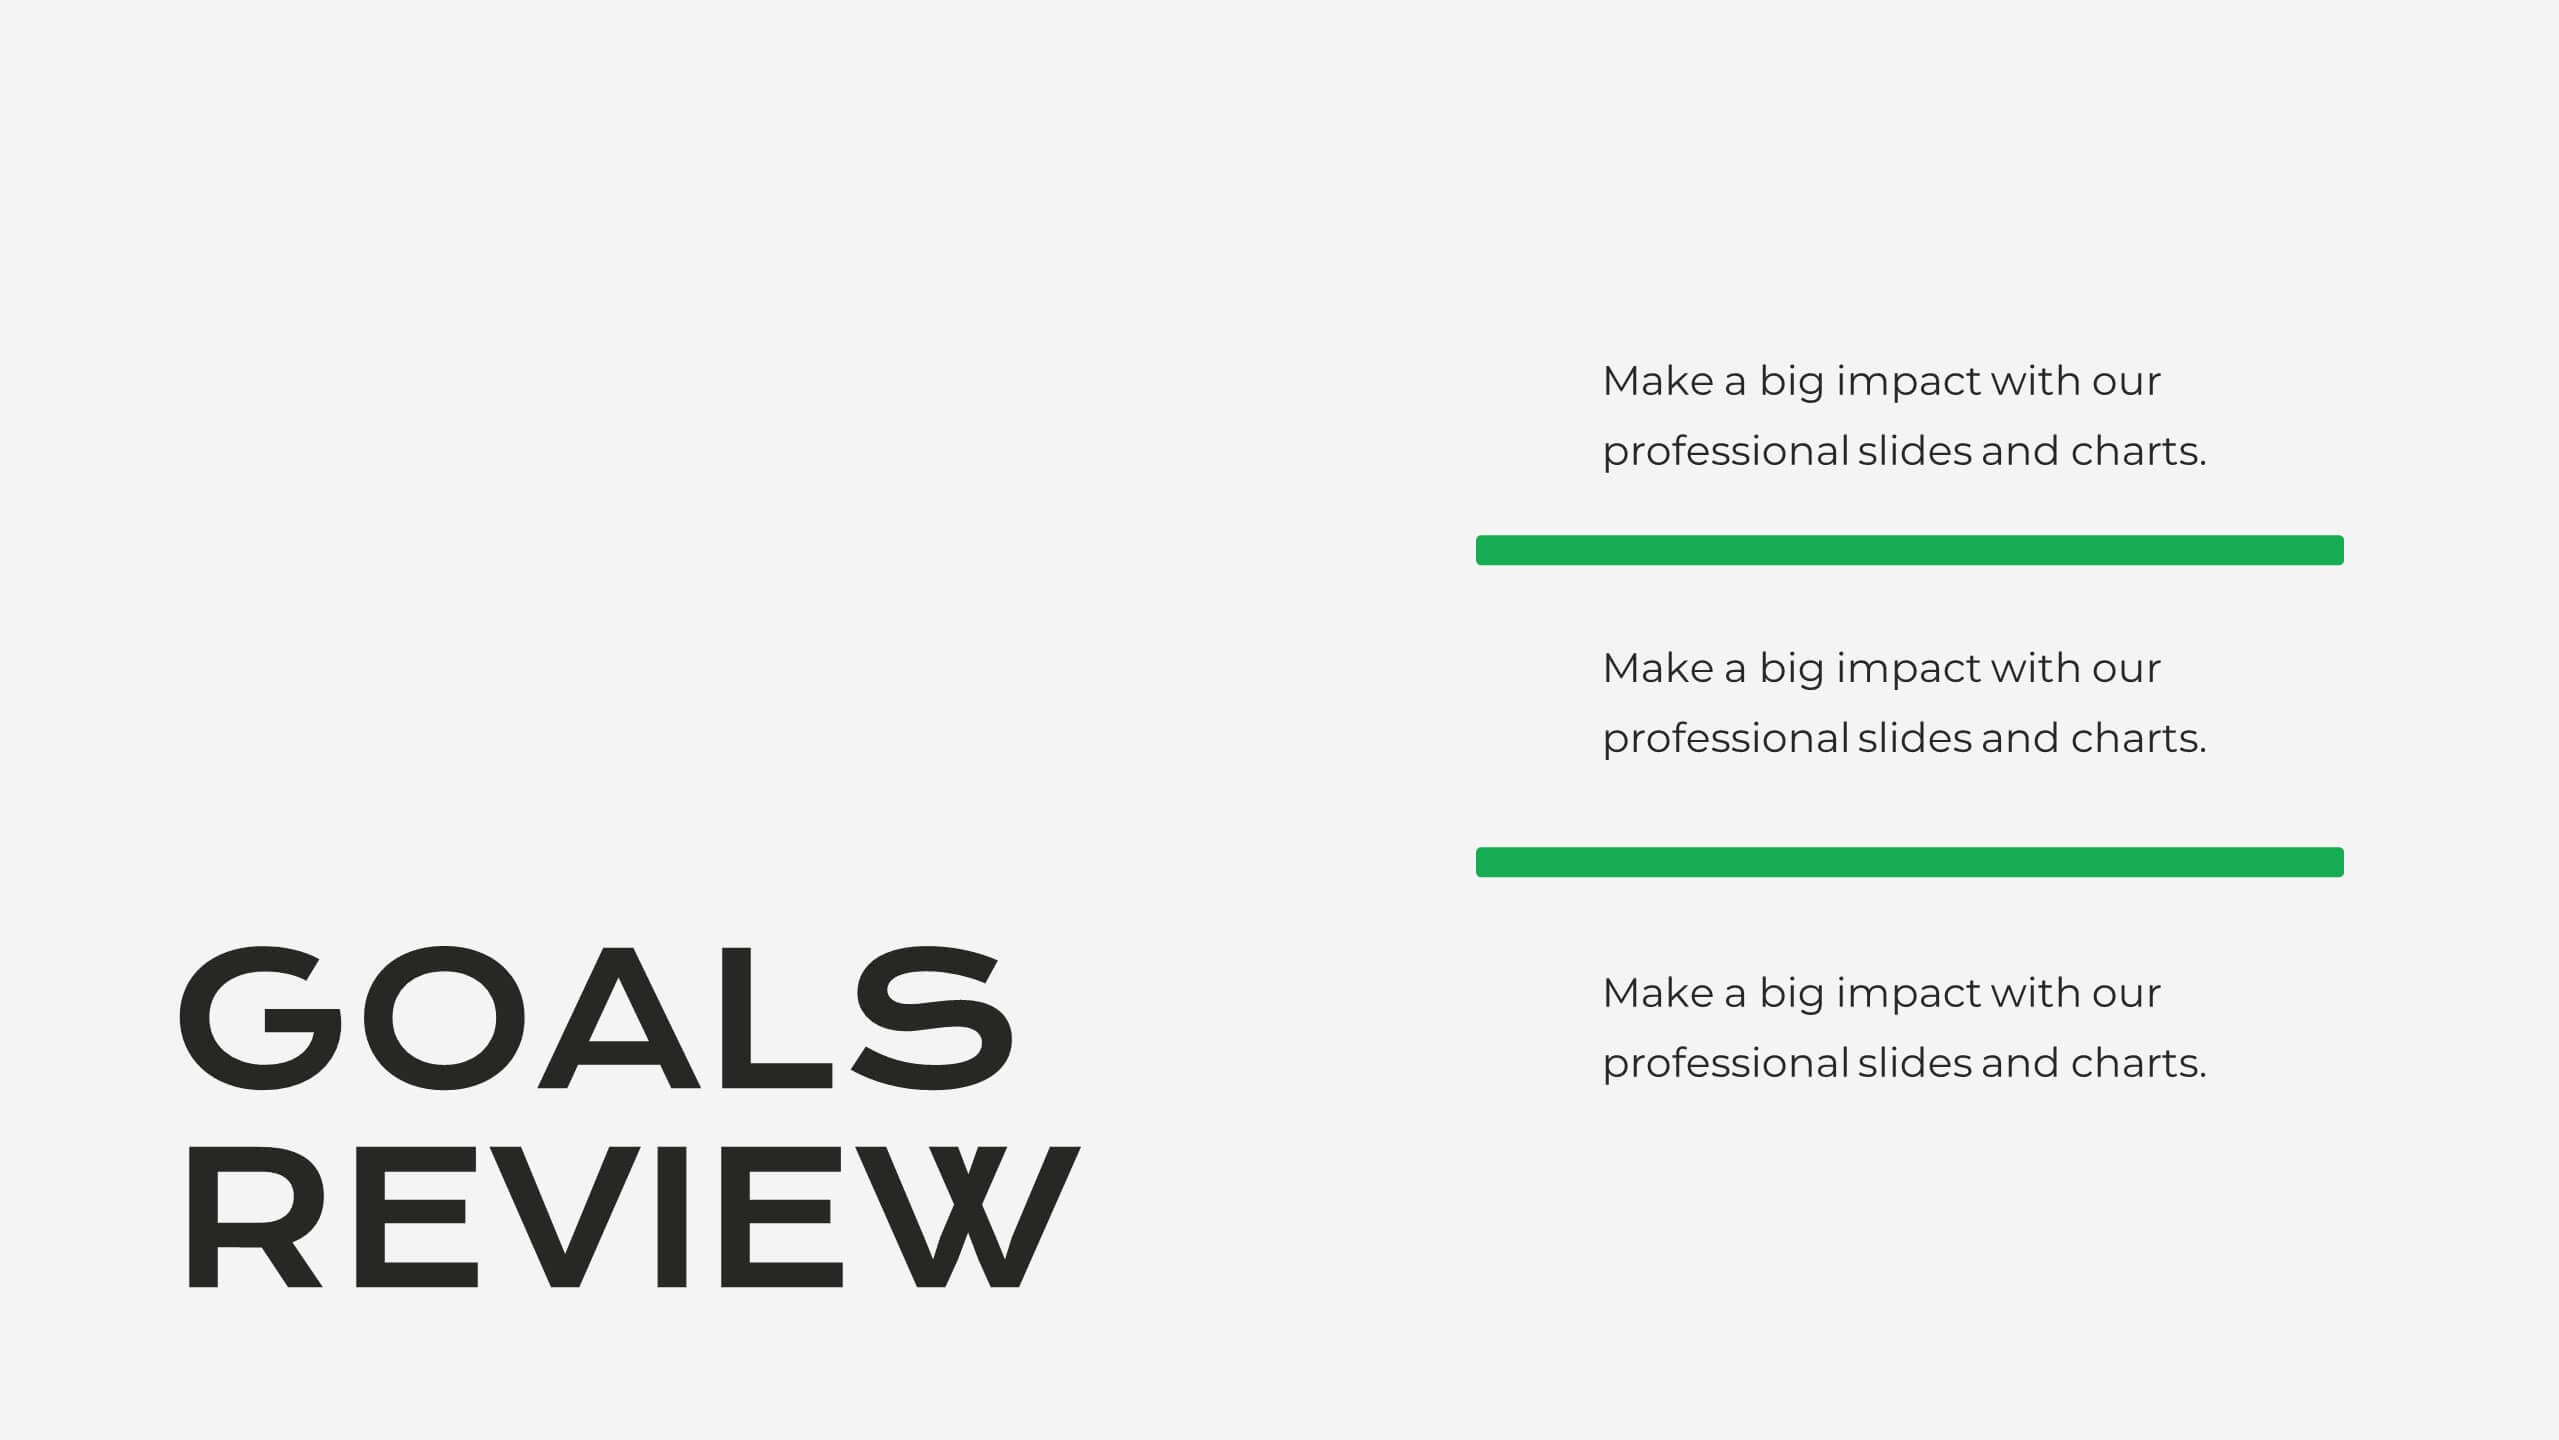
Serene Market Analysis Report Presentation
This modern and clean Market Analysis Report template is designed to help you present key data and insights with clarity and impact. Ideal for business professionals and analysts, it includes slides for key highlights, performance metrics, financial summaries, competitor insights, and strategic initiatives. The template's sleek layout ensures that your data is easy to understand and visually appealing, making it perfect for internal reports or client presentations. Customize it effortlessly in PowerPoint, Keynote, or Google Slides, and impress your audience with a polished and professional report.


6 slides
Social Media Metrics Dashboard Presentation
Bring your analytics to life with a bold, visual dashboard that makes social performance easy to understand at a glance. This presentation helps you showcase engagement, growth, and platform insights with clean charts and organized data sections. Fully editable and compatible with PowerPoint, Keynote, and Google Slides.


10 slides
Concept Mapping with Bubble Map
Break down complex ideas into visual clusters with this hexagon-style concept mapping template. Designed to organize information into thematic groups, it's ideal for brainstorming, mind mapping, or presenting strategies and workflows. Each section uses color-coded bubble maps for easy navigation. Fully editable in PowerPoint, Keynote, and Google Slides.


5 slides
Product Development Empathy Mapping
Bridge the gap between user insight and product success. This empathy mapping slide is perfect for product development teams to capture what users see, hear, think, feel, and experience—along with their pains and gains. Fully customizable and compatible with PowerPoint, Keynote, and Google Slides.


8 slides
Company Achievements Year in Review Presentation
Highlight milestones with impact using the Company Achievements Year in Review Presentation. This dynamic slide uses a multi-layered, pyramid-style layout to showcase your organization’s key wins, progress, and stats throughout the year. Perfect for internal reviews, investor decks, or annual reports. Fully editable and compatible with PowerPoint, Keynote, and Google Slides.


4 slides
Internal Meeting Agenda and Notes Presentation
Stay organized and aligned with the Internal Meeting Agenda and Notes presentation template. Designed for clarity and productivity, this layout includes dedicated sections for meeting topics, notes, action items (to-do list), brainstorming, and extra comments. Ideal for team check-ins, project syncs, and internal reviews. Fully editable and compatible with PowerPoint, Keynote, and Google Slides.


7 slides
Behavior Psychology Infographic Presentation
A Psychology Infographic is a visual representation of information related to the field of psychology. This template includes charts, diagrams, and other visual elements that help illustrate concepts, theories, and research findings in psychology. Use this infographic to cover a wide range of topics, such as personality traits, cognitive processes, mental disorders, and social behavior. The purpose of this psychology template is to help people better understand the complex concepts related to psychology. Compatible with Powerpoint, Keynote, and Google Slides this template is fully editable.


20 slides
Aurorium Sales Proposal Presentation
Win over clients with confidence using this sleek and modern sales proposal presentation. Designed to highlight key business strategies, pricing plans, competitive analysis, and future opportunities, this template helps you communicate your value with clarity and impact. Fully customizable and compatible with PowerPoint, Keynote, and Google Slides for seamless presentations.


4 slides
Interlocking Puzzle Chart Design Presentation
Unlock big ideas with a visual design that clicks your concepts together like a seamless 3D puzzle. This presentation makes it easy to explain connected processes, relationships, or strategic components in a clean, engaging way. Perfect for business, planning, and team alignment. Fully compatible with PowerPoint, Keynote, and Google Slides.


7 slides
Cyber Security Analyst Infographic
Cybersecurity, involves practices, technologies, and processes designed to protect computer systems, networks, data, and programs from theft, damage, unauthorized access, or any form of cyber-attacks. This visually stunning template is tailored to guide and inform both novices and professionals in the realm of cybersecurity. It provides essential insights and strategies to safeguard digital landscapes against modern threats. Compatible with Powerpoint, Keynote, and Google Slides. This template is designed to equip individuals with the knowledge and strategies needed to protect the digital realm.