


Features
- 4 Unique slides
- Fully editable and easy to edit in Microsoft Powerpoint, Keynote and Google Slides
- 16:9 widescreen layout
- Clean and professional designs
- Export to JPG, PDF or send by email


Do you have any questions?
Recommend


5 slides
Cloud Security and Data Storage Presentation
Visually explain your cloud architecture and data protection strategy with this sleek horizontal diagram. Each layered icon represents different aspects of storage, access, and security control—perfect for IT audits, cloud infrastructure briefs, and risk management reports. Fully editable in PowerPoint, Keynote, and Google Slides.


4 slides
Business Decision-Making Framework Presentation
Visualize your path to smarter choices with this key-themed decision-making template. Ideal for strategy sessions, executive planning, or consulting presentations, it breaks down three core steps leading to actionable results. The layout emphasizes clarity and progression, with editable text zones and sleek icons. Works with PowerPoint, Keynote, and Google Slides.


5 slides
Hierarchical Structure in Triangle Format Presentation
Clearly illustrate levels of authority or stages of growth with the Hierarchical Structure in Triangle Format Presentation. This layout features a visually stacked triangle with color-coded segments, each layer representing a tier or level of information. Ideal for organizational charts, value pyramids, or priority structures. Each section includes a title, icon, and description area to keep your message clear and impactful. Fully editable in PowerPoint, Keynote, and Google Slides.


5 slides
Nutrition Facts Infographics
Nutrition facts provide important information about the nutritional content of food and beverages. This helps individuals make informed decisions about their dietary choices and understand the impact of food on their health. These infographic templates are designed to present essential information about nutrition and healthy eating habits. These infographics are suitable for nutritionists, dietitians, health educators, or anyone looking to communicate key facts and guidelines about nutrition in a clear and engaging manner. Compatible with Powerpoint, Keynote, and Google Slides, these are fully customizable.


21 slides
Argentis UX Strategy Plan Presentation
Craft a seamless user experience with this professional UX strategy plan presentation. Covering key topics like user research, interaction design, wireframes, and accessibility considerations, this template helps you present a structured and insightful design approach. Fully customizable and compatible with PowerPoint, Keynote, and Google Slides for a smooth and impactful presentation.


5 slides
Business Influence Stakeholder Analysis Presentation
Enhance your project's success with our Business Influence Stakeholder Analysis Presentation template, designed to identify and prioritize stakeholders based on their influence and impact. This template is ideal for strategic planning and ensuring all key stakeholders are considered. Compatible with PowerPoint, Keynote, and Google Slides."


5 slides
Climate Change Response Strategy Deck Presentation
Communicate your climate action roadmap clearly with this Climate Change Response Strategy Deck Presentation. Featuring a directional arrow flow design, this layout helps visualize progressive steps in sustainability, adaptation, or policy initiatives. Ideal for ESG reporting, environmental briefings, or nonprofit strategy sessions. Works seamlessly with PowerPoint, Keynote, and Google Slides.


7 slides
Construction Infographics Presentation Template
Featuring our construction template this is a great way to show off your next project. It features a construction background with illustrations and the slide icons include all your progress steps. It is the perfect choice to present your work or to showcase a product, it has a beautiful design and informative data that will be sure to increases sales for you. This template is part of our construction category and features a construction infographic design. It is an engaging and colorful way to present your message in a clean and bright format. Perfect for any presentation you can imagine!


7 slides
Process Solution Infographic
Streamline intricate workflows with our process solution infographic. Anchored in a pristine white base and infused with varying shades of professional blue, our template elegantly delineates step-by-step solutions and systematic approaches. Decked with meticulous infographics, representative icons, and versatile image placeholders, it transforms complexities into a navigable visual journey. Masterfully curated for Powerpoint, Keynote, or Google Slides. An invaluable asset for process managers, business analysts, strategists, or any organization keen on optimizing workflows. Navigate processes with confidence; let each slide chart the path to optimized solutions.


6 slides
Strategy for Effective Solutions Presentation
Unlock strategic clarity with the Strategy for Effective Solutions template, which effectively organizes complex strategies into six interconnected segments, ideal for sequentially showcasing business insights. Its clear, systematic design supports concise communication and is compatible with PowerPoint, Keynote, and Google Slides, making it a versatile tool for professional presentations.


20 slides
Ashen Sales Proposal Presentation
The Sales Proposal Presentation Template is designed to help you showcase your sales strategy effectively. With 20 fully customizable slides, it covers key areas such as market analysis, sales objectives, pricing strategy, and future opportunities. Ideal for professionals, it’s compatible with PowerPoint, Keynote, and Google Slides.


10 slides
Project Budget Breakdown Presentation
The "Project Budget Breakdown Presentation" template offers a clear and efficient way to visualize budget allocations within a project. It uses a visually appealing color scheme that highlights four different budget segments, each represented by a different color to ensure quick readability and easy understanding. The template allows you to illustrate percentages and corresponding financial values, making it straightforward for stakeholders to grasp budget allocations at a glance. This template is highly beneficial for project managers, financial analysts, and business executives who need to present and discuss budgetary details clearly and concisely in project meetings or budget reviews. It is adaptable for use in various industries, including construction, IT, marketing, and research development, supporting effective budget management and transparency.


7 slides
North America Population Infographic Presentation
North America is a continent located in the northern hemisphere of the Earth, bordered by the Pacific Ocean to the west. It includes countries such as the United States, Canada, Mexico, and several others in the Caribbean and Central America. This template can be a powerful tool to communicate information about the continent in an informative and engaging way. This can help people understand and appreciate the diversity and complexity of North America, and can be used for a variety of purposes, from education to marketing. This template is compatible with Powerpoint, Keynote and Google Slides.


23 slides
Volt Business Plan Presentation
The Business Plan Presentation Template offers 23 refined slides to convey goals, strategies, achievements, and action plans. Perfect for team updates, resource allocation, and collaboration opportunities. Designed for PowerPoint, Keynote, and Google Slides, its warm, professional layout ensures clarity while fostering effective communication for corporate or project presentations. Fully customizable.


5 slides
Customer Experience Empathy Map Presentation
Enhance Customer Understanding with the Empathy Map Presentation! This Customer Experience Empathy Map template is designed to help businesses visualize customer needs, thoughts, emotions, and behaviors for improved engagement and strategy. Featuring a clear quadrant-based layout, this template allows you to map out customer insights, pain points, and expectations for more effective decision-making. Ideal for marketers, UX designers, and business strategists, this fully editable template is compatible with PowerPoint, Keynote, and Google Slides, making


20 slides
Aeneas Sales Proposal Presentation
Seal your next deal with this professional sales proposal template. It covers key sections like objectives, pricing strategy, and target market, offering a comprehensive layout for your pitch. Ideal for impressing clients, it's compatible with PowerPoint, Keynote, and Google Slides for smooth, impactful presentations.


23 slides
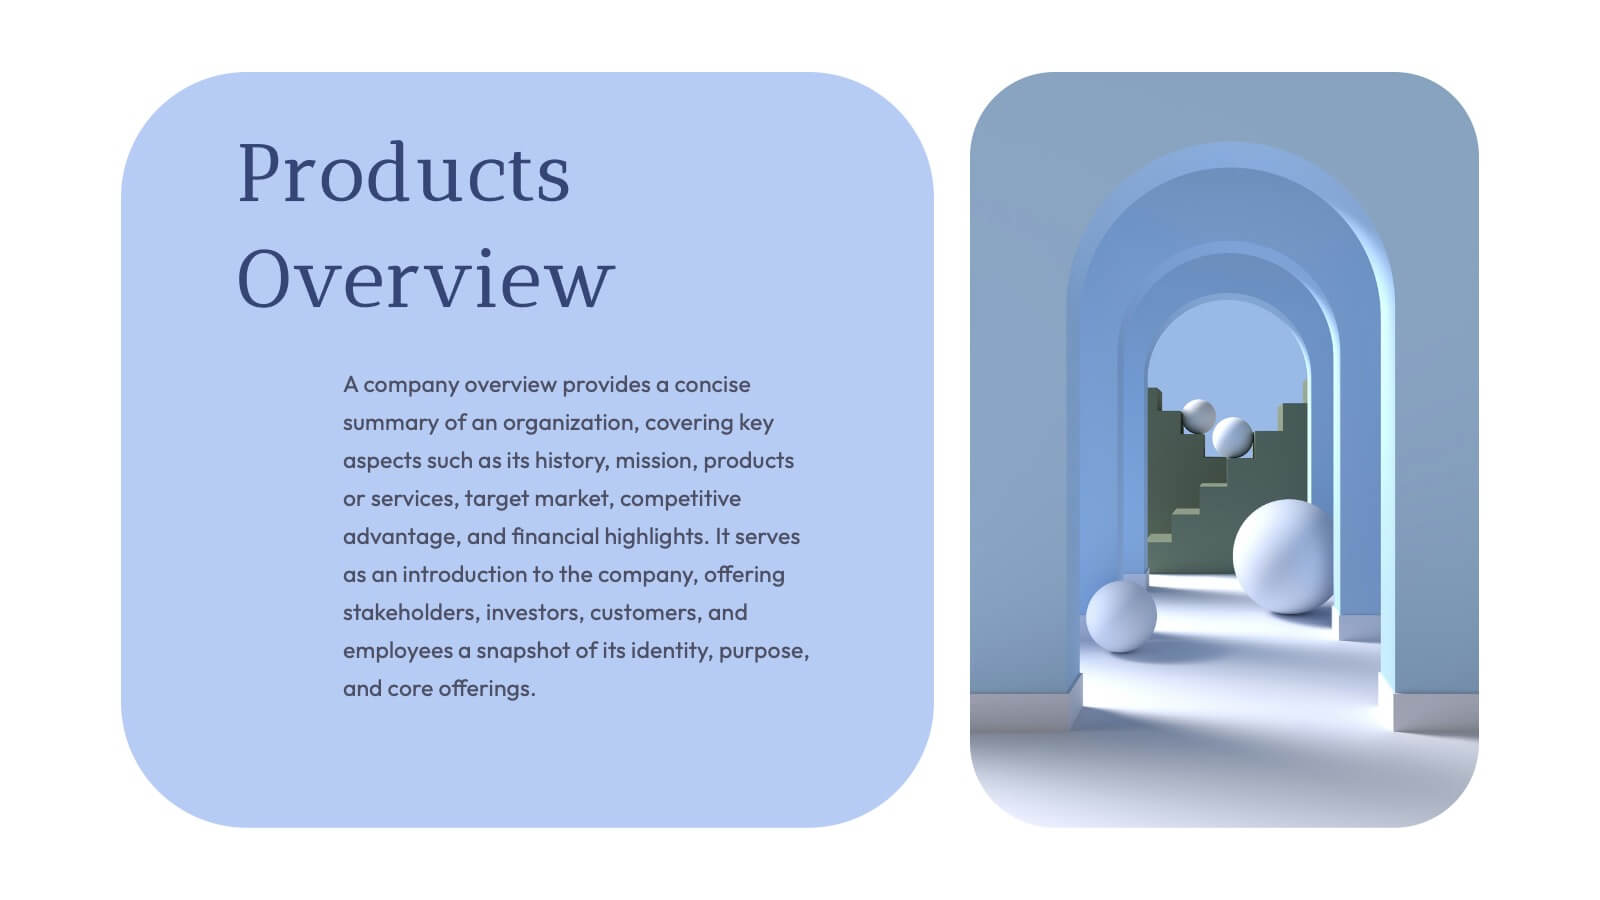
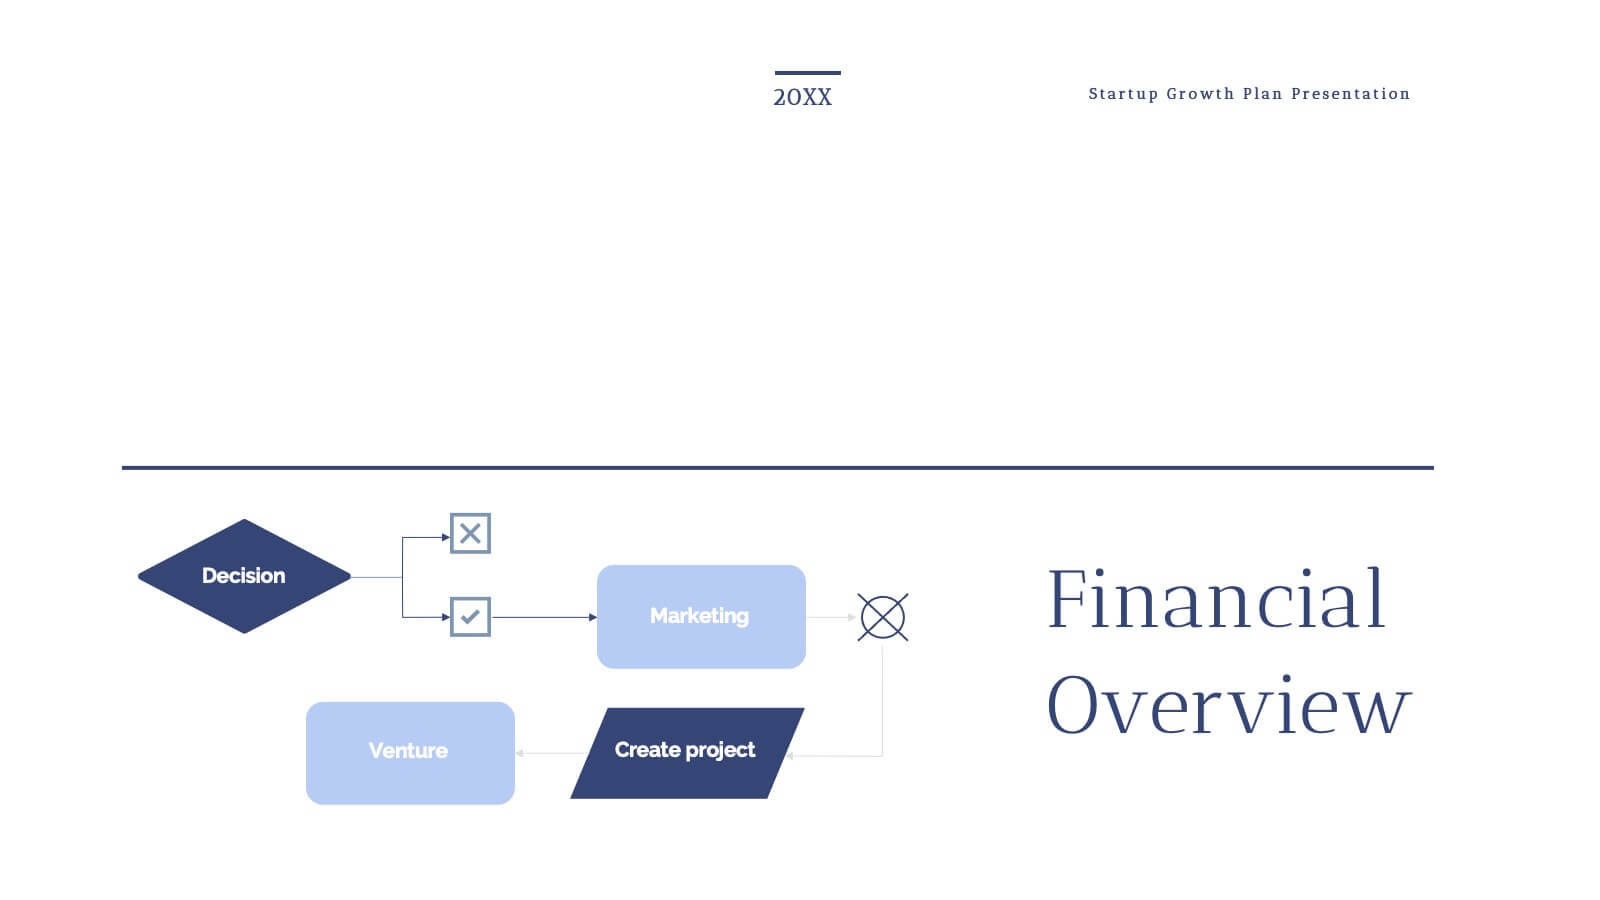
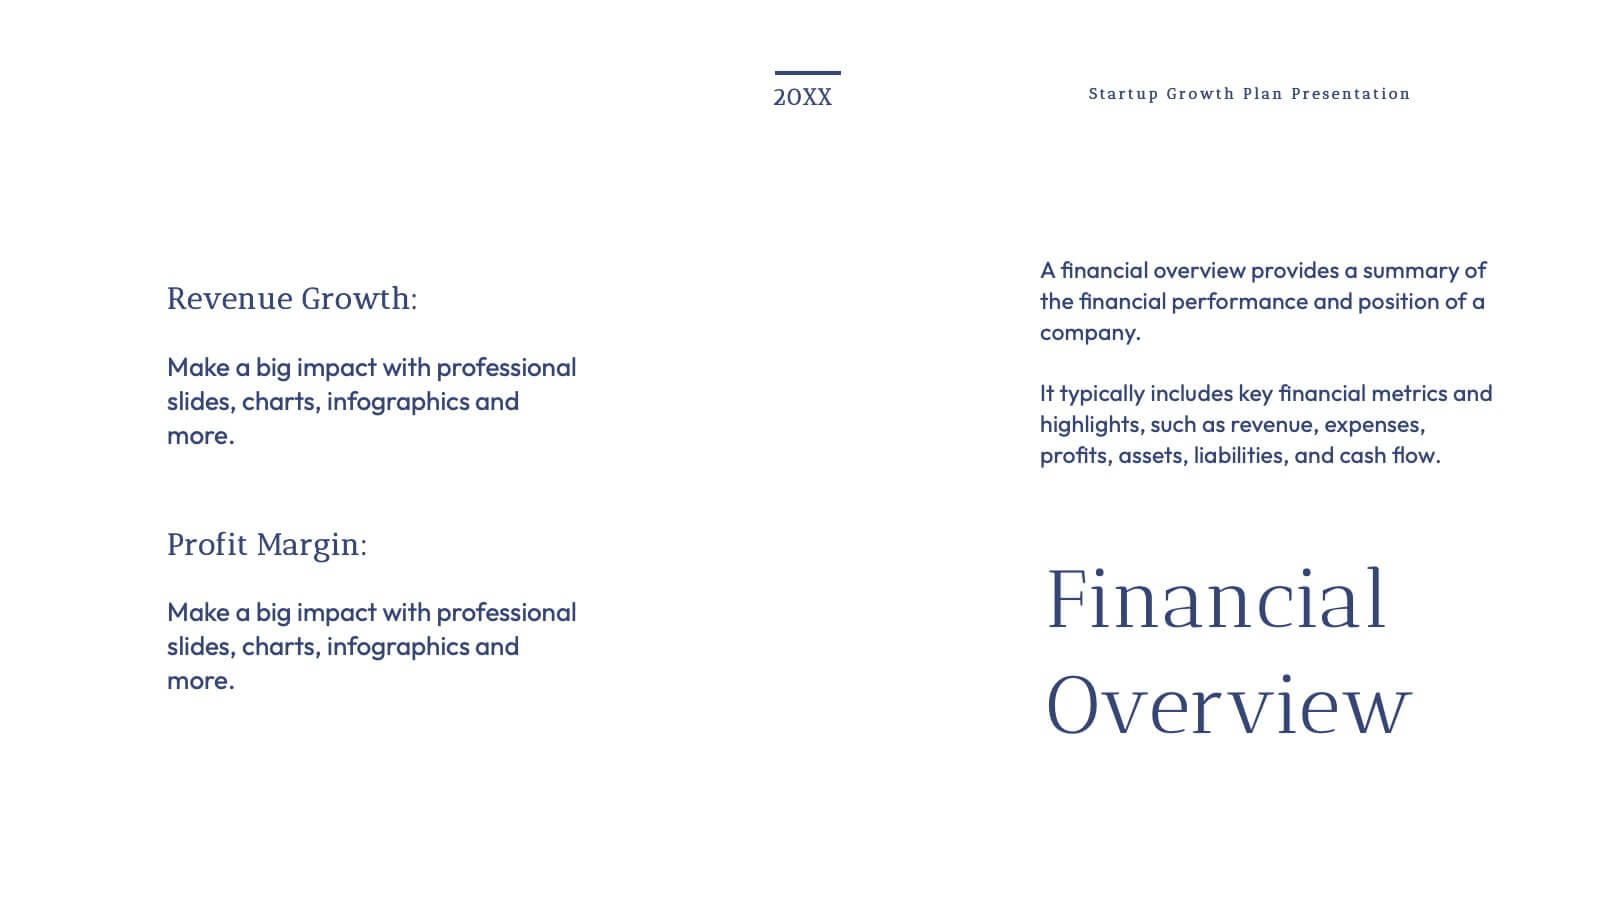
Grecian Startup Growth Plan Presentation
Elevate your pitch with this stunning Grecian-inspired presentation template, perfect for outlining your startup's growth plan! Showcase your business strategy, revenue projections, and scaling opportunities with a clean, elegant design that grabs attention. Impress investors and stakeholders with every slide. Compatible with PowerPoint, Keynote, and Google Slides for seamless customization.