


Features
- 26 Unique slides
- Fully editable and easy to edit in Microsoft Powerpoint, Keynote and Google Slides
- 16:9 widescreen layout
- Clean and professional designs
- Export to JPG, PDF or send by email


Do you have any questions?
Recommend


3 slides
Profitability and Cost Analysis Presentation
Evaluate financial efficiency with this profitability and cost analysis template. Designed for business strategists and financial planners, it helps compare costs against revenue to determine profit potential. The visual balance scale enhances clarity, making complex data easier to digest. Fully customizable and compatible with PowerPoint, Keynote, and Google Slides for seamless editing.


10 slides
Chronological Event Timeline Presentation
Present events with clarity using this linear timeline slide. Ideal for showcasing project milestones, historical developments, or sequential achievements. Features 5 editable points with icons, titles, and dates for easy customization. Compatible with PowerPoint, Keynote, and Google Slides—perfect for planners, managers, educators, and strategists needing organized time-based visuals.


6 slides
Business Advancement Metrics Presentation
Get ready to visualize your wins! This presentation template brings clarity to your metrics, helping you showcase business growth and performance benchmarks with sleek, stacked visuals. Perfect for tracking KPIs, performance analysis, or advancement trends. Fully compatible with PowerPoint, Keynote, and Google Slides for easy editing and seamless presentation delivery.


3 slides
Corporate Sustainabilitiy Management Strategy Presentation
Drive your company’s future with a presentation that blends strategy, innovation, and sustainability. Designed to communicate eco-friendly initiatives and long-term business goals, it helps visualize performance, impact, and growth clearly. Fully customizable and compatible with PowerPoint, Keynote, and Google Slides for seamless, professional, and engaging sustainability presentations.


7 slides
Strategic Alignment Using McKinsey 7S Presentation
Showcase organizational effectiveness with this Strategic Alignment Using McKinsey 7S Presentation. This diagram template visually maps all seven interconnected elements—Strategy, Structure, Systems, Shared Values, Skills, Style, and Staff—making it easy to communicate business alignment and transformation goals. Perfect for consultants, team leaders, and strategy professionals. Fully customizable in PowerPoint, Keynote, and Google Slides.


26 slides
Kimbr Presentation Template
Kimbr is a modern and simple Powerpoint template that uses bold text in order to immediately catch your audience’s attention and let them focus on your innovative ideas. Combined with the modern and minimalistic style of Kimbr, this presentation packs a punch in the minimalism department: It comes with unique and modern slides perfect for Spa businesses or anyone looking for a clean minimal presentation. In addition, it has Charts, timelines and image placeholders, you'll be sure to find a space for all your information. Don't wait any longer and get started presenting your ideas today.


4 slides
Team Relationship Structure Presentation
Show your organization’s hierarchy with clarity and style using this modern visual layout. Ideal for illustrating team dynamics, reporting lines, or company roles, it helps simplify complex structures into easy-to-follow visuals. Fully customizable and compatible with PowerPoint, Keynote, and Google Slides for seamless editing and professional presentation design.


8 slides
Annual Business Performance Report Presentation
Visualize your company’s progress with the Annual Business Performance Report Presentation. This sleek, data-driven template combines donut charts and bar graphs to showcase KPIs, milestones, and key achievements. Perfect for year-end summaries and stakeholder updates. Fully editable in Canva, PowerPoint, and Google Slides for easy customization and professional results.


10 slides
Key Takeaways List Presentation
Streamline your key points with our "Key Takeaways List Presentation" template. This versatile infographic design offers a clear, structured format for enumerating crucial information across four distinct stages. Each stage is visually represented with vibrant, color-coded sections to ensure readability and impact. Whether you're summarizing a meeting, outlining project steps, or highlighting important data, this template provides a straightforward way to communicate your message effectively. Compatible with PowerPoint, Keynote, and Google Slides, it's ideal for professionals seeking to make their presentations more engaging and organized.


6 slides
Data-Driven Decision Making Presentation
Showcase your data-to-action process with this clean, step-by-step layout. Ideal for illustrating analytics workflows, this template features five connected stages with modern icons and clear labeling. Perfect for business, tech, or strategy presentations. Fully editable in Canva, PowerPoint, and Google Slides to match your branding and communication needs.


5 slides
Business Objectives and Strategic Goals Presentation
Clarify your roadmap to success with this visually structured Business Objectives and Strategic Goals slide. Featuring five segmented goal icons arranged in a semi-circle layout, this template is perfect for strategic planning, quarterly reports, and team briefings. Each section allows space to detail your specific objectives with matching visuals for easy comprehension. Fully editable in PowerPoint, Keynote, and Google Slides.


26 slides
Haeleigh Presentation Template
The Haeleigh Powerpoint Template is a 26 modern slide template that is perfect for any presentation. With a clean classy aesthetic and easy to read text, this template is ideal for reading content and looking professional. The use of nude colors helps keep the look clean and easy to read. The theme comes packed with features to target your audience and help you get your message across. The charts, graphics, timelines included are easy to edit. This template is also perfect for businesses seeking to make an impression on their audience. Haeleigh is mobile friendly and easy to navigate.


20 slides
Radiant Sales Proposal Presentation
Elevate your pitch with this polished sales proposal template! Perfect for presenting company overviews, product/service details, and pricing strategies, it includes slides for competitive analysis and customer testimonials. Impress your audience with clear visuals and structured content. Compatible with PowerPoint, Keynote, and Google Slides for seamless presentations on any platform.


10 slides
Project Launch in 4 Structured Phases Presentation
Present your roadmap with clarity using this four-phase launch diagram. Designed for planning, strategy, or product rollout presentations, each step is illustrated in a 3D layered format with editable text sections. Fully customizable in PowerPoint, Keynote, and Google Slides—ideal for project managers and teams outlining sequential development or launches.


21 slides
Crystalhearth UX Design Presentation
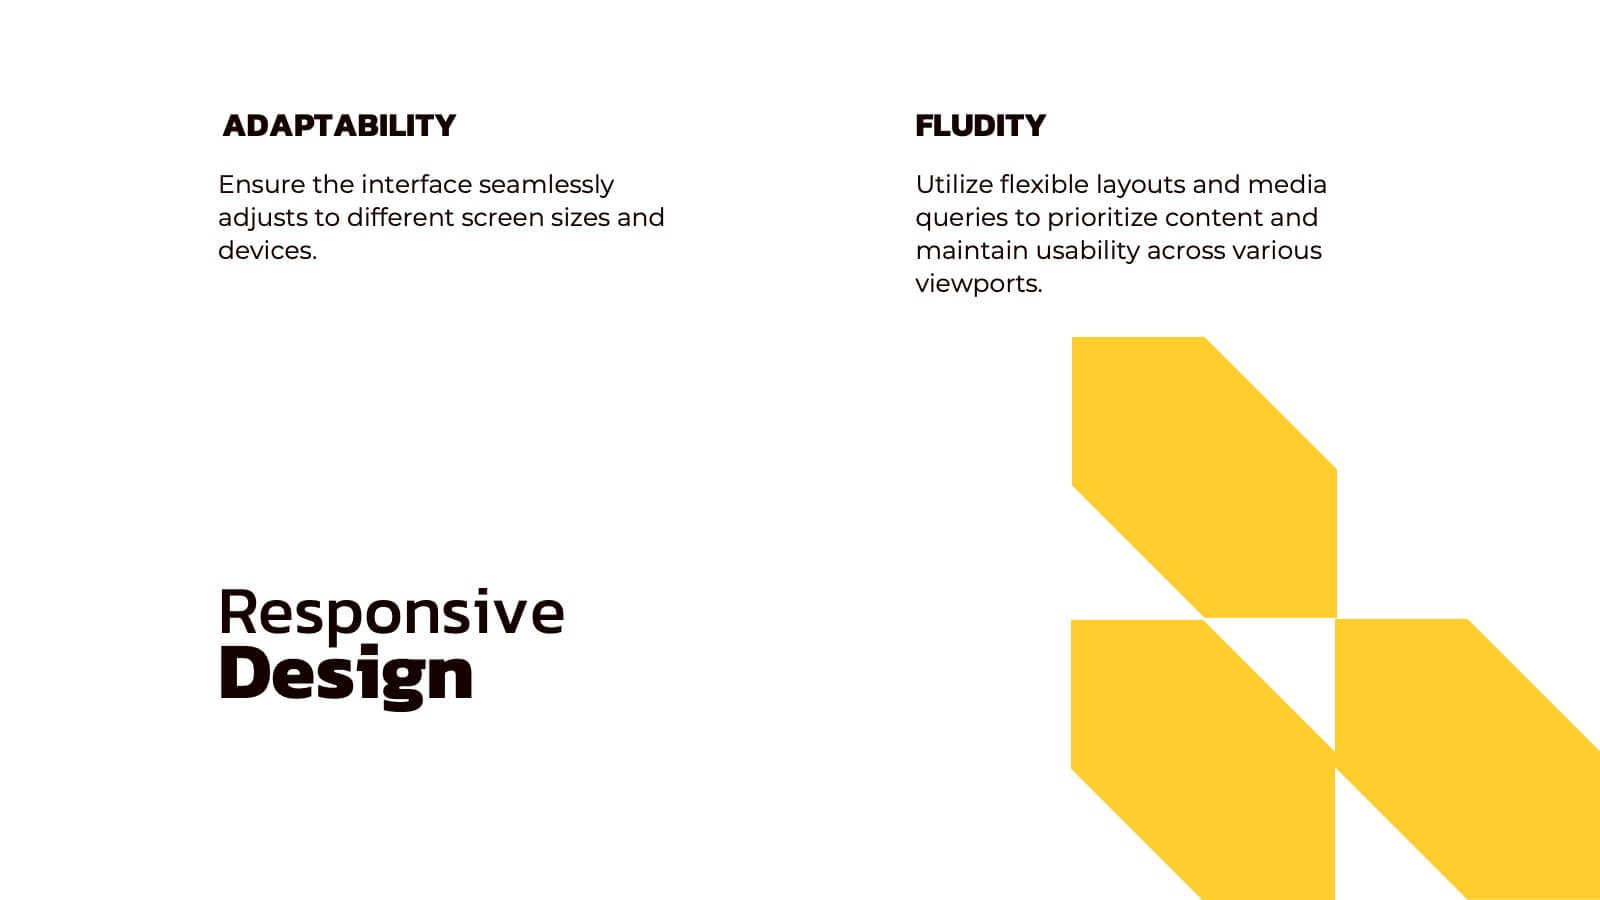
This professional template simplifies UX/UI design presentations, covering user research, personas, journey mapping, wireframes, and usability guidelines. Showcase visual elements, branding, accessibility, and responsive design. Ideal for illustrating the iterative process, testing insights, and project showcases. Fully customizable and compatible with PowerPoint, Keynote, and Google Slides.


4 slides
Employee and Team Performance Analysis
Visualize individual and team contributions with this clear and structured performance analysis template. Showcase key metrics, employee growth, and team achievements using easy-to-read layouts and progress indicators. Ideal for HR reports, performance reviews, and team evaluations. Fully editable in PowerPoint, Keynote, and Google Slides.


6 slides
Four Pillar of Success Presentation
Build a strong foundation for your ideas with this elegant and structured infographic layout. Perfect for presenting key principles, business strategies, or organizational goals, it balances clarity and design beautifully. Fully customizable and compatible with PowerPoint, Keynote, and Google Slides for seamless editing and professional presentations.