


Features
- 5 Unique slides
- Fully editable and easy to edit in Microsoft Powerpoint, Keynote and Google Slides
- 16:9 widescreen layout
- Clean and professional designs
- Export to JPG, PDF or send by email


Do you have any questions?
Recommend


14 slides
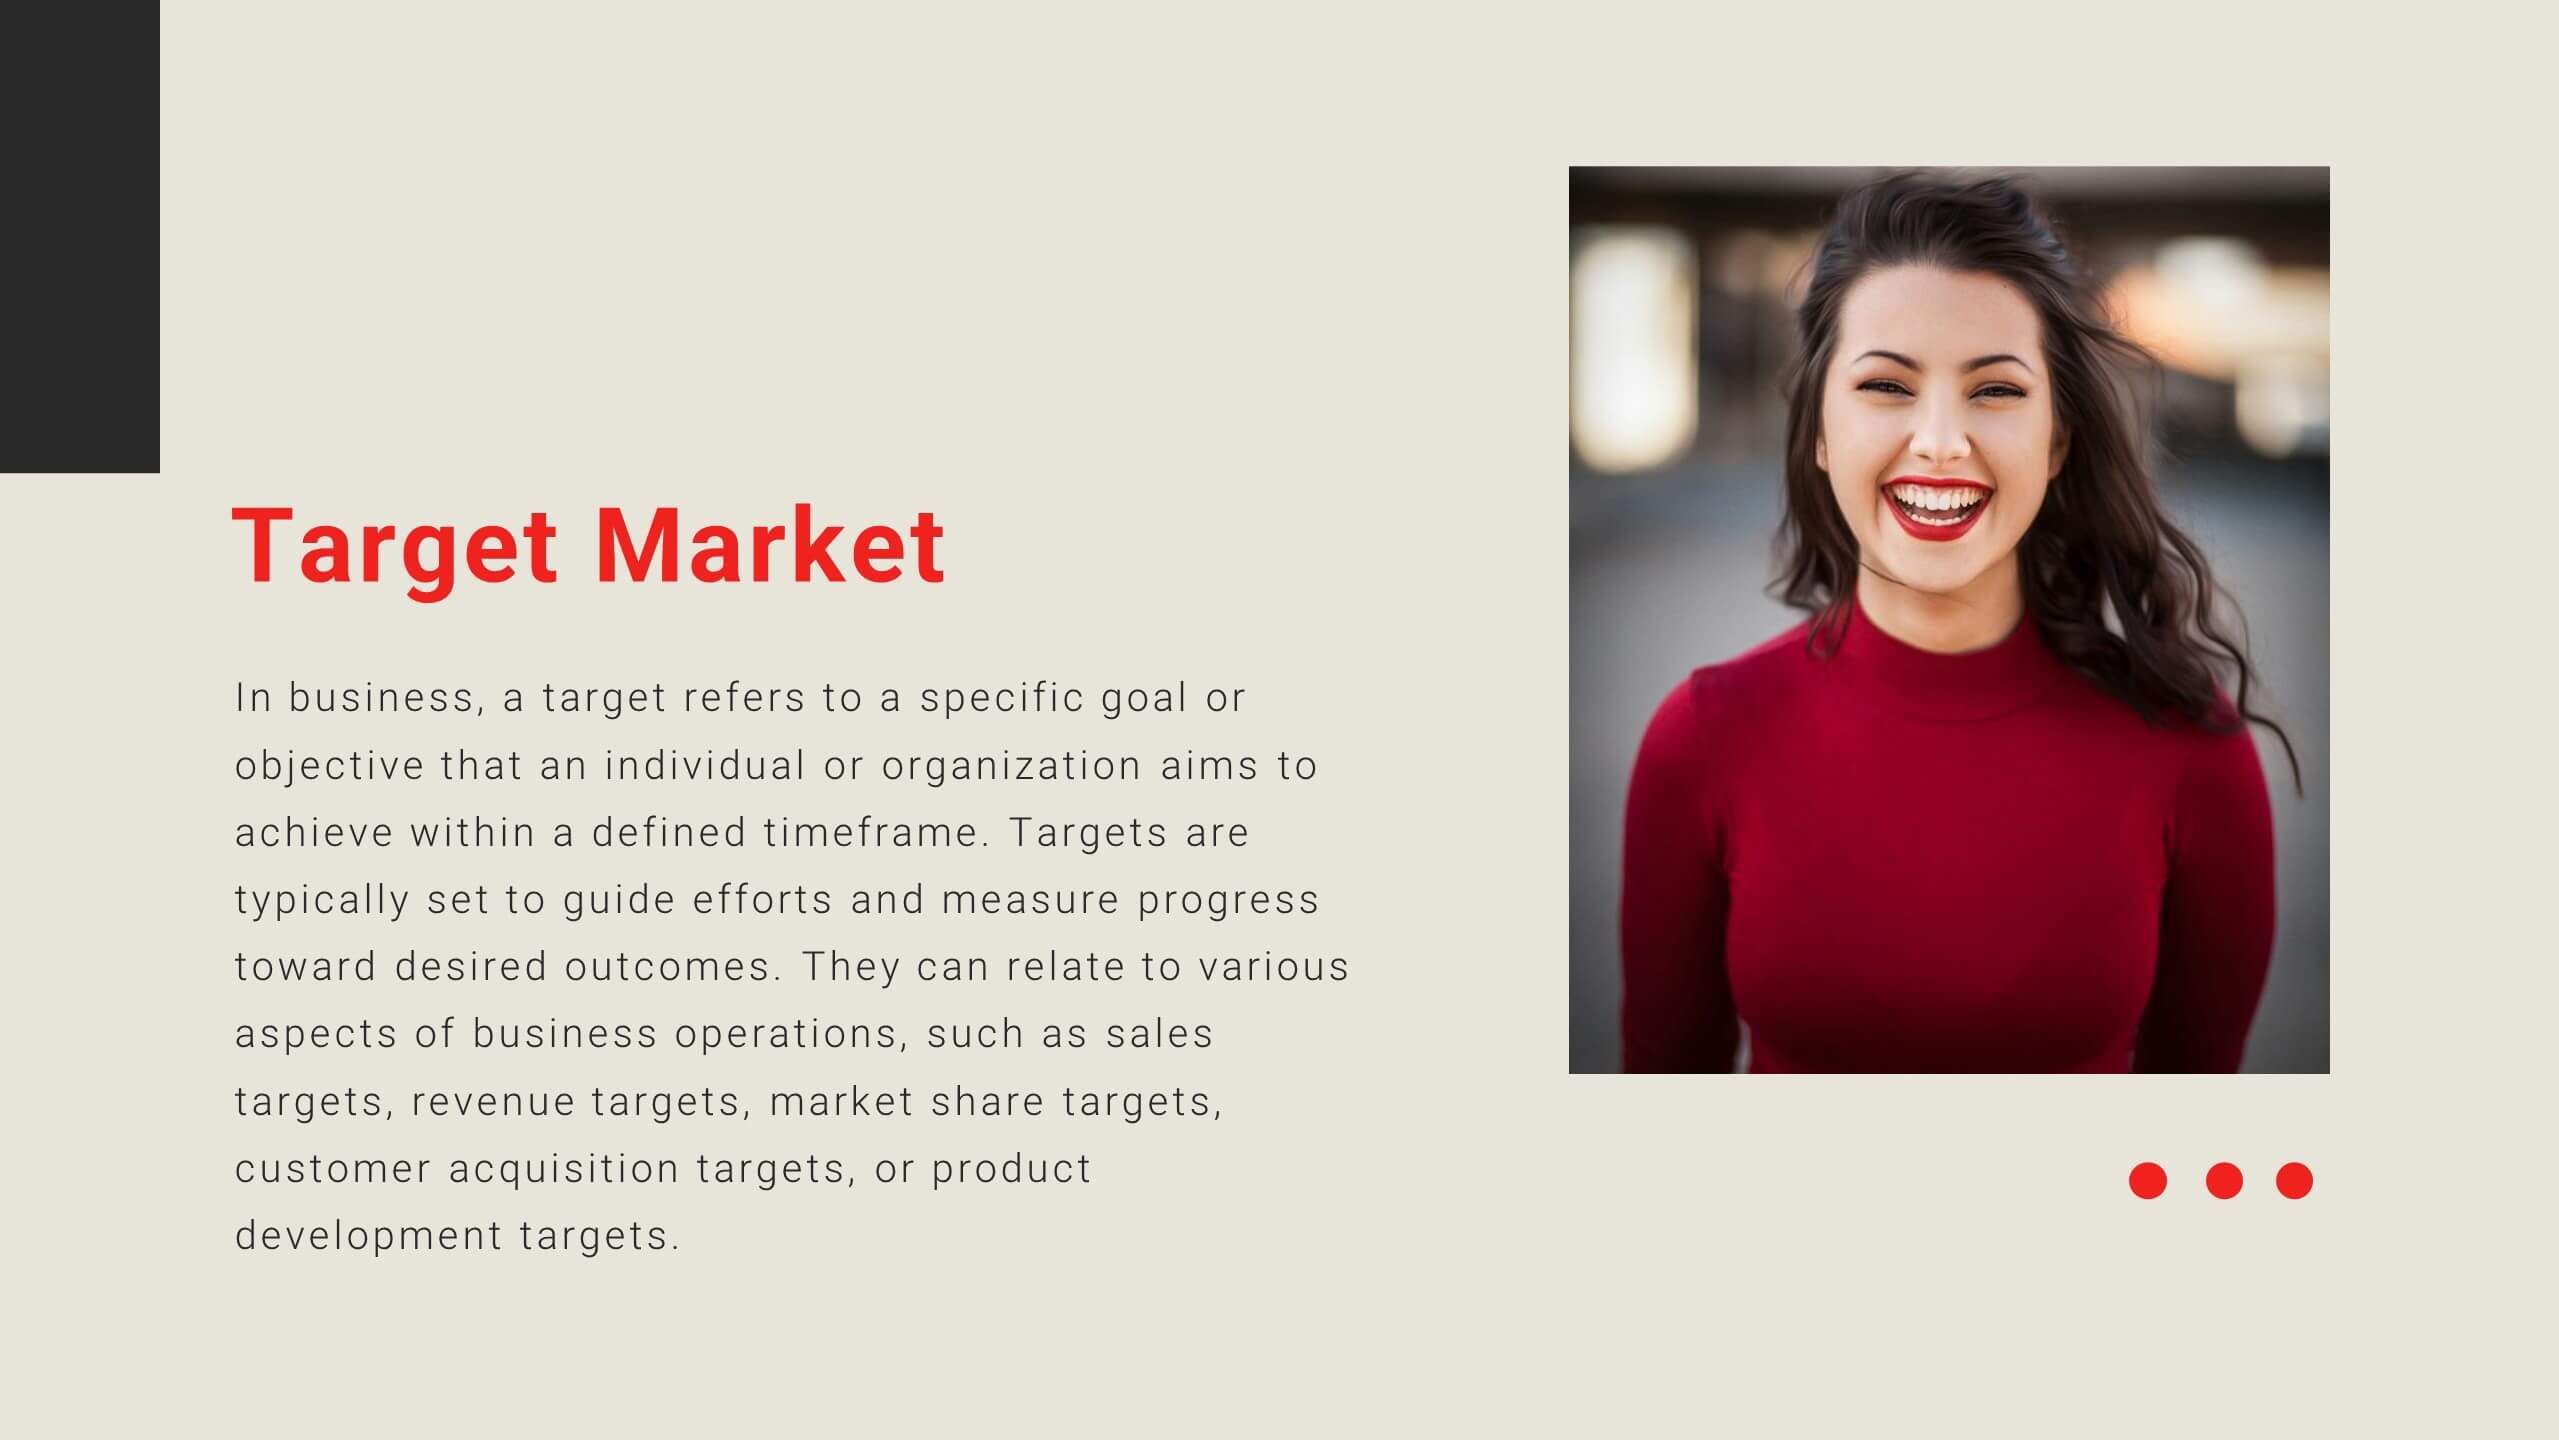
IT Service Operations Strategy
Simplify complex IT operations into an intuitive visual strategy. This slide features a dynamic radial flow diagram and labeled segments to illustrate service components, support tiers, or incident flows. Perfect for IT managers, consultants, and teams aligning service delivery with business goals. Fully editable in PowerPoint, Keynote, or Google Slides
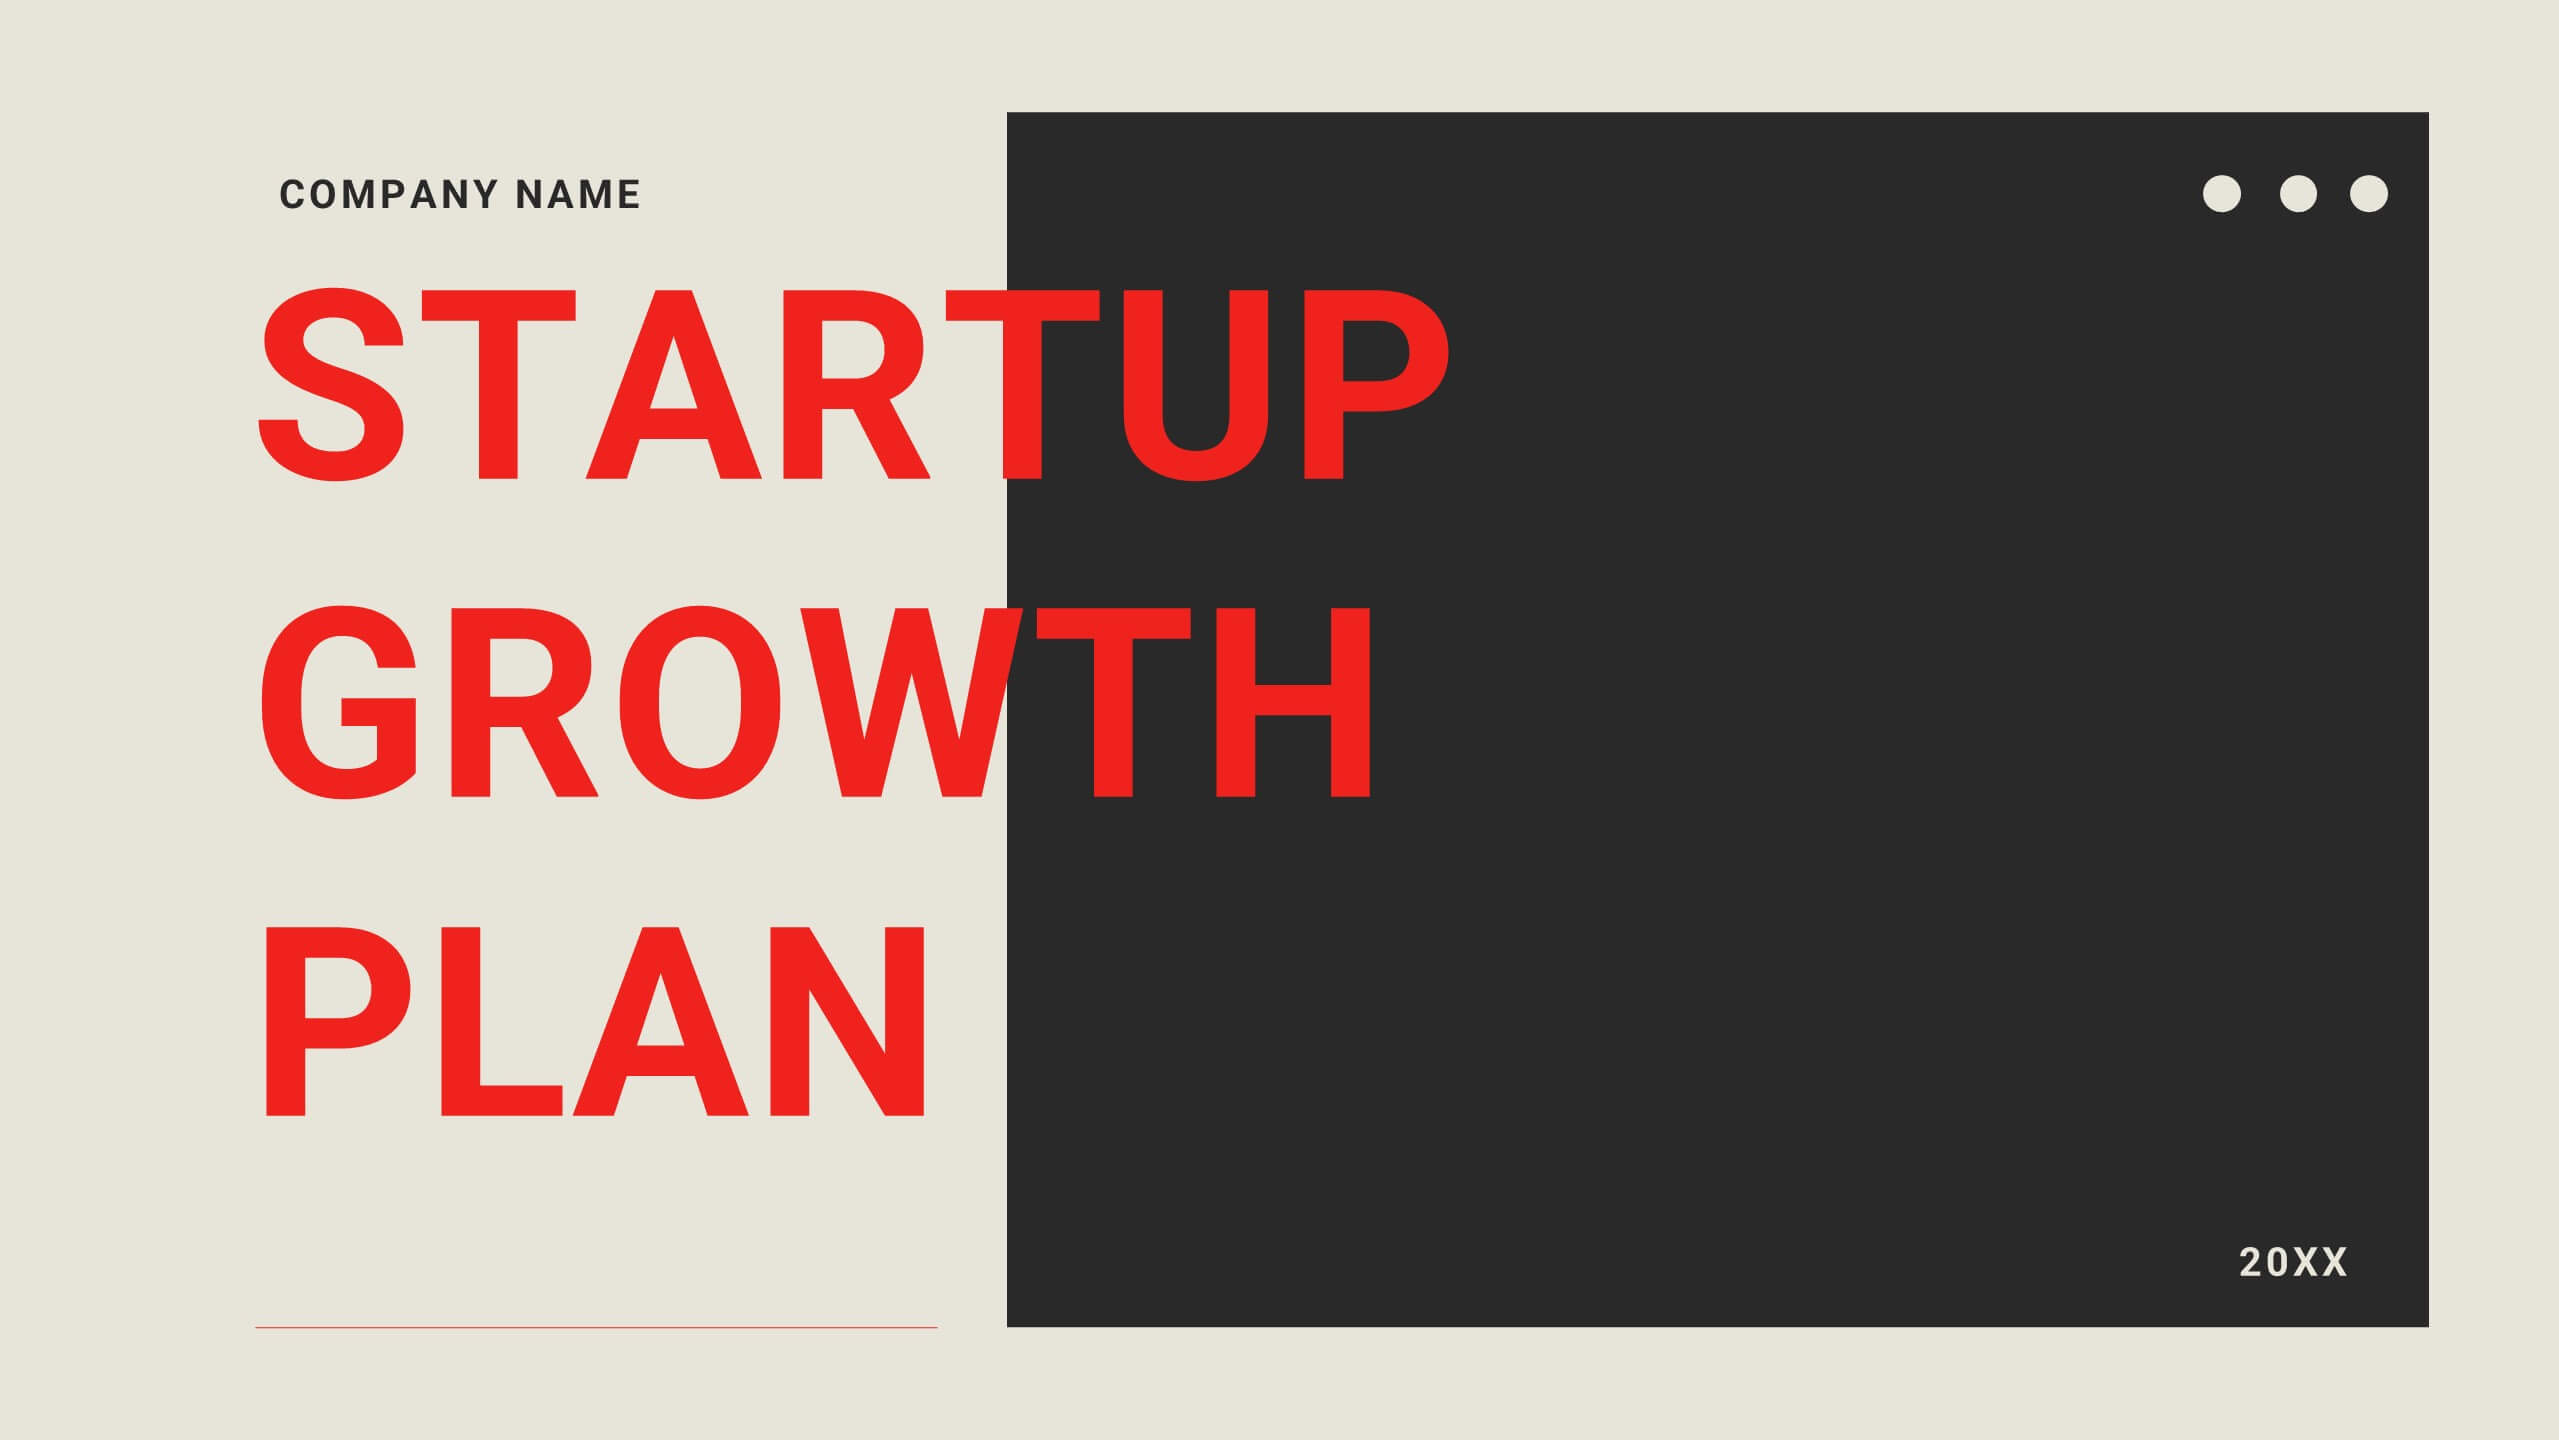
21 slides
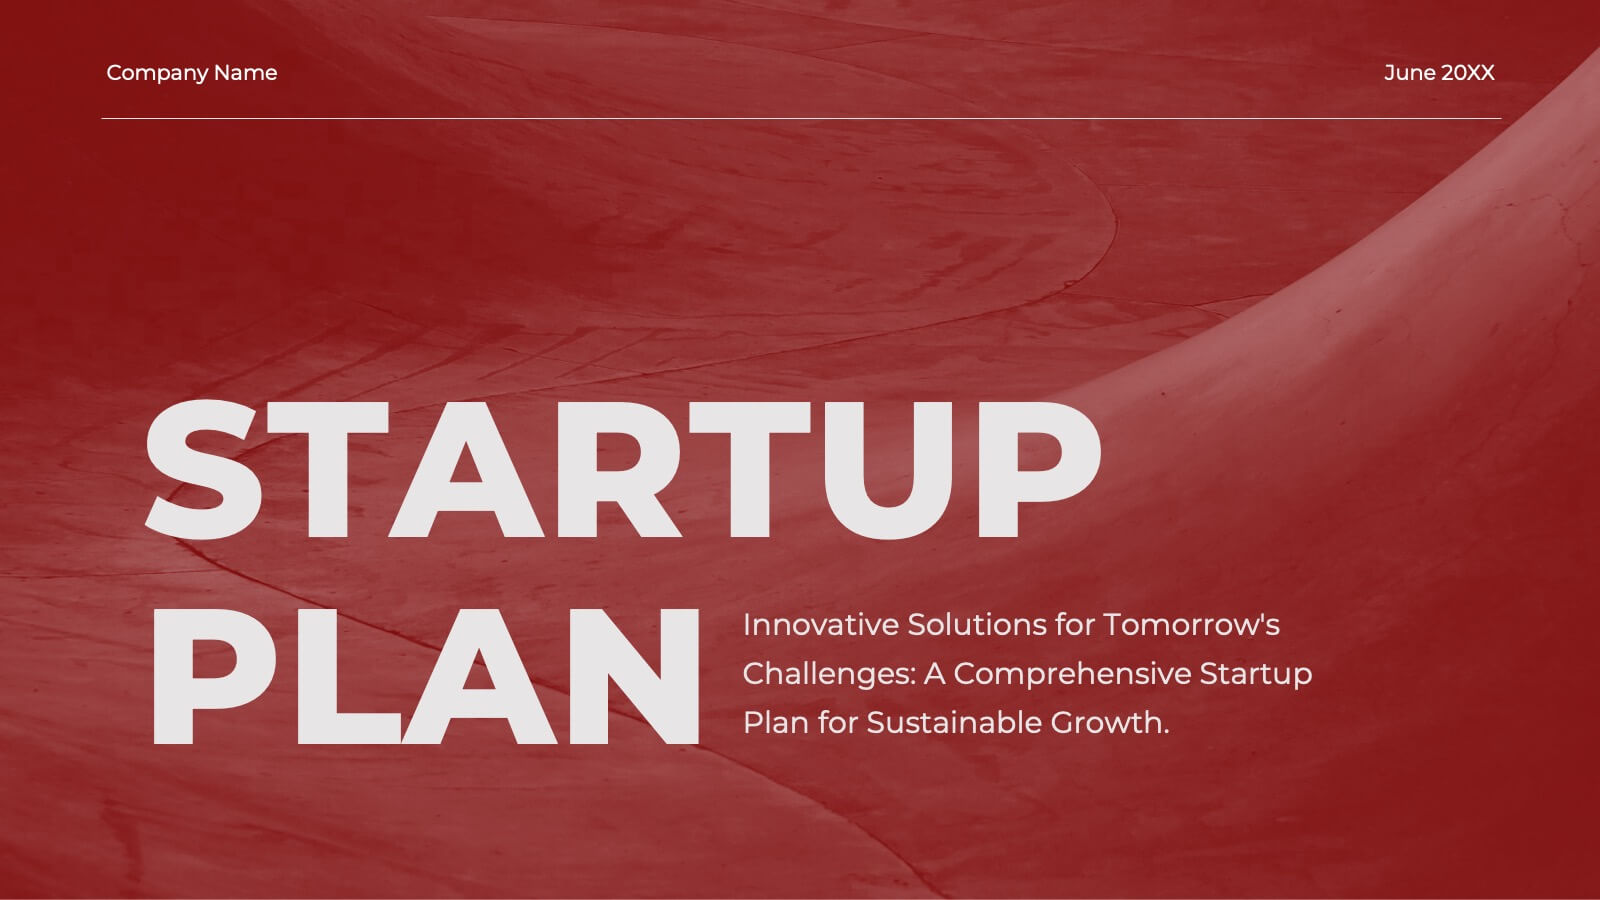
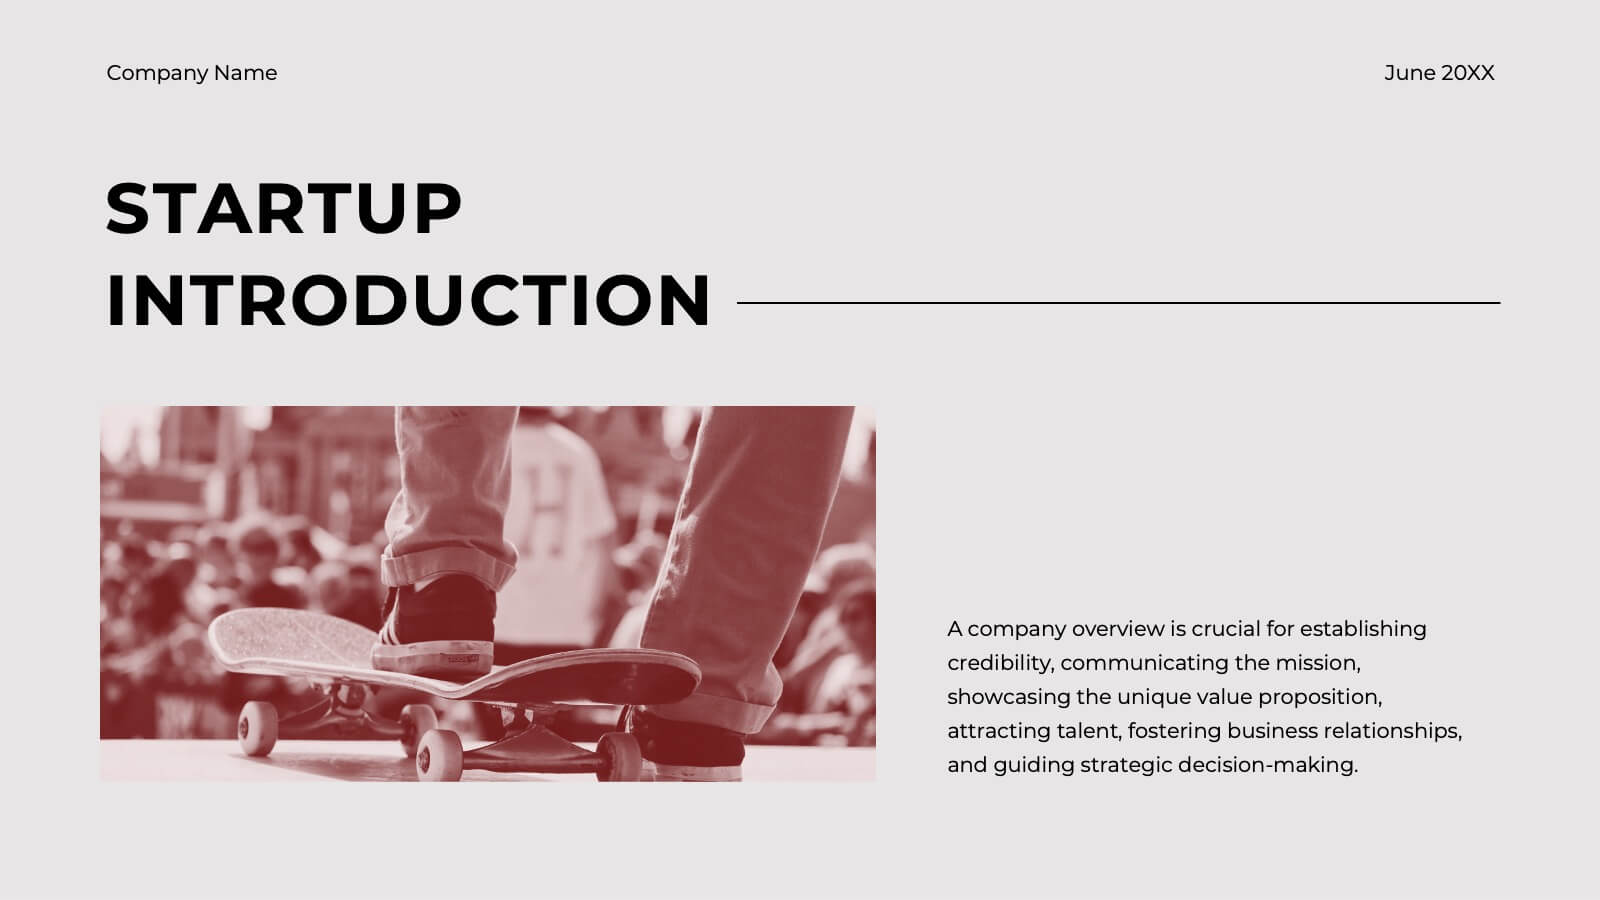
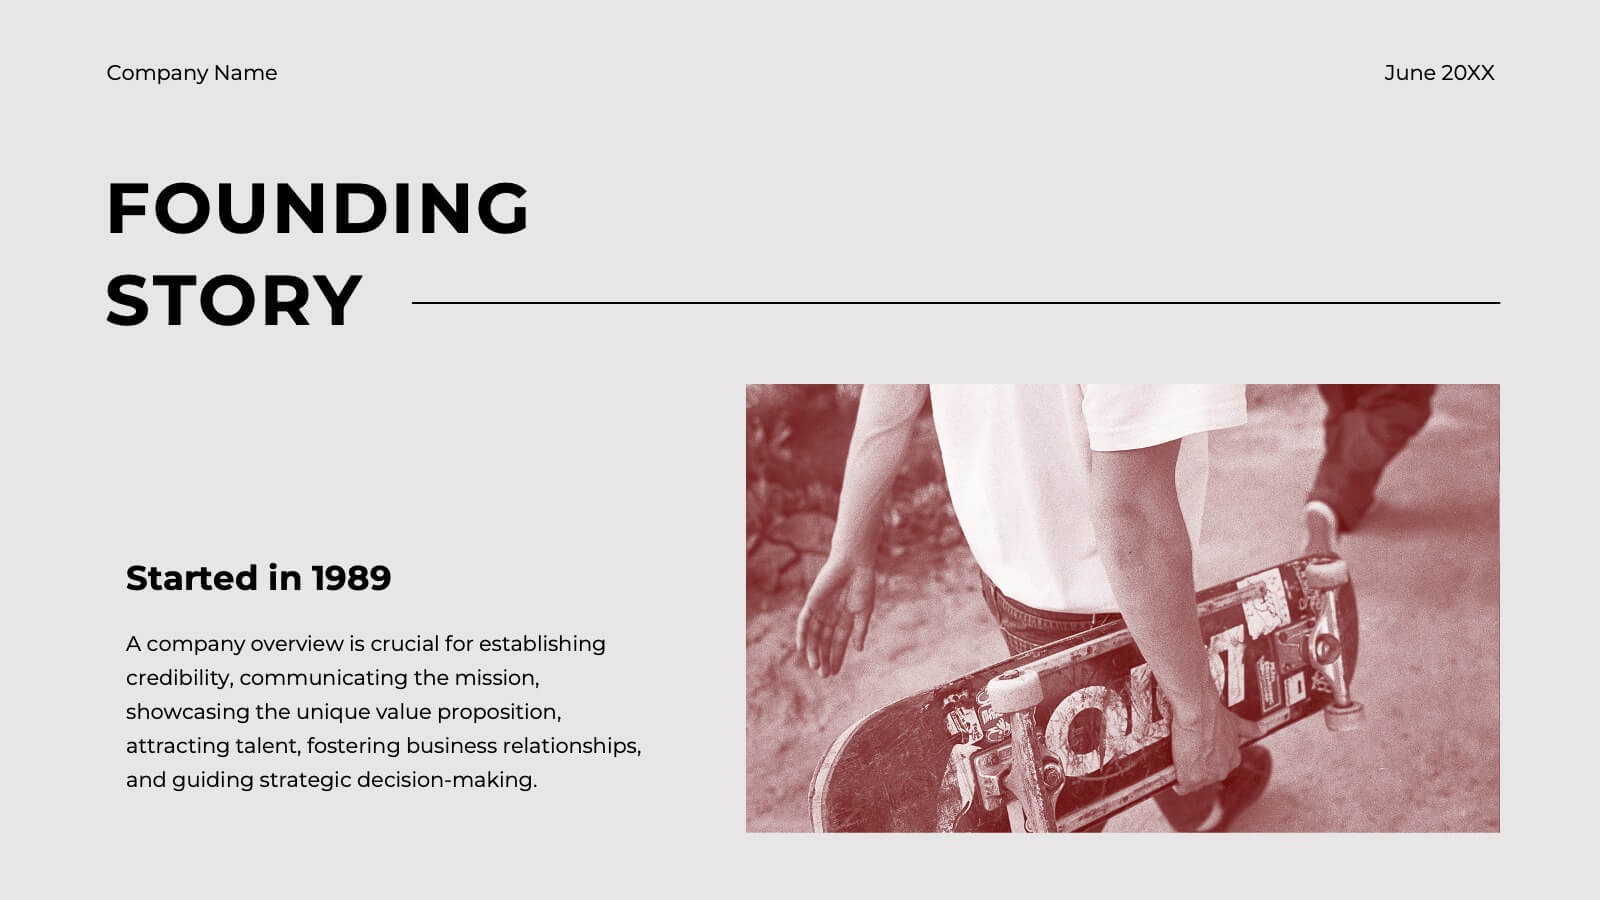
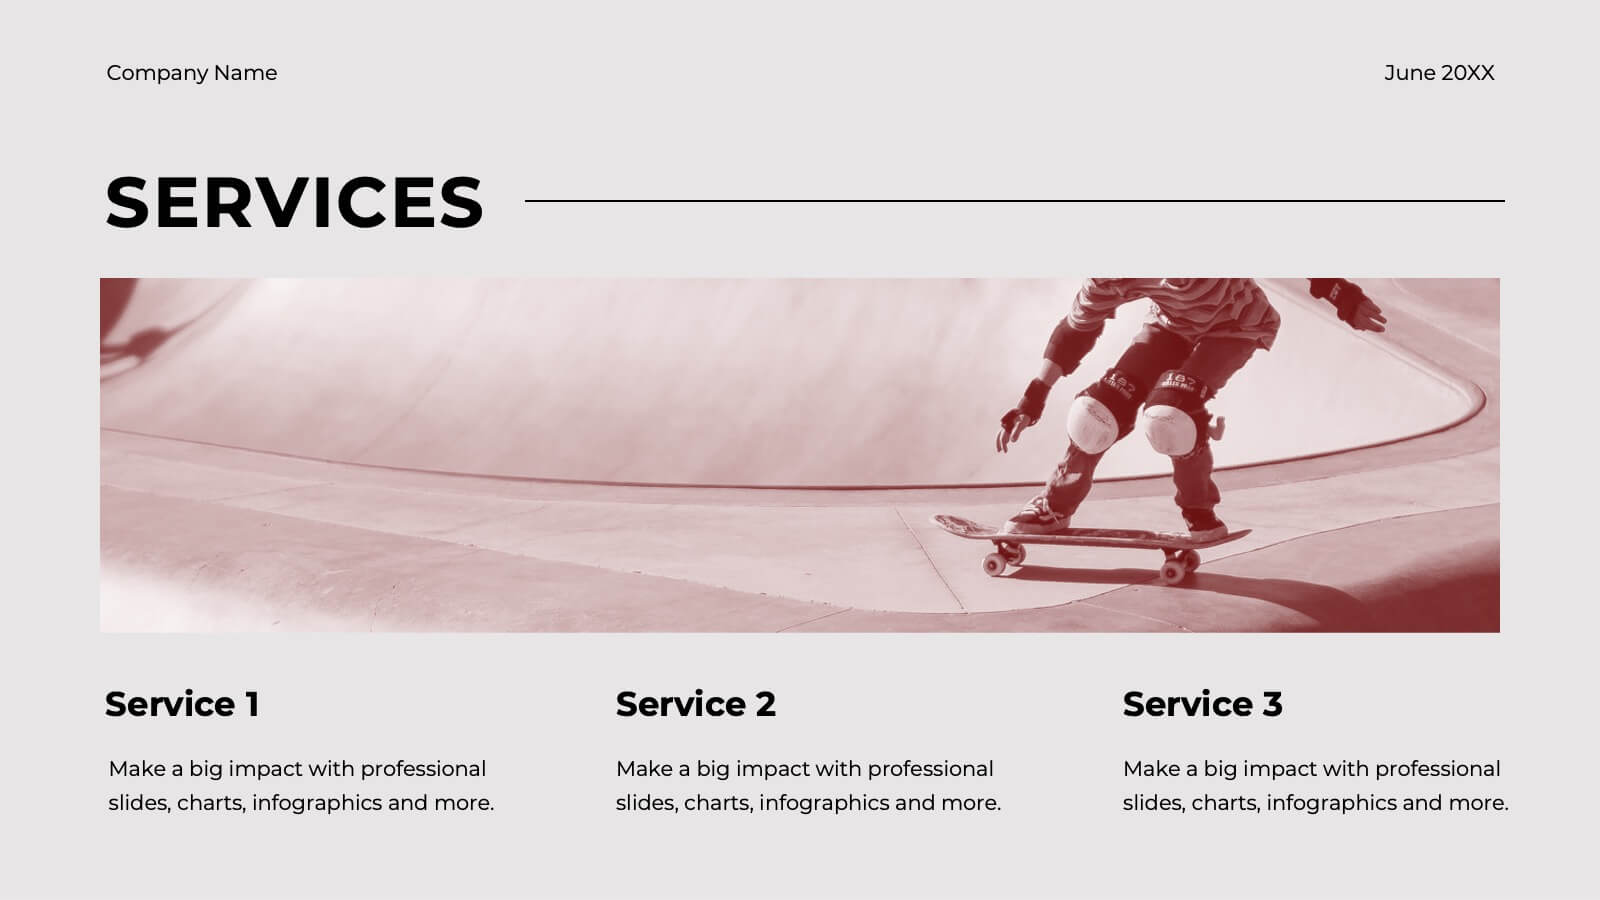
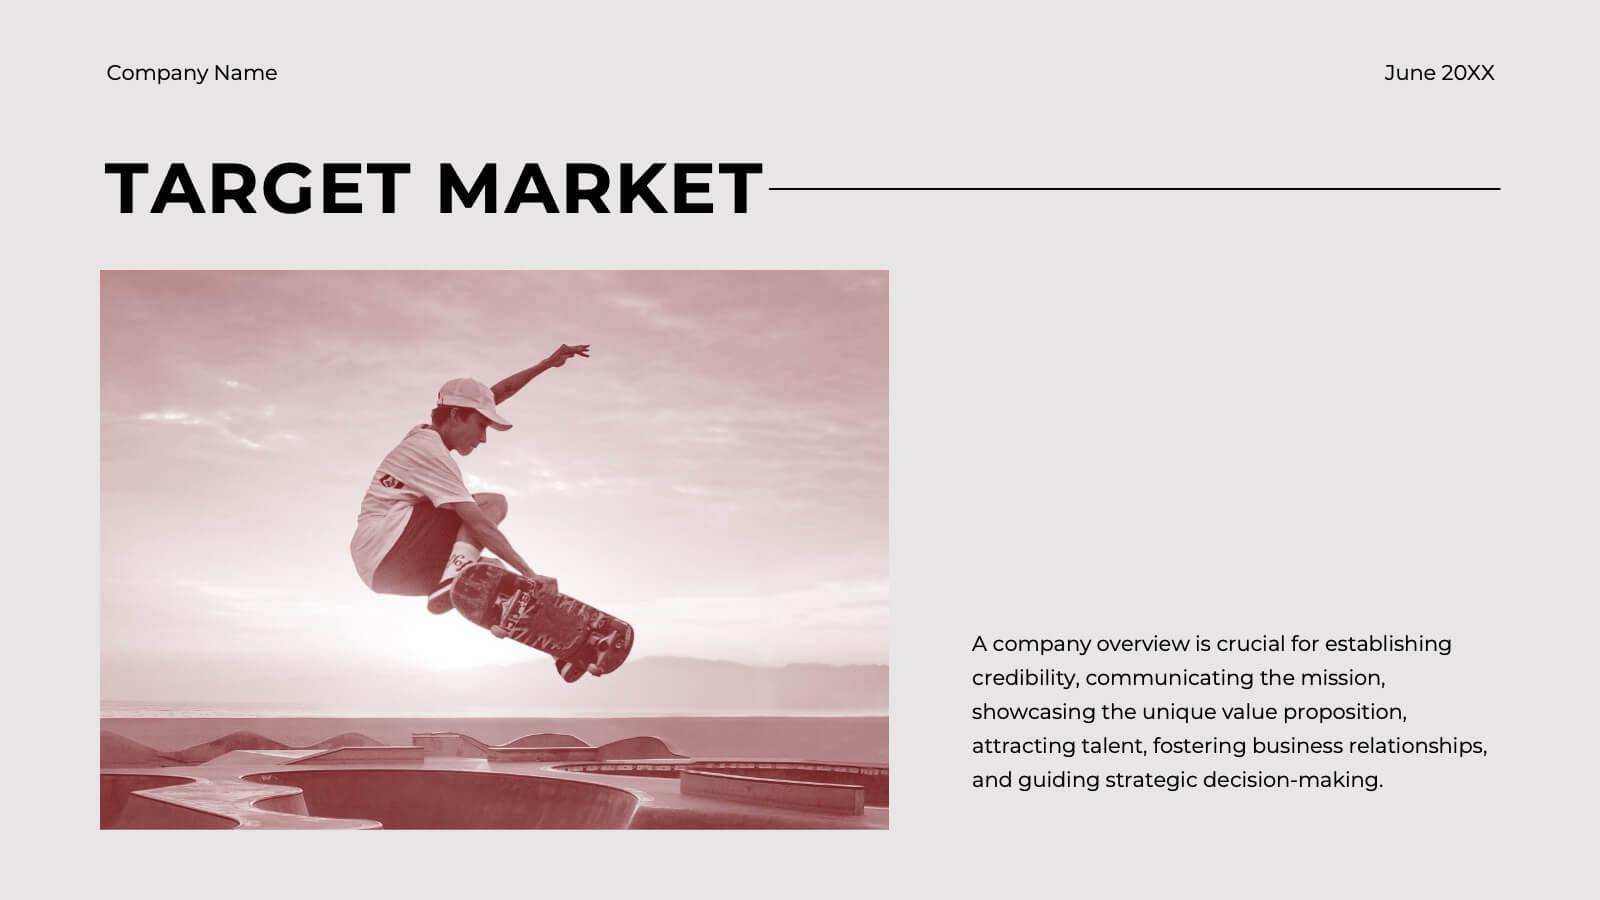
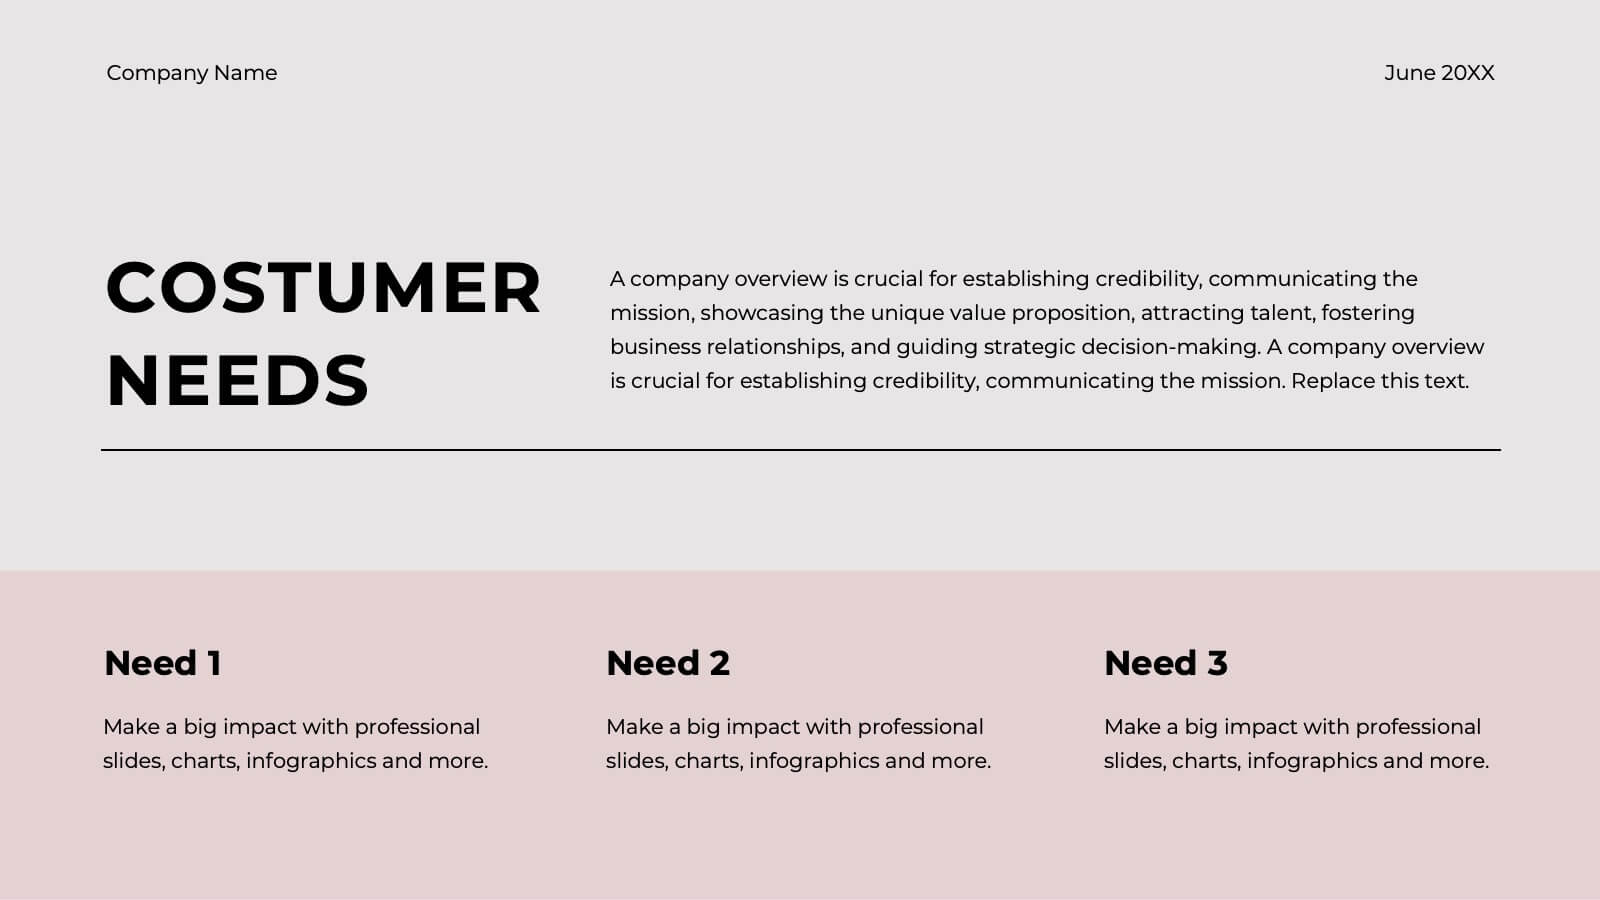
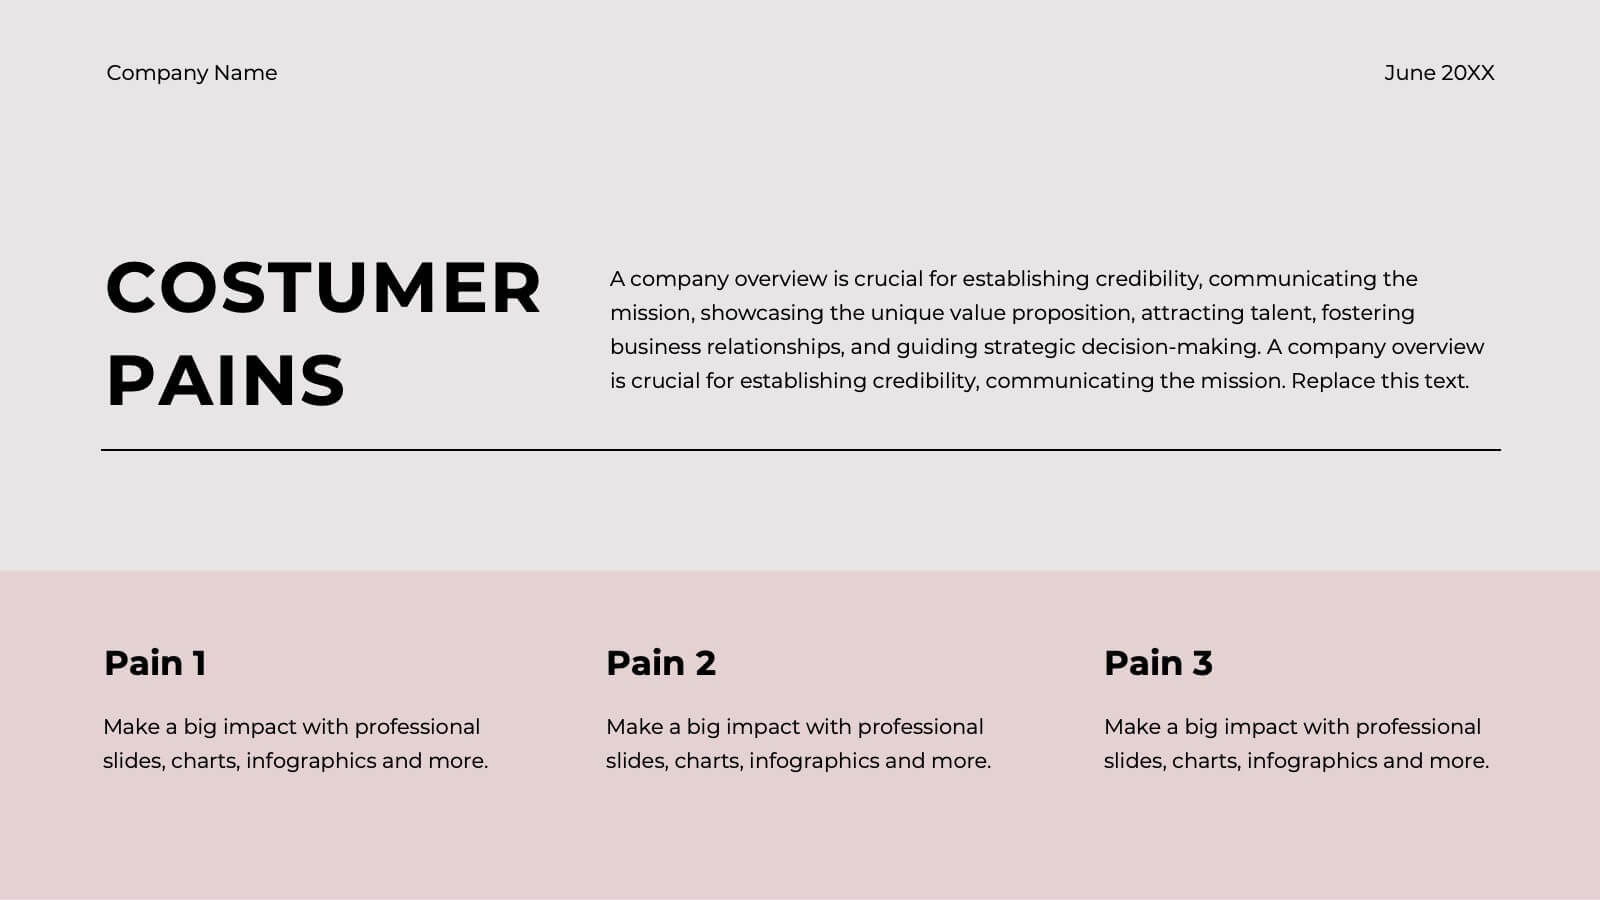
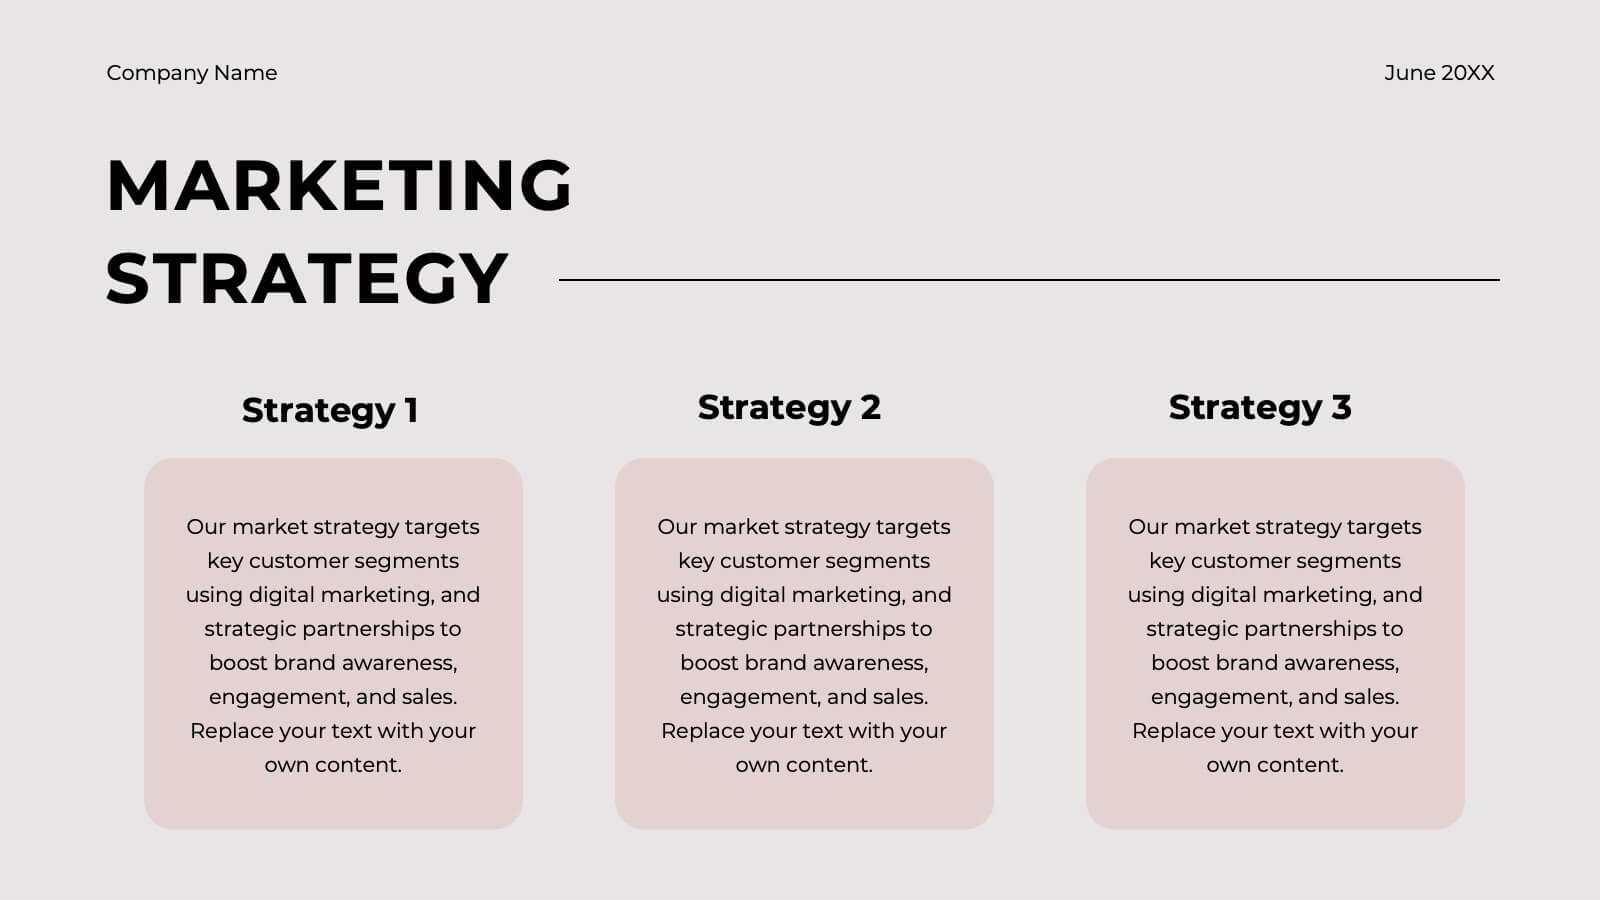
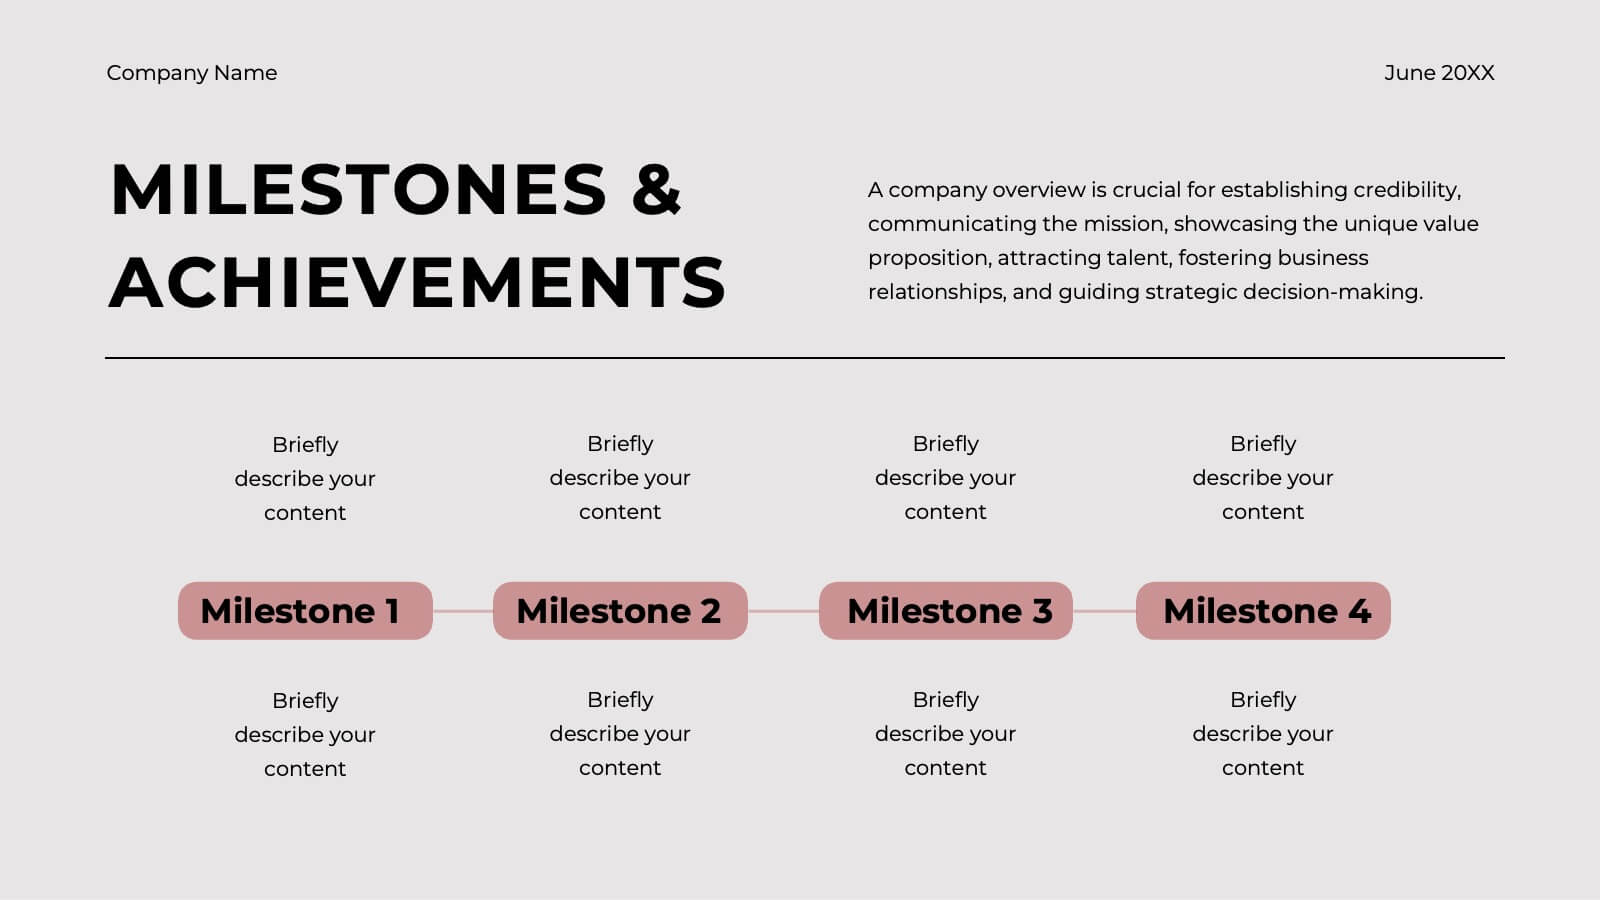
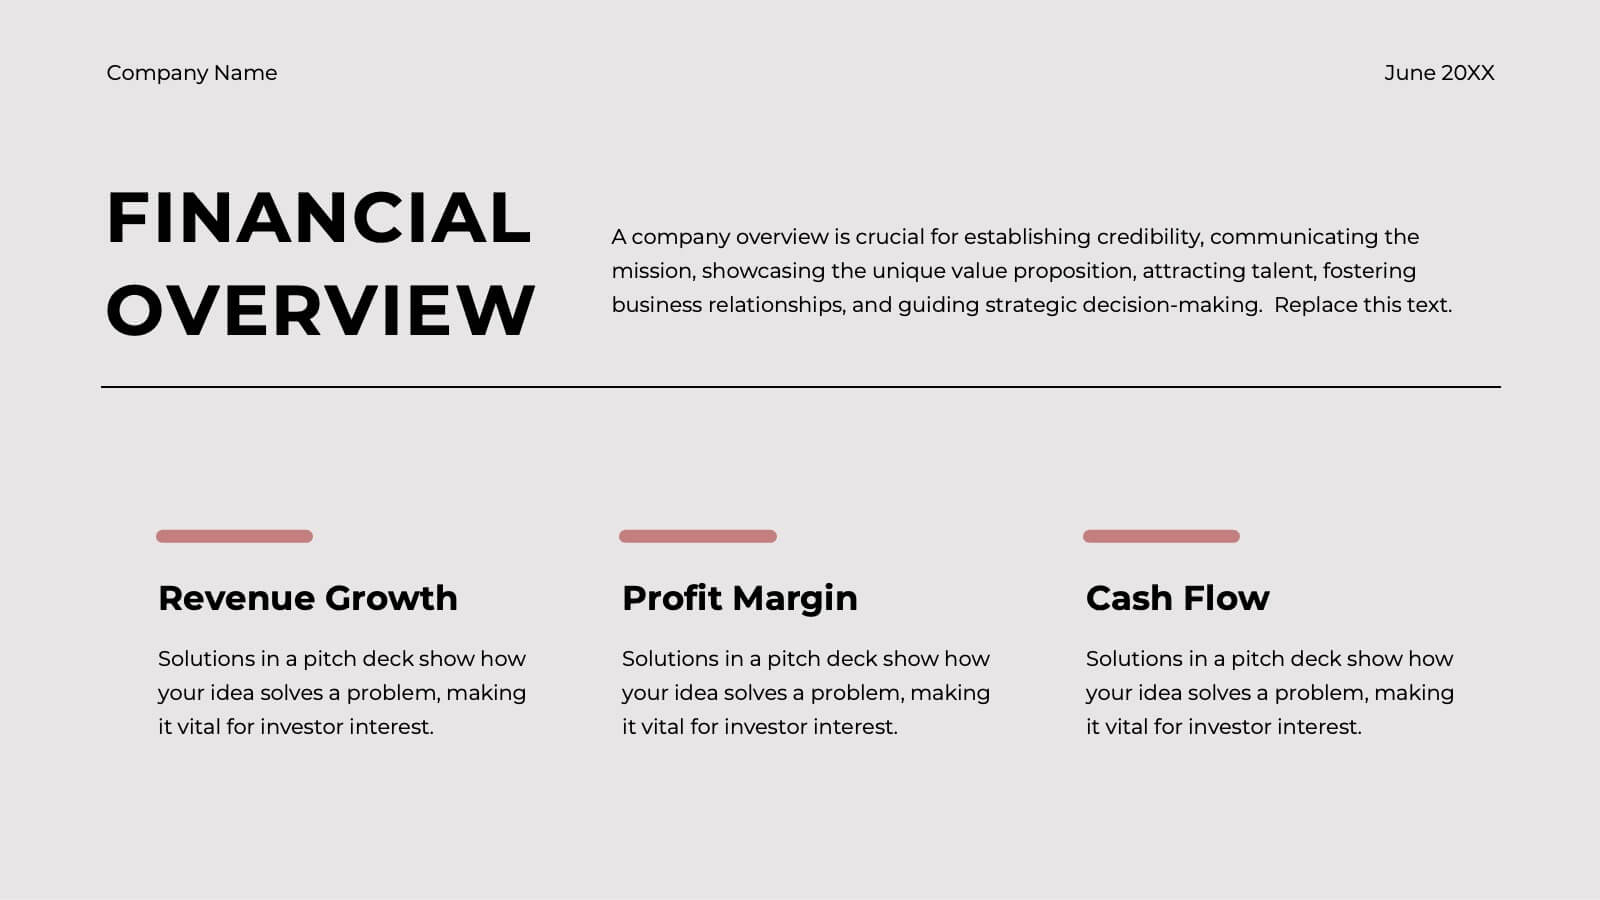
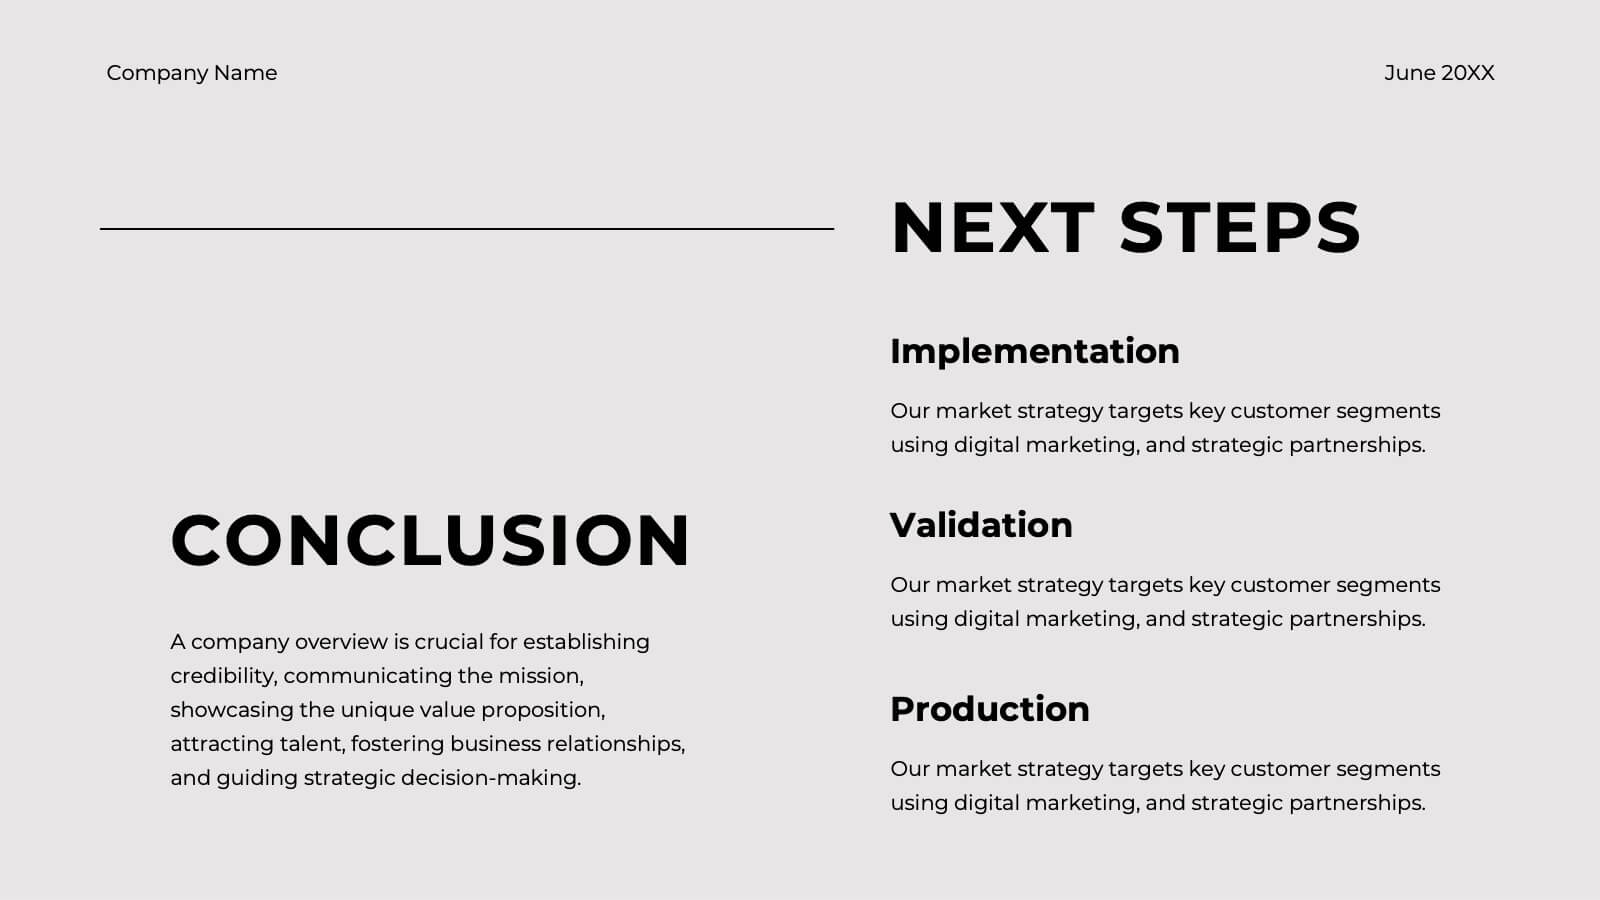
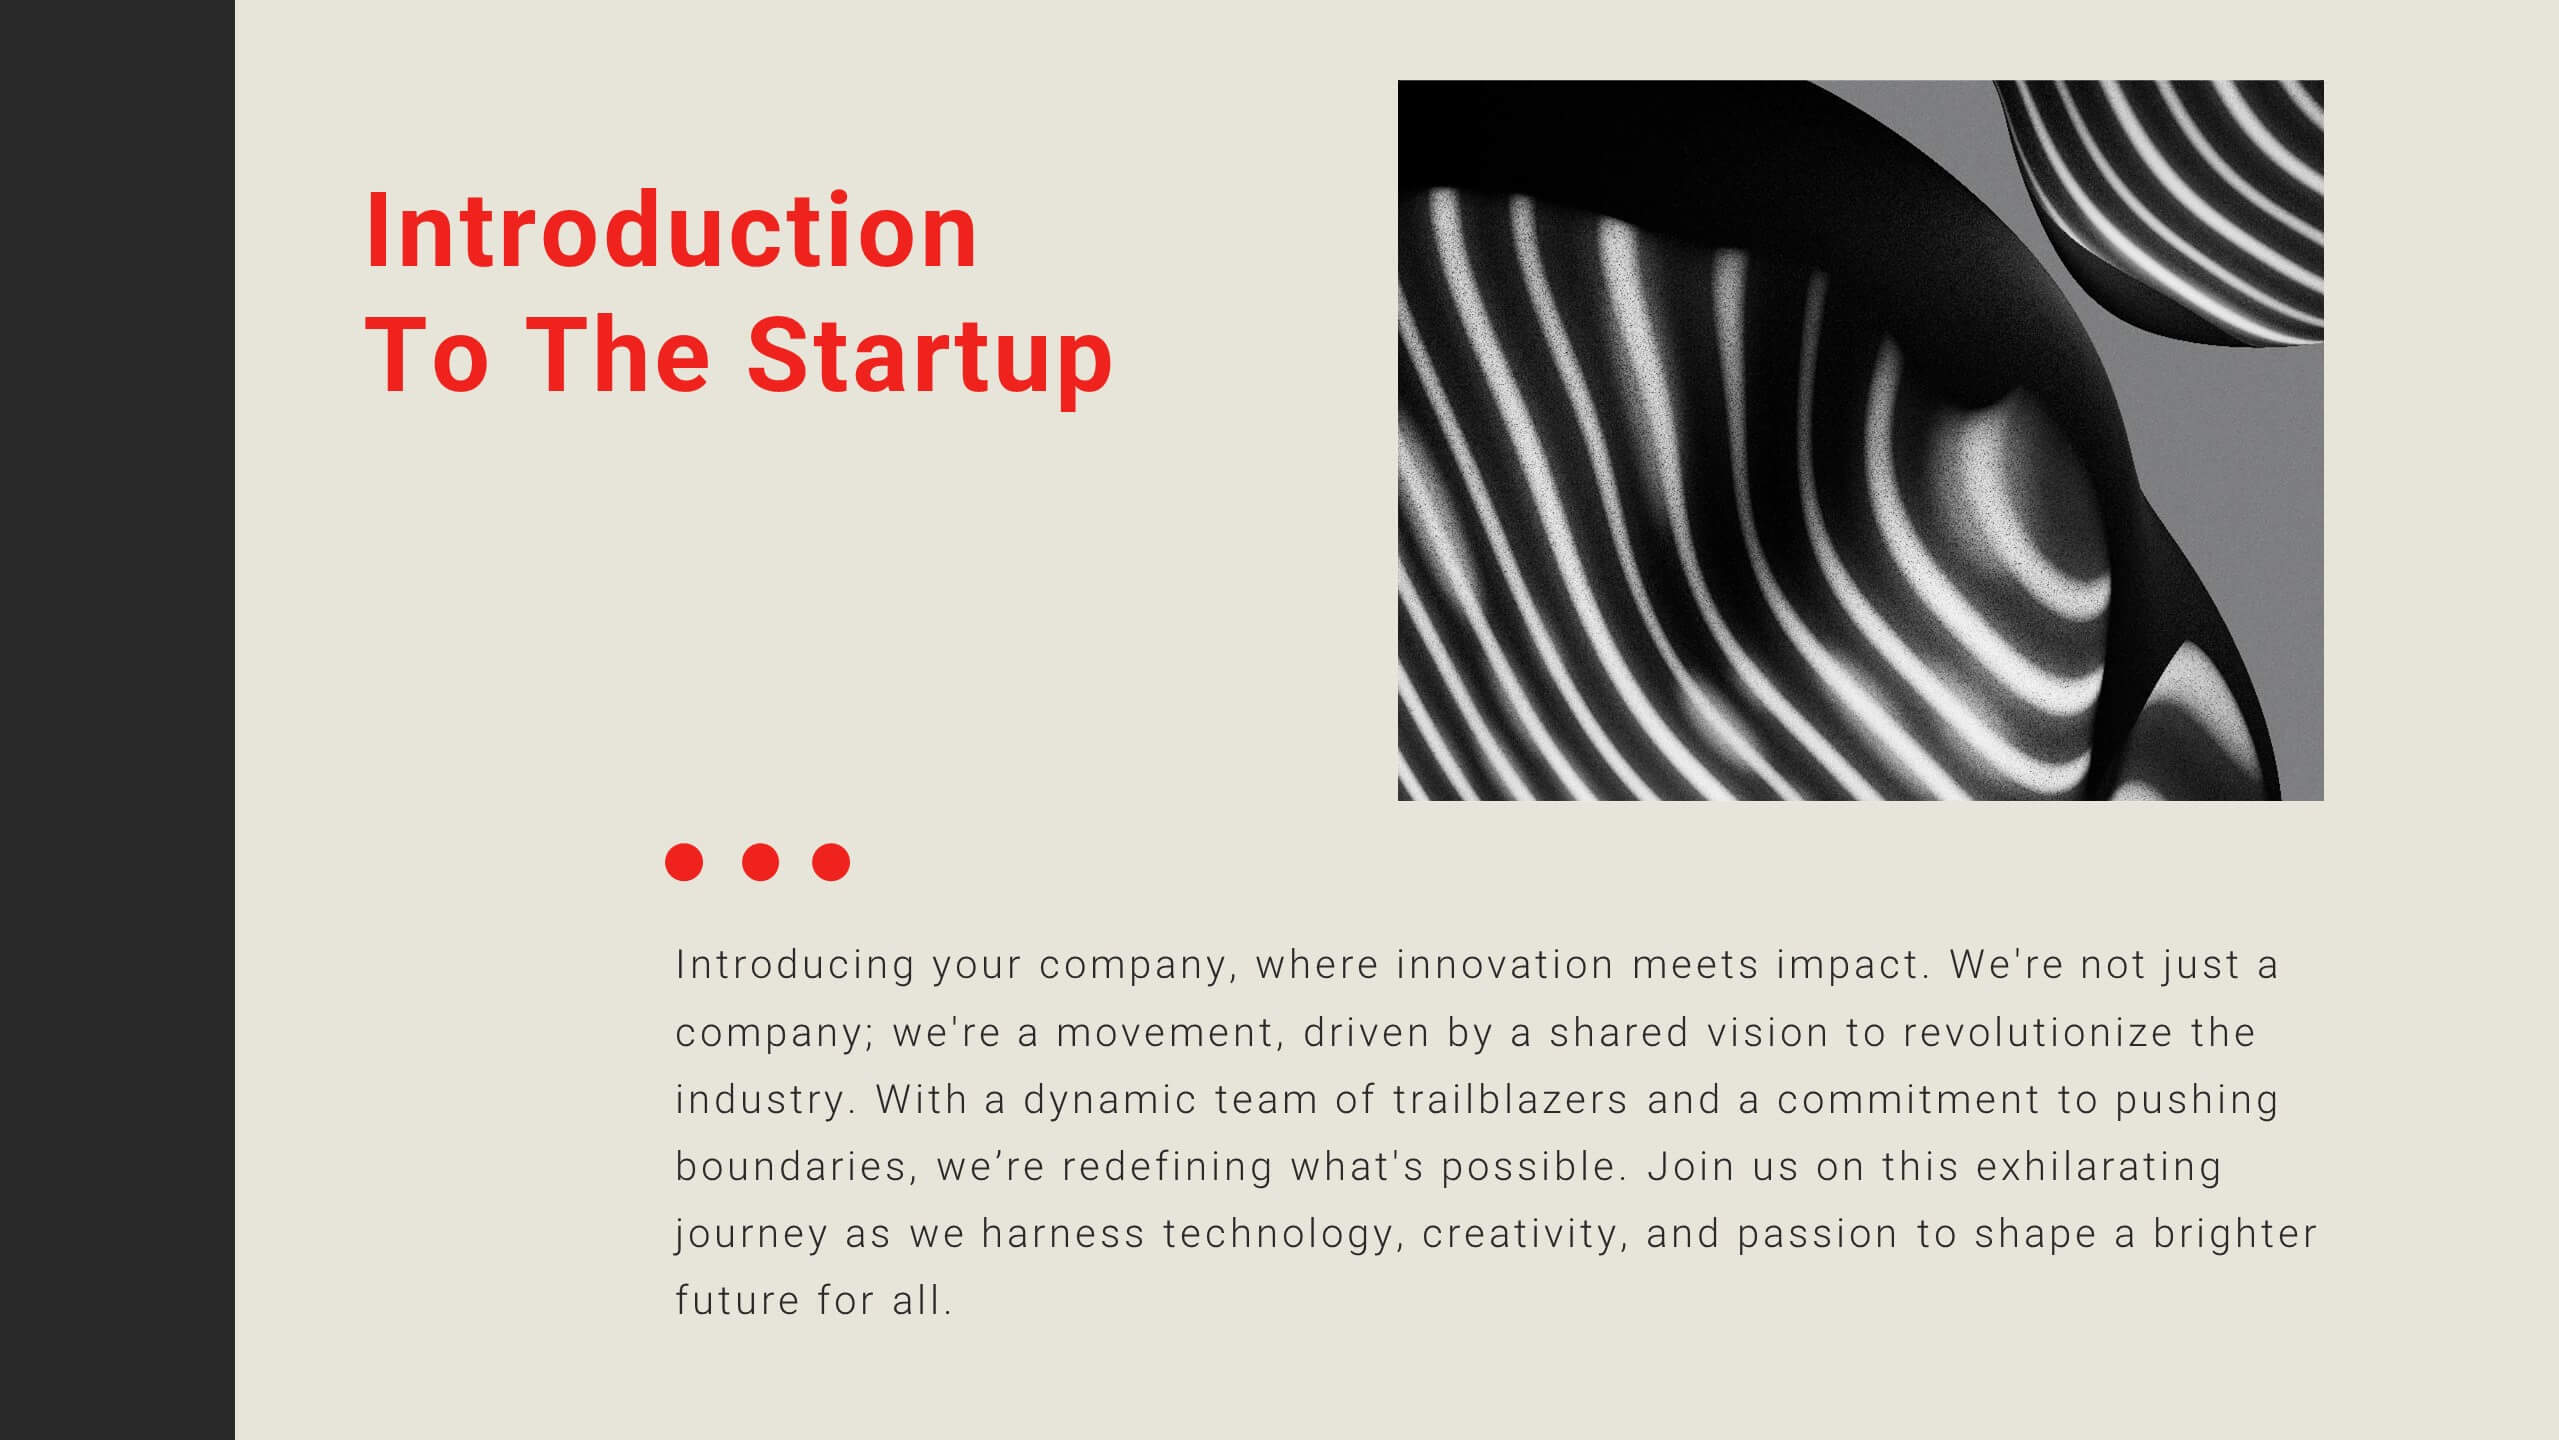
Ember Startup Growth Plan Presentation
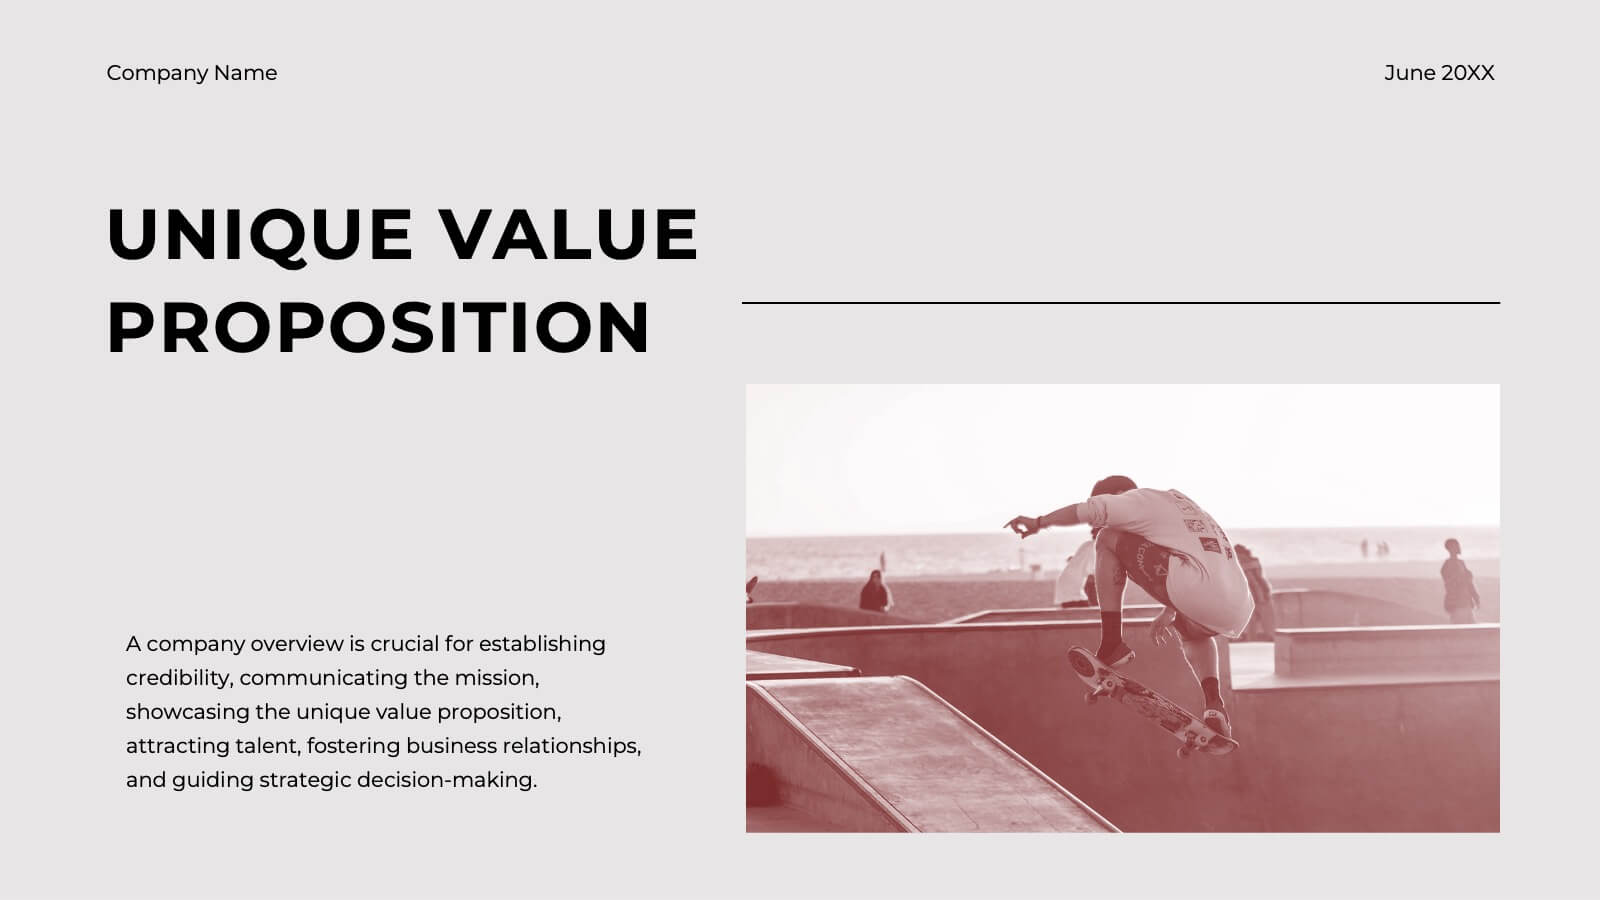
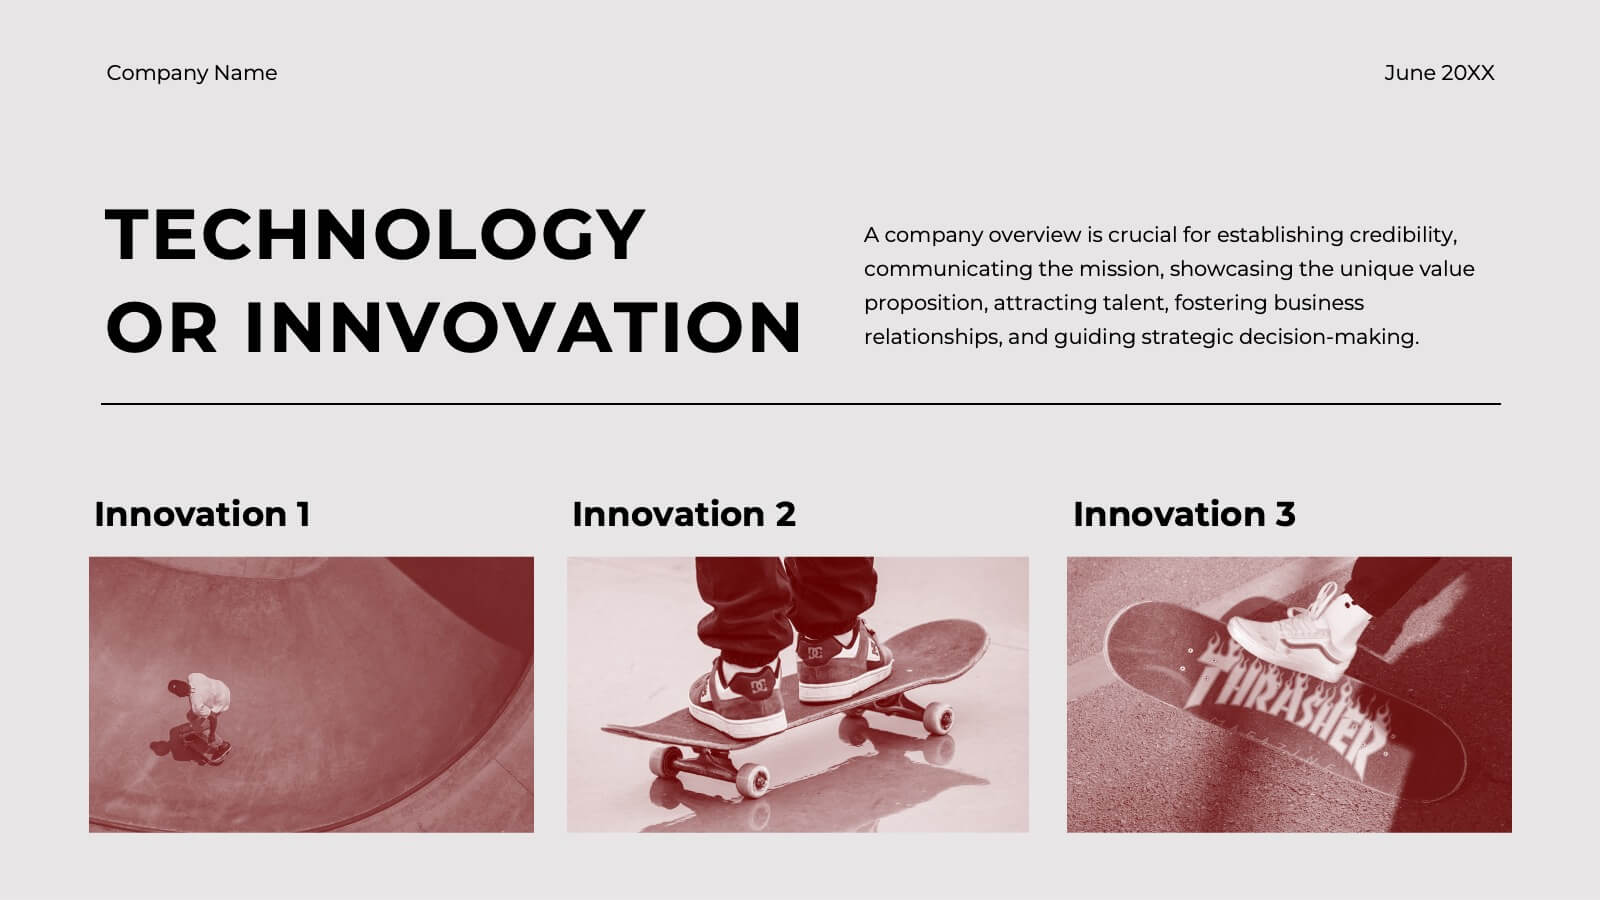
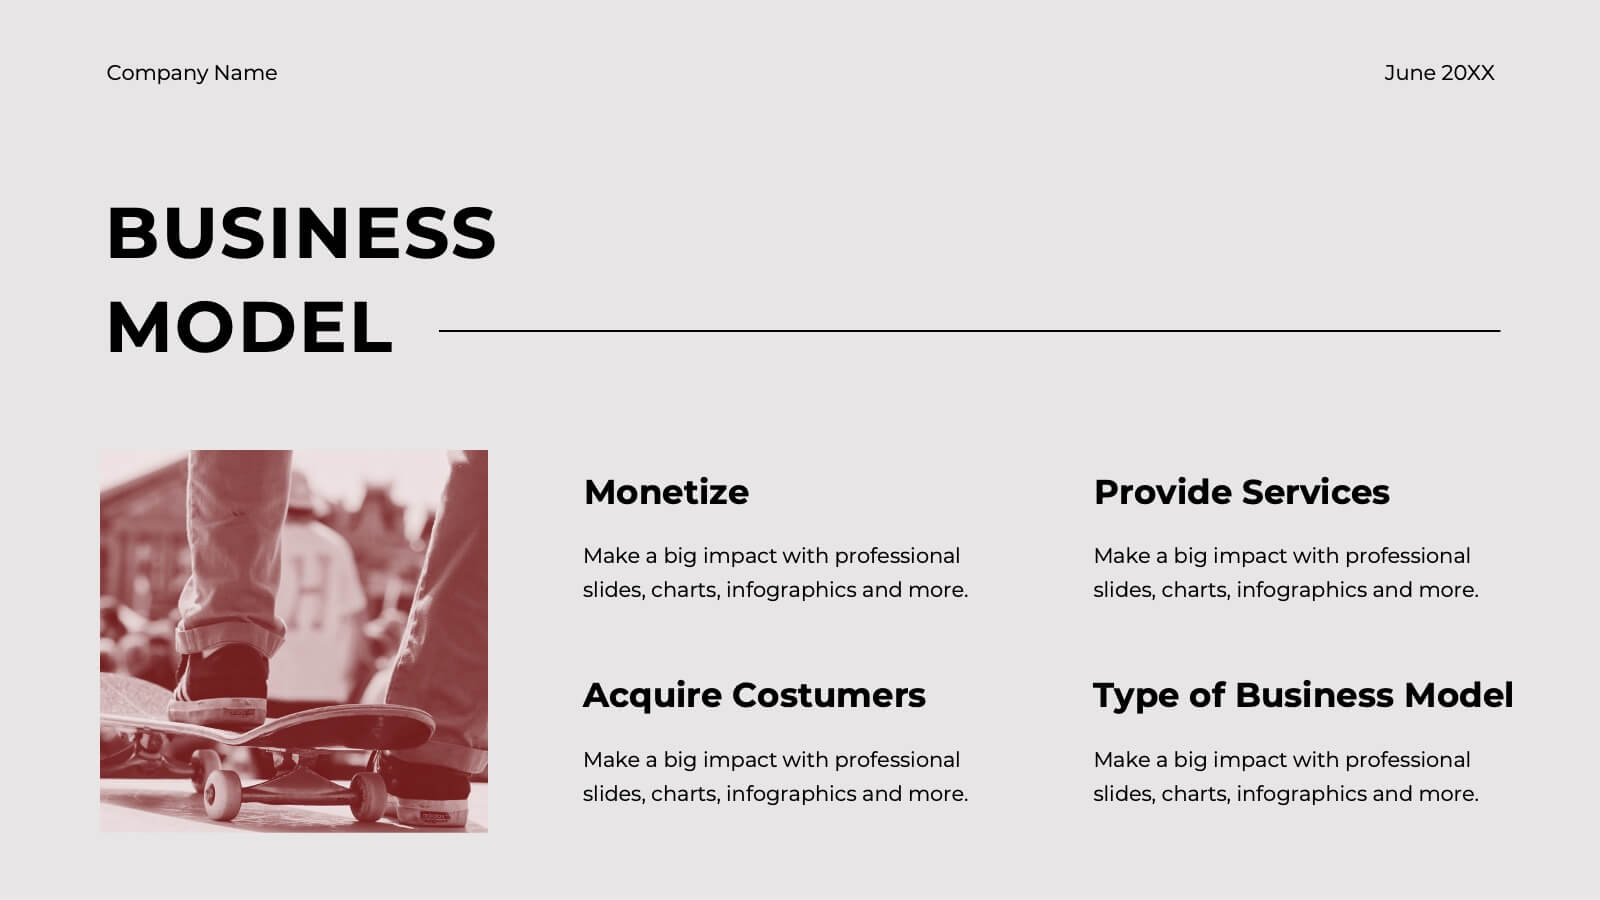
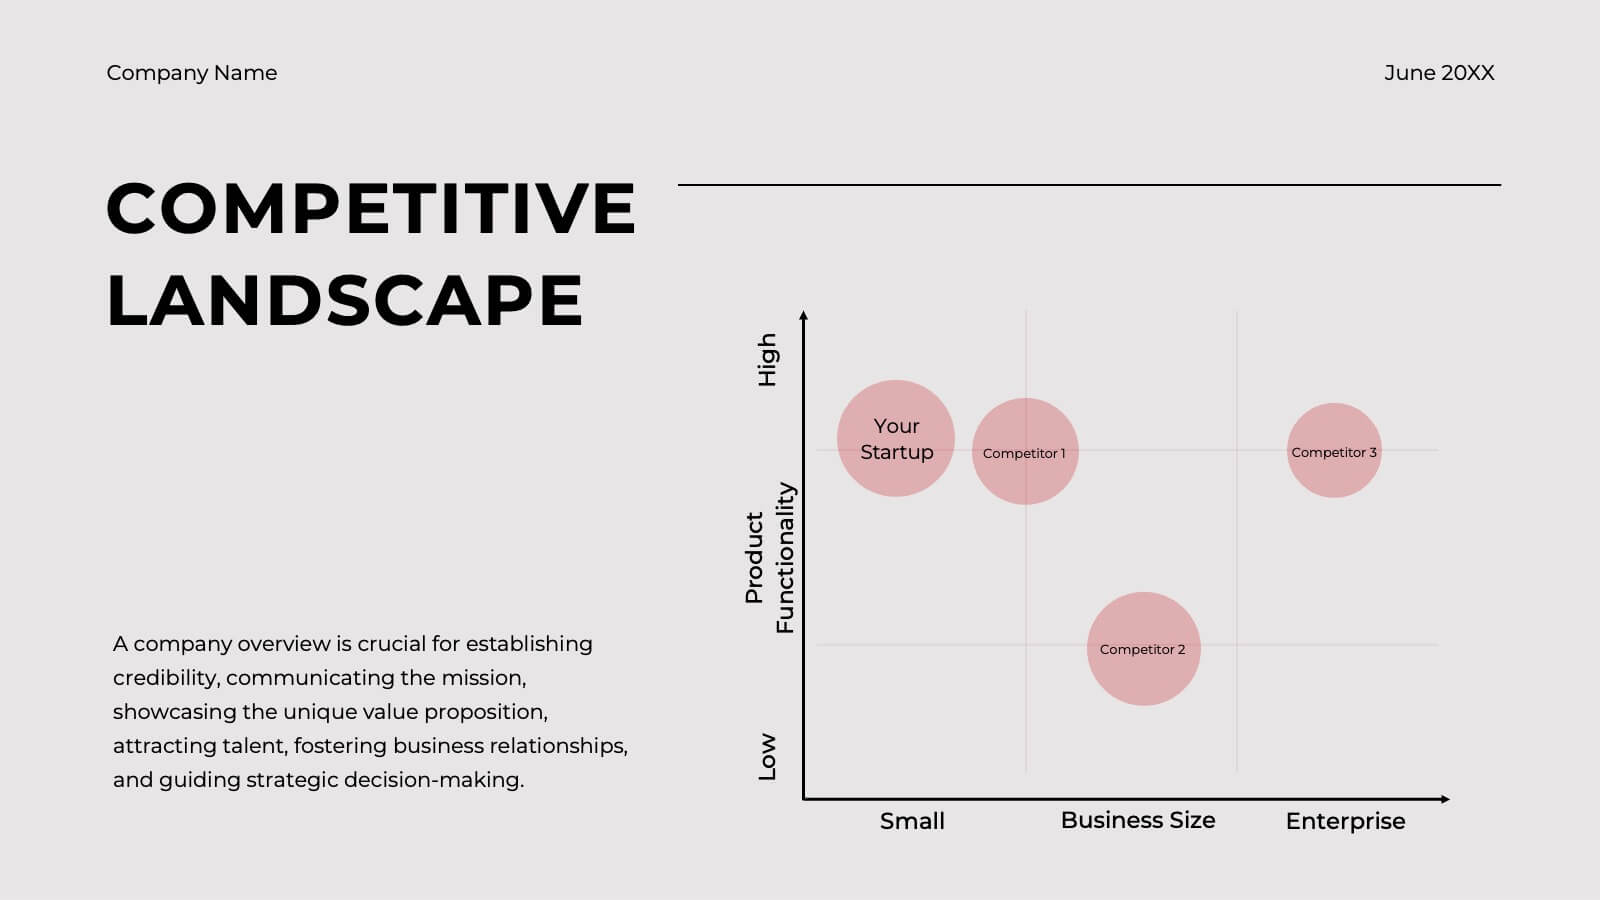
Launch your entrepreneurial journey with this dynamic startup plan template! Perfect for detailing your mission, market strategy, and unique value proposition, it features professional slides for customer analysis, business models, and financial projections. Present your innovative ideas clearly and convincingly. Compatible with PowerPoint, Keynote, and Google Slides for seamless presentations on any platform.
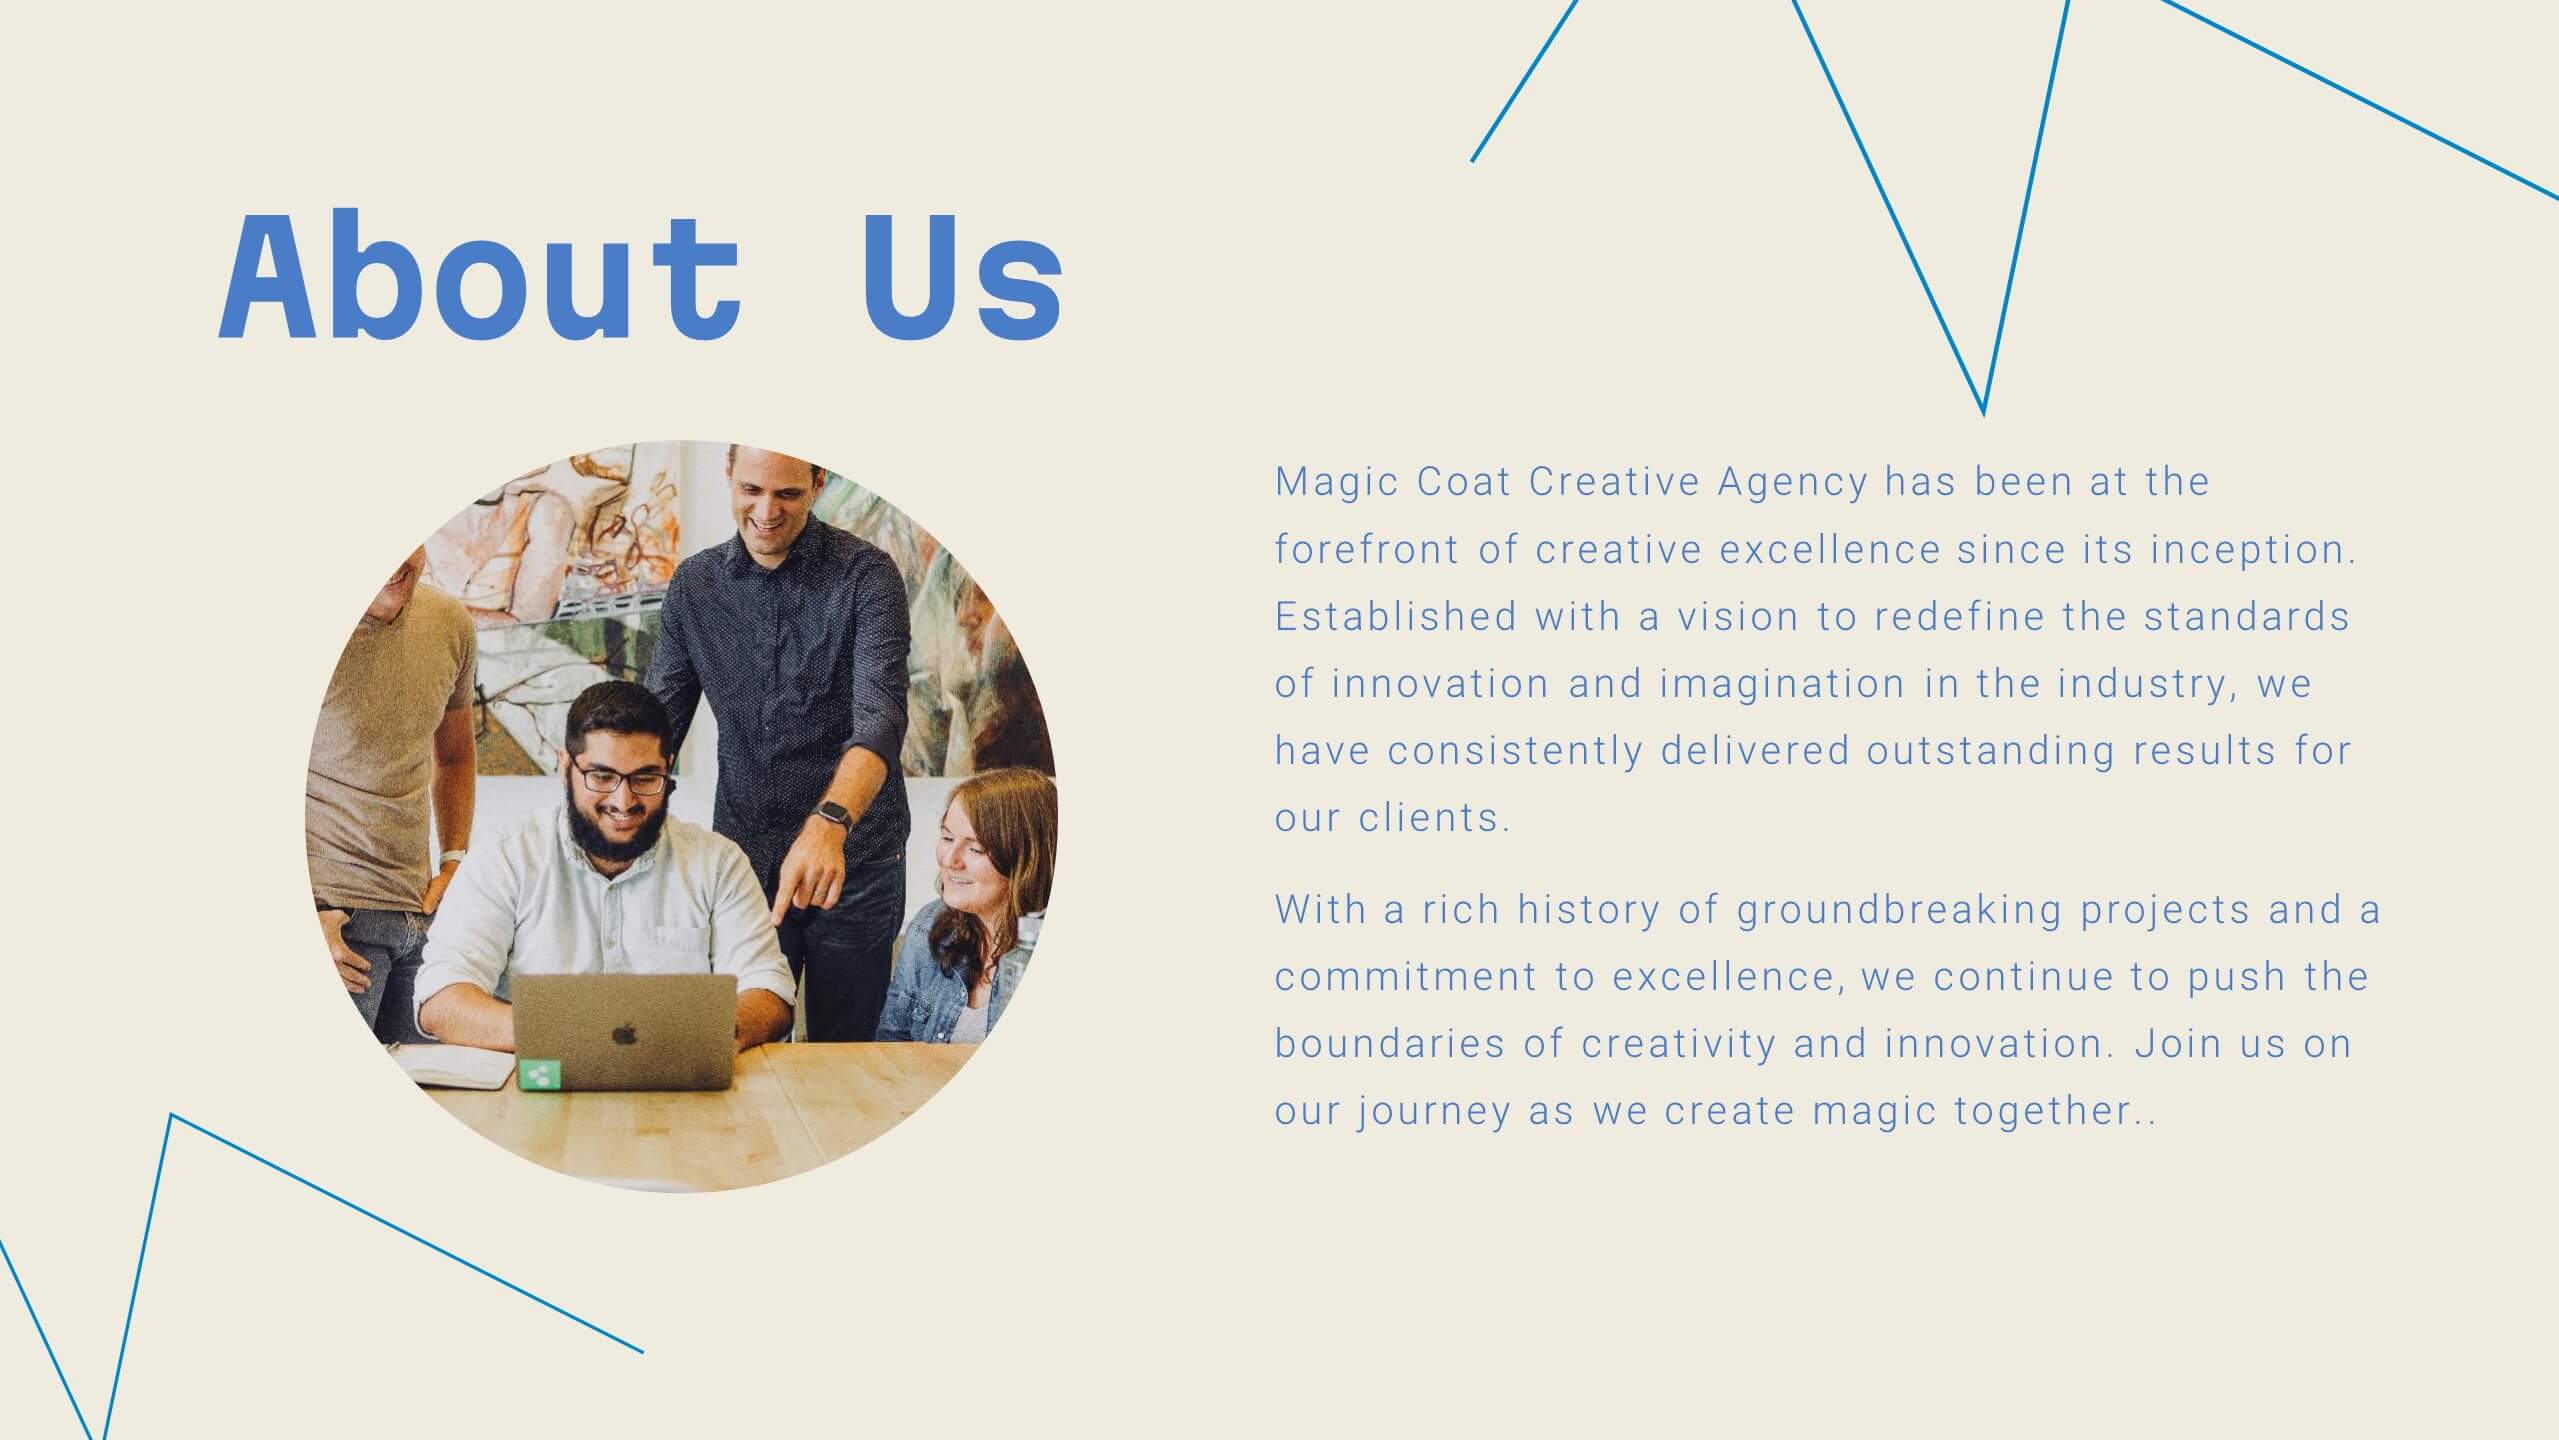
22 slides
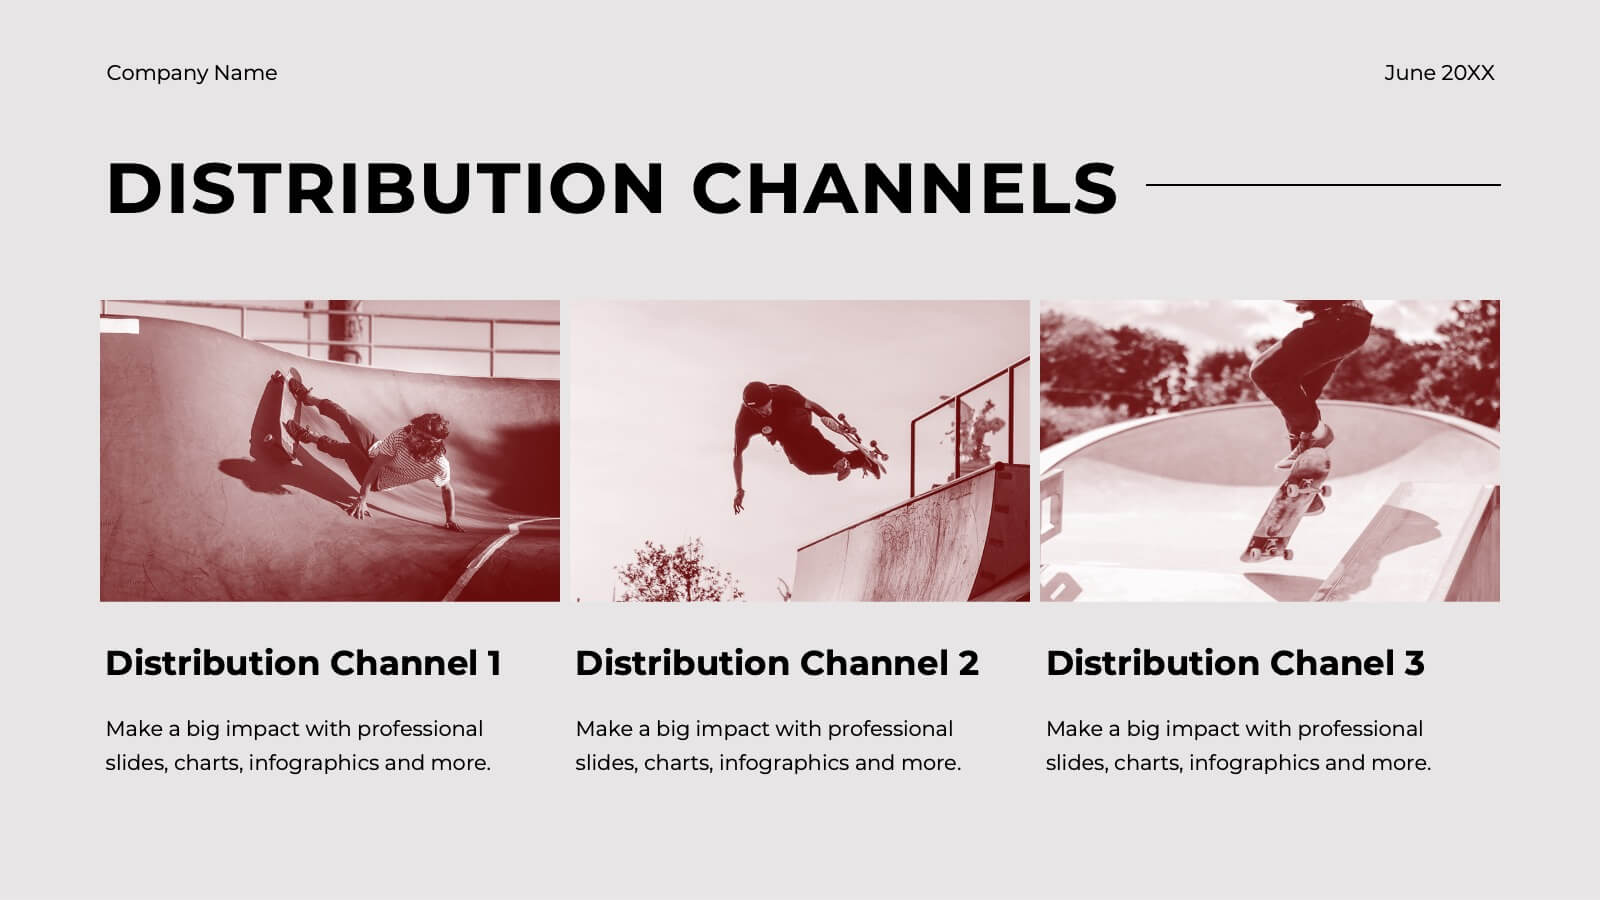
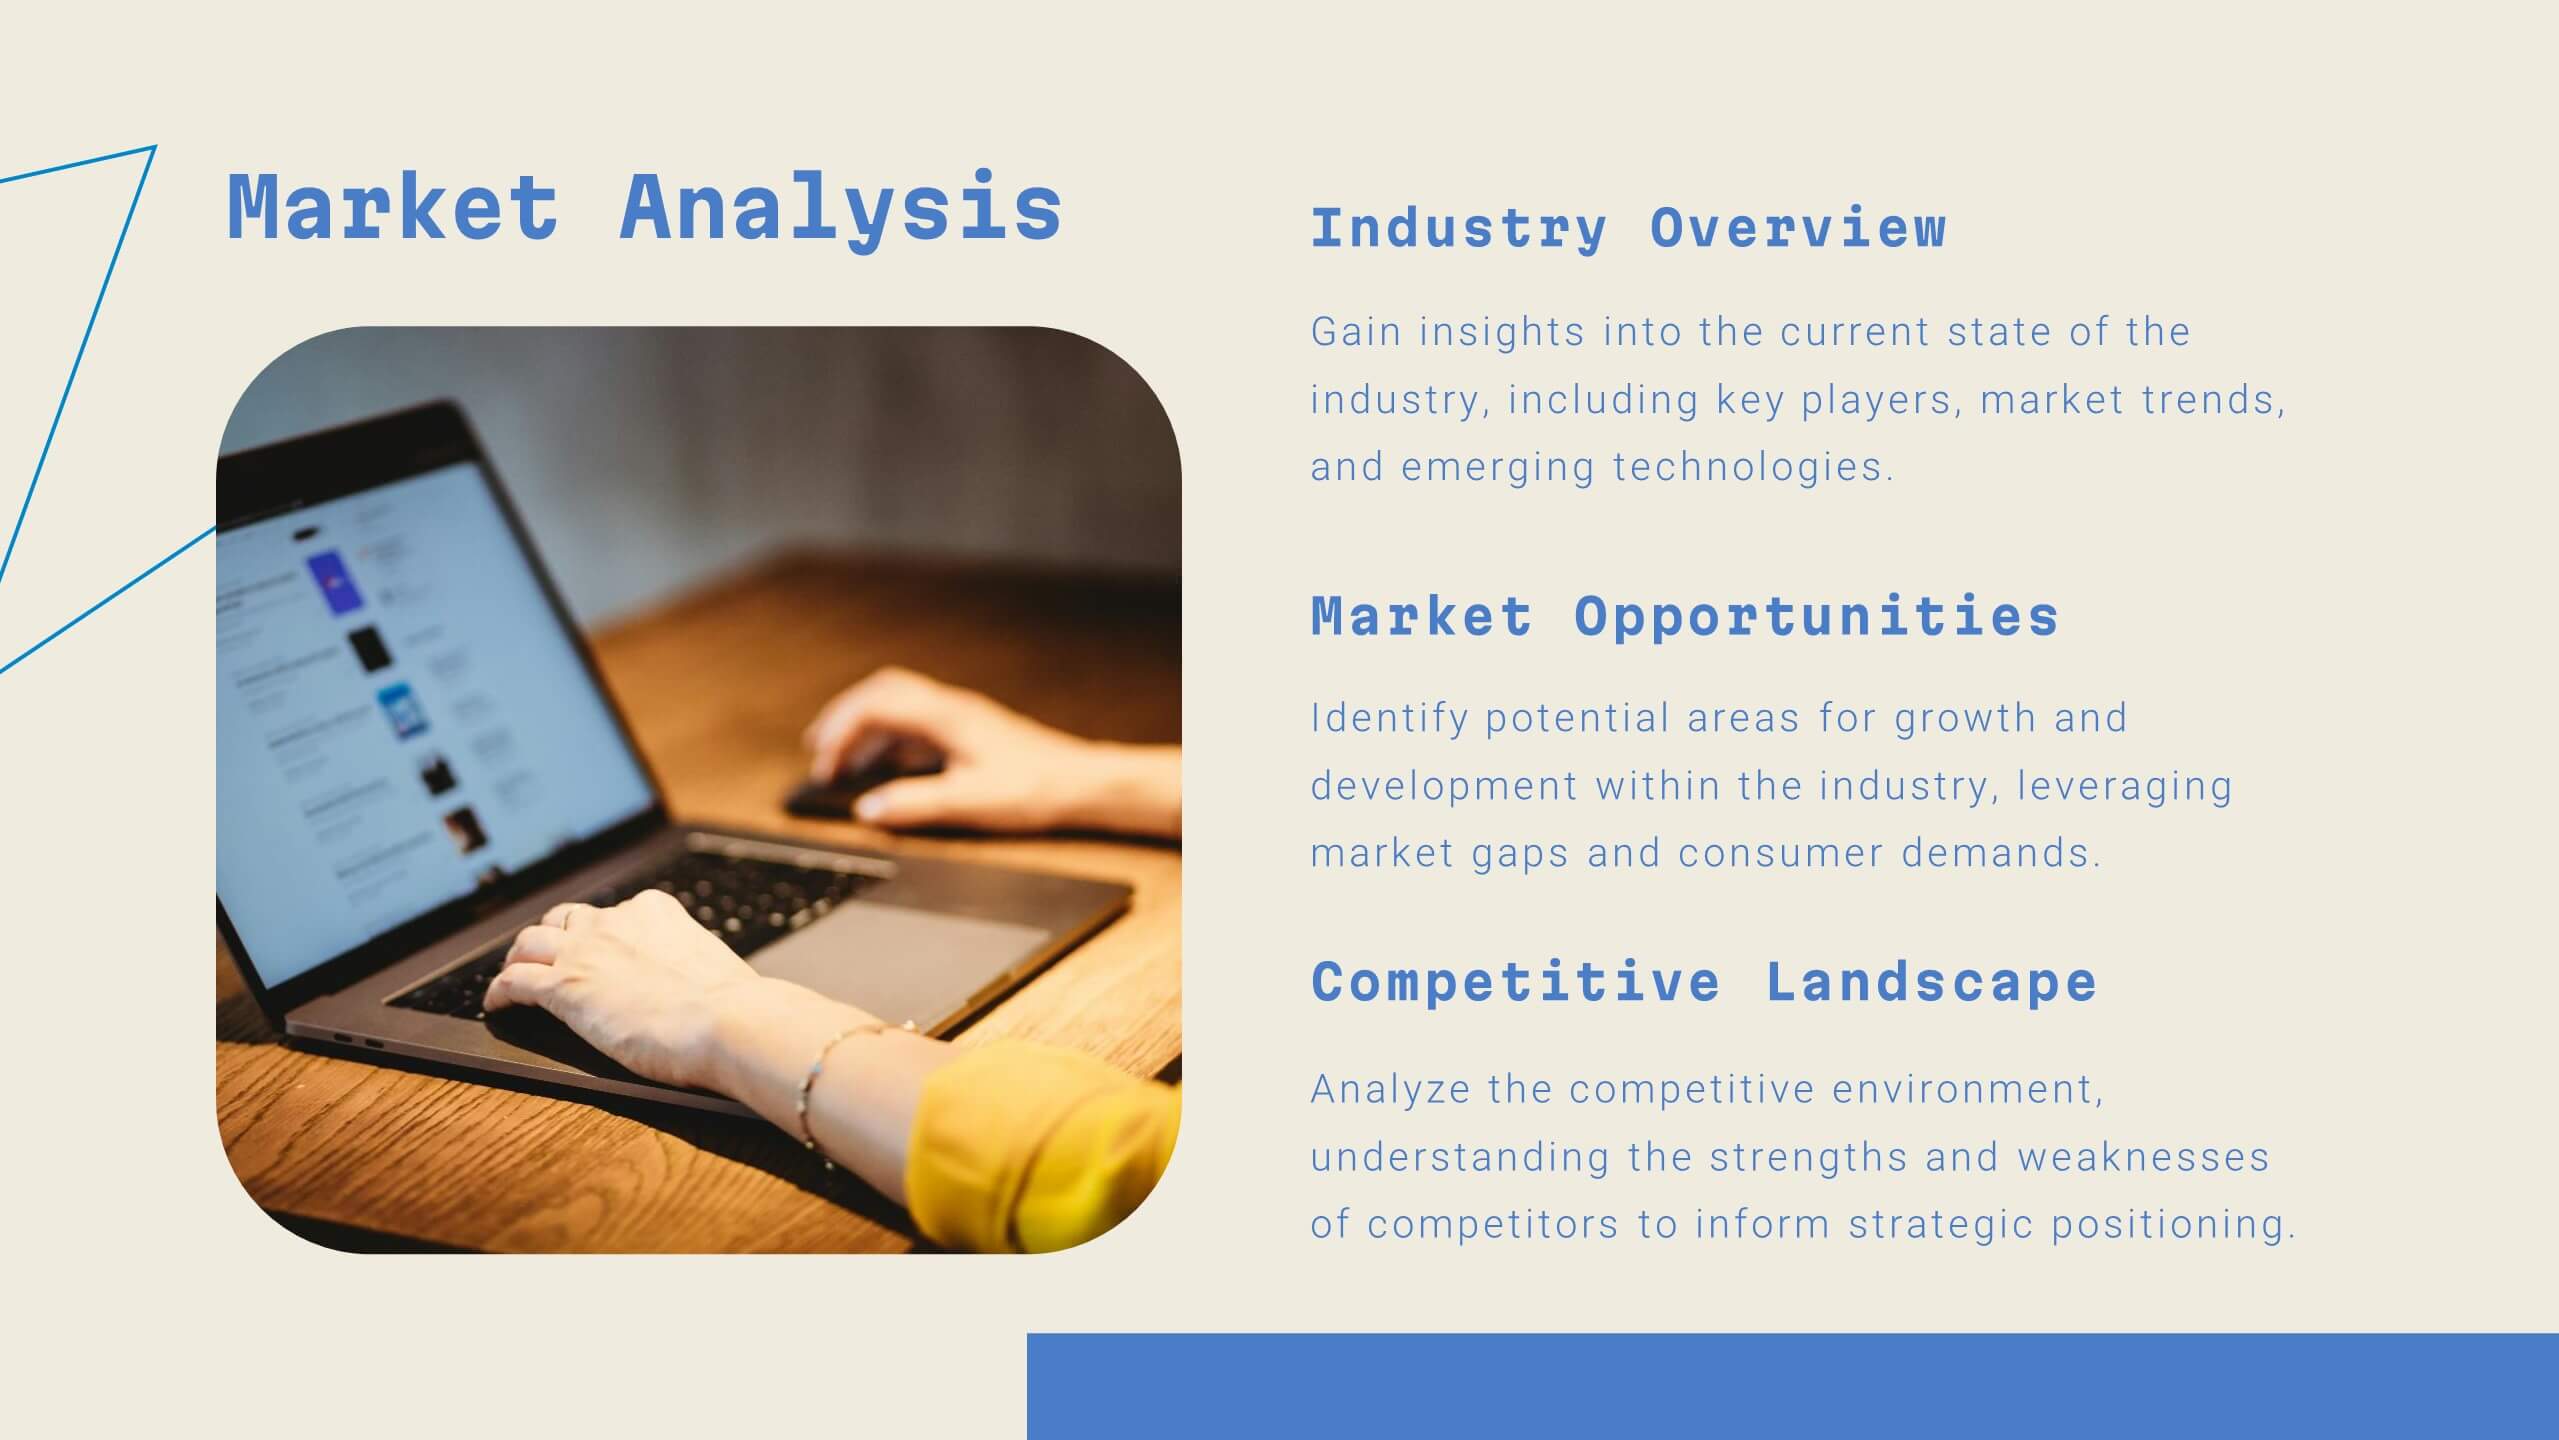
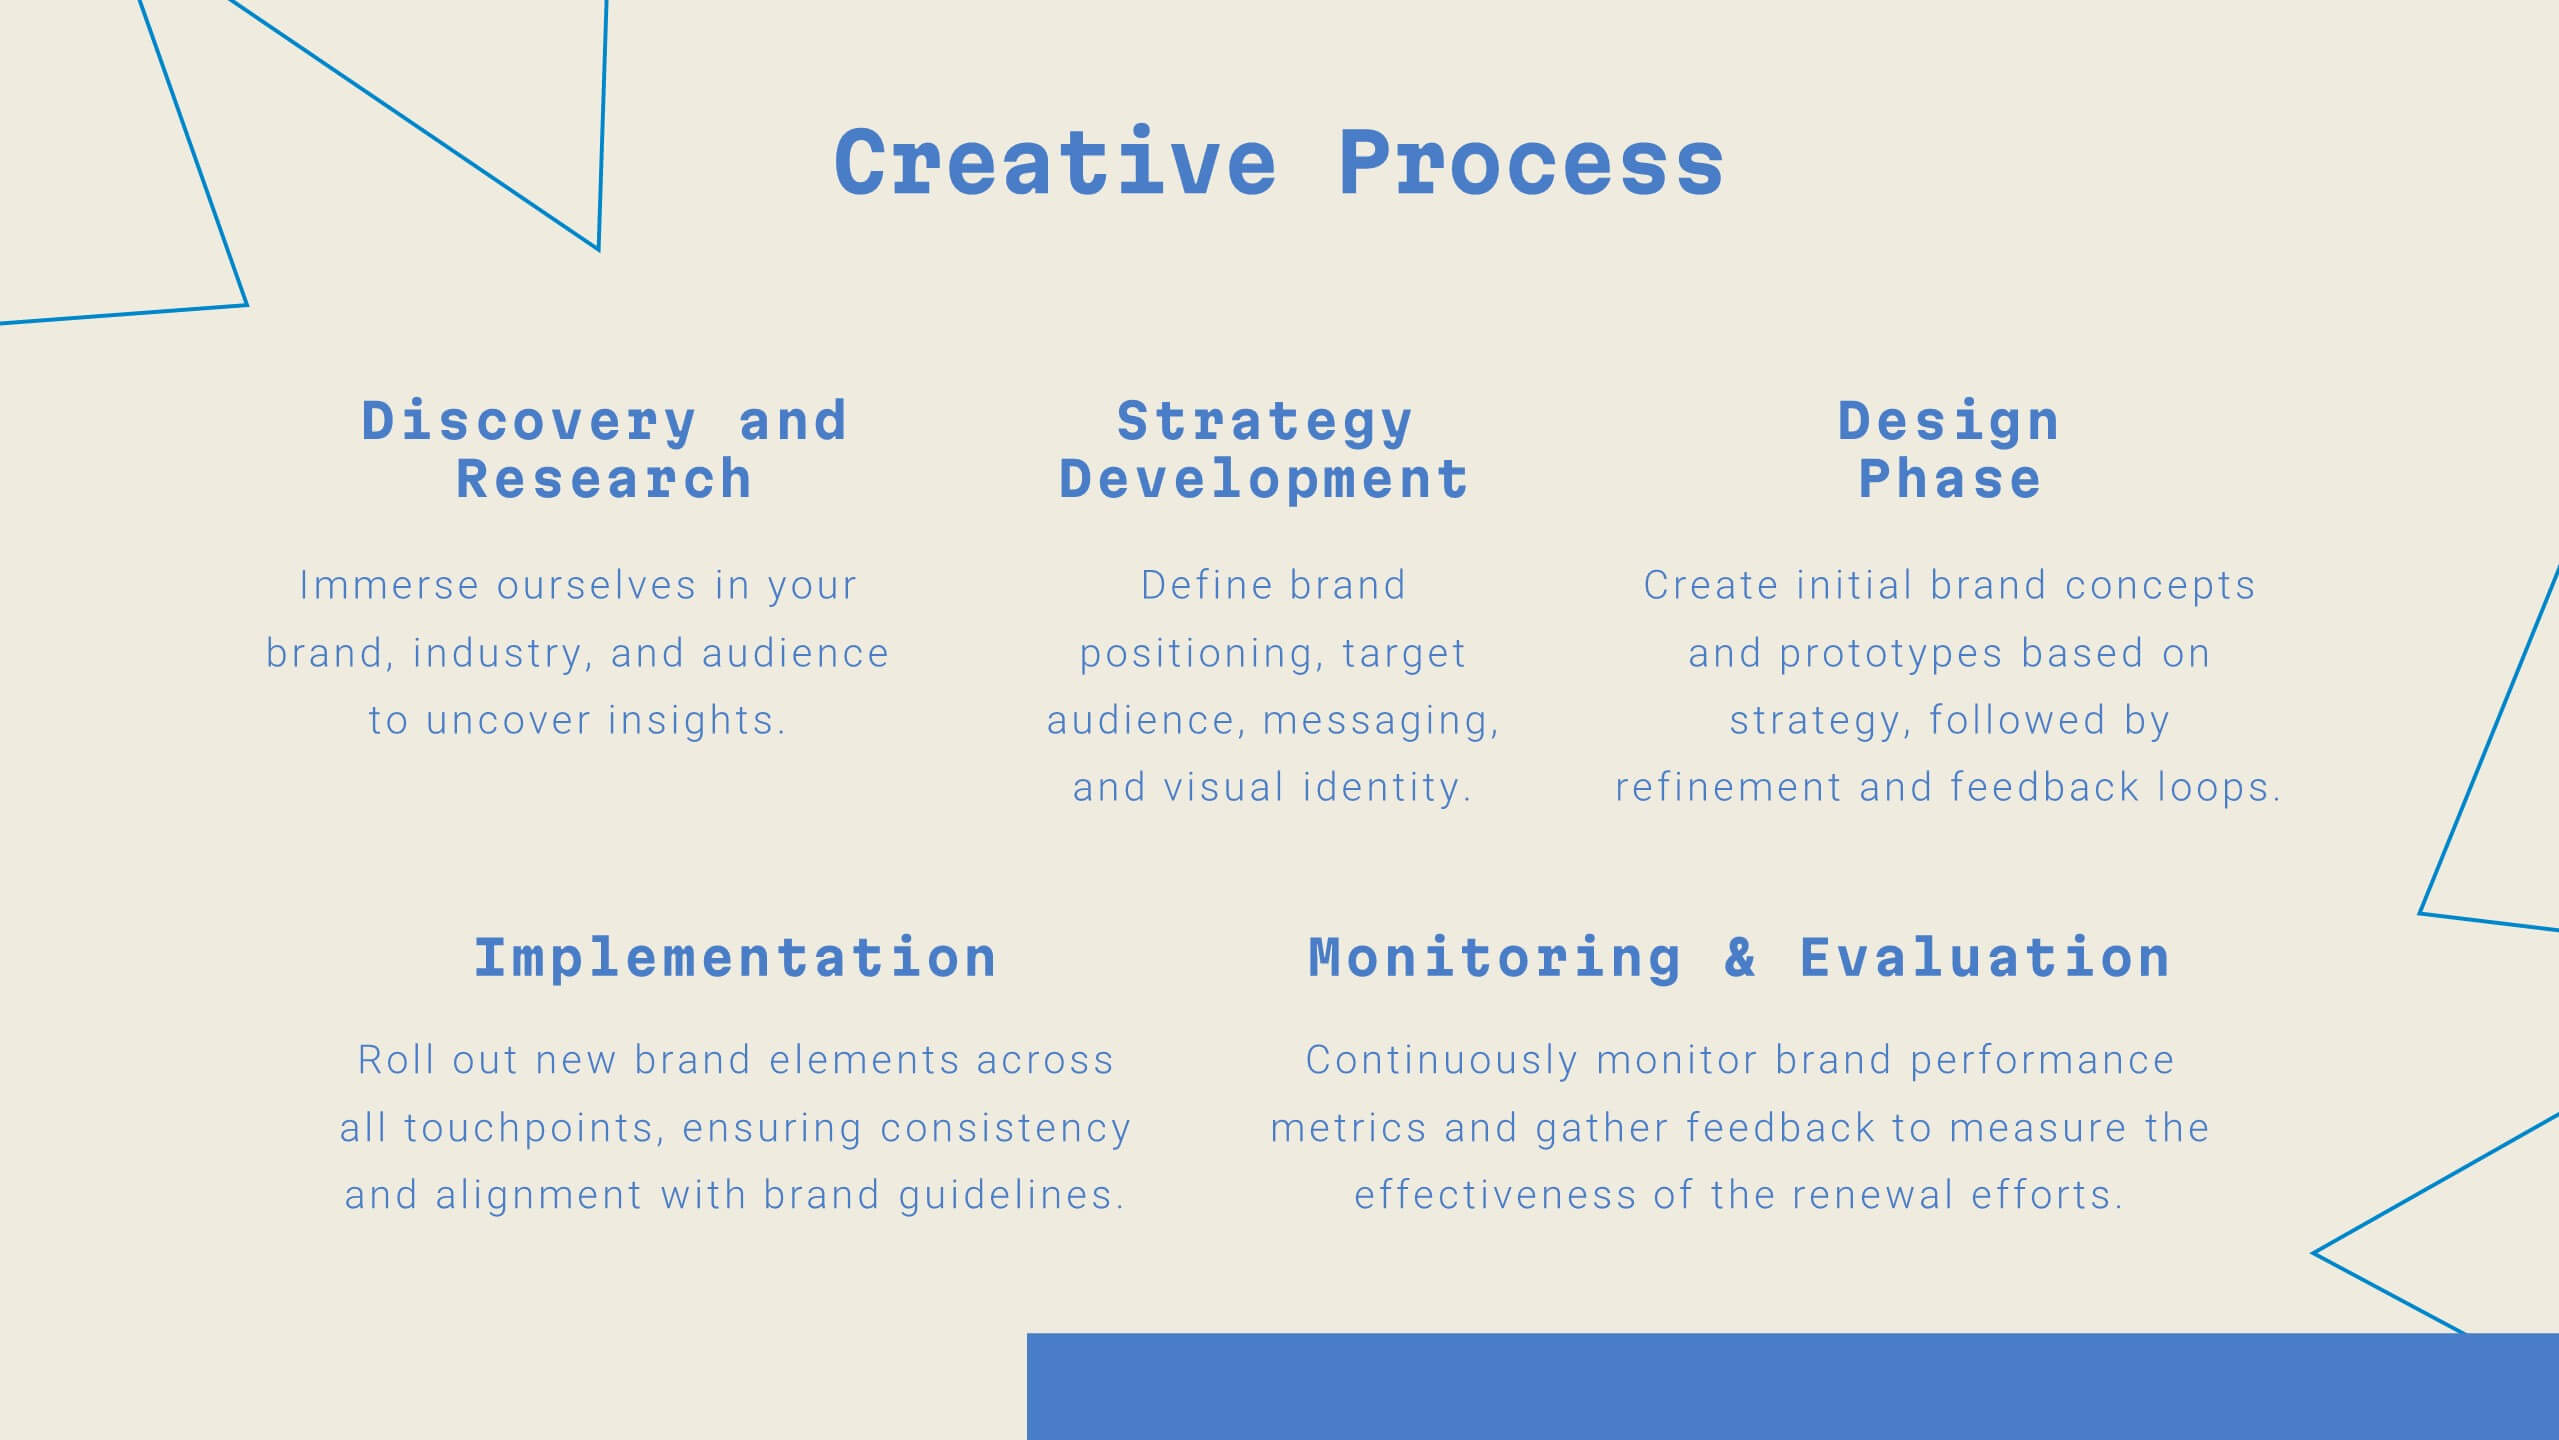
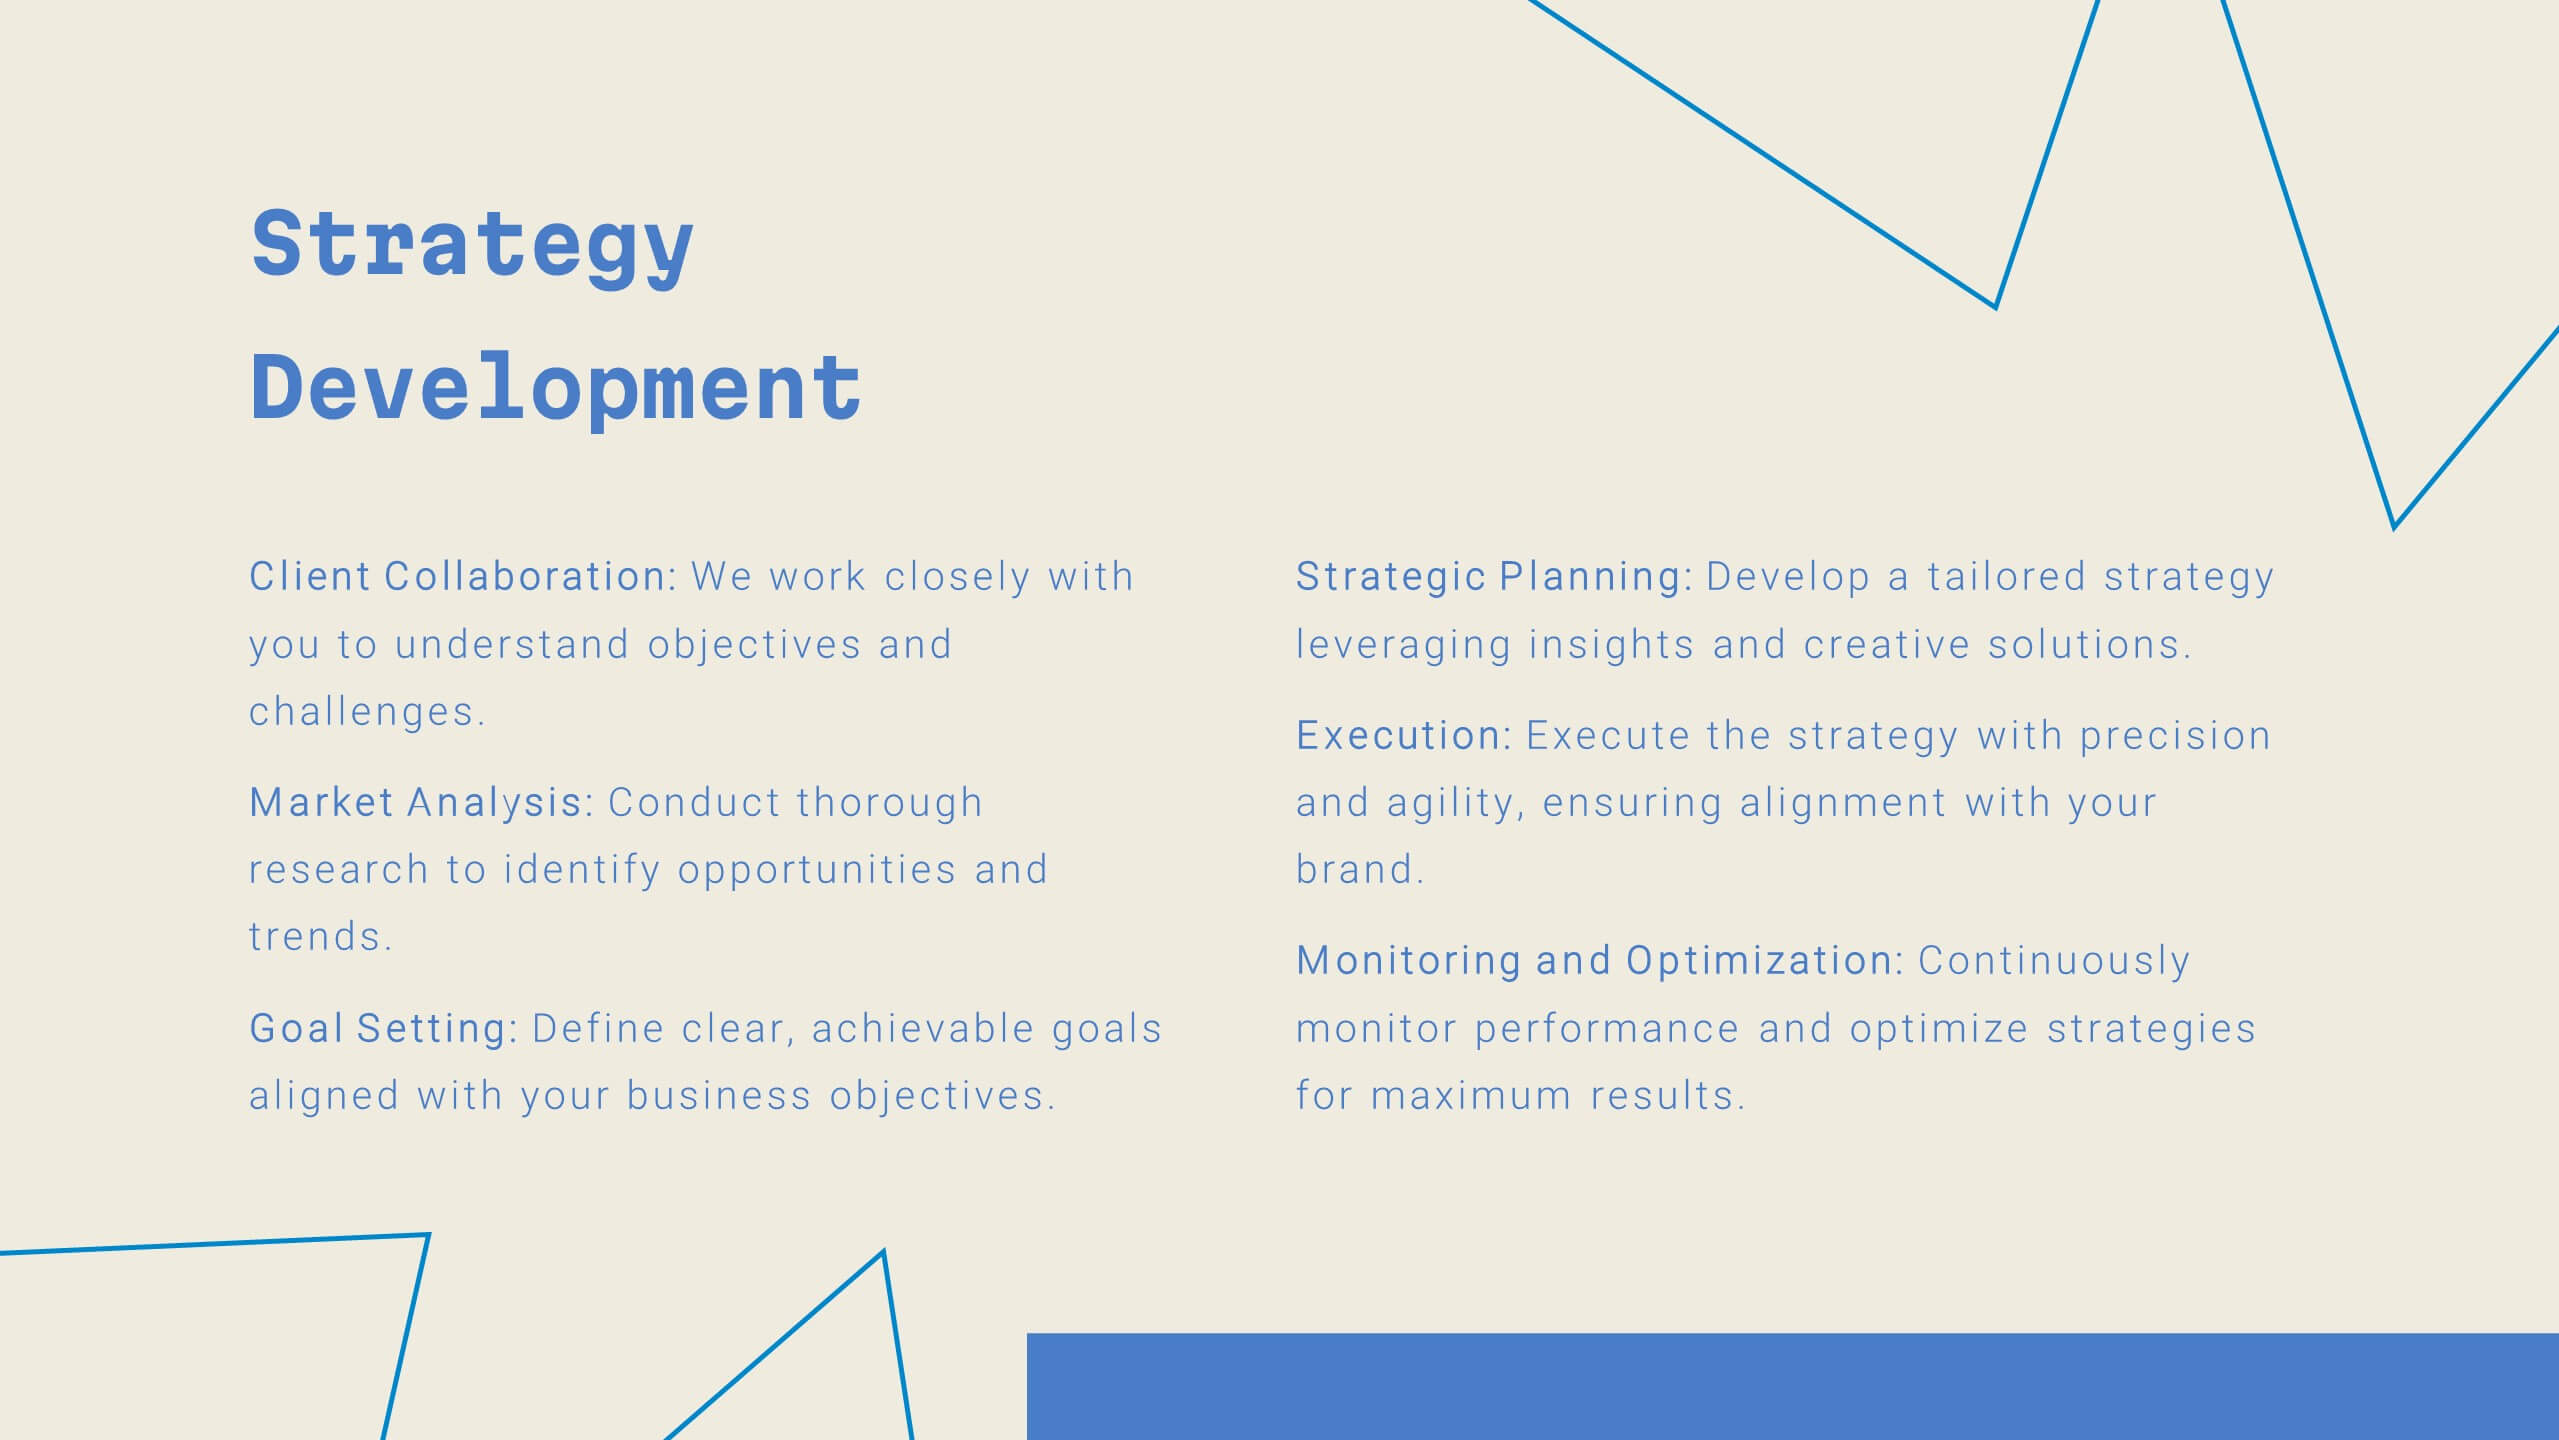
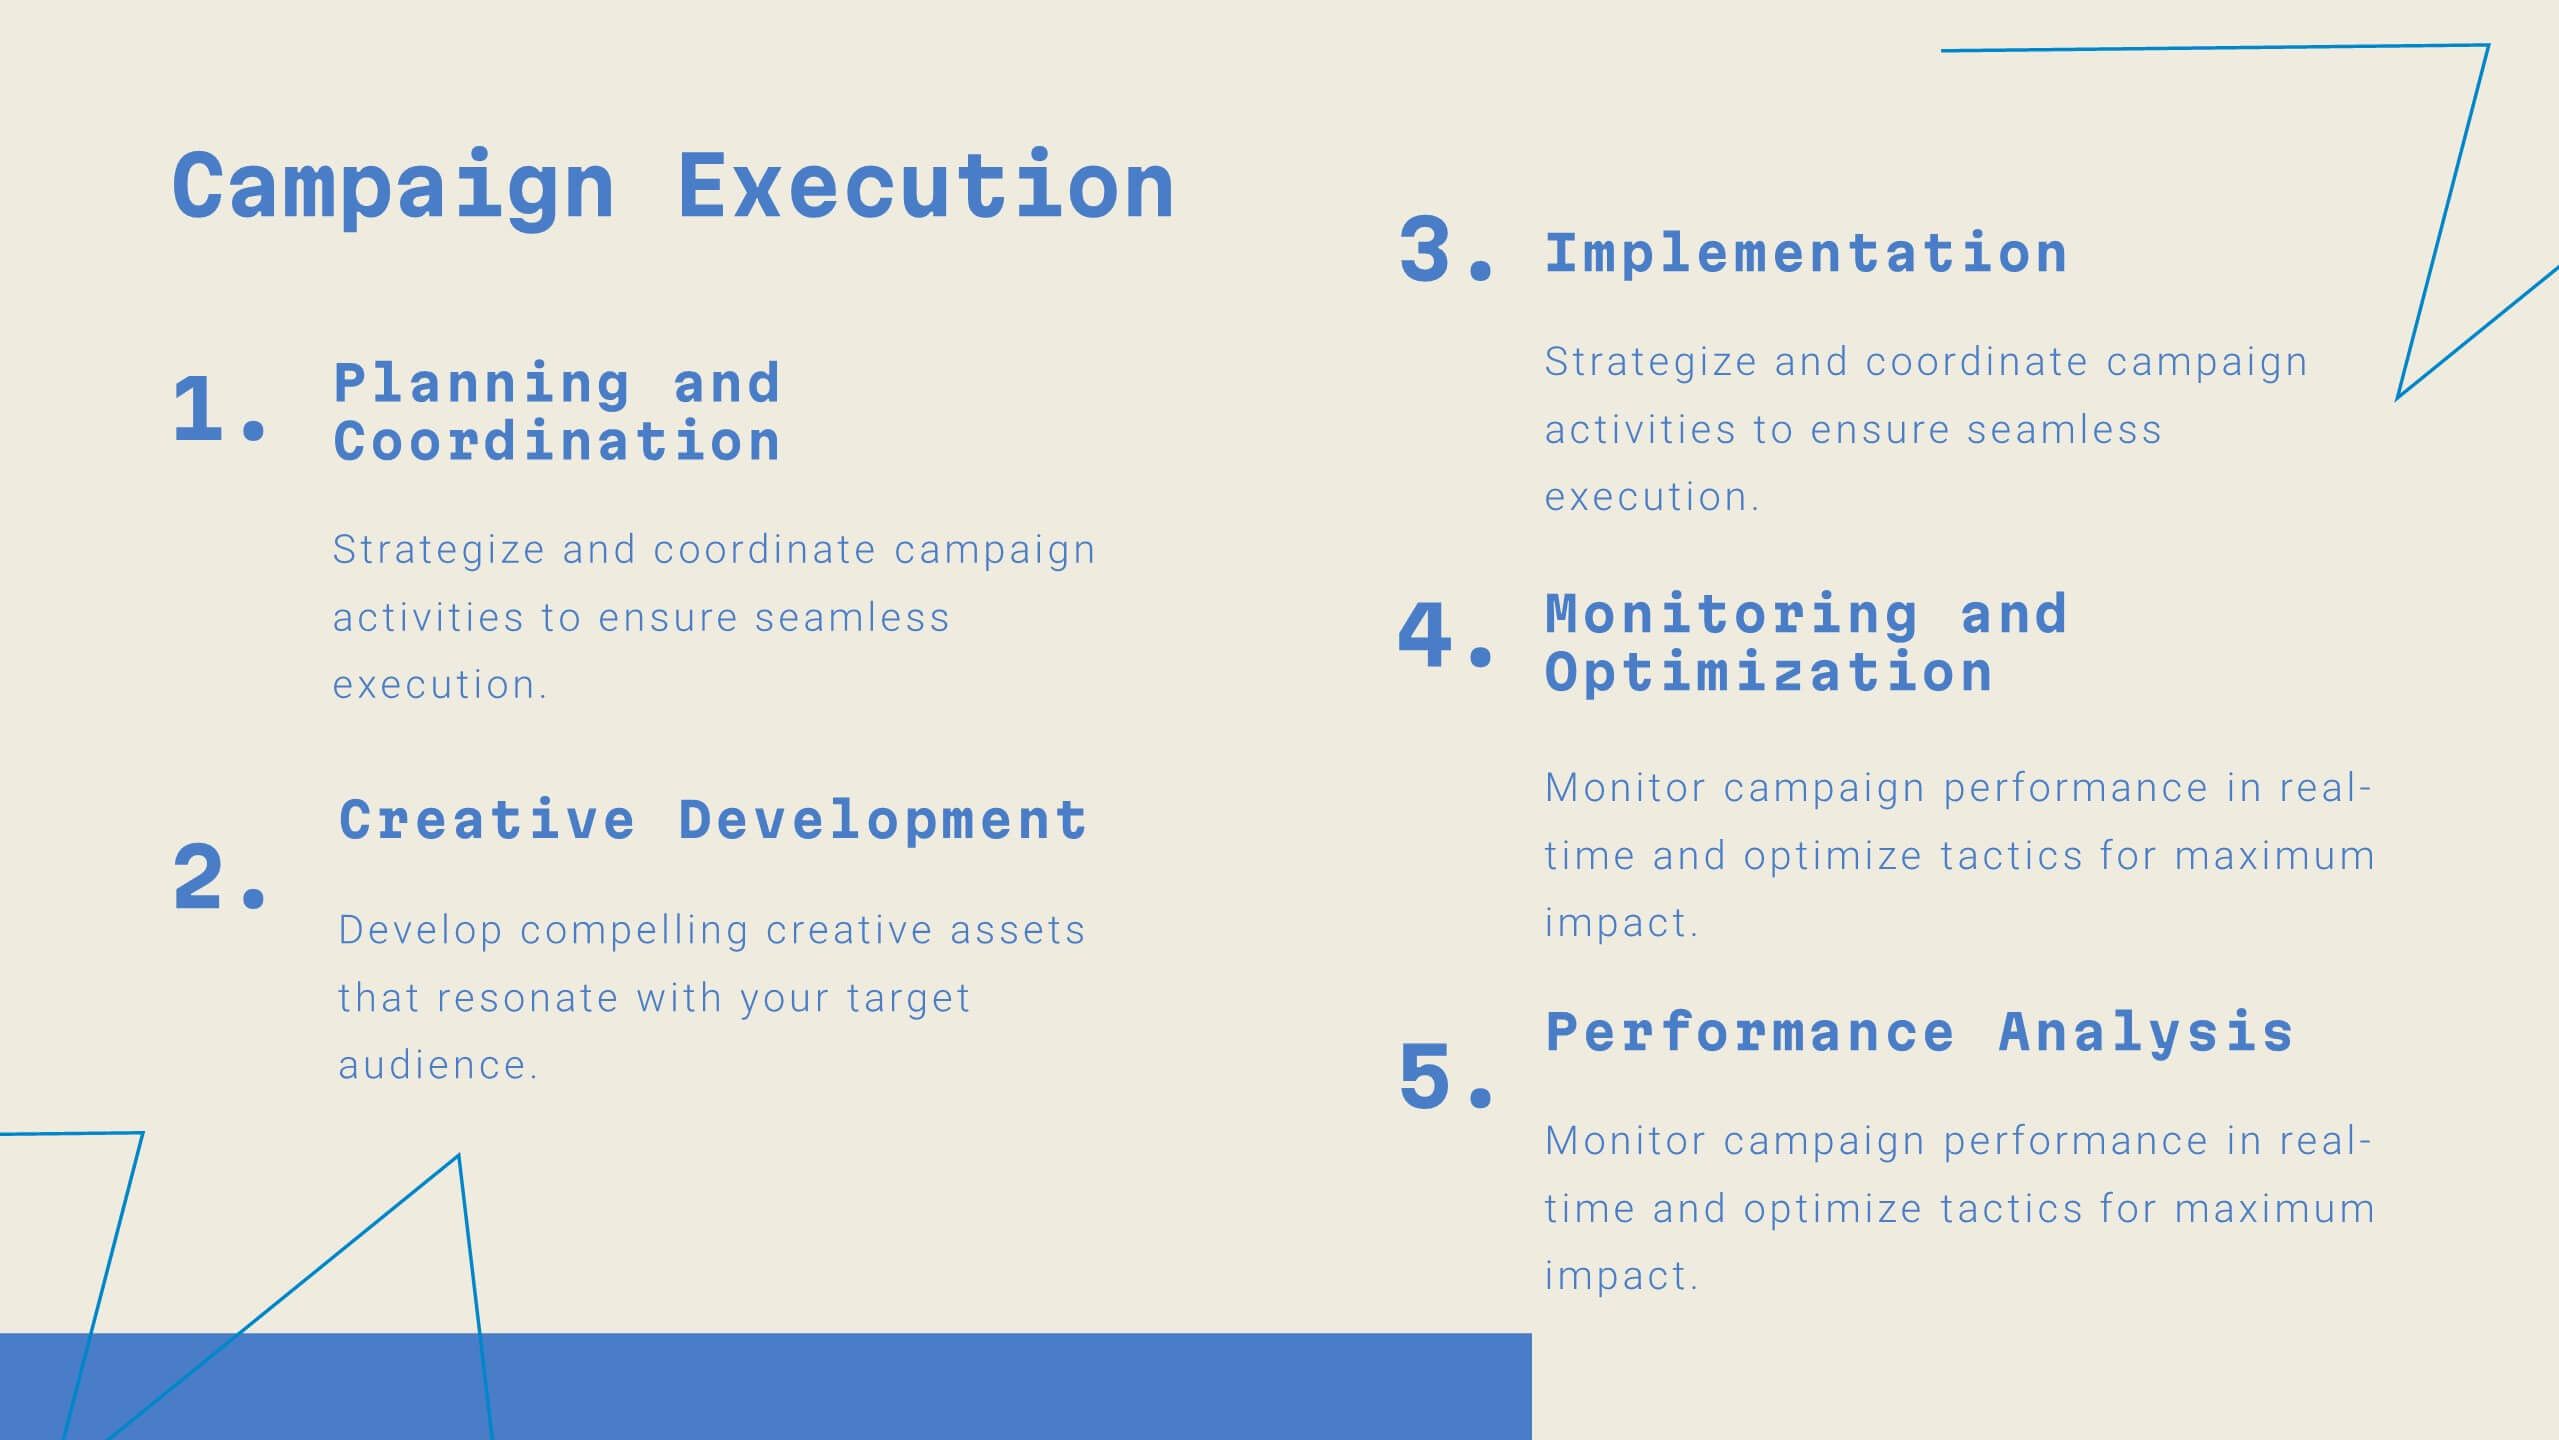
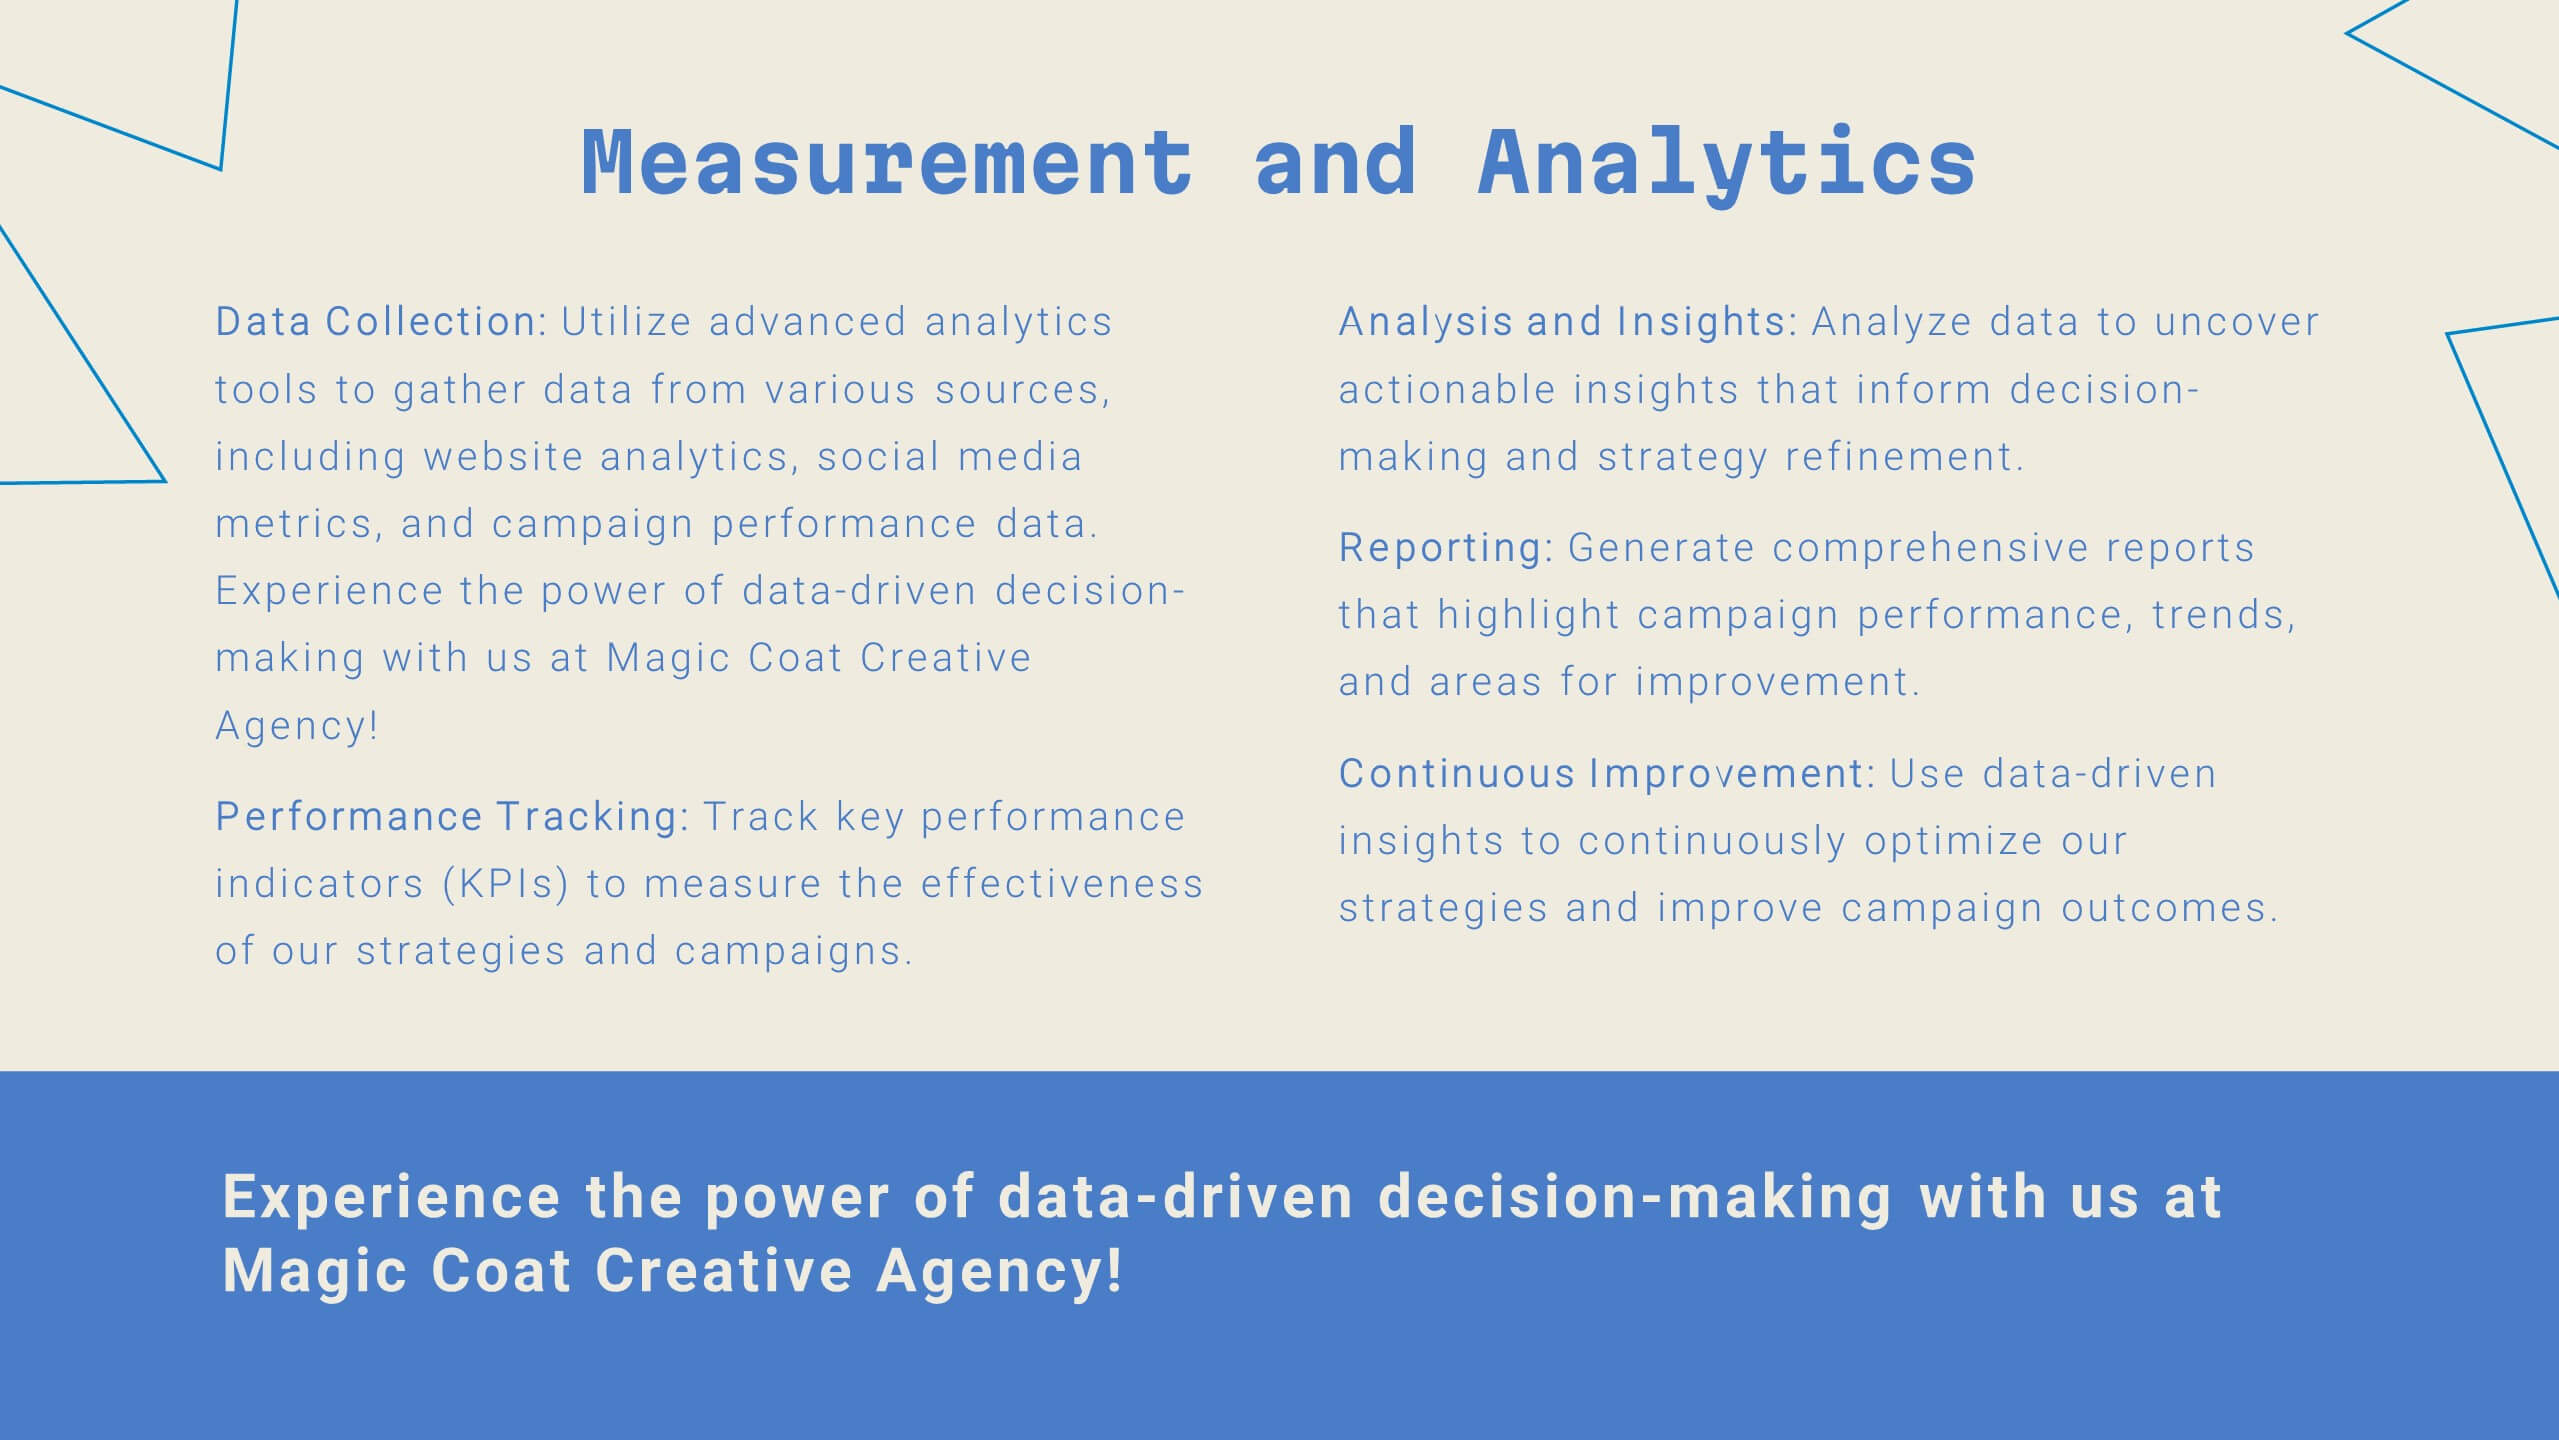
Unity Digital Agency Strategy Plan Presentation
Step into the future of digital marketing with this sleek template! From case studies to strategy development, it offers a comprehensive guide for creating impactful presentations. Highlight client success stories, industry trends, and creative processes with ease. Perfect for showcasing your agency's expertise. Compatible with PowerPoint, Keynote, and Google Slides.


6 slides
Pathway and Options Framework Analysis Presentation
Navigate your business strategy with clarity using the Pathway and Options Framework Analysis Presentation. This slide features a horizontal hexagon progression that visually maps out five distinct stages or decision points. Ideal for illustrating phased development, strategic alternatives, or milestone-based planning. Each segment includes an icon and customizable title area for key data points. Use this clean, modern layout to engage stakeholders or clarify complex processes. Fully editable in PowerPoint, Keynote, and Google Slides.


7 slides
Success Team Work Infographic
Teamwork is the collaborative effort of a group of individuals, each contributing their diverse skills, knowledge, and experiences to achieve a common goal or complete a shared task. Our success teamwork infographic is an inspiring visual tool designed to showcase the art of collaborative achievement. Celebrate the collective triumphs of teamwork and highlight how unity and synergy lead to unparalleled success. Compatible with Powerpoint, Keynote, and Google Slides. This template encourages a culture of collaboration and showcases the magic that happens when individuals unite for a common purpose.


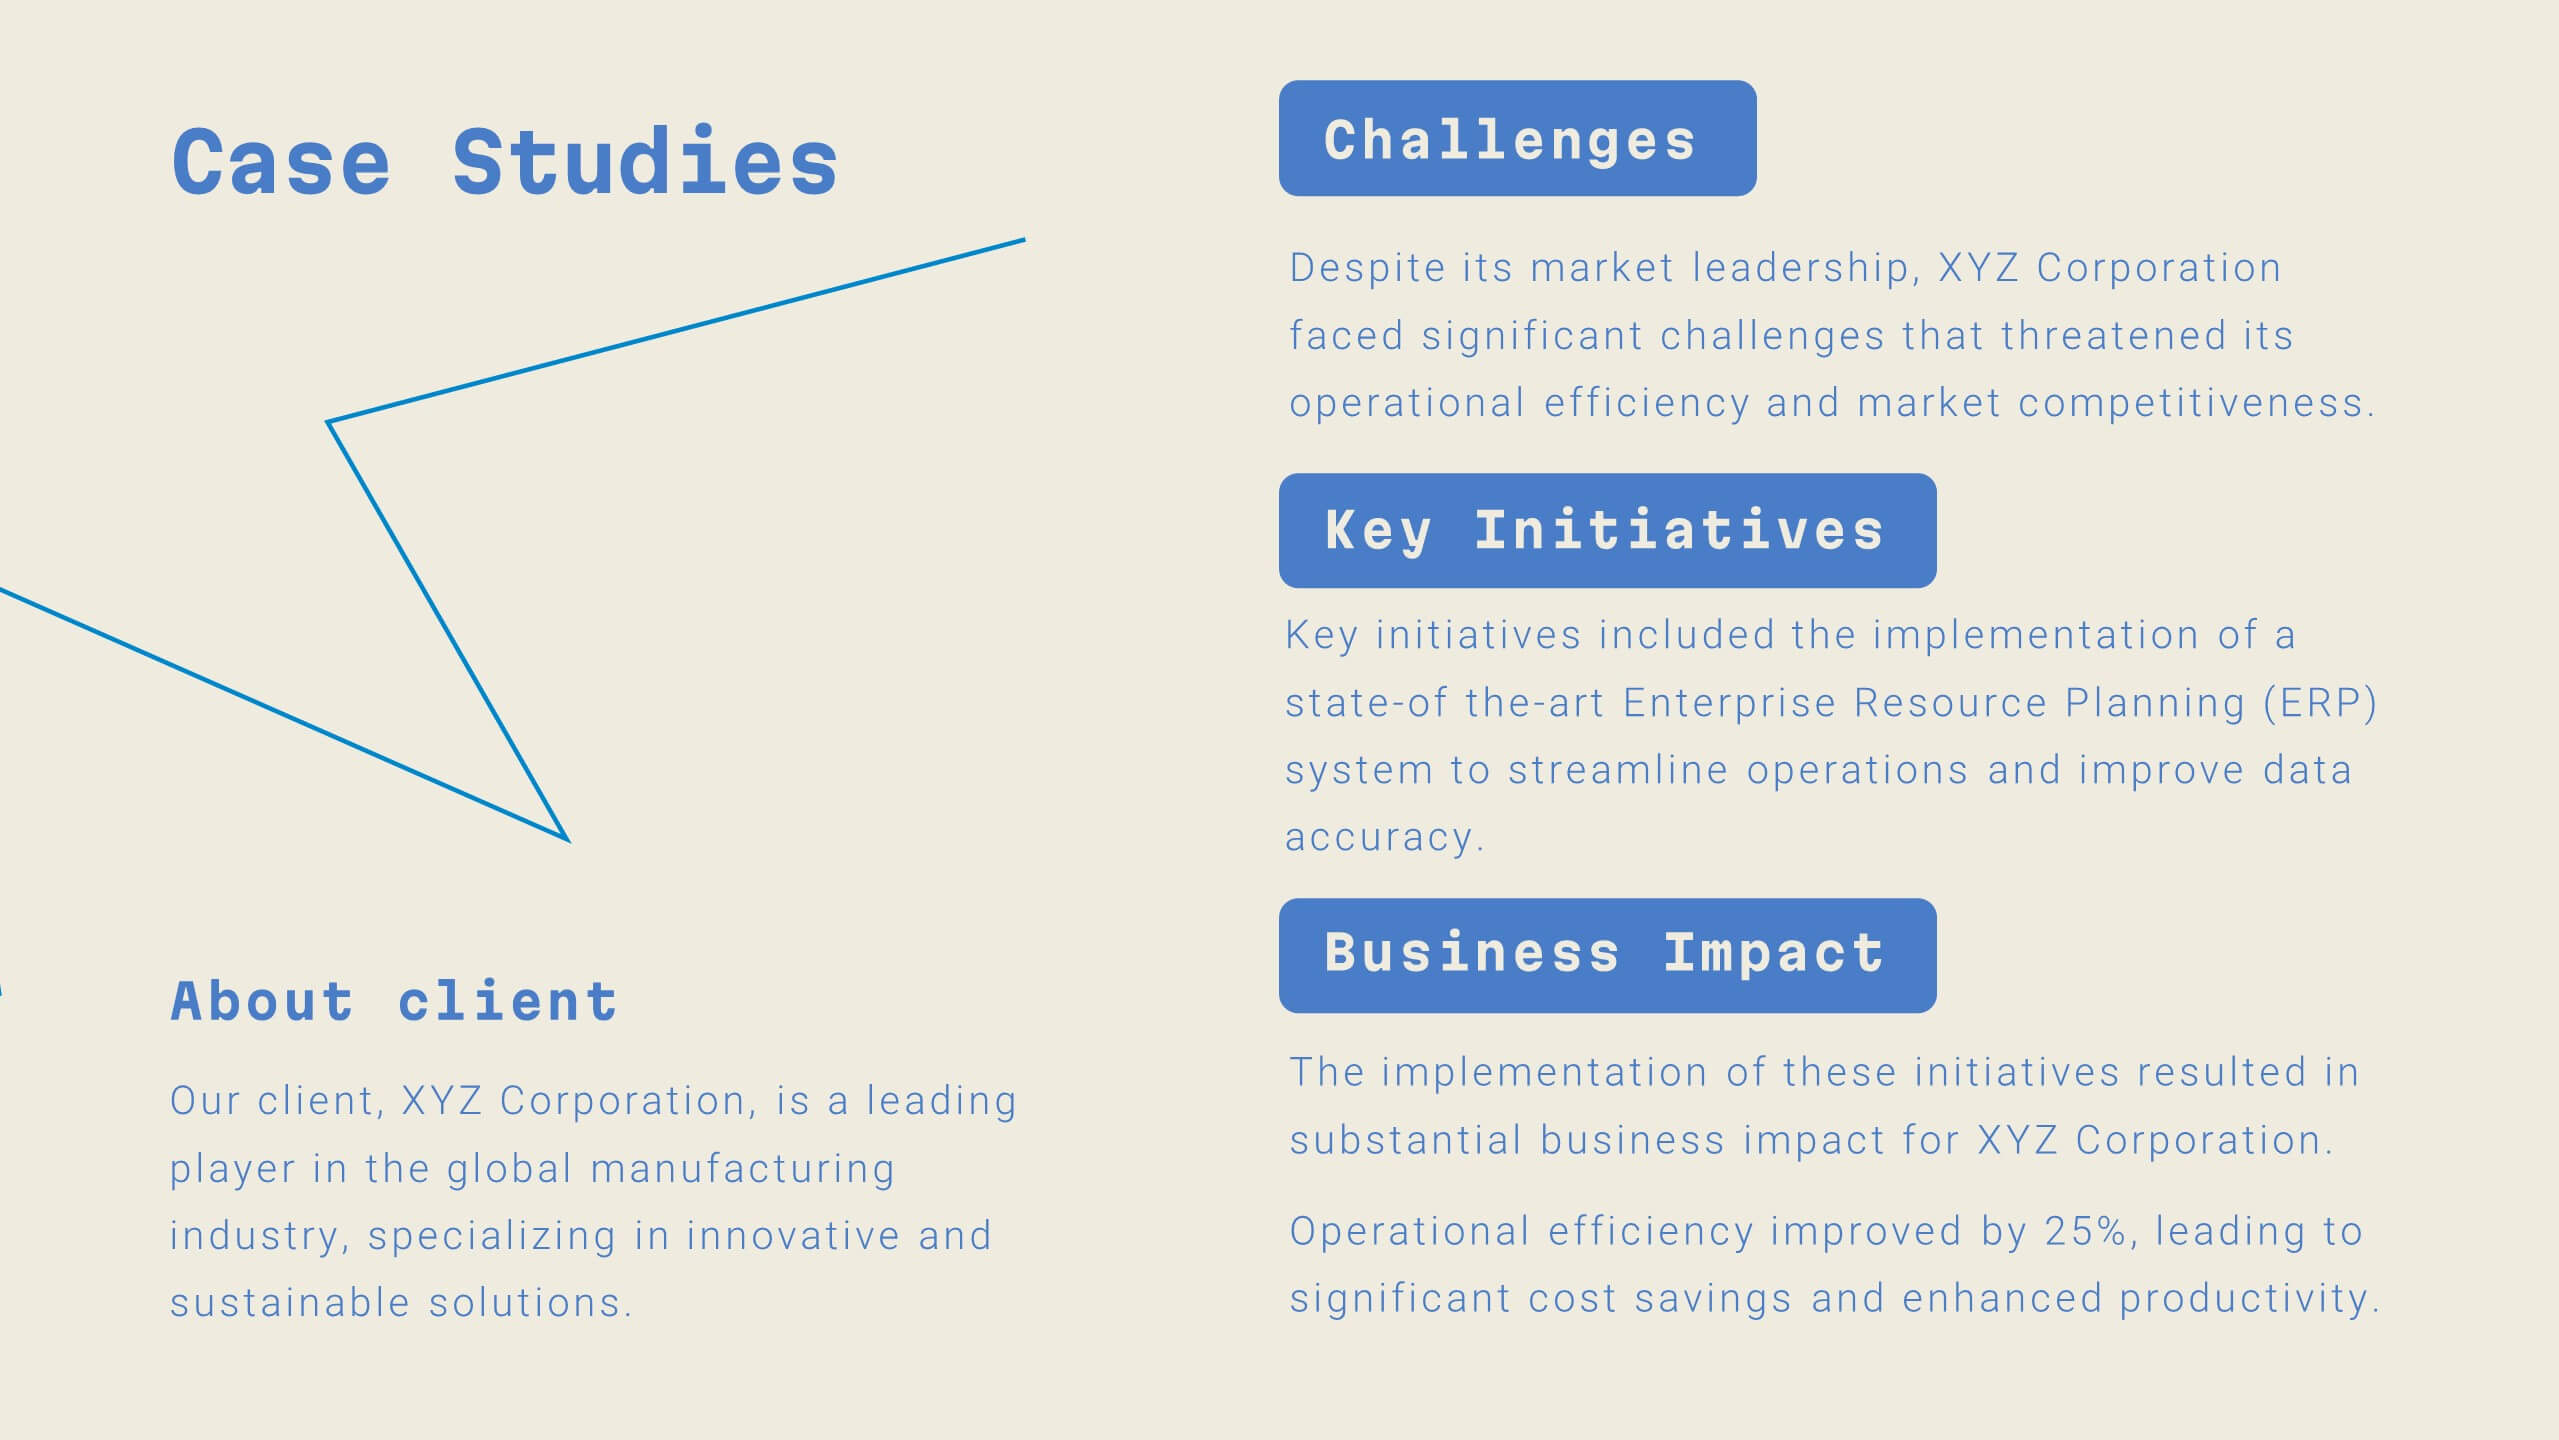
23 slides
Cloudrift UX Case Study Presentation
Present a comprehensive and visually engaging UX Case Study with this dynamic and modern template. Begin with an introduction to the design challenge, followed by detailed slides for project overviews, user research, and persona development. Highlight the user journey mapping, information architecture, and wireframing process to showcase your structured approach to solving design problems. This template offers dedicated sections for prototyping, user testing, and feedback iterations, ensuring every stage of your process is documented. Dive into critical components like interaction design, responsive design, and accessibility considerations, demonstrating your commitment to delivering user-centric solutions. Conclude with a project showcase that highlights the final product and its impact. Fully customizable and compatible with PowerPoint, Google Slides, and Keynote, this template is perfect for presenting your UX design insights with clarity and professionalism.


22 slides
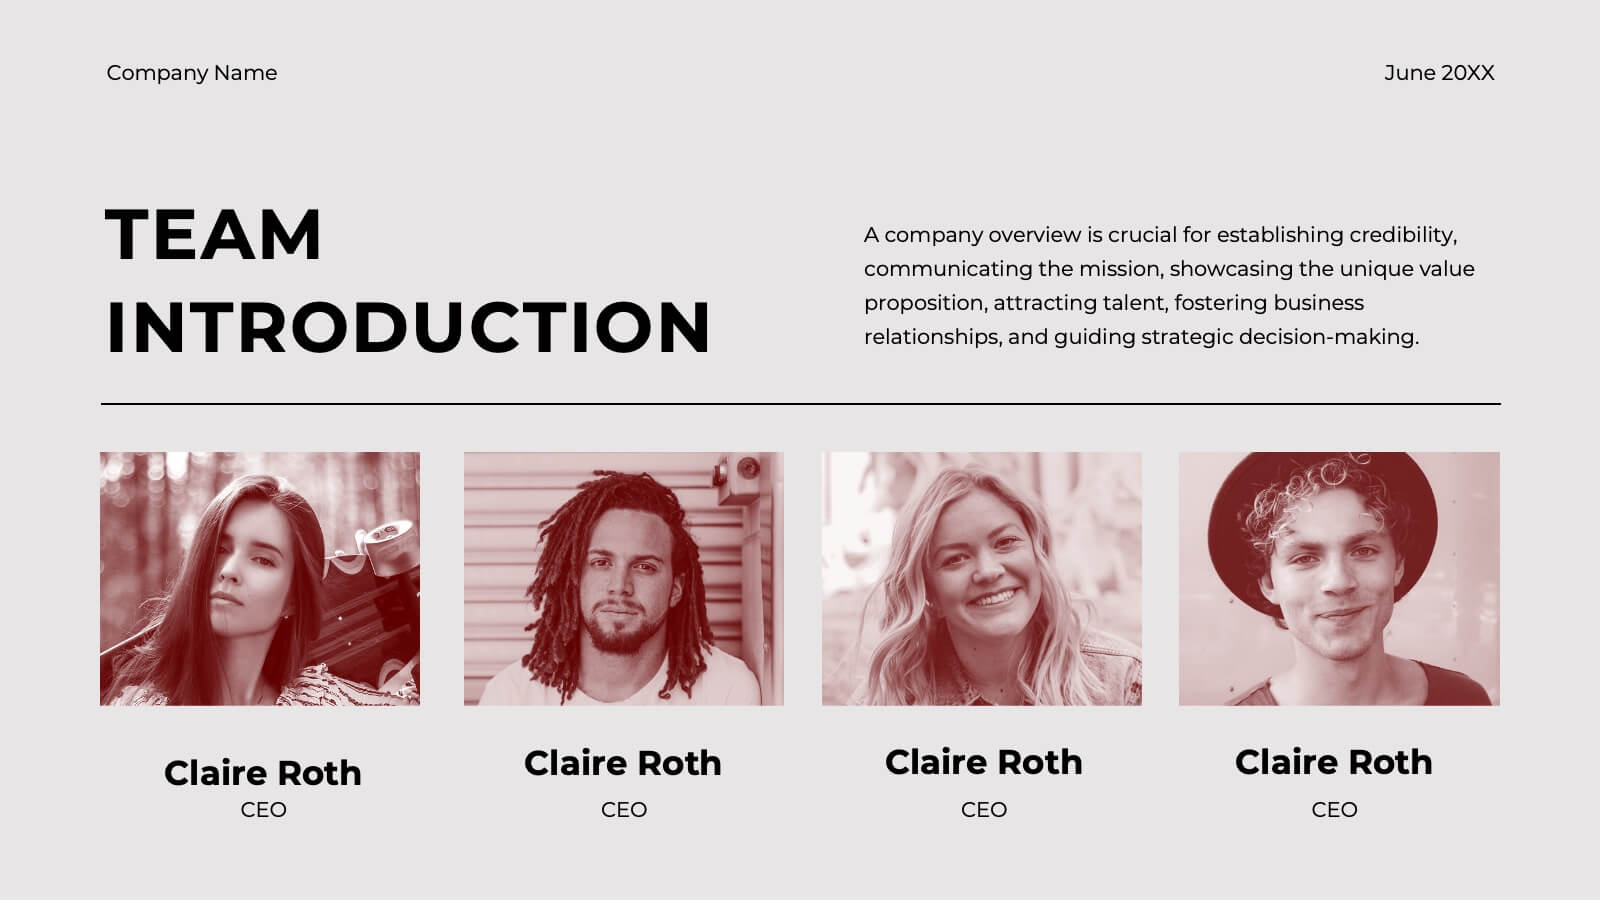
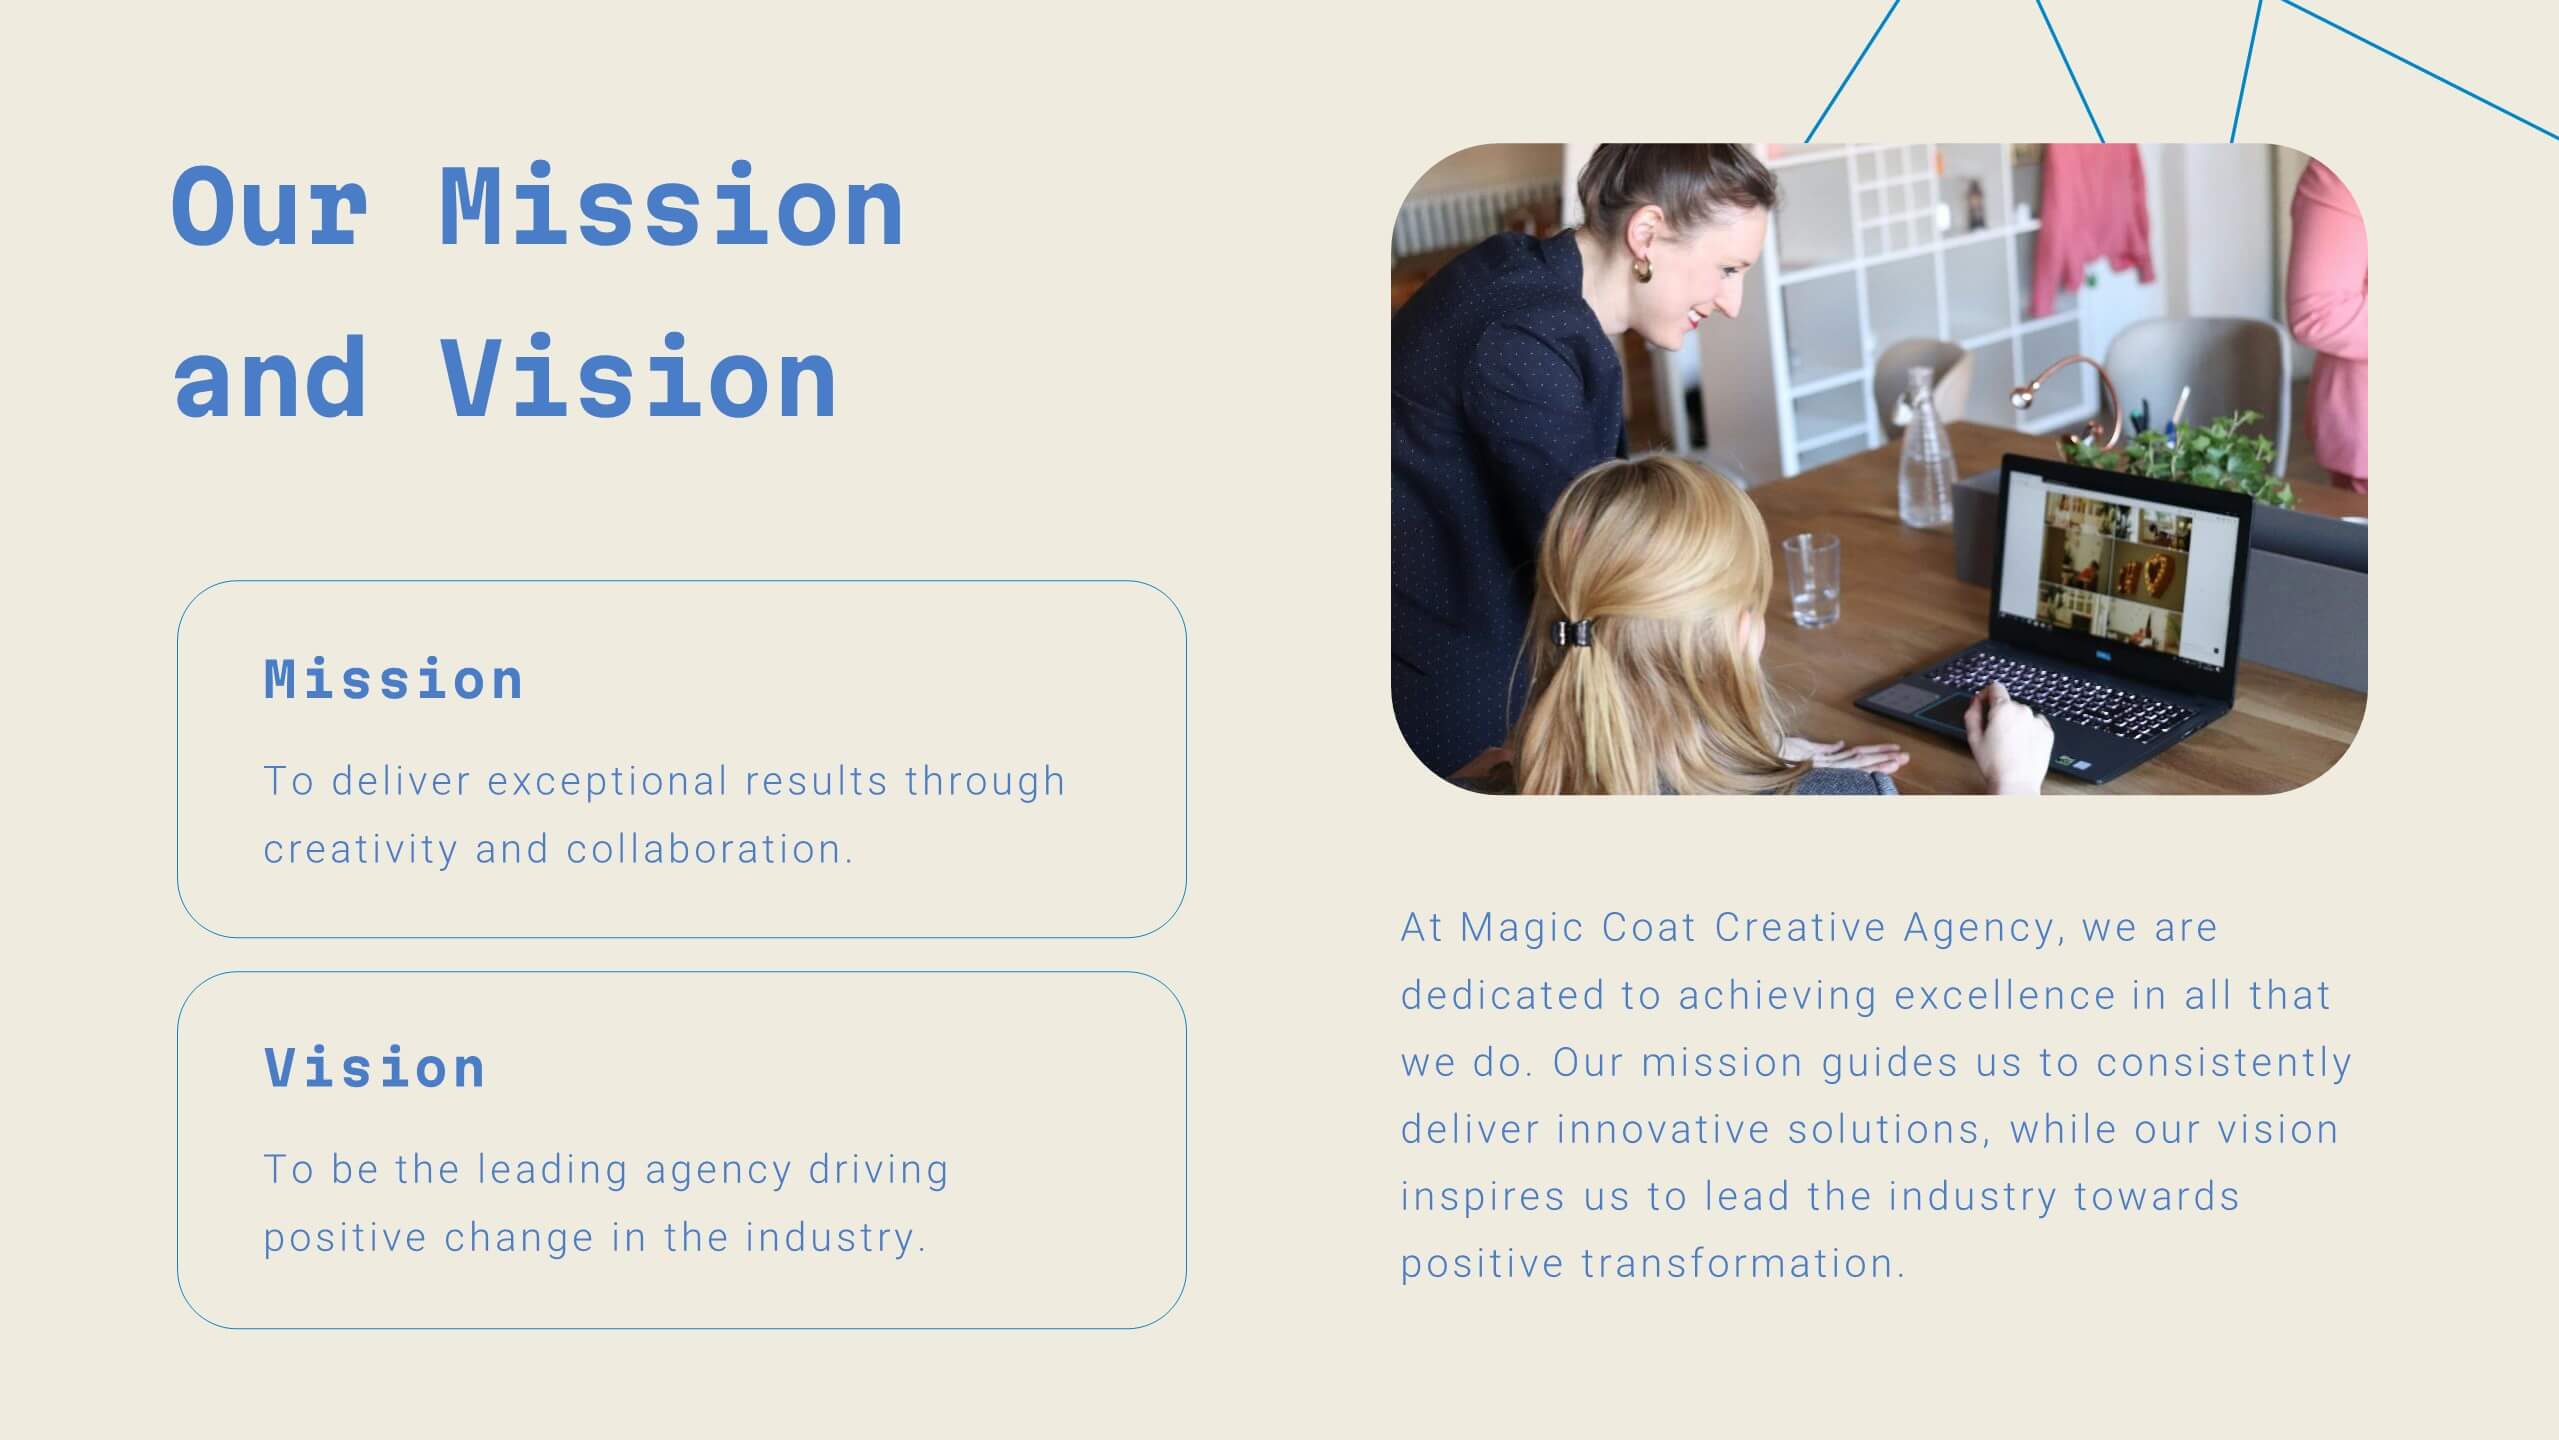
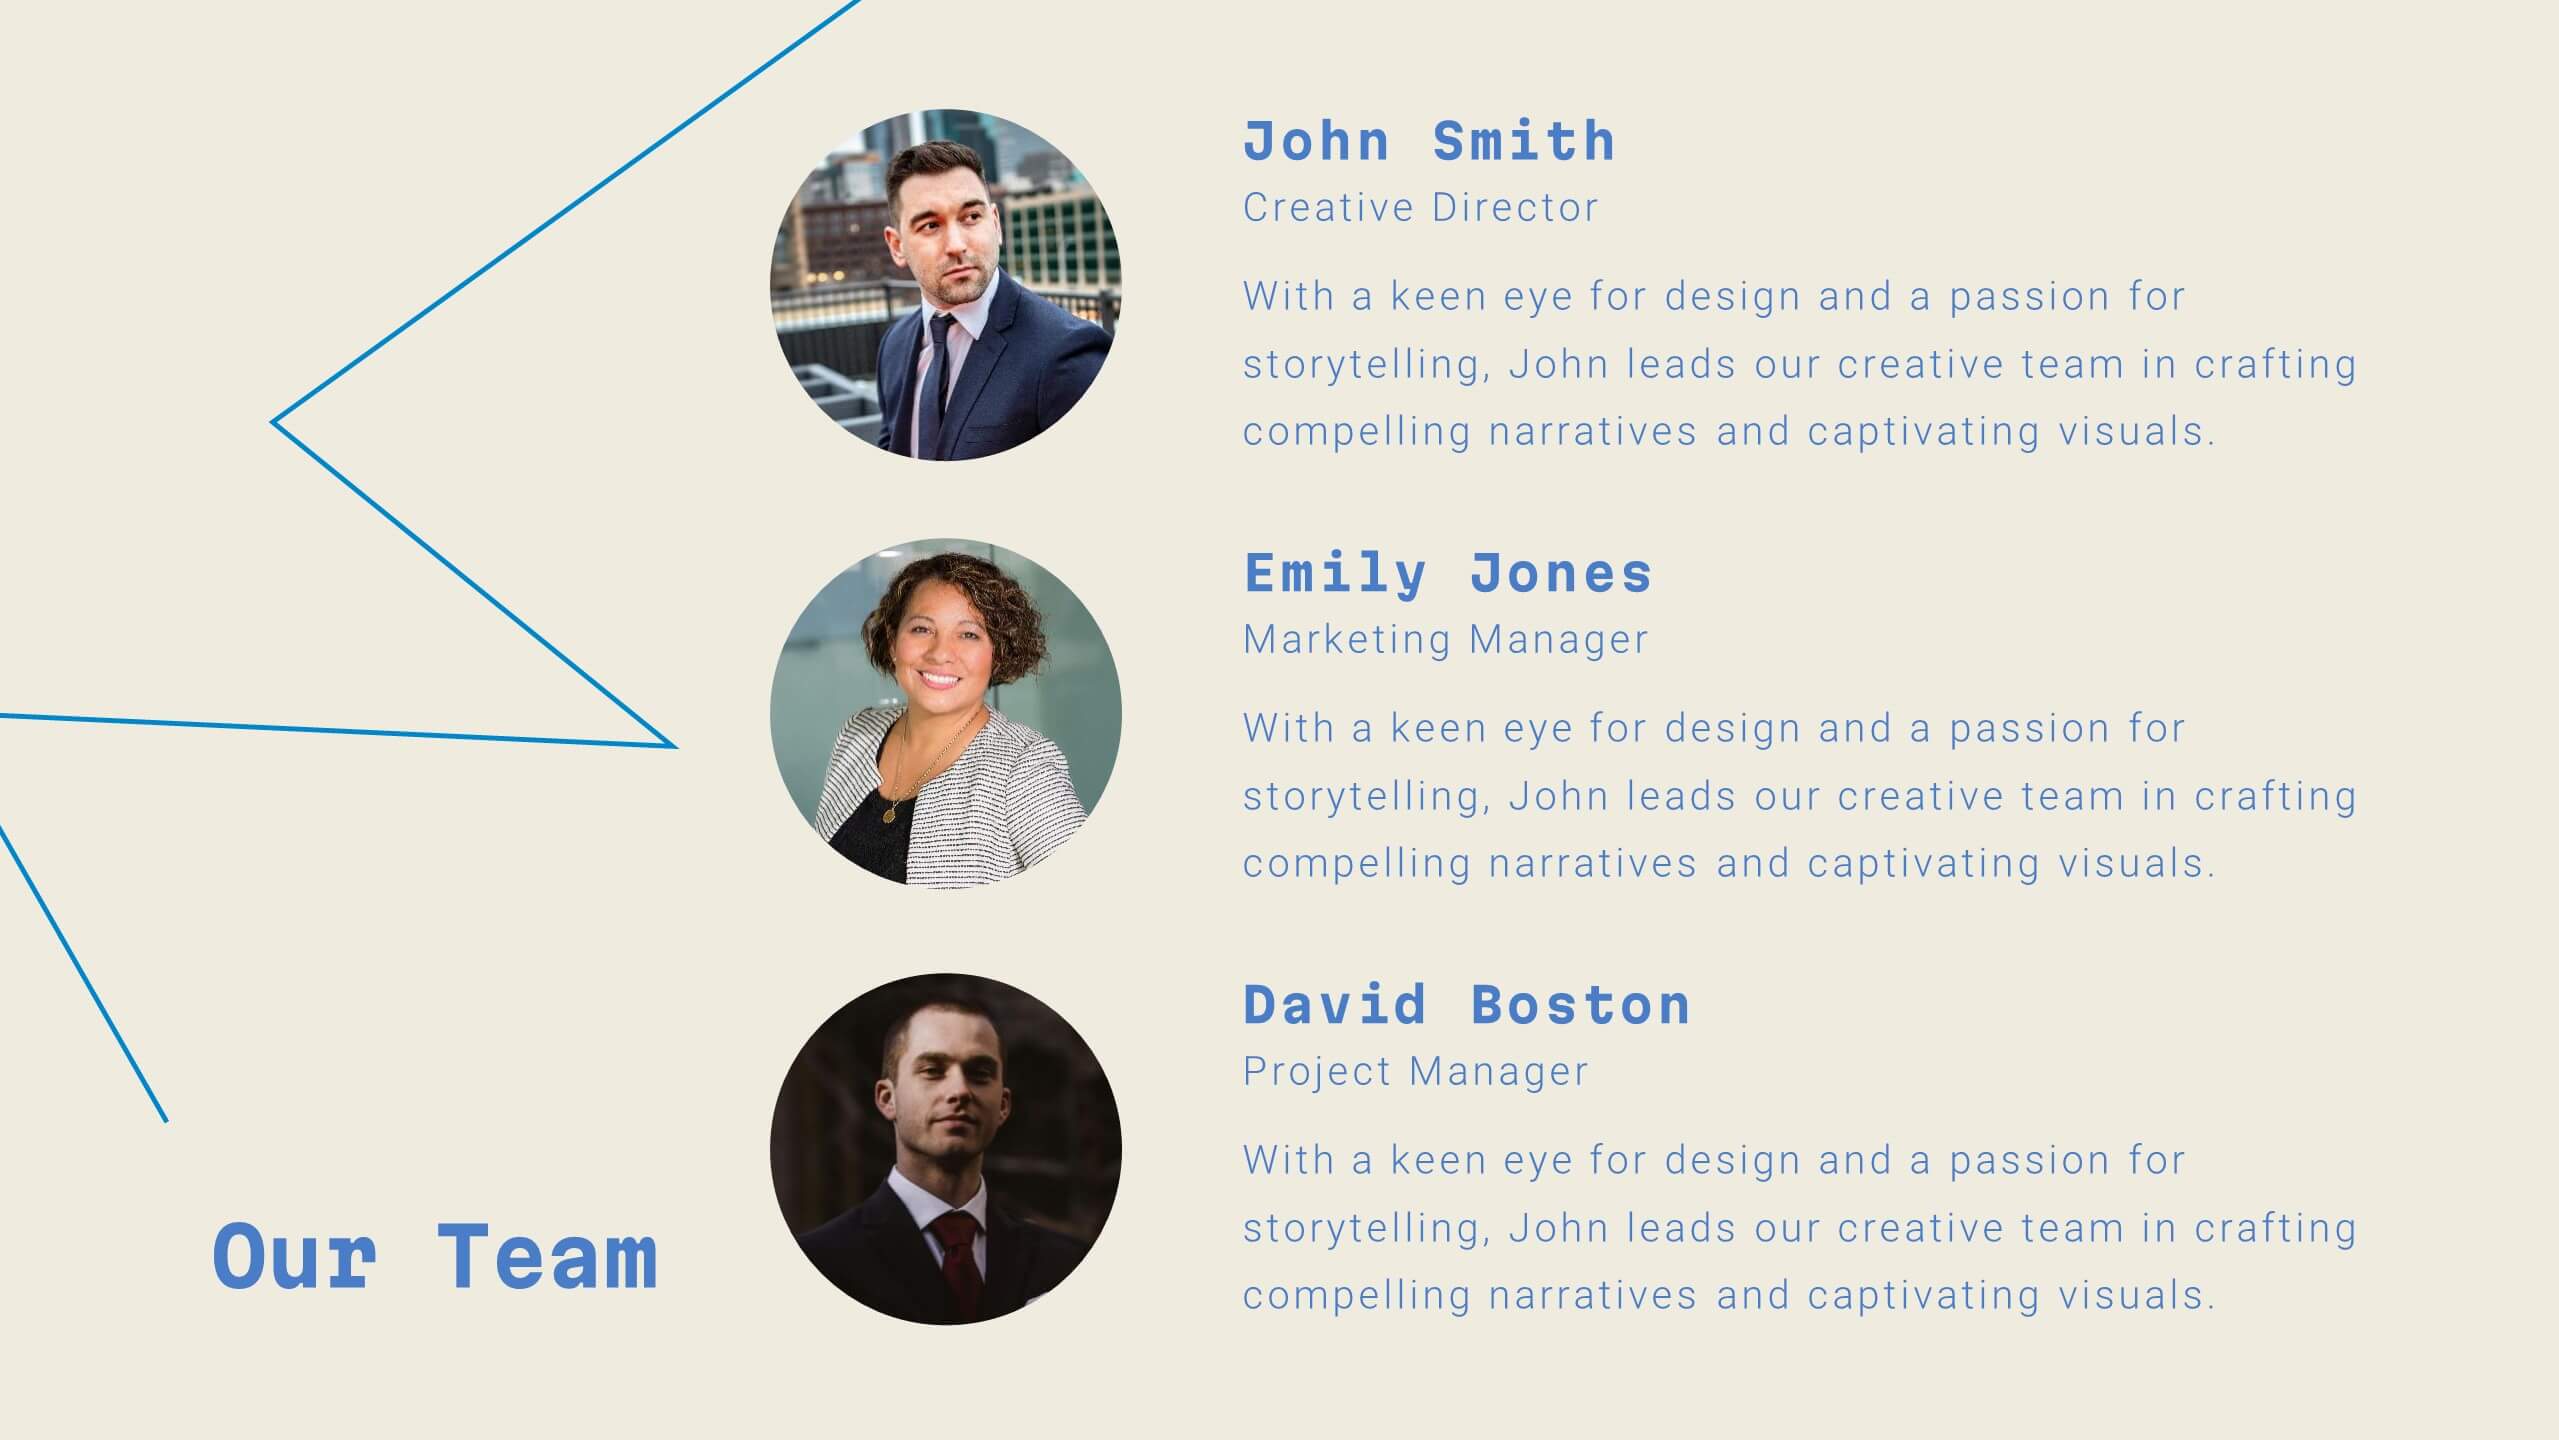
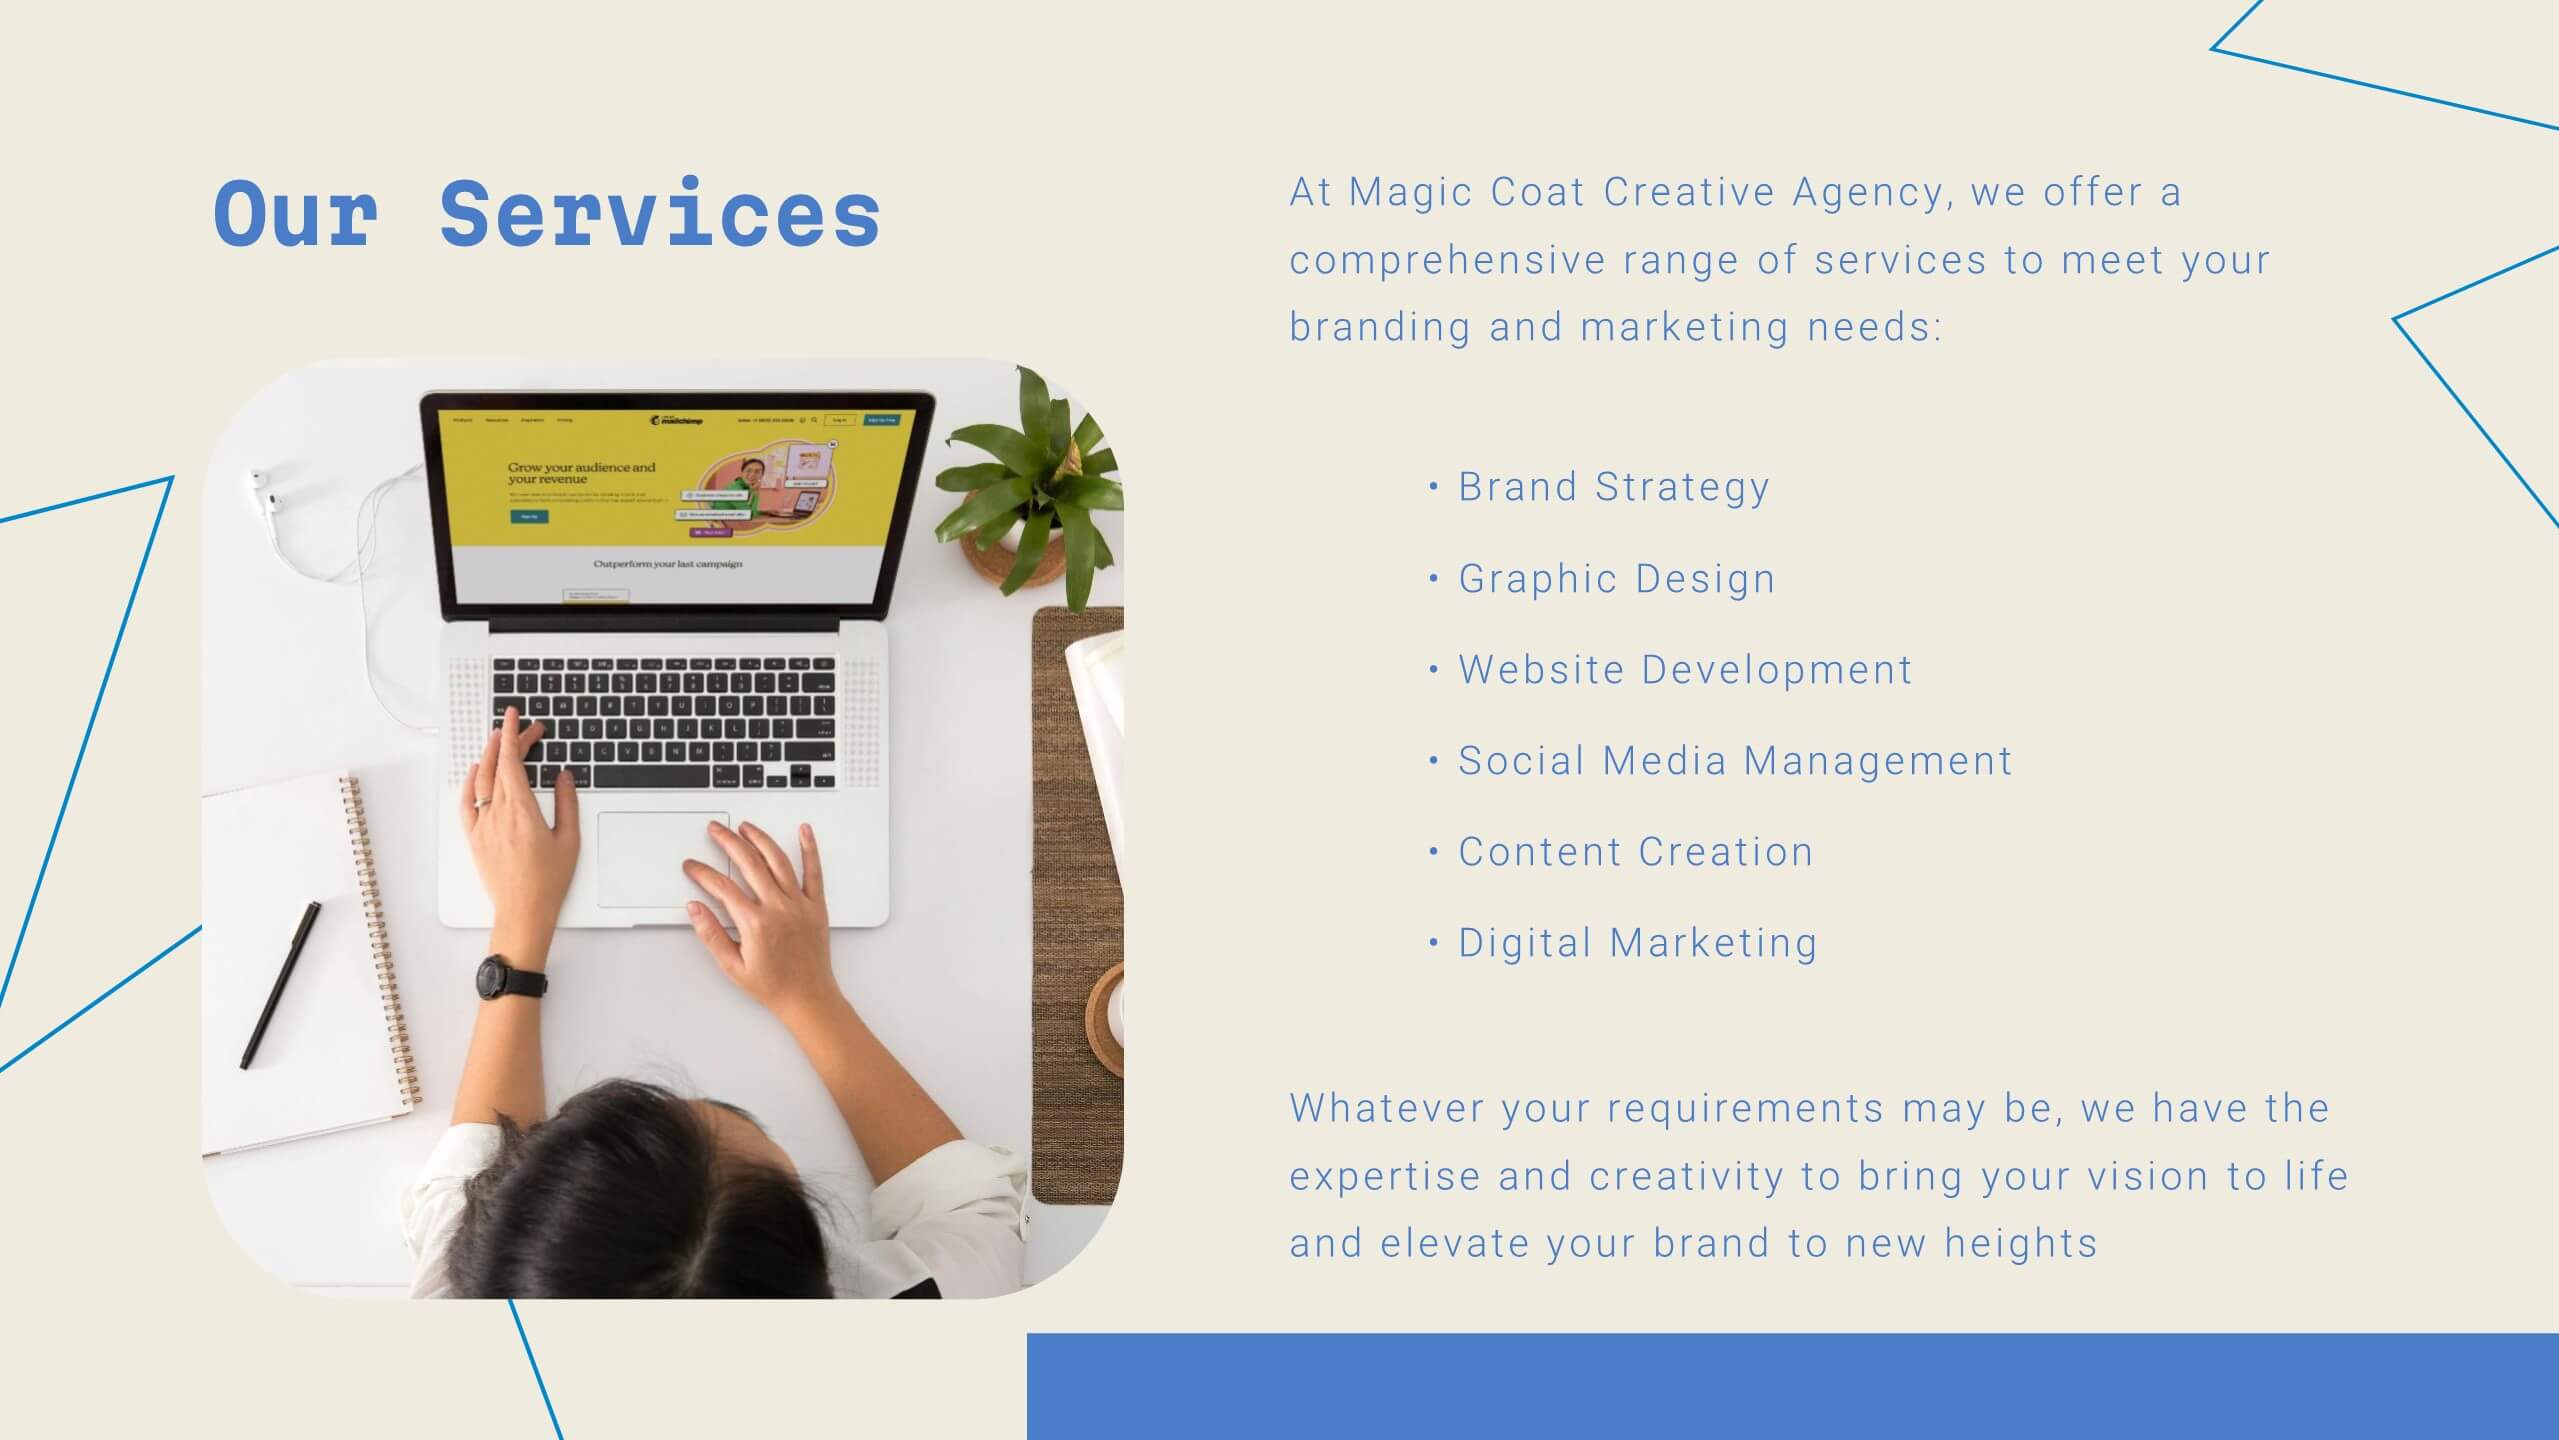
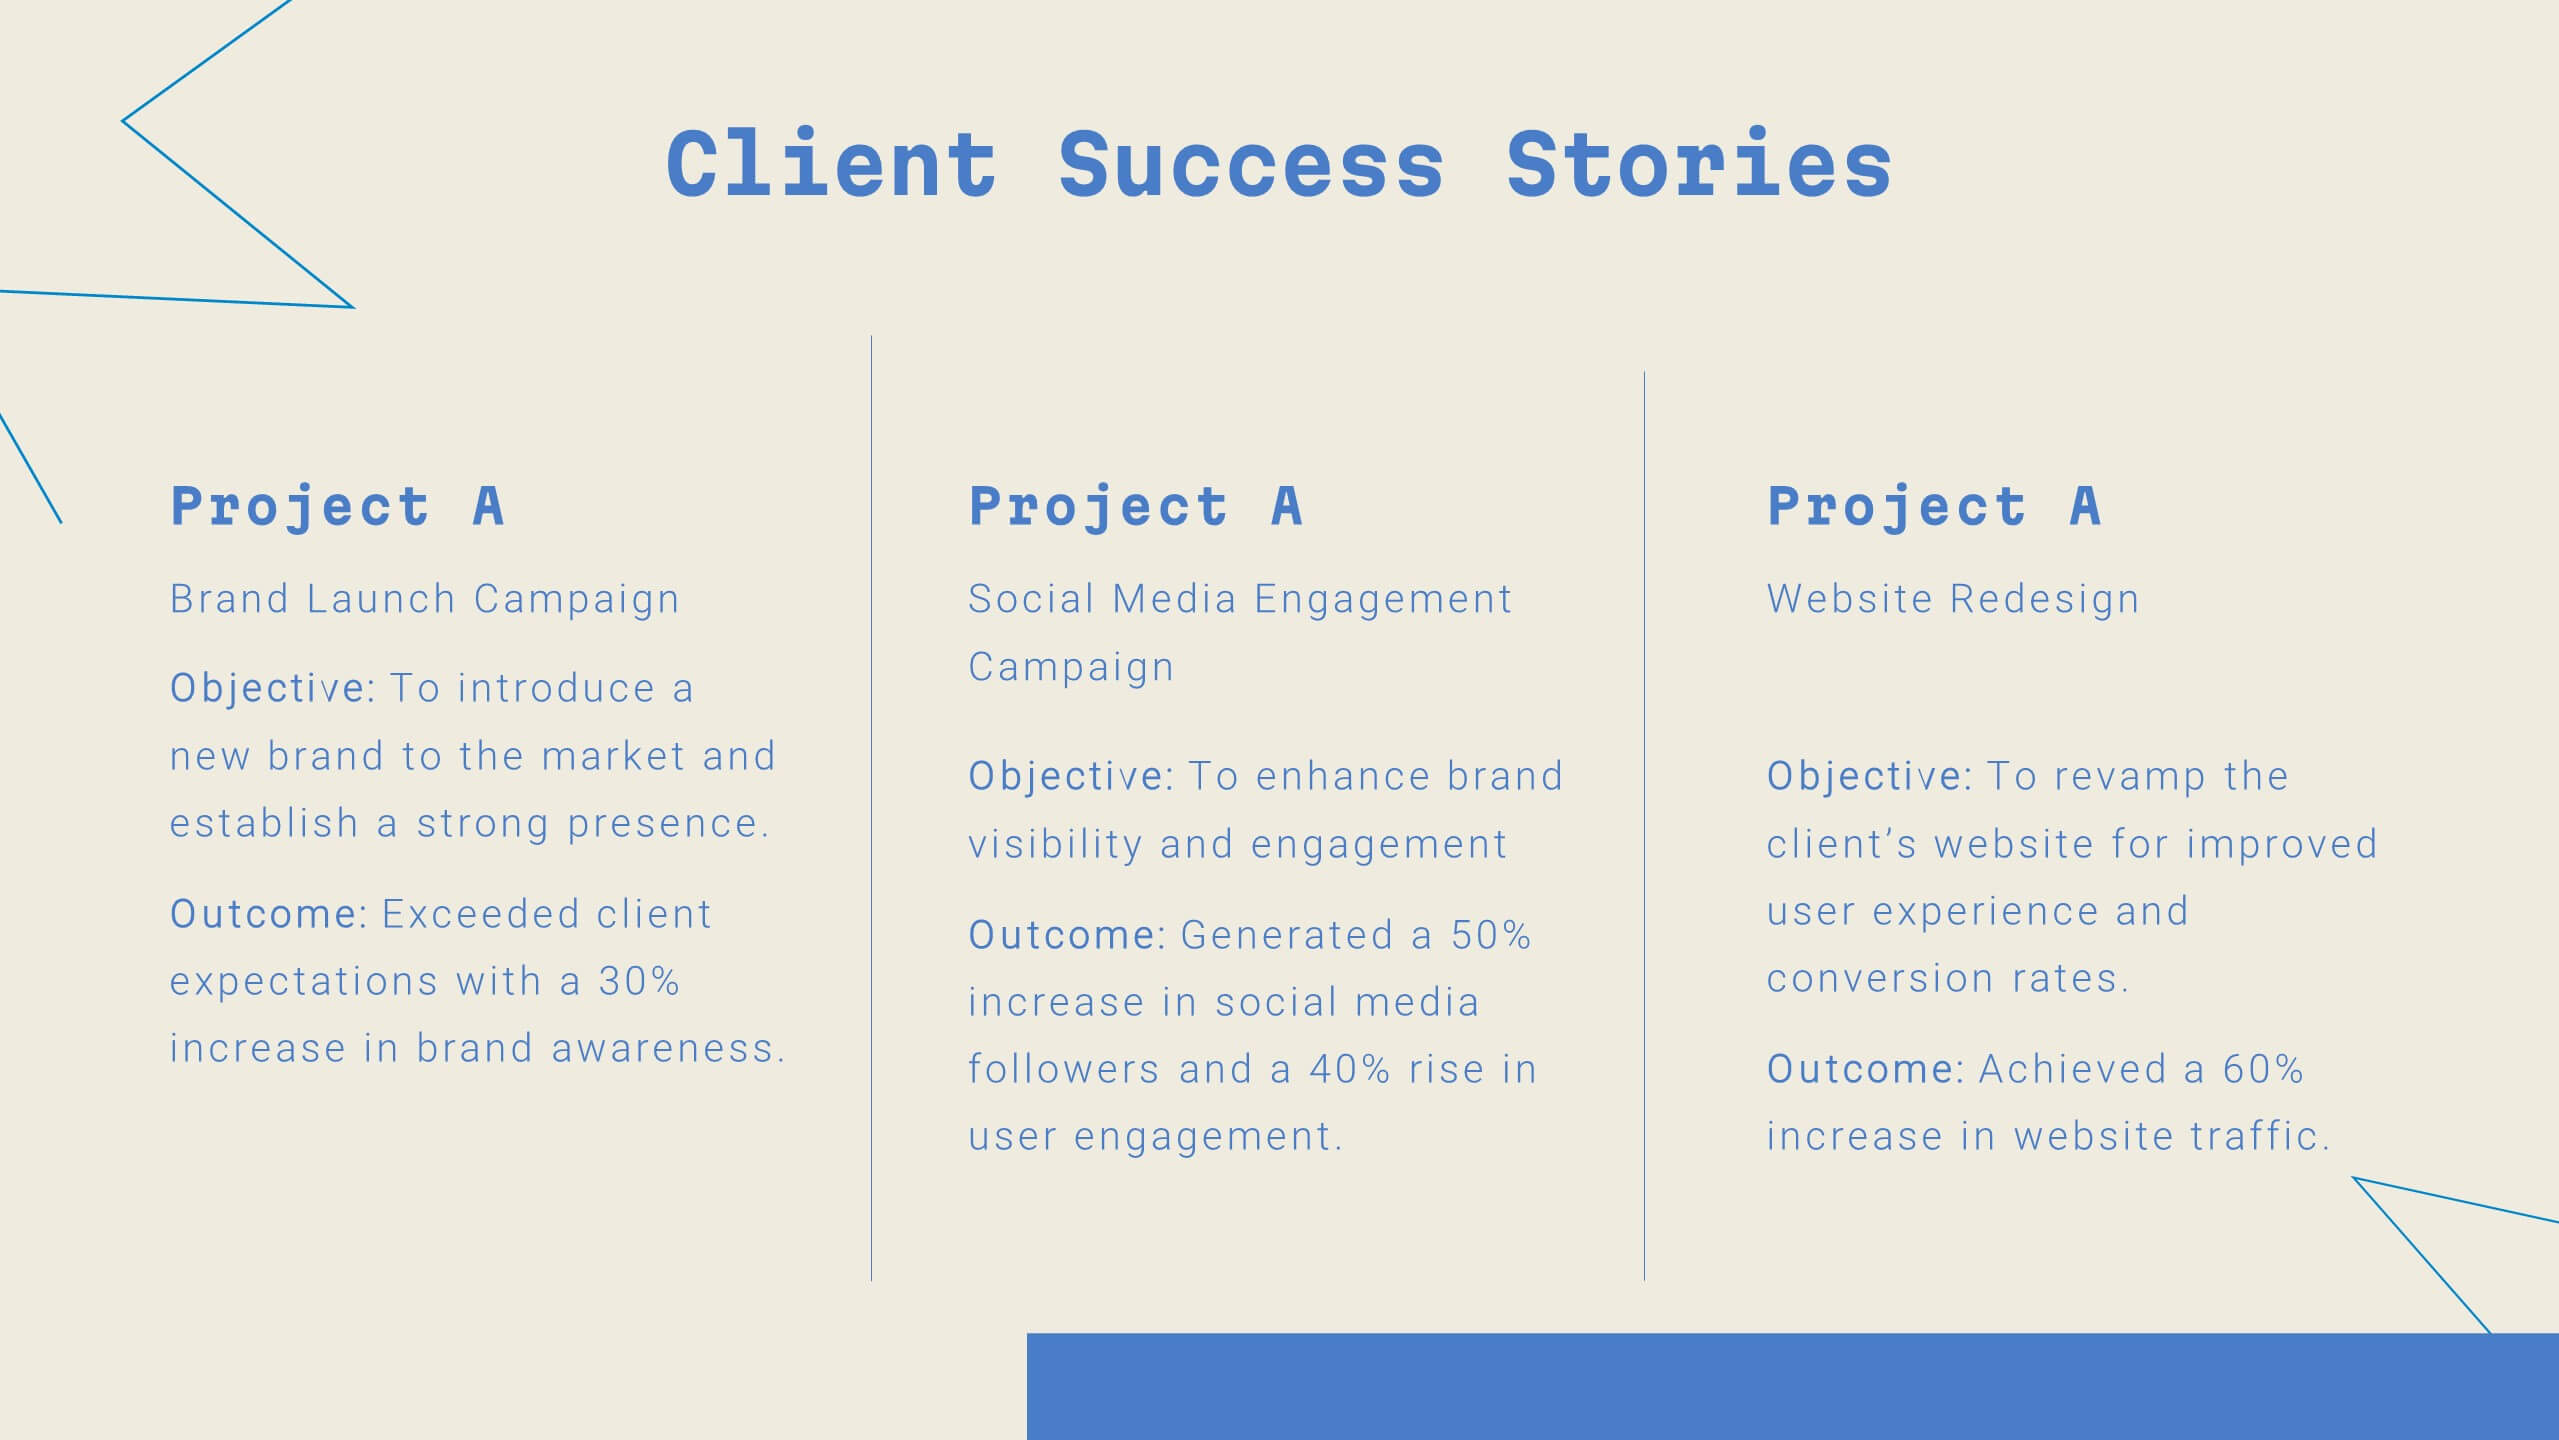
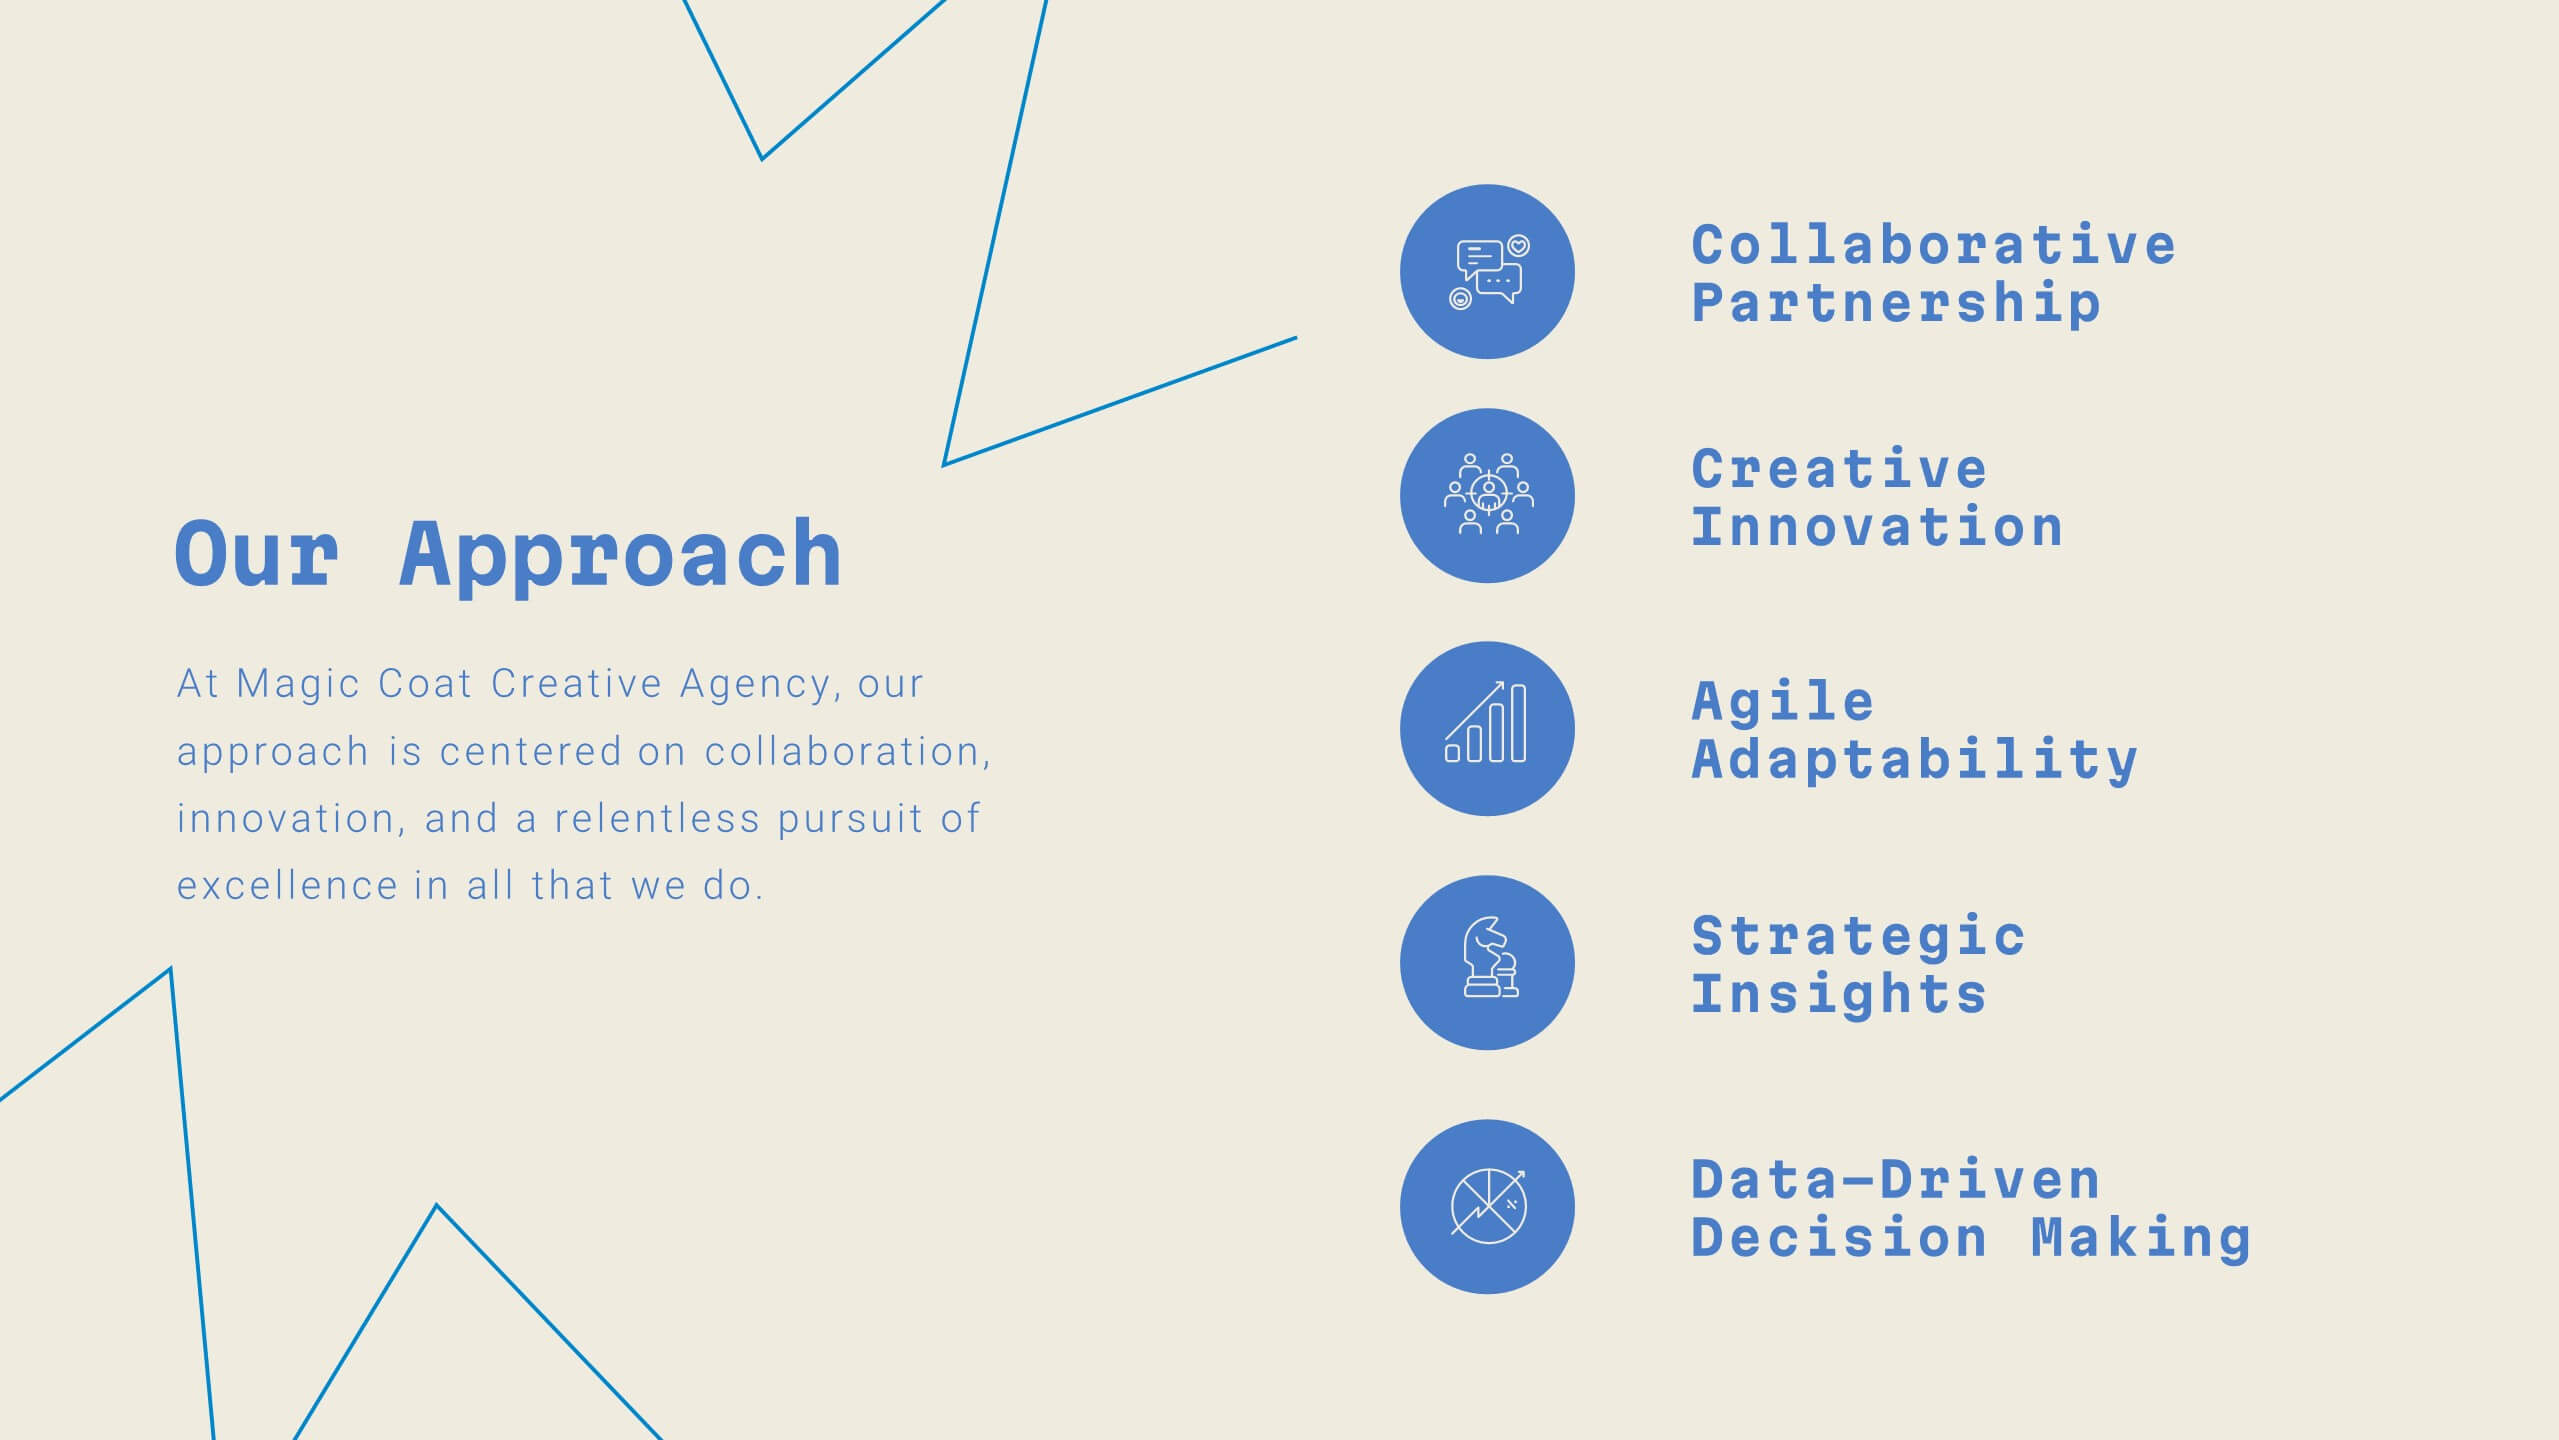
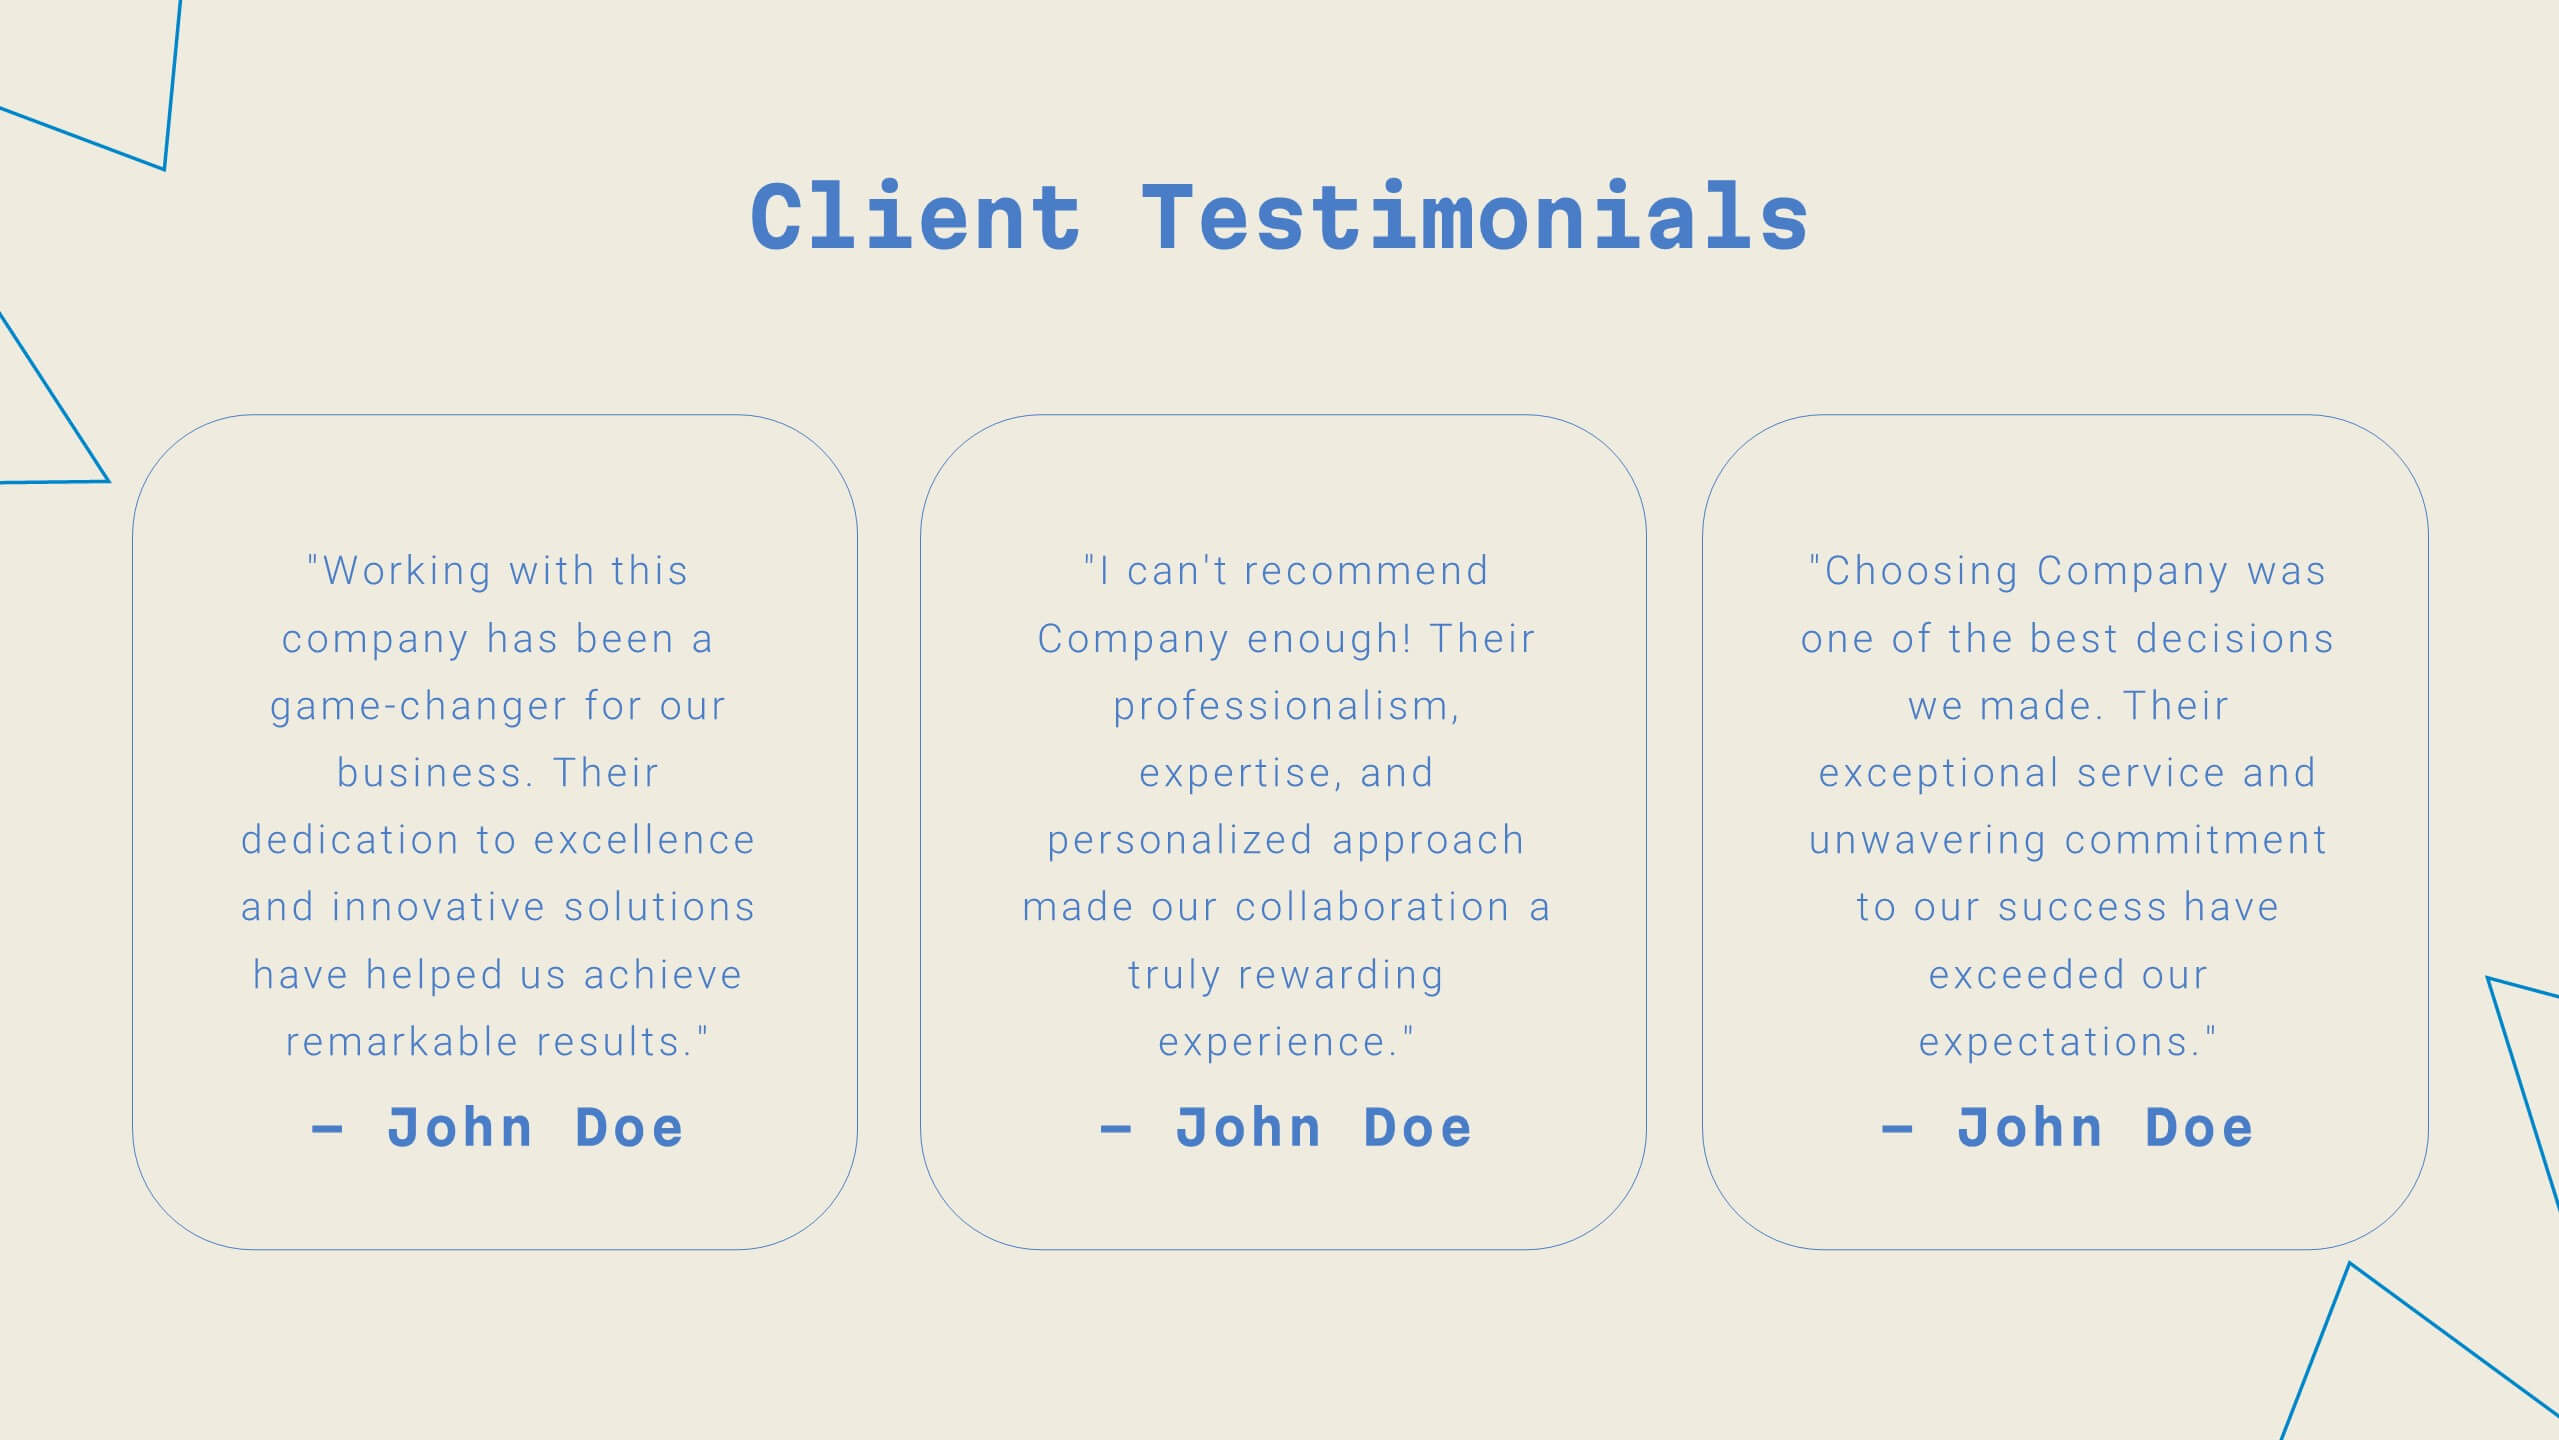
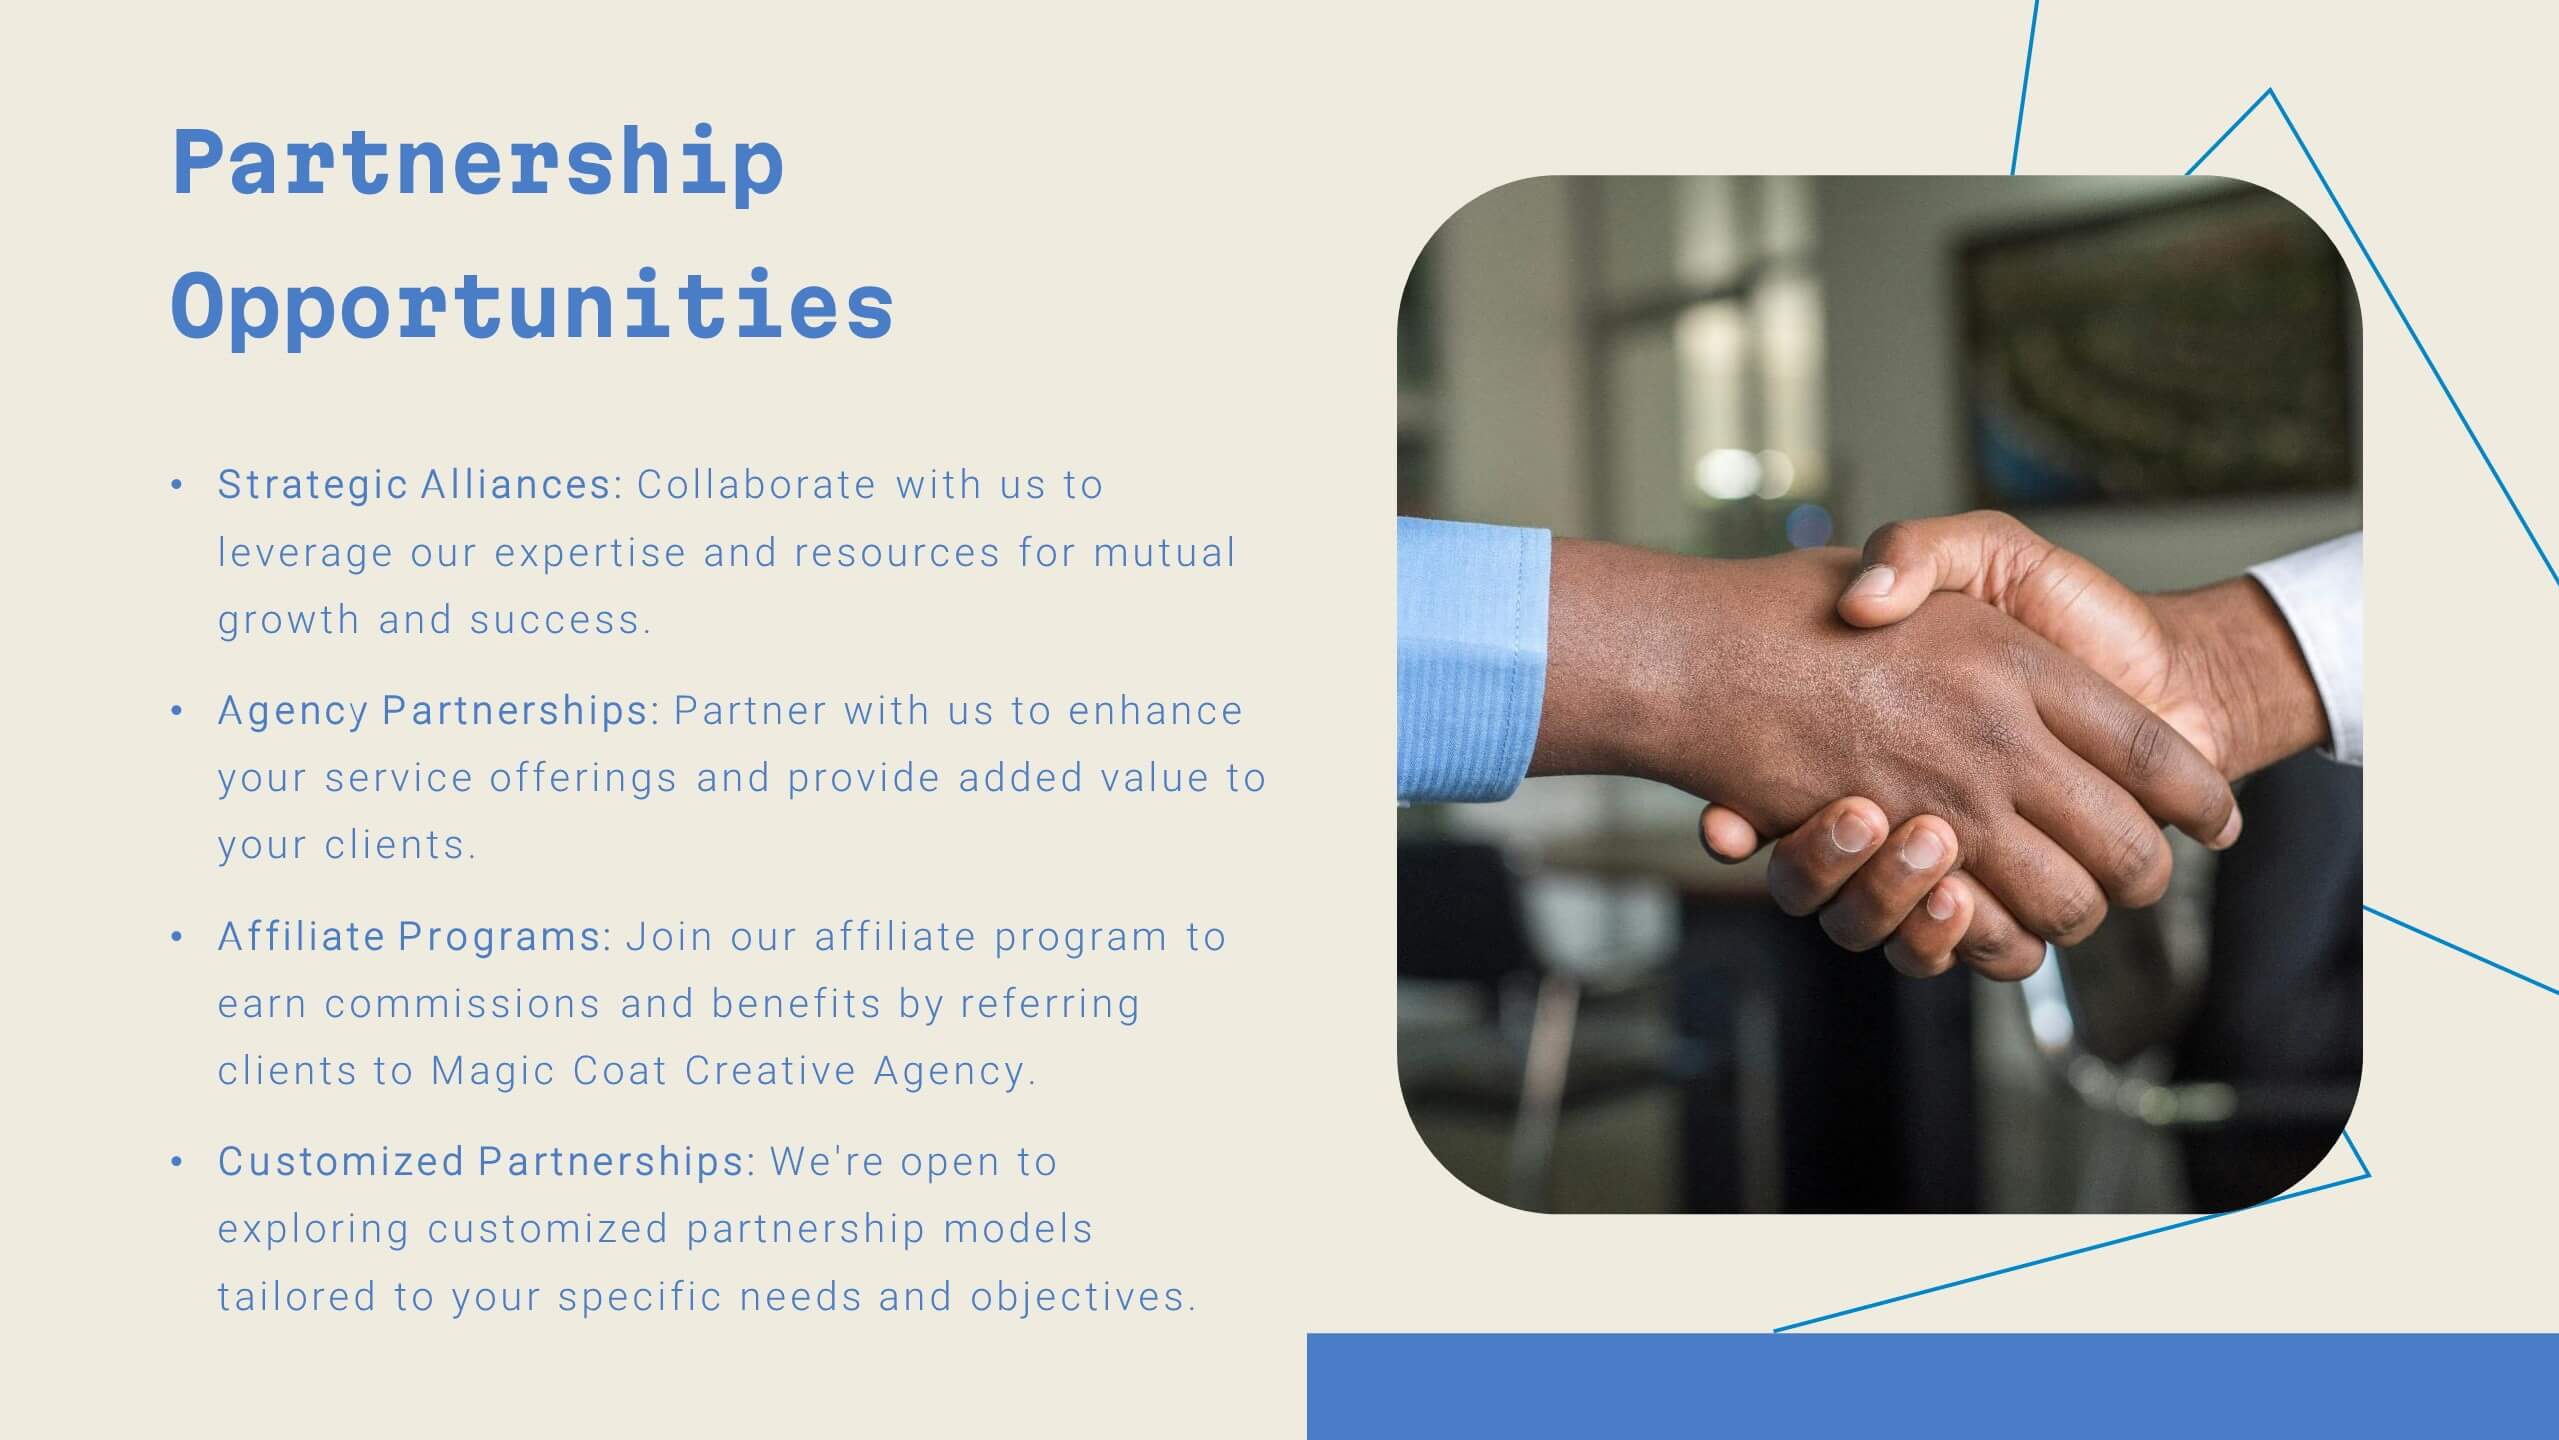
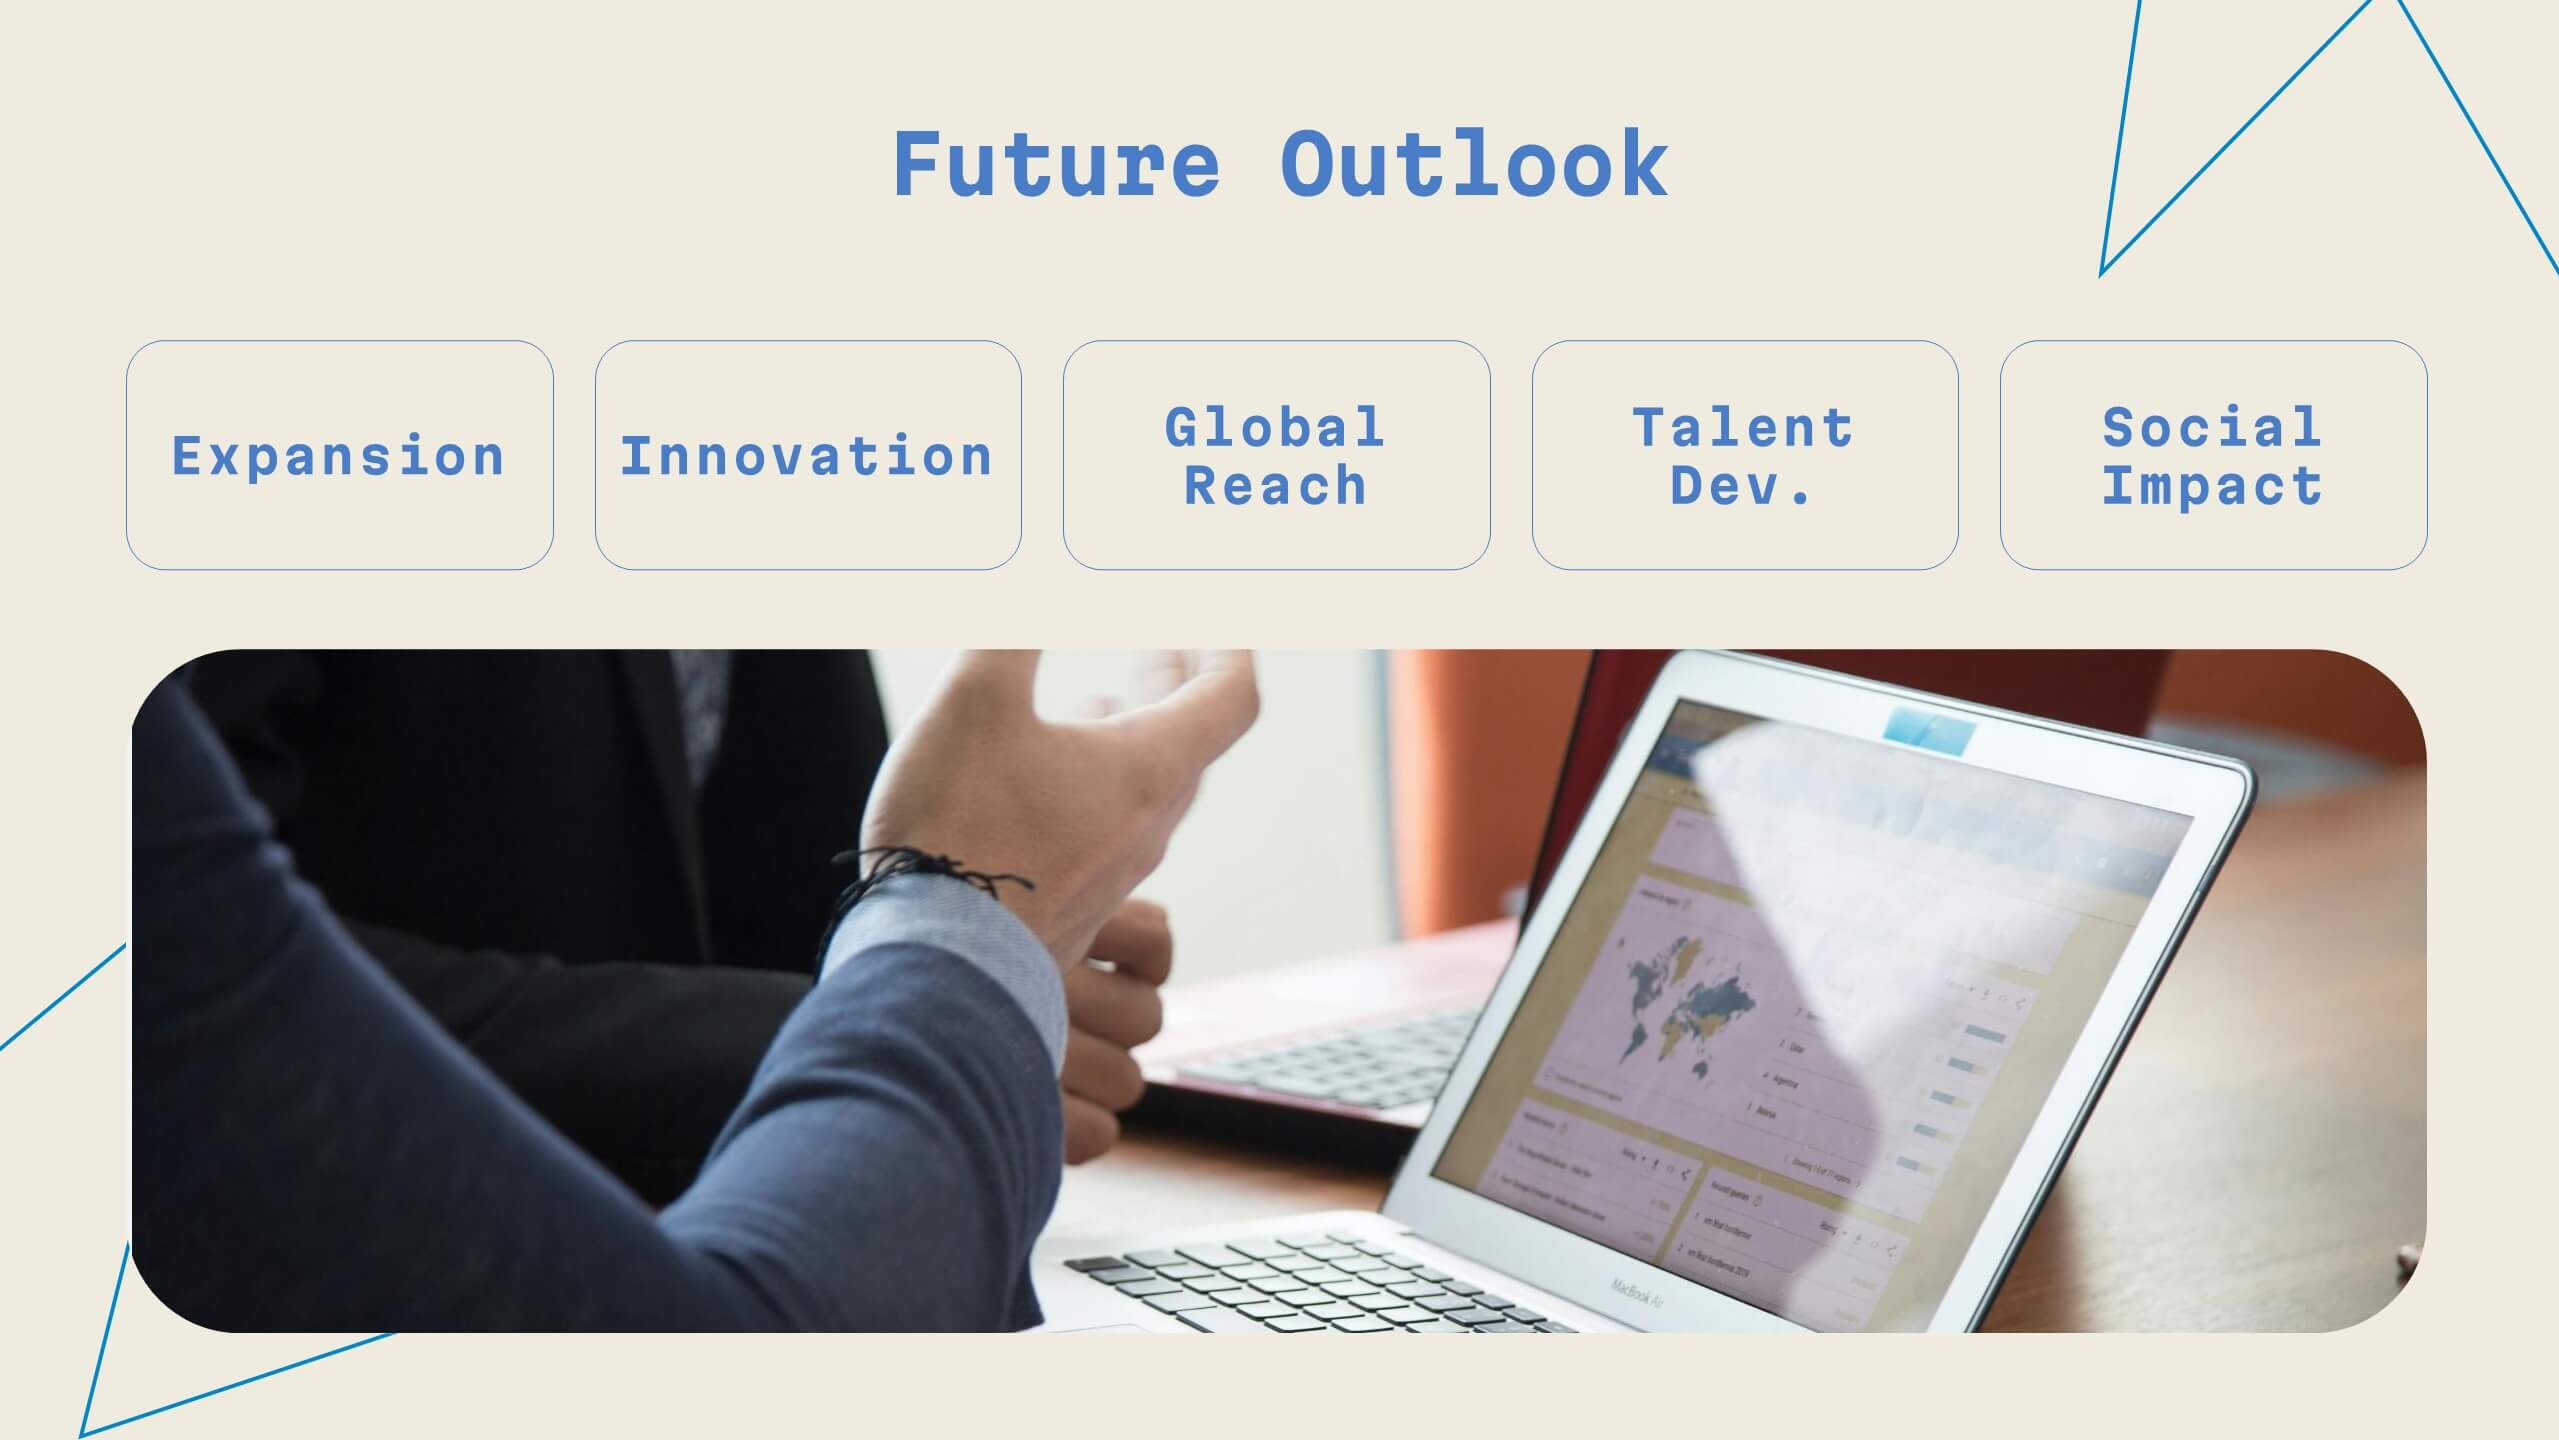
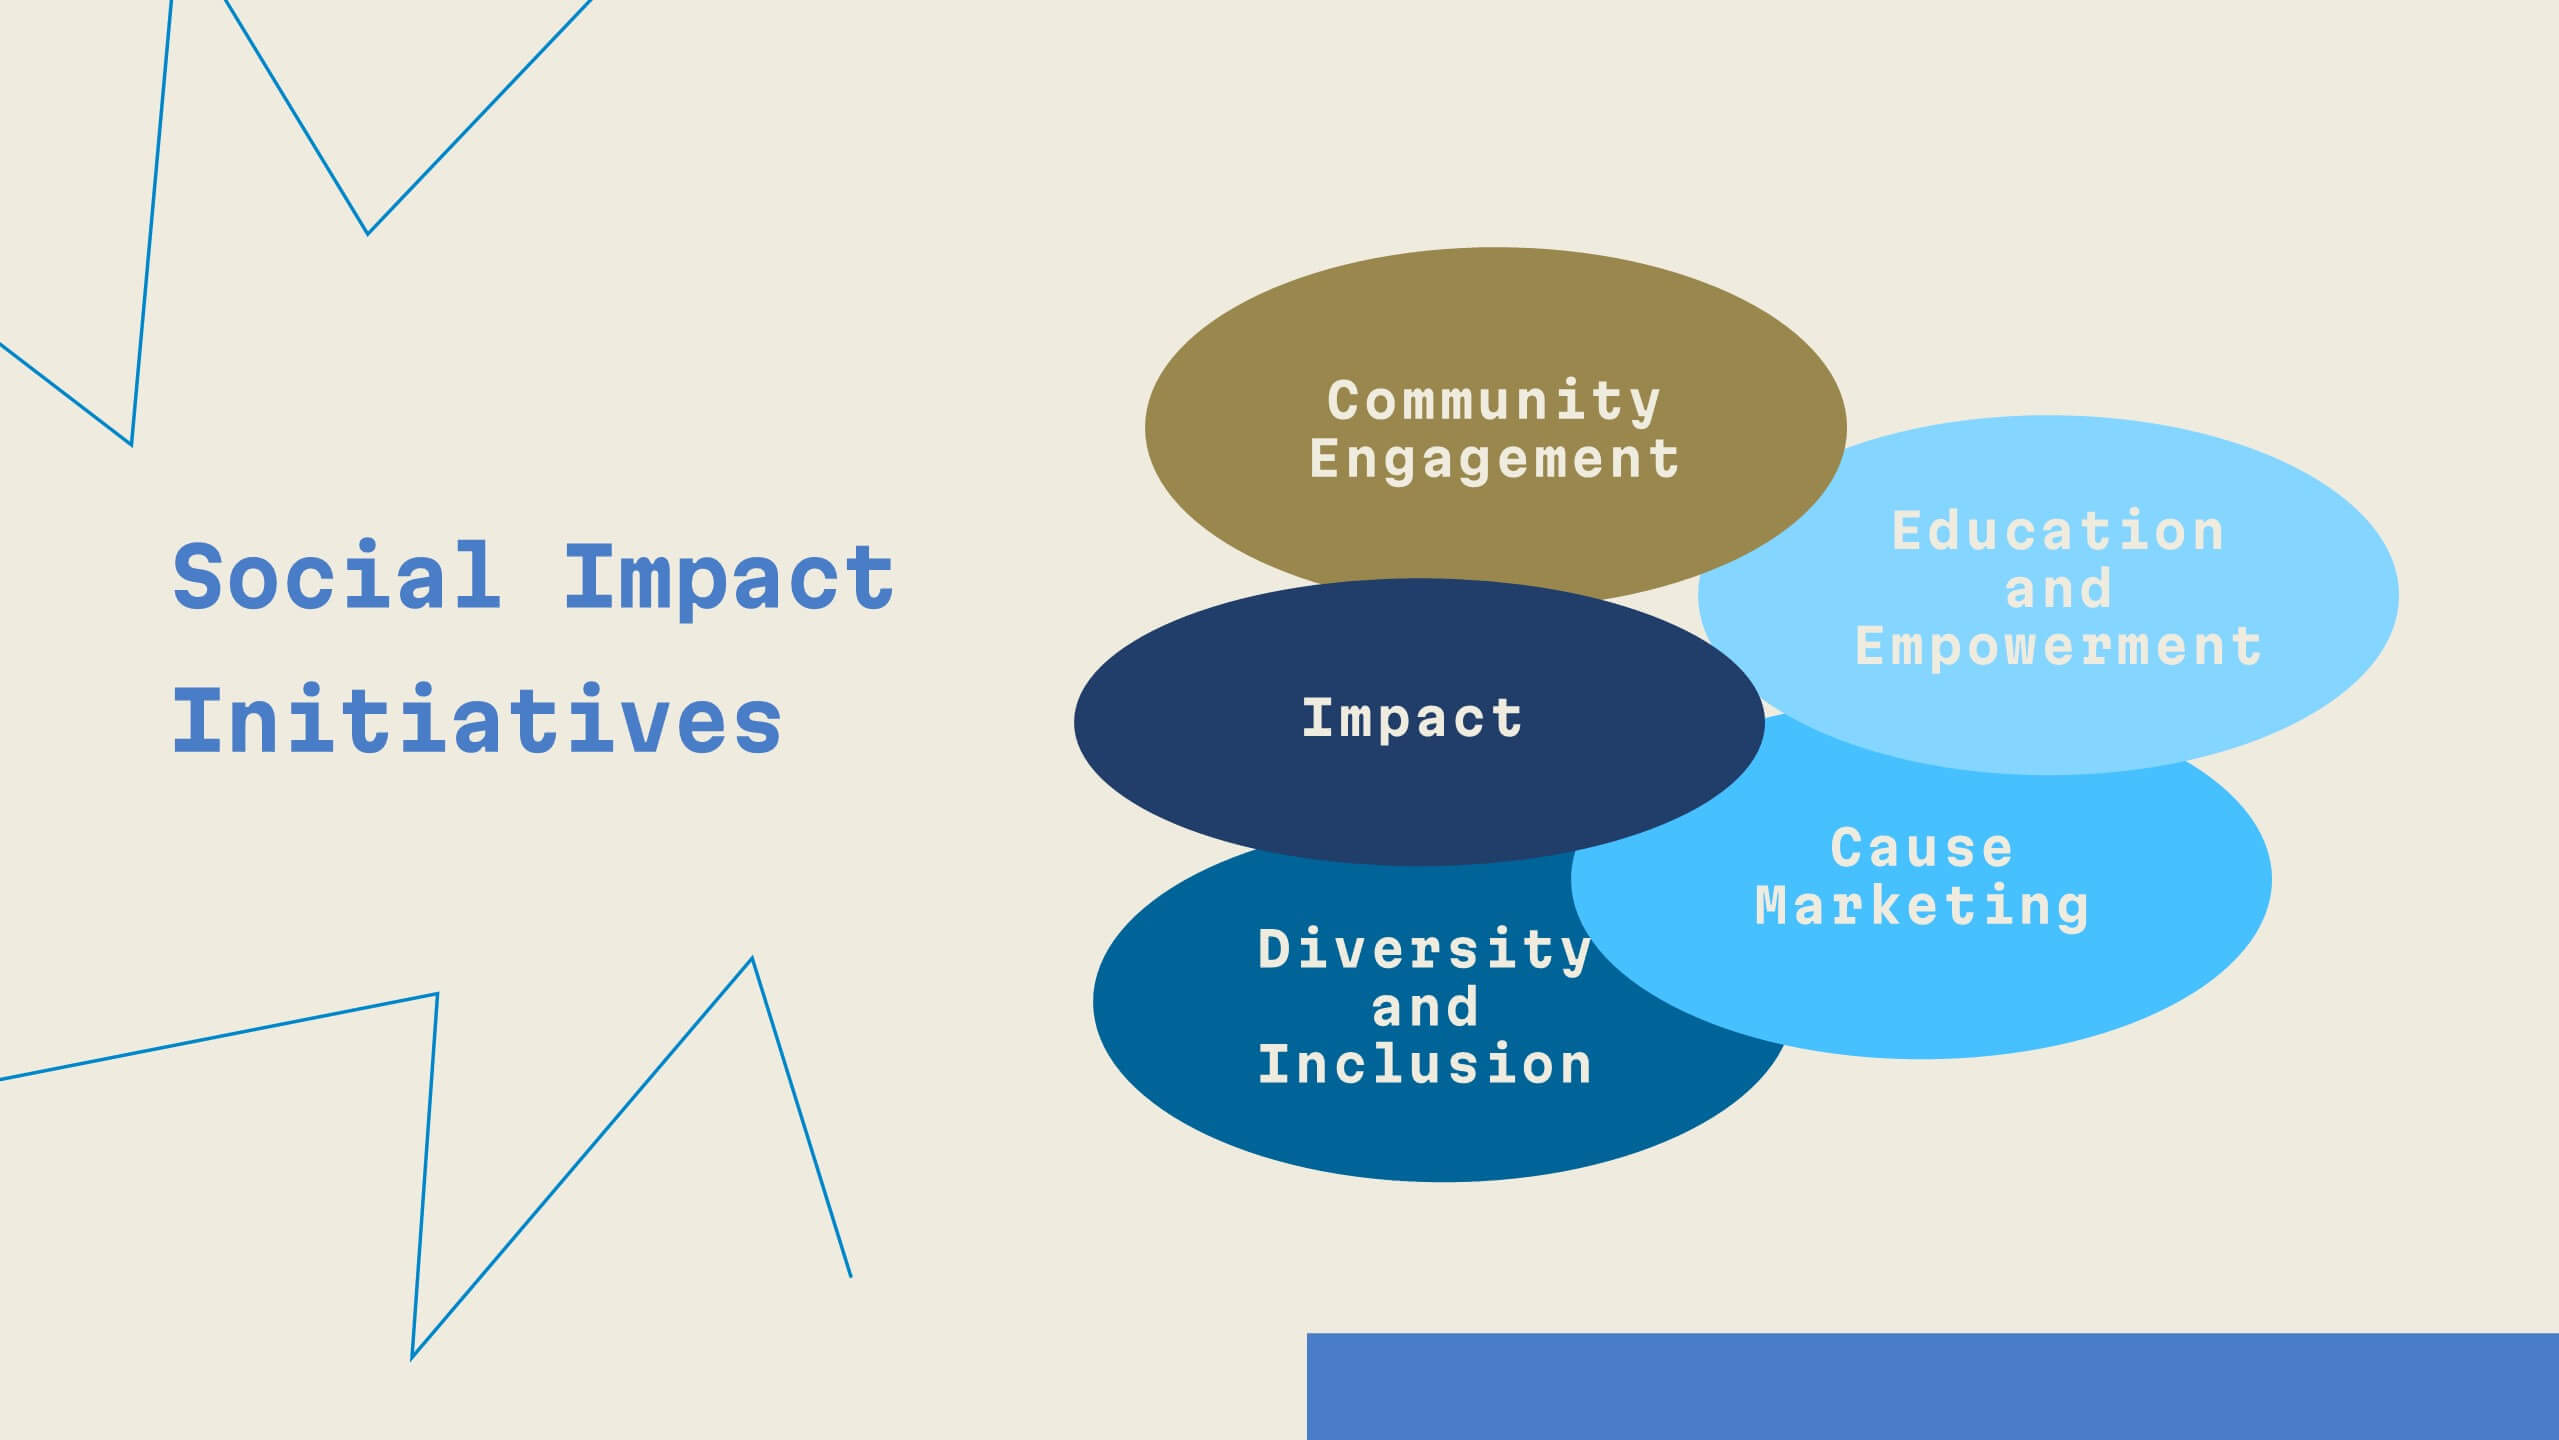
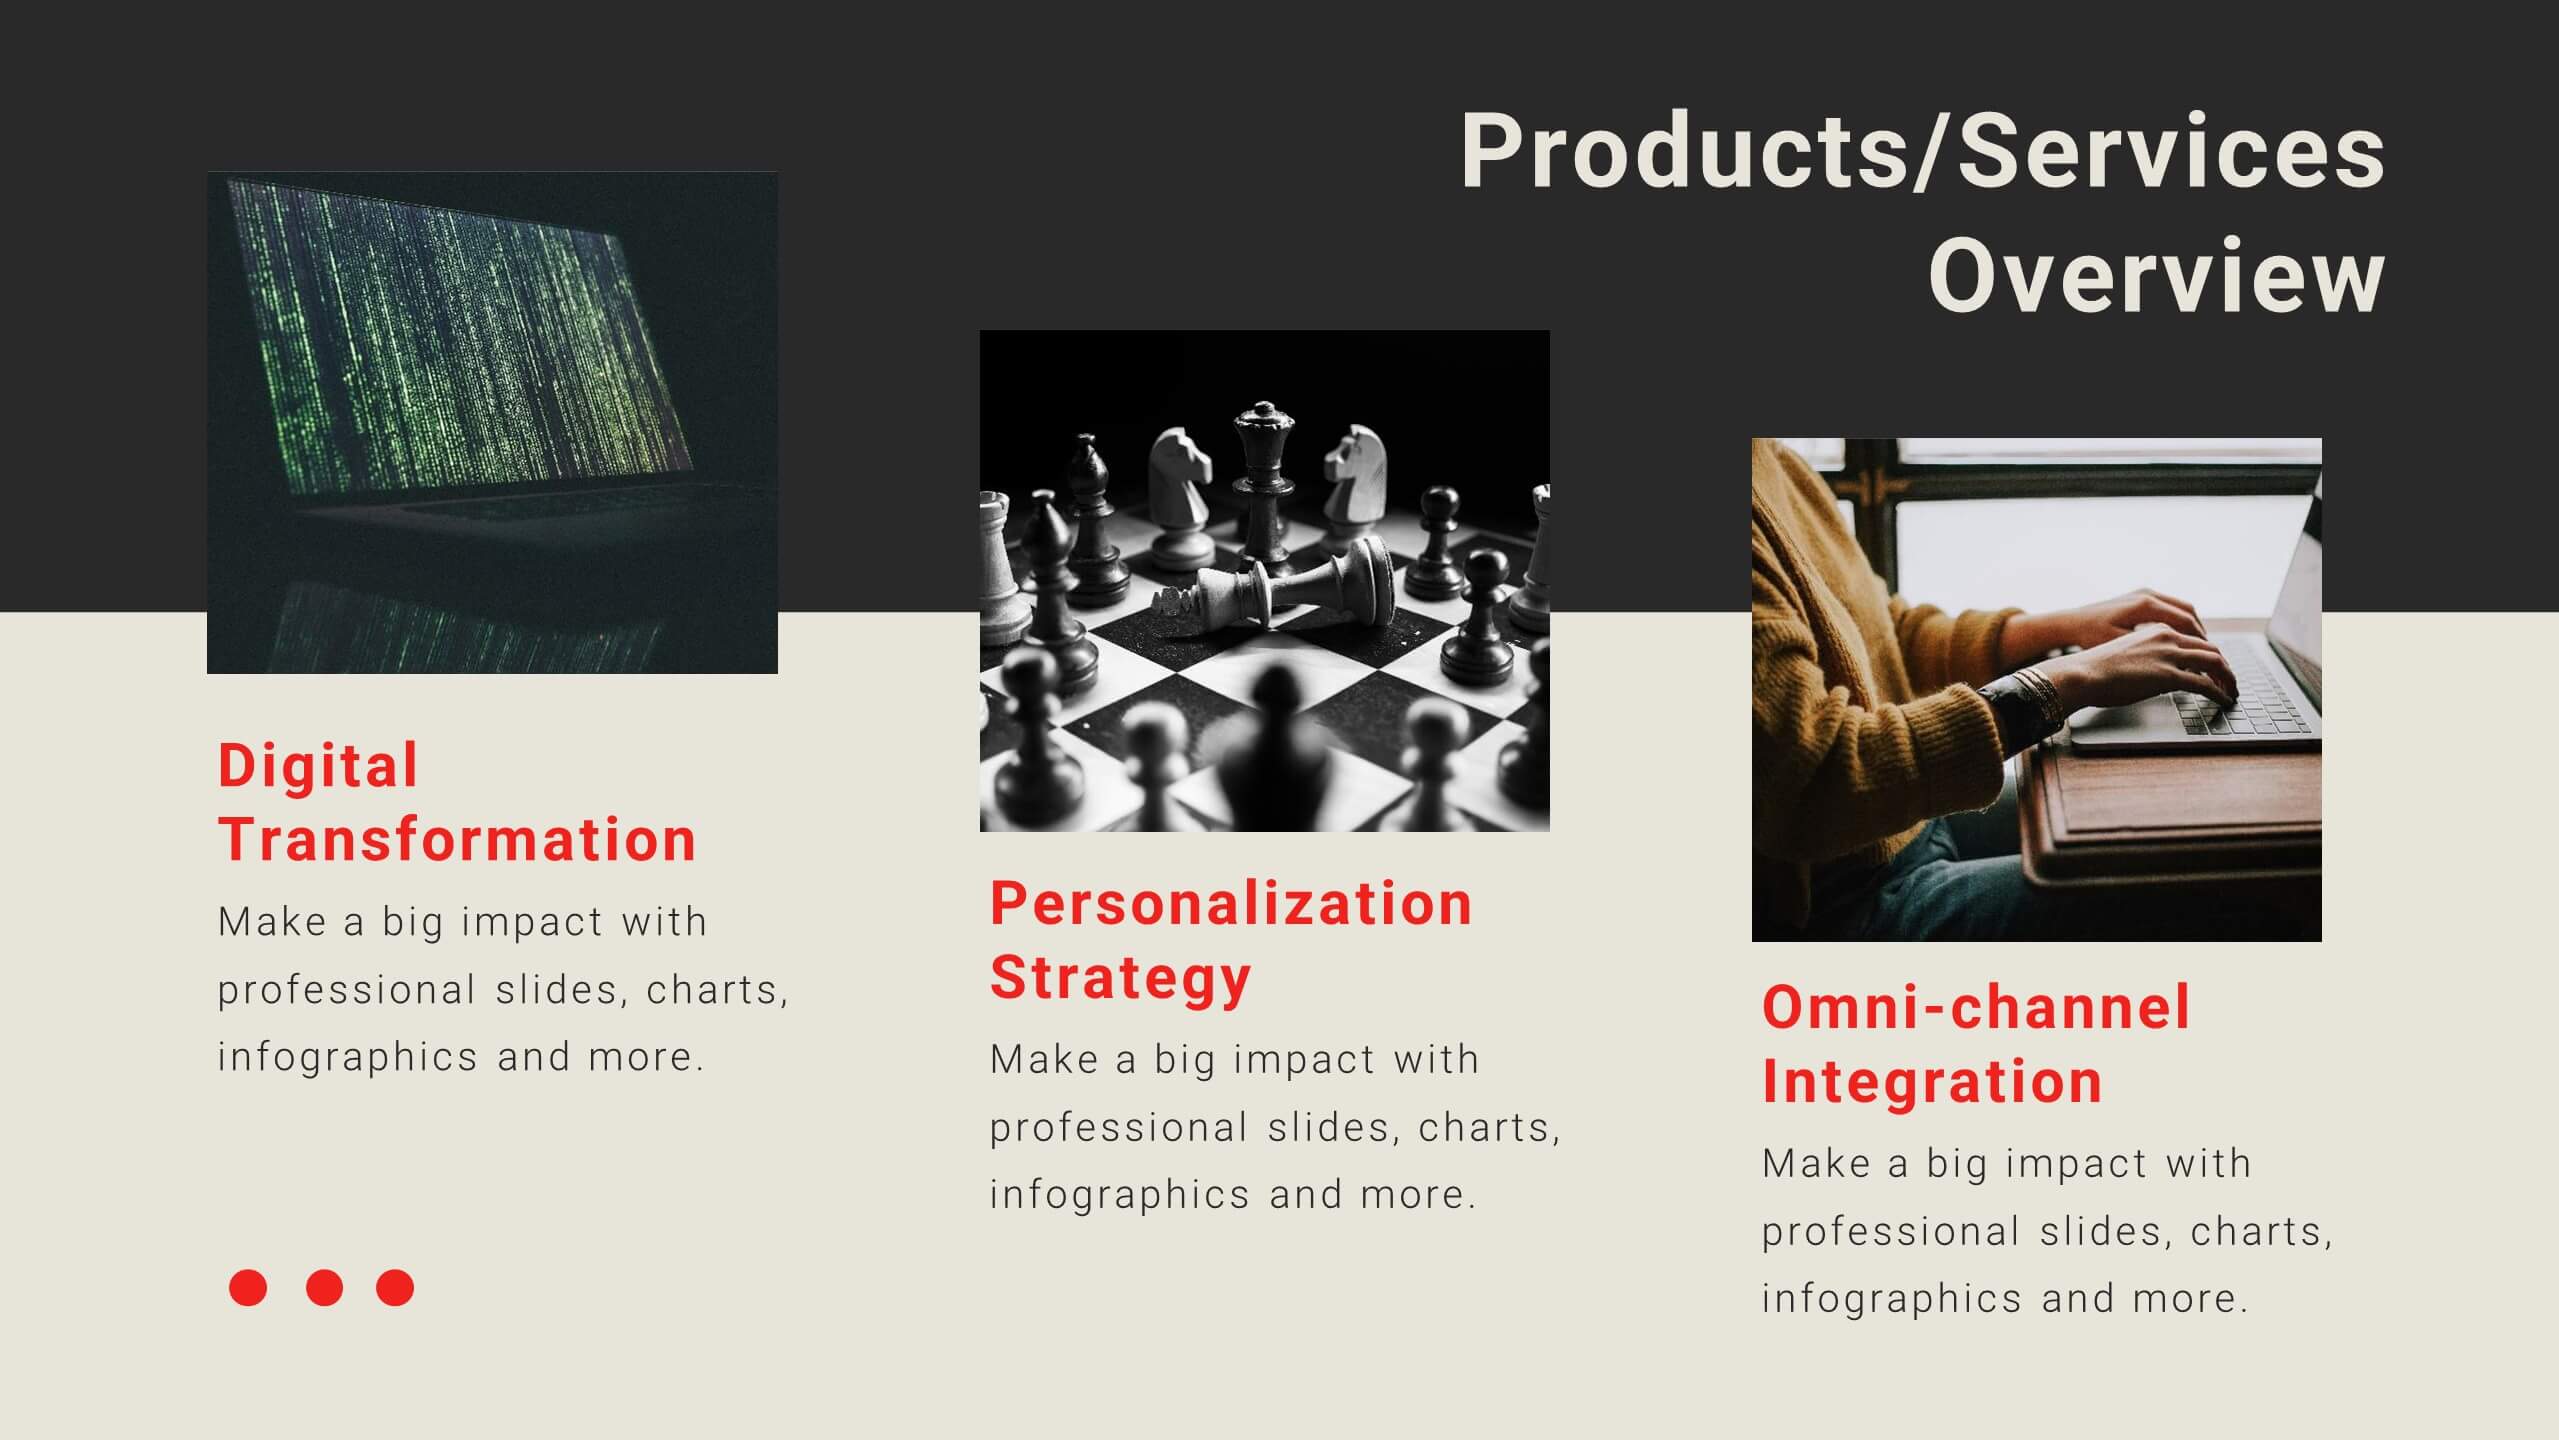
Sky Drop Full-Service Agency Project Plan Presentation
Step into the world of strategic creativity with the Sky Drop Agency Project Plan template! Designed for modern agencies looking to impress clients and stakeholders, this template offers a sleek and professional design that highlights your agency's strengths, processes, and successes. With dedicated sections for mission and vision, team introduction, services, and client testimonials, this template provides a comprehensive overview of your agency's capabilities. It's perfect for showcasing case studies, market analysis, and future outlooks, helping you to build trust and establish credibility. Whether you're presenting a new project plan or updating clients on progress, this template ensures your information is communicated clearly and effectively. Fully customizable and compatible with PowerPoint, Keynote, and Google Slides, the Sky Drop template is your go-to for creating presentations that leave a lasting impact. Impress your audience and elevate your agency's brand with this powerful presentation tool!


6 slides
Numerical Data Infographic Presentation
Present complex data in a visually engaging way with the Numerical Data Infographic Presentation template. Featuring bar charts, percentage indicators, and segmented data visuals, this template makes statistical analysis clear and digestible. Perfect for business reports, analytics presentations, and performance reviews, this fully editable set is compatible with PowerPoint, Keynote, and Google Slides.


6 slides
Credit Card Features Overview Presentation
Bring your audience into the world of smart spending with a clean, visual layout that explains key credit card features in a simple, engaging way. This presentation helps you break down benefits, terms, and essential details with clarity and confidence. Fully editable and compatible with PowerPoint, Keynote, and Google Slides.


6 slides
Project Management Skills Infographic
Optimize your project management presentations with our Project Management Skills Infographic. This intuitive template breaks down complex project stages into an easy-to-follow visual flow, perfect for PowerPoint, Google Slides, and Keynote users. Ideal for managers, team leaders, and educators, it emphasizes critical skills in project management. Customize each segment with your milestones, timelines, or skill requirements. Its sleek design and adaptable format make it a go-to for illustrating project roadmaps and management strategies. Equip your audience with a clear understanding of project dynamics and foster a collaborative environment with this essential tool.


7 slides
Communication Styles Infographic
Dive into the diverse world of communication with our communication styles infographic. Set against a palette of blue, yellow, and white, this template offers a visual exploration of different communication methods and their nuances. Whether it's assertive, passive, aggressive, or passive-aggressive, understanding these styles is vital in both personal and professional settings. Ideal for corporate trainers, educators, students, or anyone aiming to improve their interpersonal skills. Crafted for clarity and compatibility, this infographic is an excellent addition to PowerPoint, Keynote, and Google Slides, ensuring your presentations resonate with both substance and style.


7 slides
Agenda Company Infographic
Optimize your corporate meetings with our premium collection of company agenda slide templates. Each slide is precisely designed to streamline and enhance the presentation of meeting agendas within a corporate setting. These templates are perfect for laying out the sequence of discussions, key points, and decision-making processes planned for corporate gatherings. The designs range from minimalistic layouts to more detailed ones, incorporating various graphical elements like charts, icons, and timelines to aid in visualizing the meeting’s structure. This not only helps in keeping the meeting on track but also enhances participant engagement by clearly outlining expectations and topics. These agenda slides are fully customizable, enabling adjustments in color schemes, text placement, and design elements to suit your corporate identity and specific meeting needs. Whether it's weekly team meetings, executive briefings, or annual general meetings, these templates provide the necessary structure to conduct efficient and effective corporate discussions.


5 slides
Office Collaboration Illustration Pack Presentation
Visualize modern teamwork with this sleek office collaboration layout. Ideal for showcasing brainstorming sessions, decision-making flows, or team communication, this illustration-driven template is perfect for business updates, internal strategy briefs, or workflow discussions. Fully editable and compatible with PowerPoint, Keynote, and Google Slides.


5 slides
Risk Analysis Bowtie Diagram Presentation
Visualize threats, controls, and consequences effectively with the Risk Analysis Bowtie Diagram Presentation. This dynamic template illustrates cause-and-effect relationships using a bowtie structure, making it ideal for safety audits, project risk planning, or corporate strategy. Fully customizable in PowerPoint, Keynote, and Google Slides for any industry.


21 slides
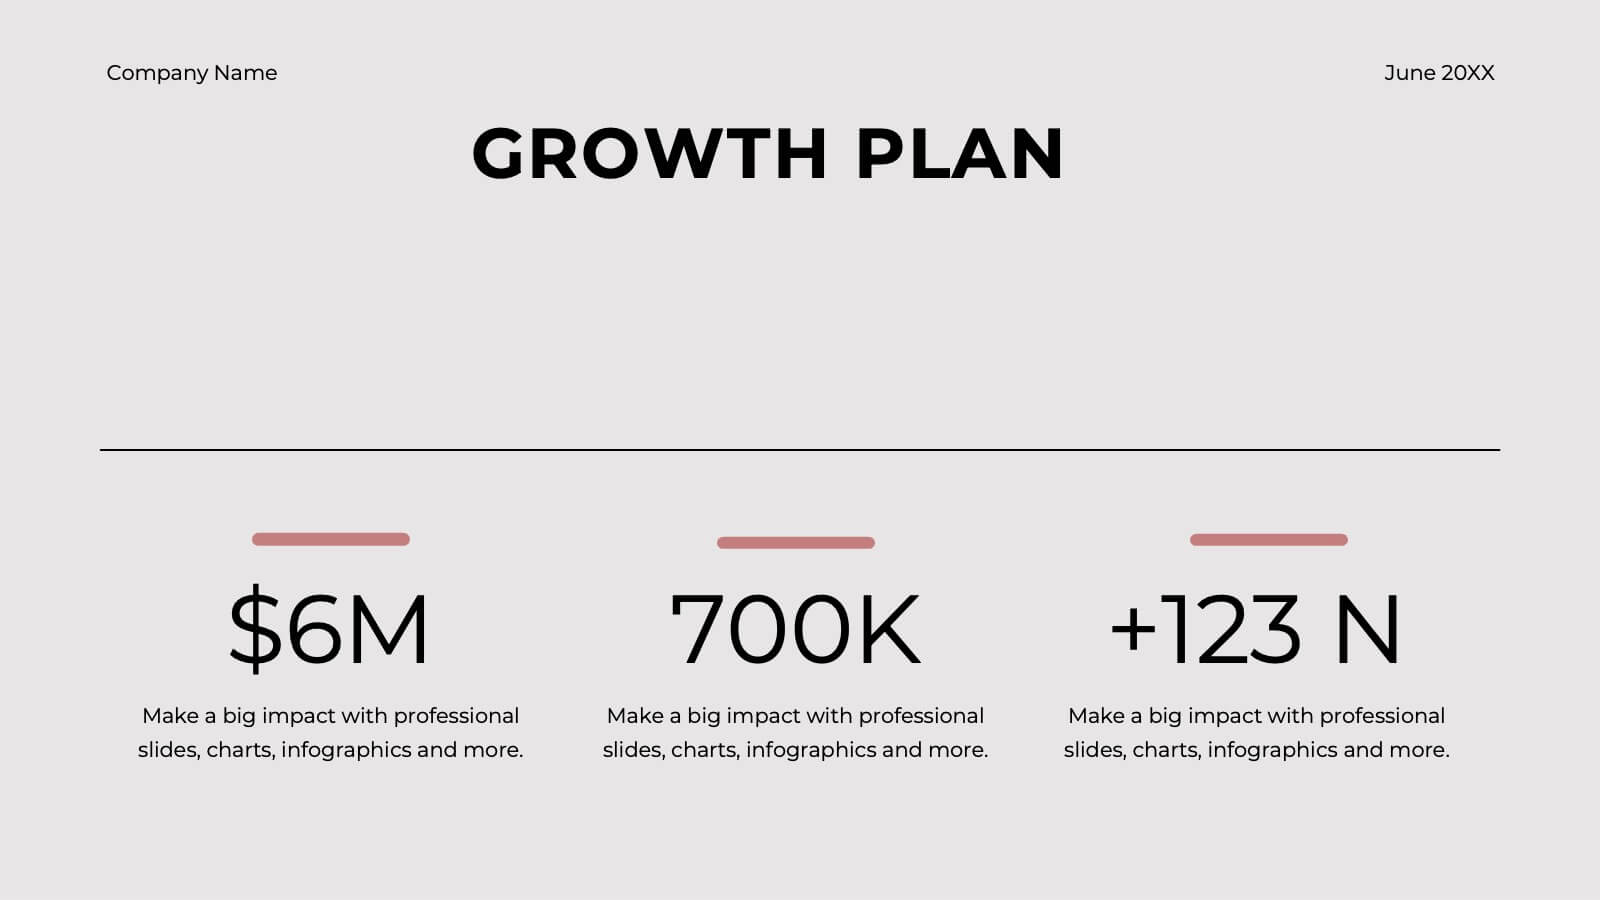
Velocity Startup Growth Plan Presentation
Accelerate your startup's growth with this dynamic plan template! Perfect for outlining your mission, vision, business model, and marketing strategy. Ideal for entrepreneurs aiming to secure funding and drive success. Compatible with PowerPoint, Keynote, and Google Slides, this template ensures your growth plan is clear, professional, and compelling. Achieve your startup goals today!


5 slides
Brain Chemistry Infographics
Brain chemistry refers to the complex interplay of chemicals, also known as neurotransmitters, that are responsible for transmitting signals within the brain. These infographic templates are designed to illustrate the intricate workings of brain chemistry. They aim to explain complex concepts in a clear and engaging way, making it suitable for educational settings, psychology courses, neuroscience presentations, or any context where understanding brain chemistry is essential. These templates set the foundation for exploring various aspects of brain chemistry. Colorful illustrations and icons help visualize the neurotransmitters and their impact.


26 slides
Farming Company Profile Creative Presentation
Step onto the fertile grounds of the farming company landscape, where green fields stretch to the horizon and the golden sun promises a bountiful harvest. With a canvas painted in rich green and sunlit yellow, our template captures the heart and soul of farming life. Adorned with colorful farm-centric graphics, rustic icons, and evocative image placeholders, it's a visual ode to the age-old tradition of agriculture. Meticulously tailored for Powerpoint, Keynote, or Google Slides. Perfect for farming entrepreneurs, agricultural businesses, or anyone rooted in the rich soil of cultivation. Sow your ideas; watch your farming story grow.