


Features
- 5 Unique slides
- Fully editable and easy to edit in Microsoft Powerpoint, Keynote and Google Slides
- 16:9 widescreen layout
- Clean and professional designs
- Export to JPG, PDF or send by email


Do you have any questions?
Recommend


5 slides
Cost Analysis and Budgeting
Visualize financial shifts with clarity using the Cost Analysis and Budgeting Presentation. This slide template uses a dual-stack design to contrast cost reductions against budget increases, supported by percentage change labels and layered visual elements. Ideal for finance teams, operations reviews, or executive summaries, this layout highlights five customizable categories per stack. Compatible with PowerPoint, Keynote, and Google Slides, it's fully editable to match your company branding and color palette.


6 slides
Statistics and Figures Report Presentation
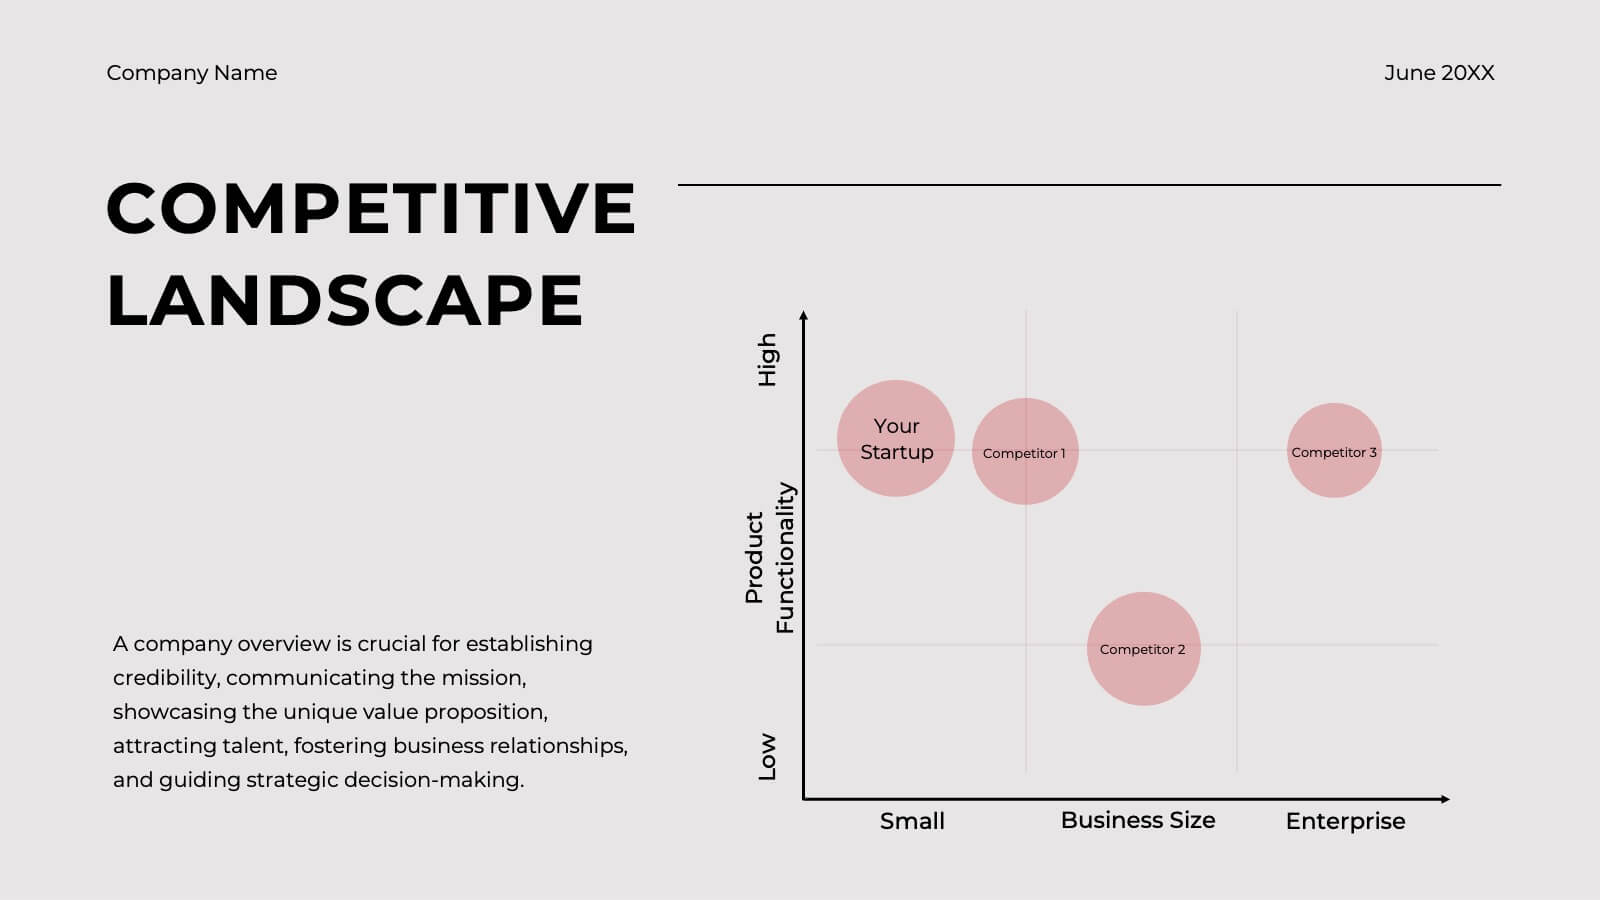
Present complex data with clarity using the Statistics and Figures Report Presentation template. Featuring scatter plots, radar charts, and key metric highlights, this template is perfect for performance tracking, analytics reports, and business reviews. Fully customizable for PowerPoint, Keynote, and Google Slides, it ensures professional and insightful data visualization.


23 slides
Grecian Startup Growth Plan Presentation
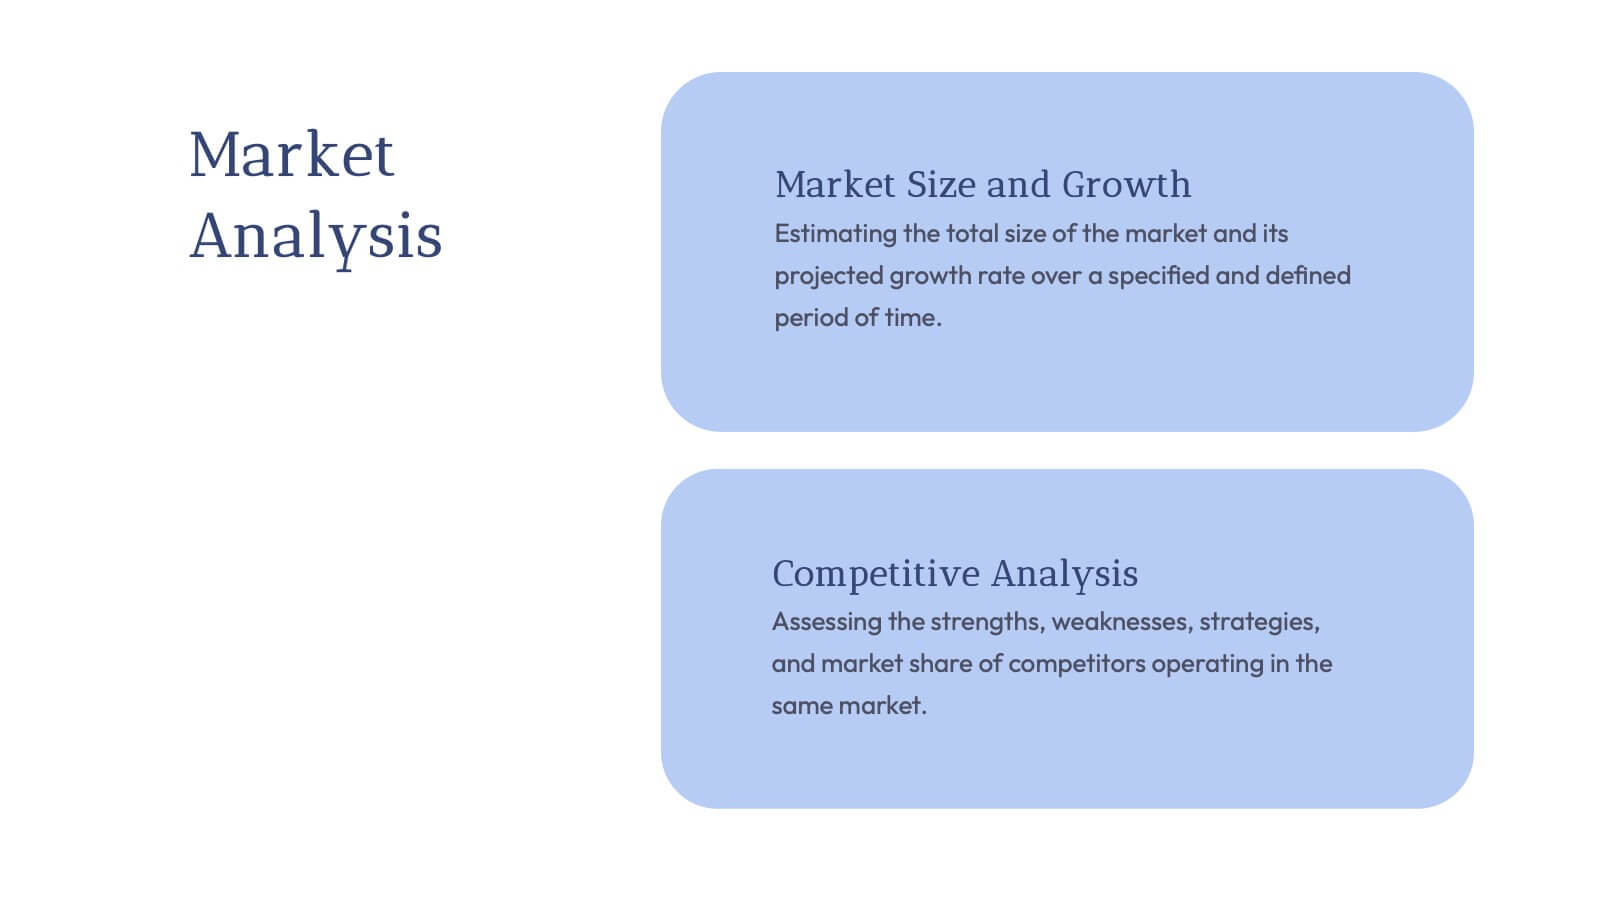
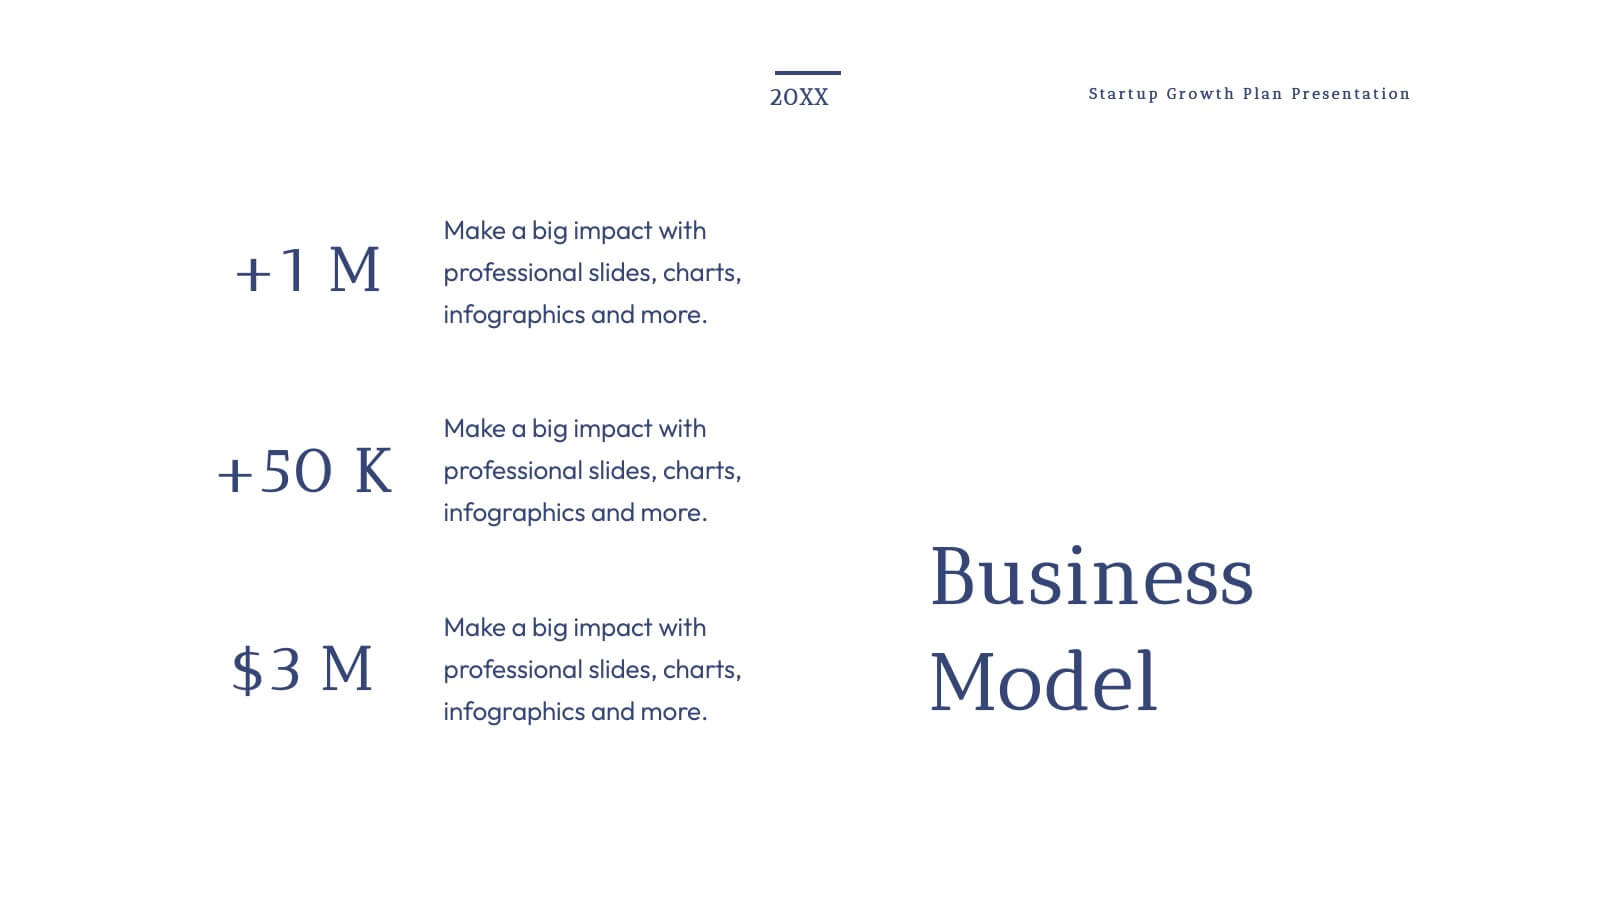
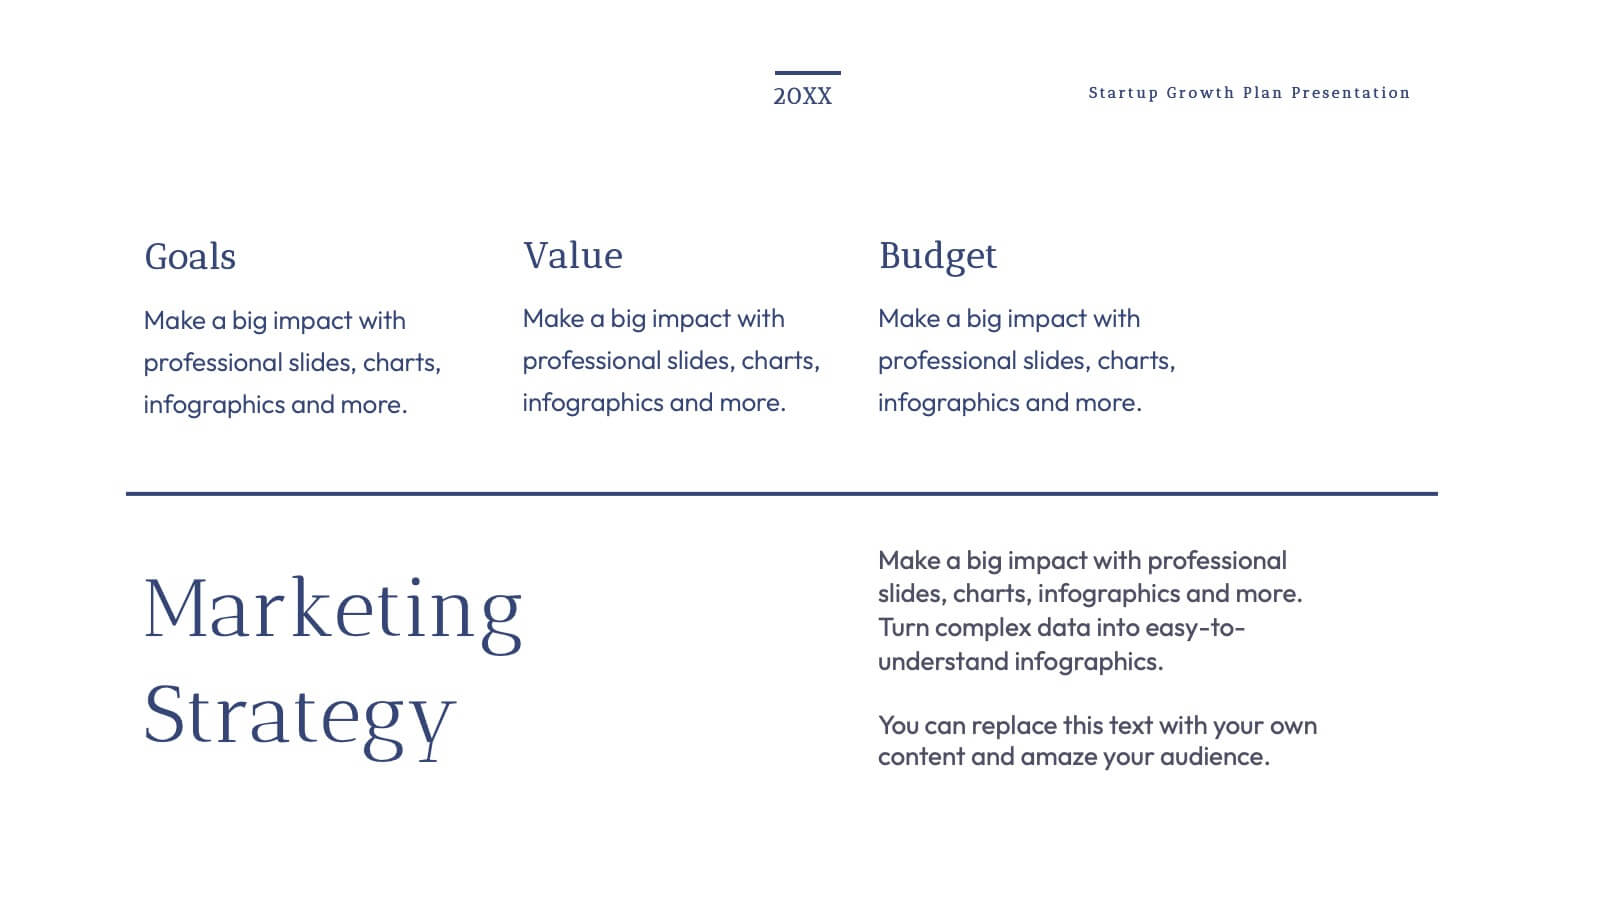
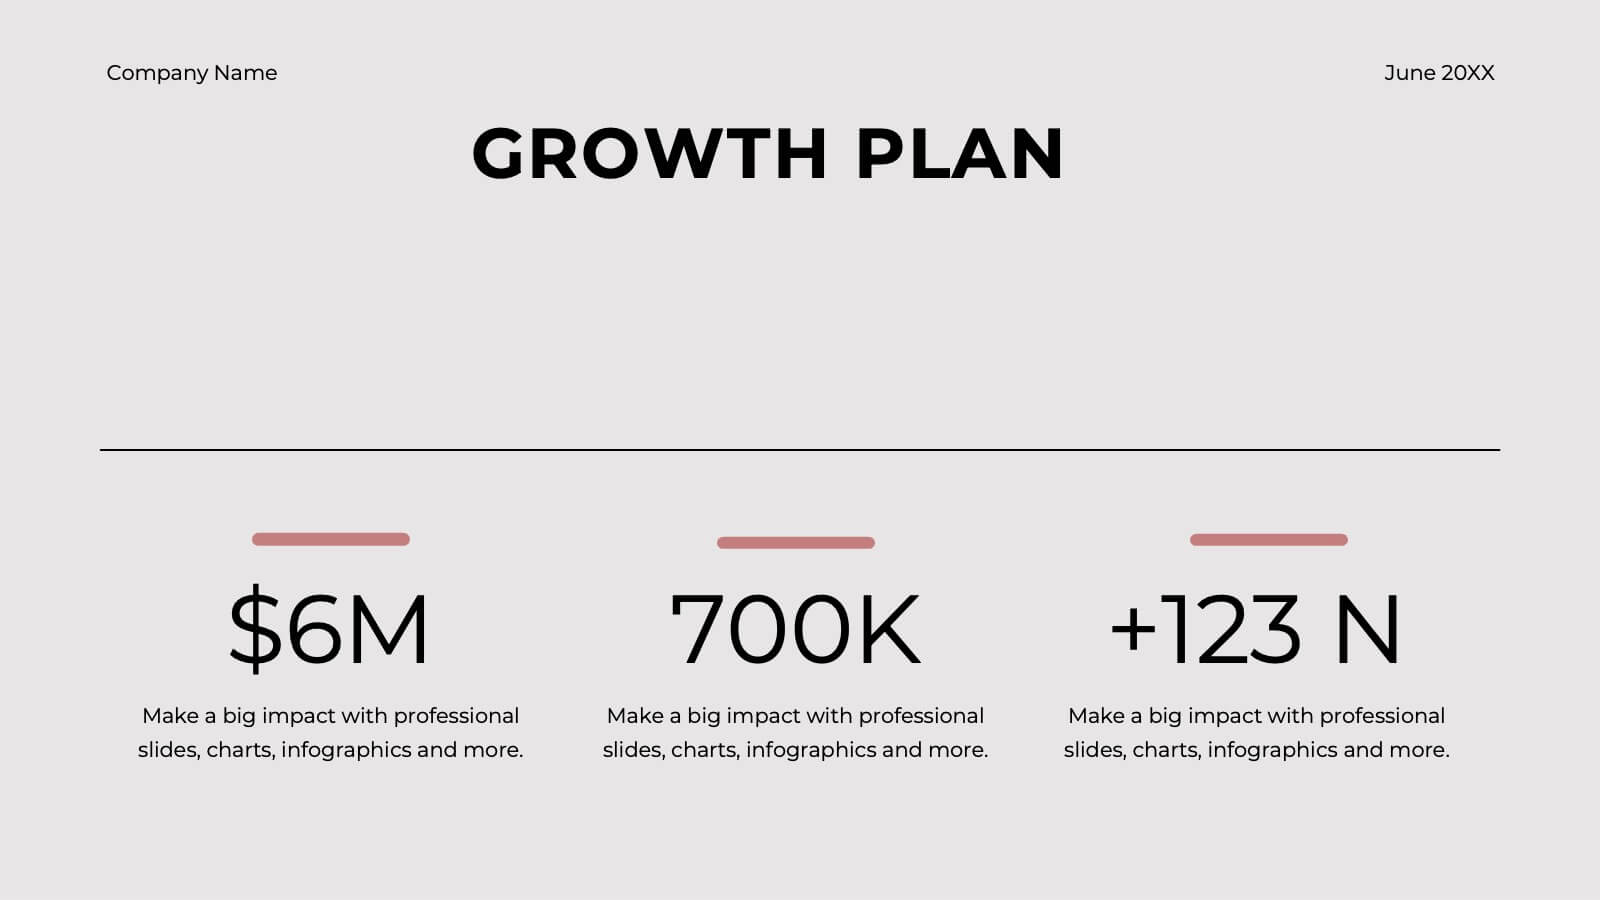
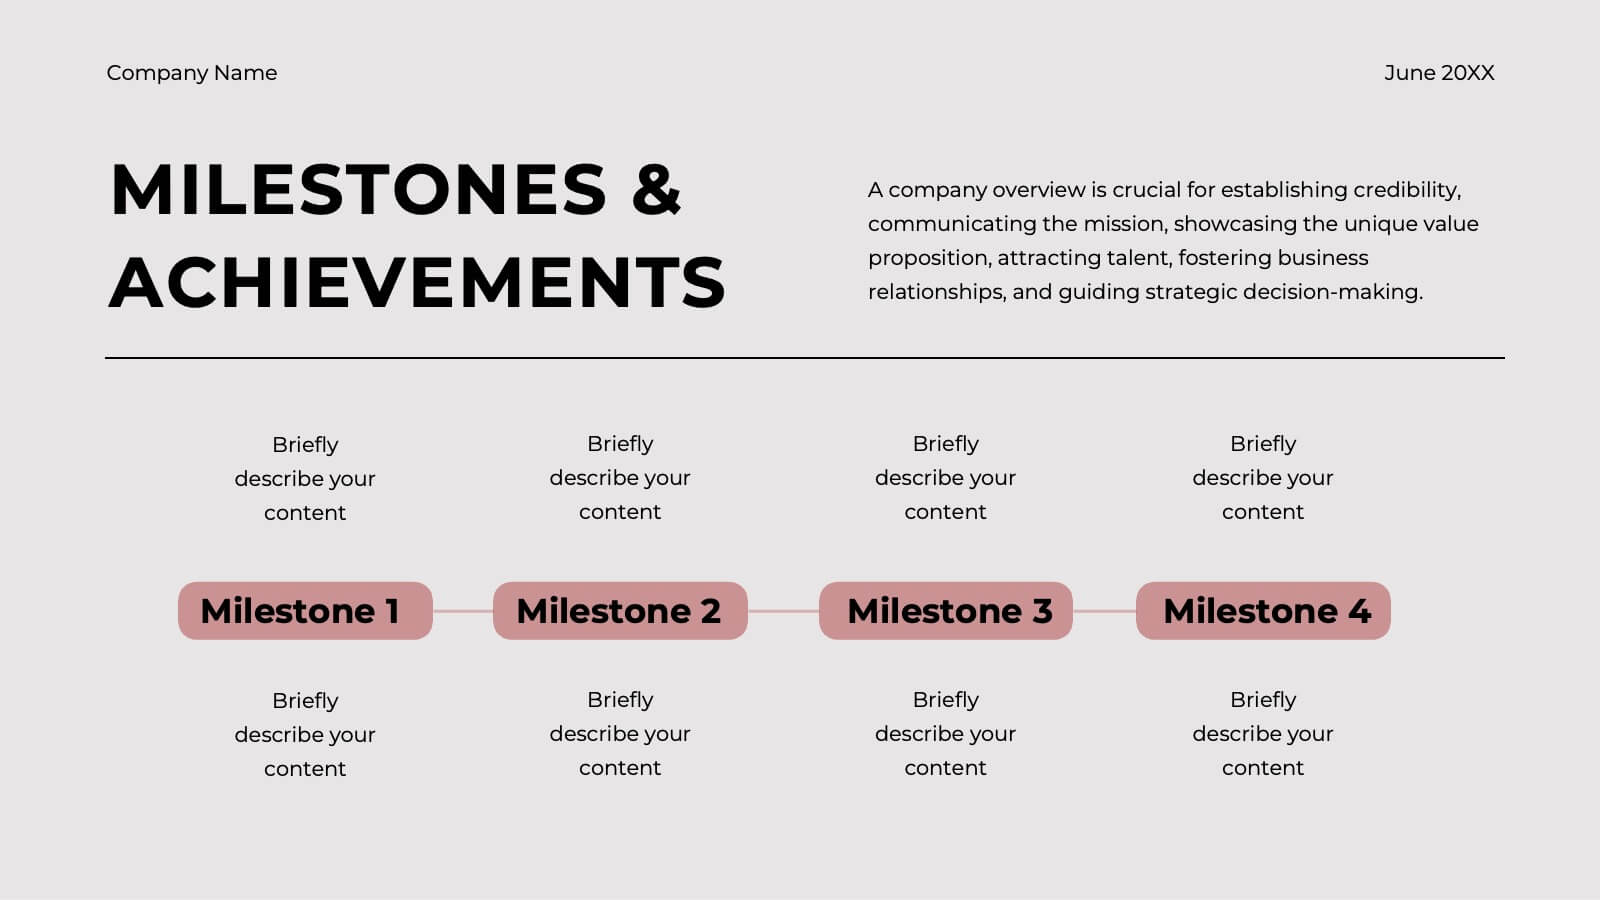
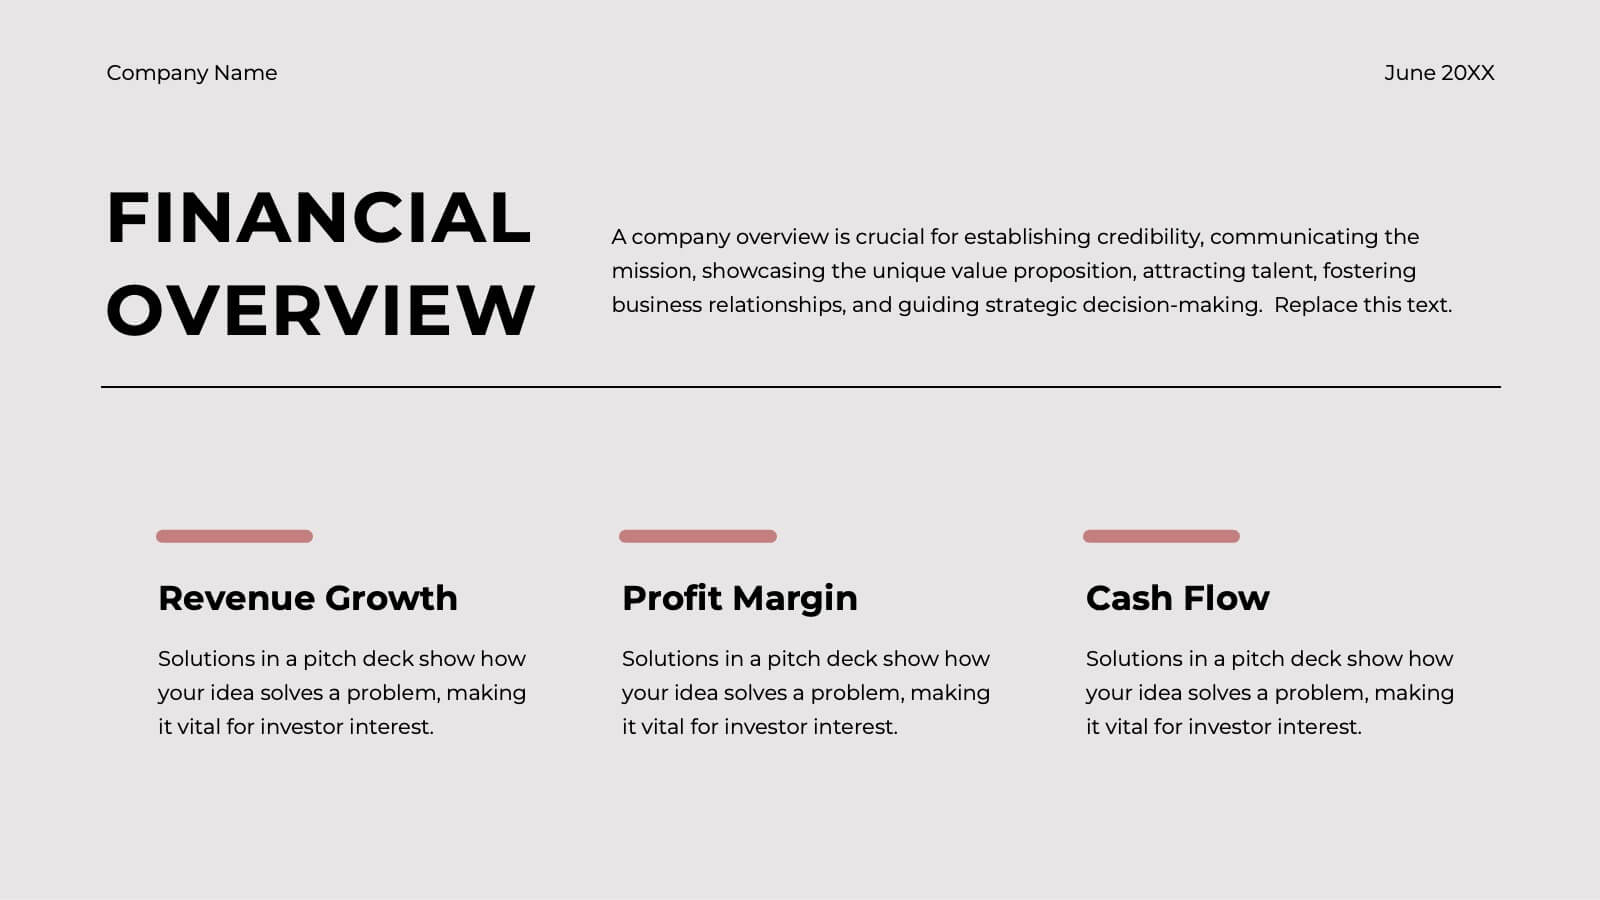
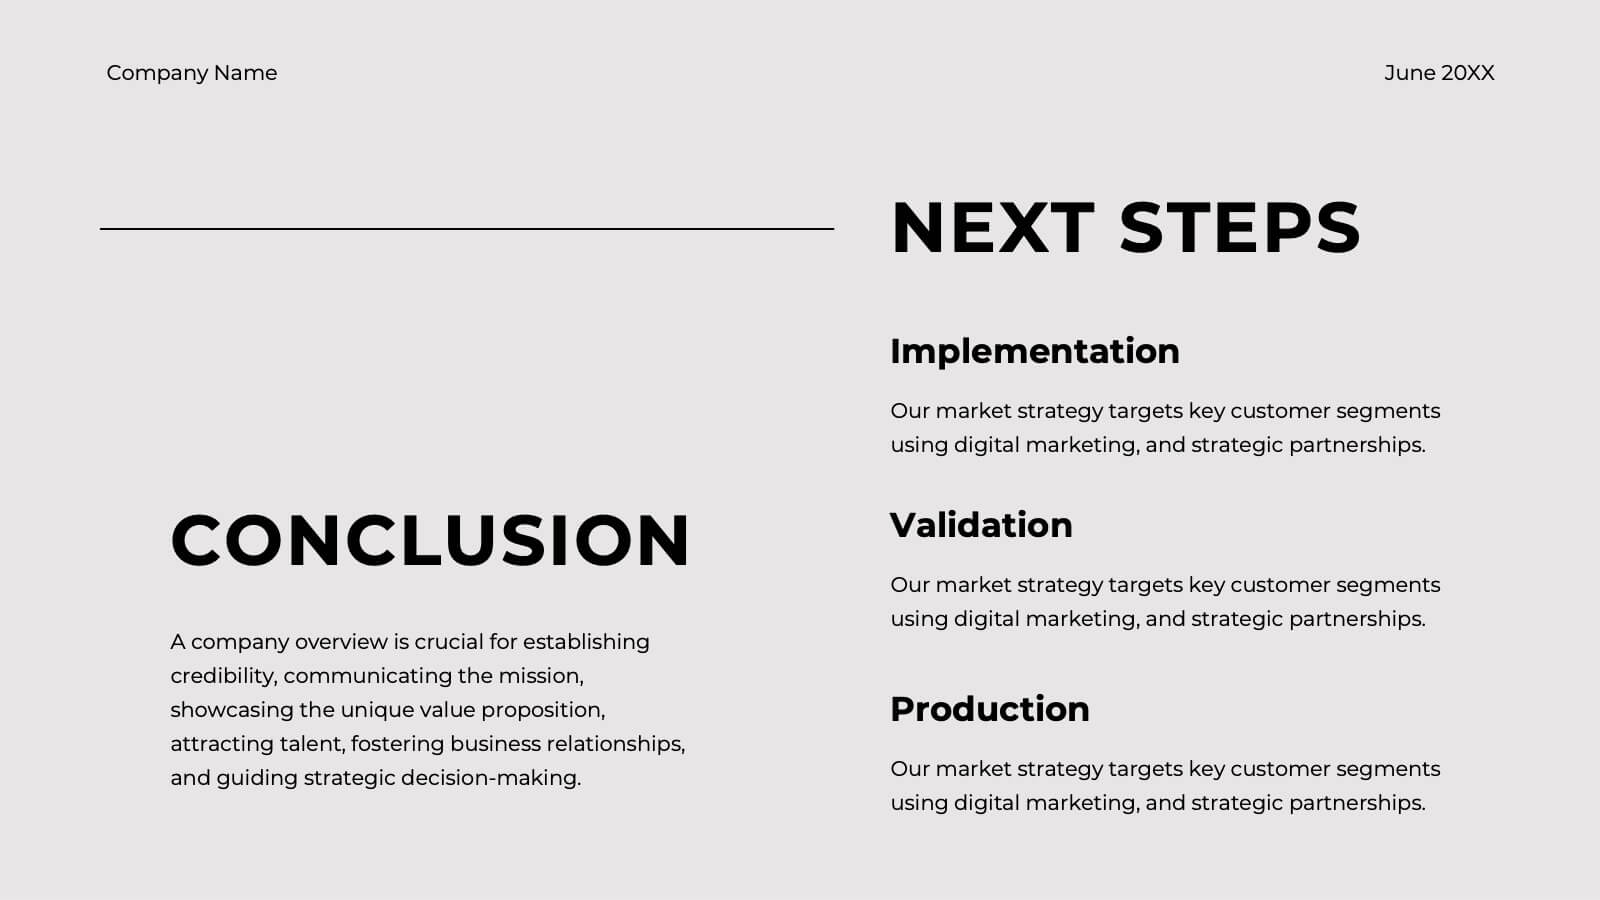
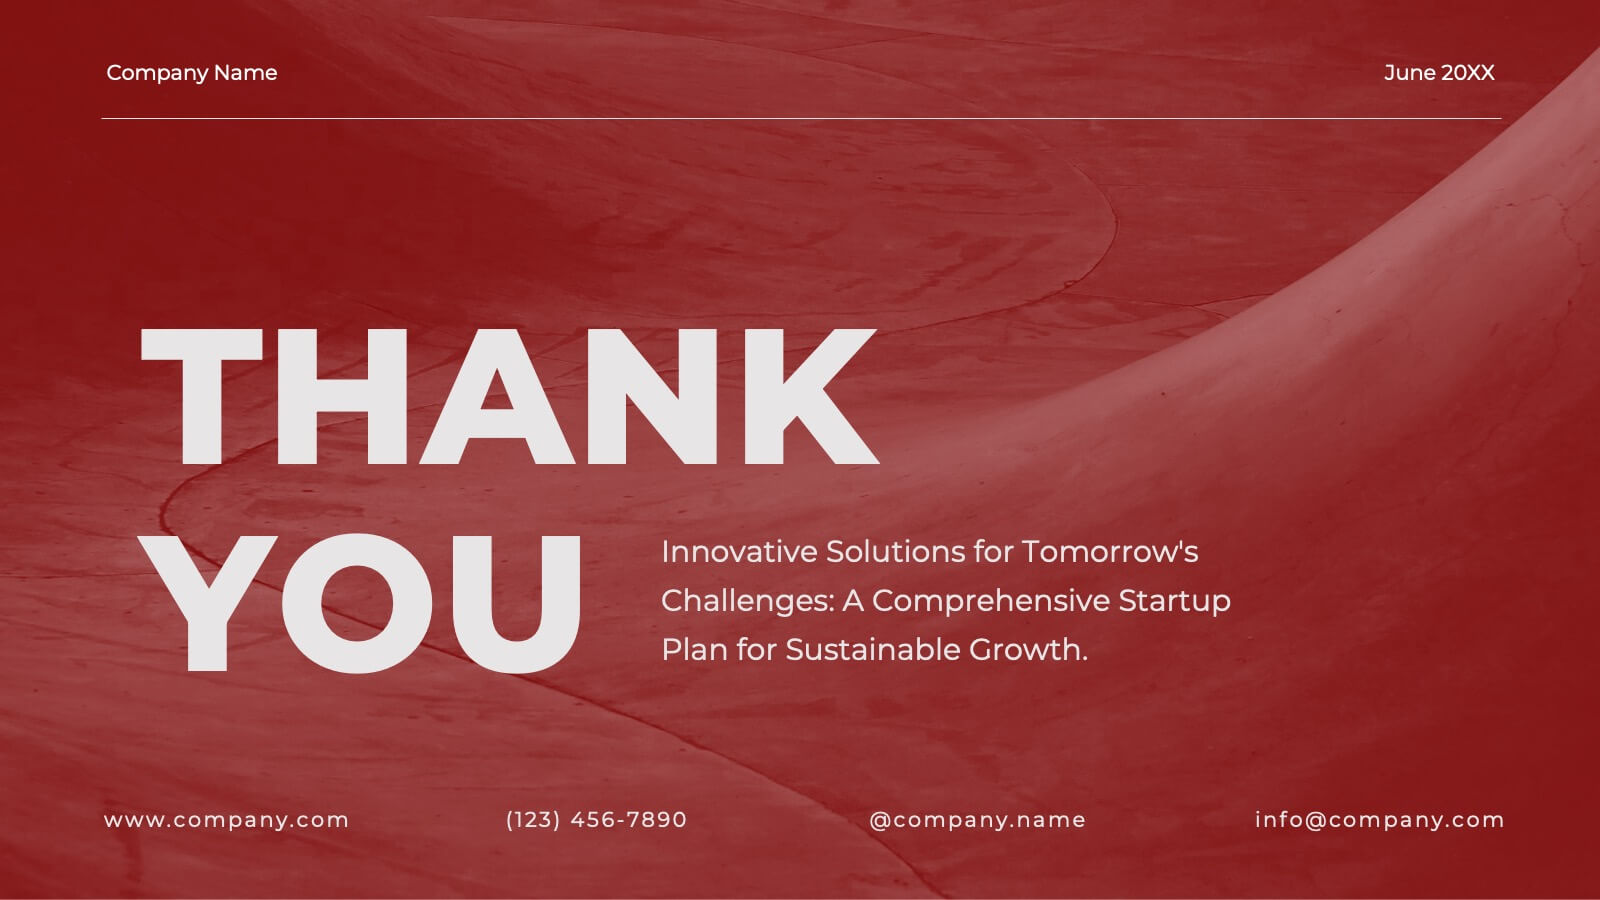
Elevate your pitch with this stunning Grecian-inspired presentation template, perfect for outlining your startup's growth plan! Showcase your business strategy, revenue projections, and scaling opportunities with a clean, elegant design that grabs attention. Impress investors and stakeholders with every slide. Compatible with PowerPoint, Keynote, and Google Slides for seamless customization.


6 slides
Onboarding 30-60-90 Day Roadmap Presentation
Get your team excited from day one with this colorful, easy-to-follow visual layout! This presentation template helps clearly map out onboarding goals and key activities across 30, 60, and 90 days. Perfect for HR professionals and team leads, it's fully editable and works with PowerPoint, Keynote, and Google Slides.


26 slides
Kohen Presentation Template
Kohen is a minimal coffee shop template that features slide designs you can use together, making it perfect for sharing your business and services. It is easy to use, resulting in convenient high quality presentations. This template design can be used to create more elaborate presentations about food and restaurants. It is complete with charts, images, and text boxes for endless presentation possibilities. This template will help make your message more compelling and informative. The presentation includes a variety of tools and resources, to highlight key points and ideas with minimal text.


21 slides
Ember Startup Growth Plan Presentation
Launch your entrepreneurial journey with this dynamic startup plan template! Perfect for detailing your mission, market strategy, and unique value proposition, it features professional slides for customer analysis, business models, and financial projections. Present your innovative ideas clearly and convincingly. Compatible with PowerPoint, Keynote, and Google Slides for seamless presentations on any platform.


6 slides
Create Challenge Infographic
Challenges are obstacles, difficulties, or problems that individuals, organizations, or societies face while trying to achieve their goals or navigate through various situations. This infographic template involves visually presenting a specific challenge, its context, and possible solutions in an informative way. Summarize the key takeaways from the infographic, emphasizing the importance of addressing the challenge and implementing the suggested solutions. An effective challenge infographic can be used for educational purposes, presentations, or as a reference guide to help individuals and teams overcome challenges in a structured and informed manner.


4 slides
Meetings Agenda Slide Presentation
Make every meeting feel purposeful with a clean layout that highlights topics, timing, and key discussion points effortlessly. This presentation helps teams stay aligned, organized, and ready to follow the flow of the session. Perfect for planning or reporting. Fully compatible with PowerPoint, Keynote, and Google Slides.


6 slides
Business Growth with TAM SAM SOM Framework
Fuel your next big idea with a clear, structured breakdown of market potential. This easy-to-follow visual helps explain the TAM, SAM, and SOM layers of business growth—ideal for investors, strategy teams, or product managers. Fully editable in PowerPoint, Keynote, and Google Slides for fast, seamless presentation design.


5 slides
Yoga Poses Infographics
Yoga Poses, also known as asanas, are physical postures practiced in the discipline of yoga. They are designed to promote strength, flexibility, balance, and mindfulness. These infographic templates focuses on illustrating various yoga poses and their benefits. It is designed to help individuals understand and practice different yoga poses effectively. This template features beautifully designed infographics with icons and illustrations that showcase different yoga poses. These covers a wide range of yoga, including balancing poses, Chakra yoga, standing poses, and yoga for pregnancy.


5 slides
IT Support and Systems Presentation
Streamline your tech communication with a clean, structured layout that highlights your IT services, support processes, and system workflows. Perfect for teams presenting solutions, infrastructure overviews, or technical strategies, this presentation brings clarity to complex topics. Fully compatible with PowerPoint, Keynote, and Google Slides for effortless editing and delivery.


10 slides
National Distribution Network in the US Presentation
Present your logistics strategy with clarity using the National Distribution Network in the US Presentation. This slide visually maps out your key distribution hubs across the country, pairing each location with a numbered label and space for insights or logistics data. Ideal for supply chain overviews, retail operations, or partner briefings. Fully editable in Canva, PowerPoint, and Google Slides.


10 slides
Customer Satisfaction and Smile Rating Presentation
Visualize customer experience in a clear and engaging way with this Customer Satisfaction and Smile Rating slide. Featuring a vertical feedback meter and 5 customizable rating levels, this template is ideal for highlighting user sentiment, service evaluations, or feedback summaries. Perfect for performance reviews, UX reports, or NPS breakdowns. Compatible with PowerPoint, Keynote, and Google Slides.


8 slides
Medical Case Study Presentation
Elevate your medical presentations with our "Medical Case Study Presentation" template. This infographic is expertly designed to outline medical case studies or healthcare data, showcasing a central image flanked by related statistics and information. Each segment is linked to a visually distinct icon, representing different health metrics or case points, making it easier to digest complex medical information. This template is perfect for medical professionals, educators, and healthcare analysts, providing a structured way to present findings, research, or patient data effectively. Compatible with PowerPoint, Keynote, and Google Slides, it ensures your medical data is communicated clearly and professionally.


7 slides
Geometric Infographic Presentation Template
Our Geometric Infographic template will help you quickly create an original, beautiful and professional presentation with charts and diagrams of any kind. The template includes fully editable slides with a number of built-in shapes, as well as transitions. You can use the template for any kind of presentation involving geometrics. It’s ideal for product presentations and market analysis, but you can also use it to showcase your business case. This geometric Infographic template is a great way to present a large amount of information to an audience and features a clean and modern design!


6 slides
Clear Roadmap and Action Strategy Presentation
Present your strategic roadmap with clarity using this arrow-step diagram. Ideal for visualizing processes, workflows, or goal-driven action plans. The curved sequence highlights five progressive steps with icons and color coding. Fully customizable in PowerPoint, Keynote, or Google Slides—perfect for business strategy meetings, project planning, or milestone tracking.


23 slides
Cloudrift UX Case Study Presentation
Present a comprehensive and visually engaging UX Case Study with this dynamic and modern template. Begin with an introduction to the design challenge, followed by detailed slides for project overviews, user research, and persona development. Highlight the user journey mapping, information architecture, and wireframing process to showcase your structured approach to solving design problems. This template offers dedicated sections for prototyping, user testing, and feedback iterations, ensuring every stage of your process is documented. Dive into critical components like interaction design, responsive design, and accessibility considerations, demonstrating your commitment to delivering user-centric solutions. Conclude with a project showcase that highlights the final product and its impact. Fully customizable and compatible with PowerPoint, Google Slides, and Keynote, this template is perfect for presenting your UX design insights with clarity and professionalism.