
Features
- 8 Unique slides
- Fully editable and easy to edit in Microsoft Powerpoint, Keynote and Google Slides
- 16:9 widescreen layout
- Clean and professional designs
- Export to JPG, PDF or send by email


Do you have any questions?
Recommend


21 slides
Cineris Product Roadmap Presentation
Present your product vision and strategy with this professional and modern product roadmap presentation template. Covering key aspects such as product overview, features, competitive analysis, pricing strategy, and production process, this template helps you communicate your plan effectively. Designed for easy customization, it’s perfect for internal team alignment, stakeholder presentations, and strategic planning. Compatible with PowerPoint, Keynote, and Google Slides.


4 slides
Health and Safety Measures Presentation
Bring awareness and clarity to your audience with this bold, safety-inspired presentation layout. Designed to help communicate workplace protocols, risk prevention, and emergency measures effectively, it uses clean visuals and strong icons to capture attention. Fully editable and compatible with PowerPoint, Keynote, and Google Slides for seamless customization.


29 slides
Shadowglow Brand Guidelines Proposal Presentation
Present a cohesive brand vision with this professional template, designed for crafting detailed and visually compelling brand guidelines. Highlight essential components like brand vision and mission, brand values, and identity elements, including color palettes, typography, and imagery. This template seamlessly incorporates customer personas, tone and voice guidelines, and brand touchpoints to define the essence of your brand's communication. Utilize slides for website, social media, and packaging strategies to establish consistency across all platforms. Customizable and compatible with PowerPoint, Google Slides, and Keynote, this design ensures clarity and professionalism, making it ideal for agencies or teams presenting comprehensive brand proposals.


5 slides
Project Task Management Presentation
Stay on top of your workflow with this visually organized project task management slide. It features a clear table layout with editable fields for subject, priority level, due date, task status, progress percentage, and last modified date. Ideal for teams managing multiple tasks and deadlines. Use color-coded status bars and icons to communicate task progress at a glance. Perfect for project managers and team leaders. Compatible with PowerPoint, Keynote, and Google Slides.


5 slides
Lean Startup Business Presentation
A fresh, energetic layout brings your ideas to life, making it easy to present streamlined processes and early-stage strategies with clarity. This presentation highlights key steps, insights, and goals in a clean, modern flow designed for fast-moving teams. Fully compatible with PowerPoint, Keynote, and Google Slides.


5 slides
Topic Expansion Using Spider Mapping Presentation
Expand and organize your ideas visually with the Topic Expansion Using Spider Mapping Presentation. Designed to simplify complex information, this layout helps you break down main themes into connected subpoints. Ideal for brainstorming, concept mapping, and strategy sessions. Fully editable in Canva, PowerPoint, Keynote, and Google Slides.


8 slides
Corporate Office Scenes Illustrations Presentation
Bring workplace communication to life with this slide featuring an illustrated office meeting scene and a four-point list layout. Each segment is color-coded with accompanying icons, making it ideal for presenting corporate strategies, team roles, or process workflows. Designed for clarity and visual appeal, this slide is perfect for business reports, training decks, or client briefings. Easily customizable in PowerPoint, Keynote, and Google Slides.


4 slides
Strategic Business Objectives Framework
Showcase your company's top strategic goals with this clean and professional slide. Each briefcase icon represents a key business objective, perfect for planning, reporting, or investor updates. Fully customizable in PowerPoint, Keynote, and Google Slides.


5 slides
Business Investment in Africa Map Presentation
Explore promising markets with the "Business Investment in Africa Map" template, designed to provide a visual overview of investment opportunities across the continent. It features a map with marked regions, each linked to specific data points about business prospects. Ideal for investors or companies looking at market penetration or expansion within Africa, this layout helps in making data-driven decisions by providing a clear, concise visual representation of key information.


5 slides
Clear Strategy in Five Stages Presentation
Outline your strategic roadmap with this five-step cube staircase layout. Perfect for planning, growth tracking, or project milestones, each stage is color-coded with icons and numbered steps for clarity. Easy to edit in PowerPoint, Keynote, and Google Slides—ideal for business planning, strategy sessions, or performance reviews.


5 slides
Medical Anatomy Chart Slide Presentation
Present body systems or organ-related topics with this anatomy chart slide. Designed with pinpoint callouts linked to a human silhouette, it helps explain up to four body parts or functions. Ideal for health, biology, or patient education presentations. Fully editable in PowerPoint, Keynote, or Google Slides for clean, visual storytelling.


4 slides
Breast Cancer Awareness Campaign Presentation
Raise awareness with impact using the Breast Cancer Awareness Campaign Presentation. This visually engaging design uses symbolic visuals to highlight key messages, educate audiences, and inspire action. Perfect for nonprofit initiatives, educational sessions, or health campaigns. Fully editable in PowerPoint, Google Slides, Keynote, and Canva for easy customization.


5 slides
Visual Gap Analysis Between Goals and Results Presentation
Hit the bullseye by clearly showing the gap between what was planned and what was achieved. This sleek, target-based presentation design helps visualize discrepancies between goals and results in a way that's easy to grasp and great for decision-making. Fully compatible with PowerPoint, Keynote, and Google Slides.


7 slides
Feedback Infographics Presentation Template
The goal of feedback is to recognize strengths and improve weaknesses. Feedback, both positive and negative, helps us see what we can improve on in order to better our results. This template is perfect for understanding how essential feedback is, and learning how to deliver feedback in a productive way. It provides positive criticism, showing what you can improve to achieve better results and success. Feedback provides the opportunity to learn, and is the most effective way to improve your skills. This template makes it simple to create an informed and well-rounded presentation to share.


5 slides
Financial Credit Card Management Presentation
Present credit card processes, workflows, or customer engagement steps with this clean, step-by-step infographic layout. Featuring five clearly defined stages, icons, and space for key insights, it’s perfect for visualizing application journeys, fraud prevention, or usage optimization. Great for banks, fintech presentations, or financial coaching. Fully editable in PowerPoint, Keynote, and Google Slides.


20 slides
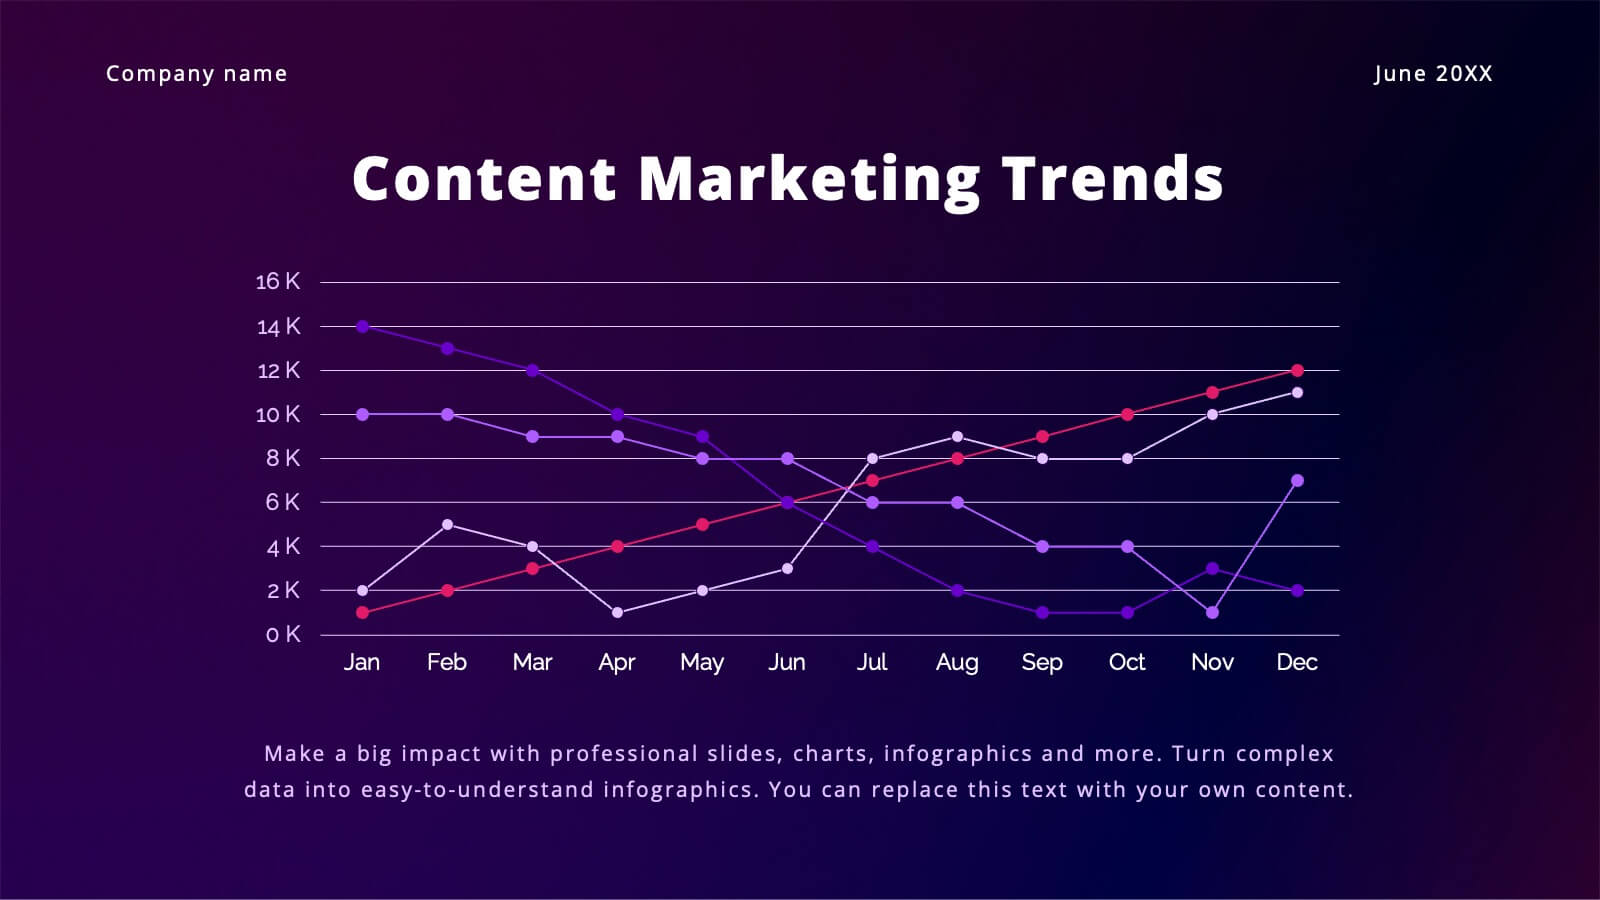
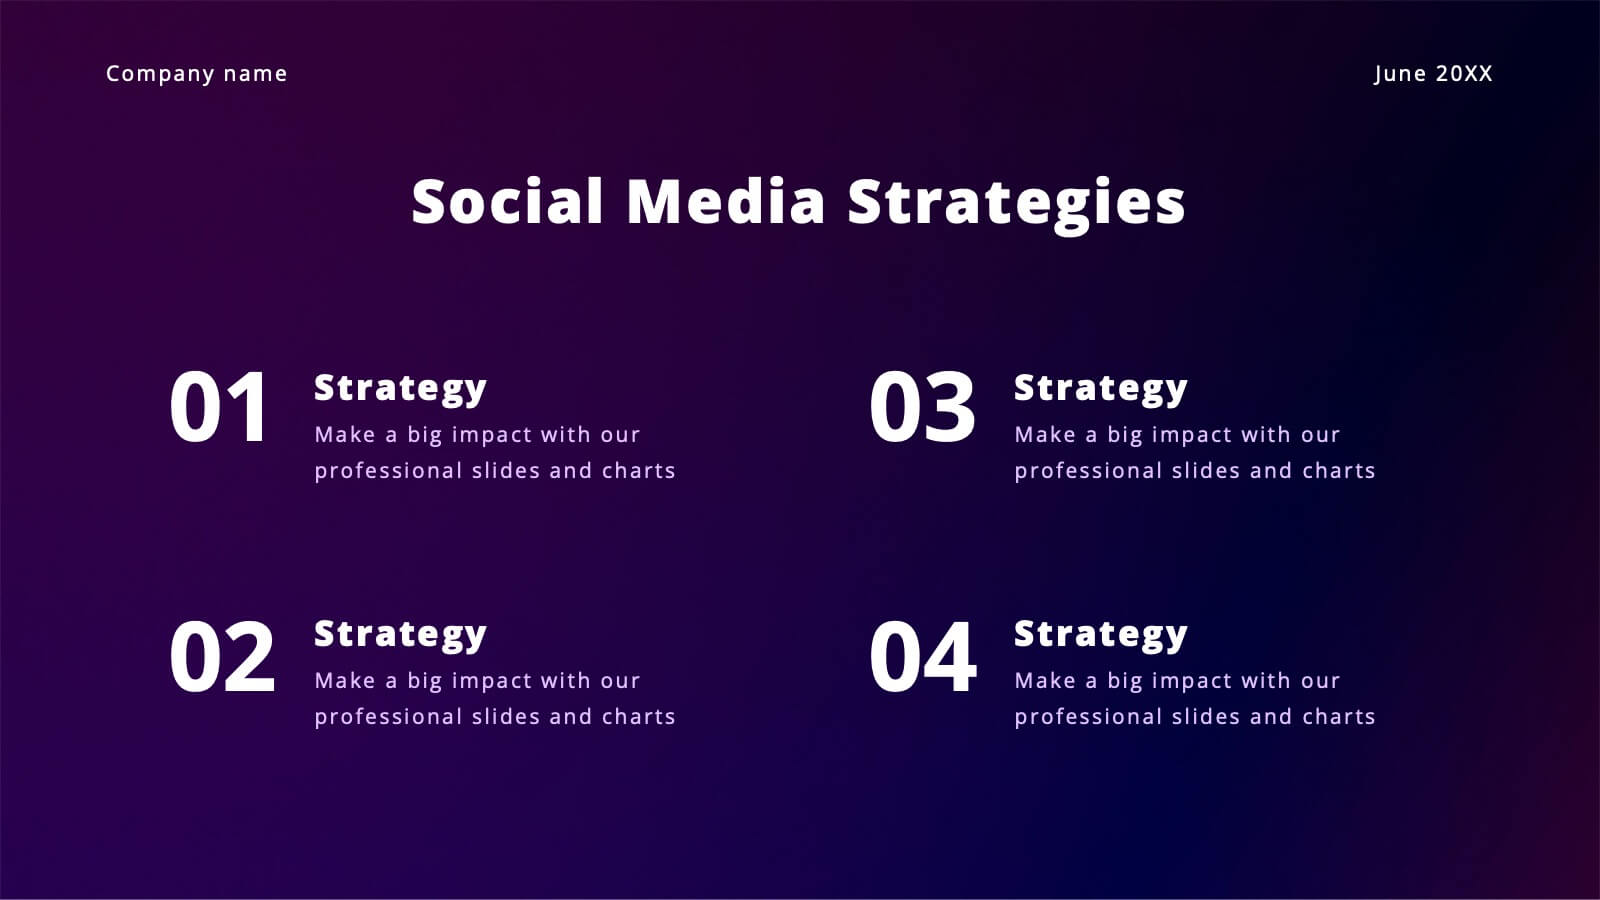
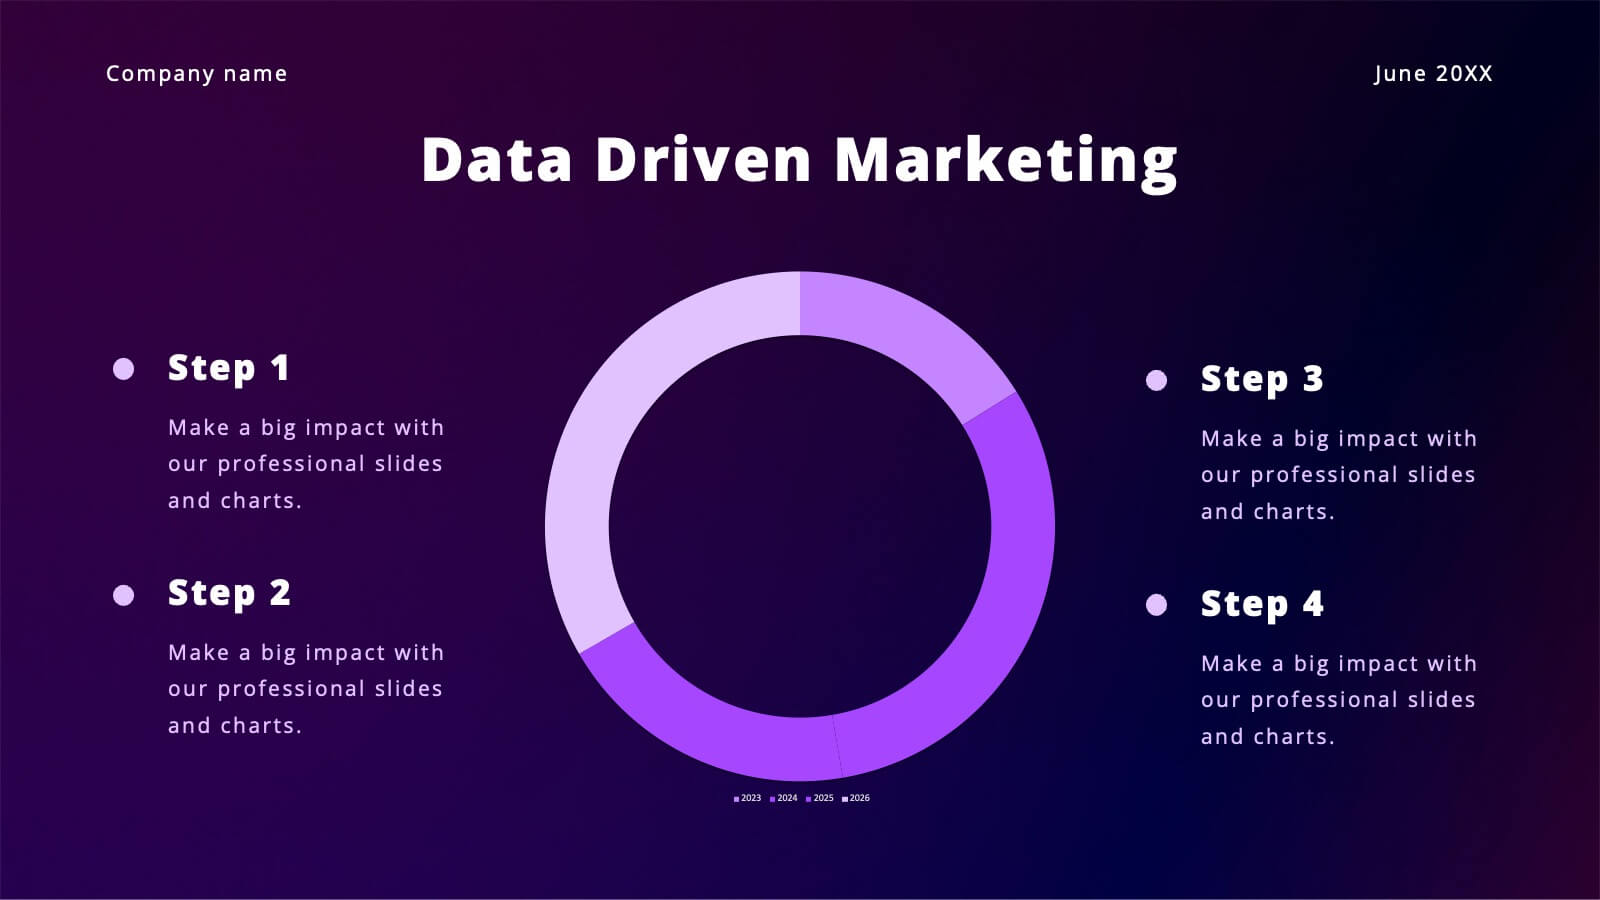
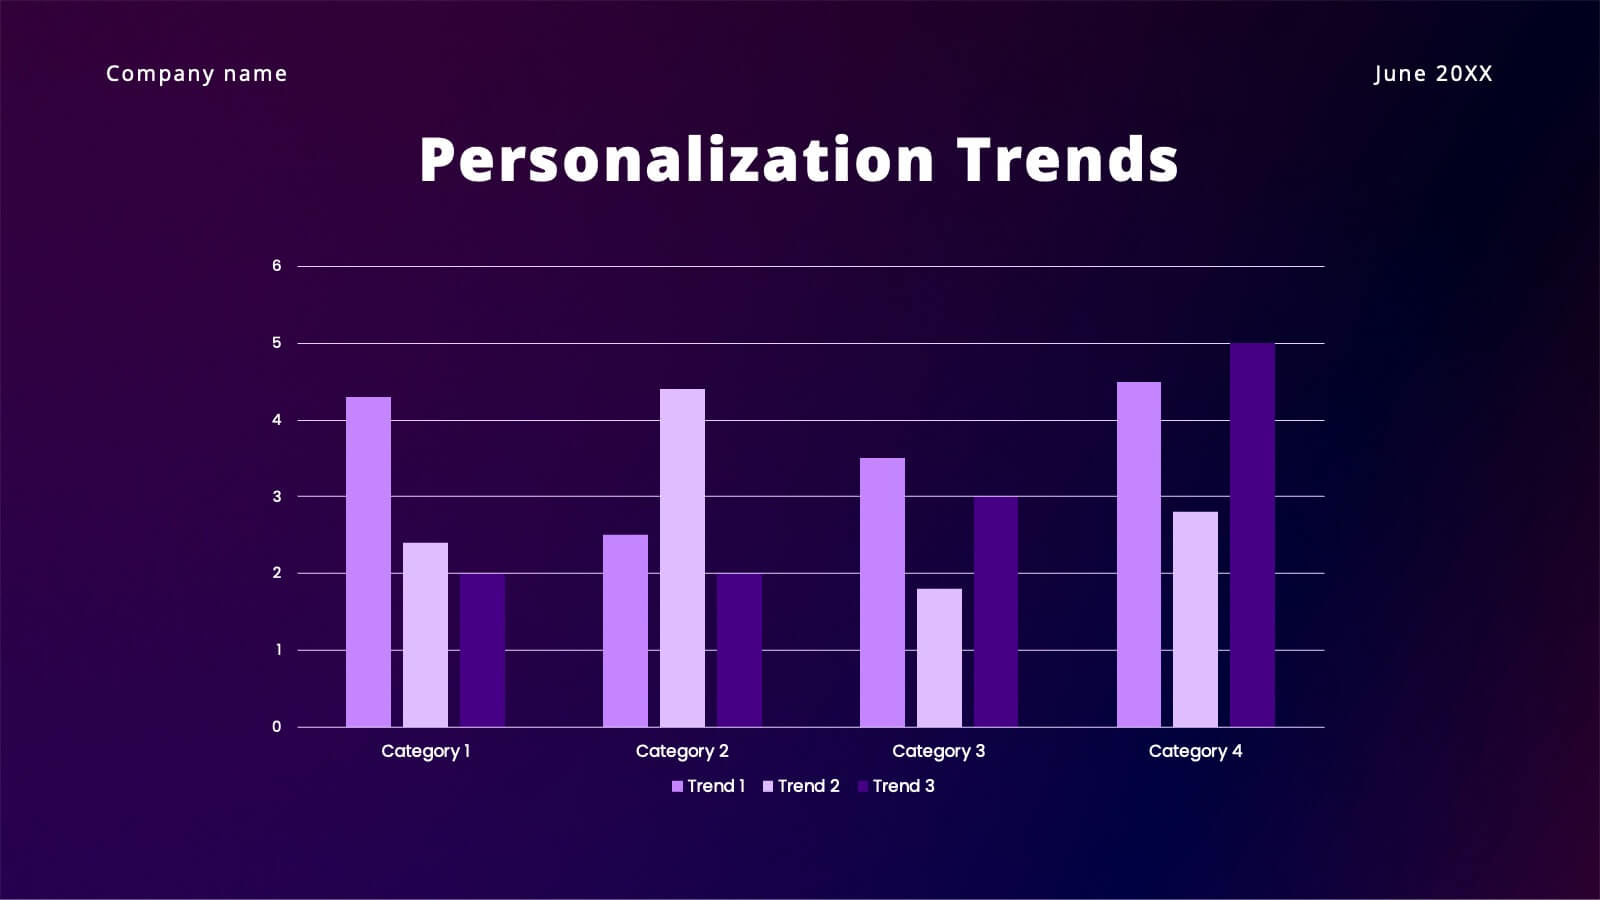
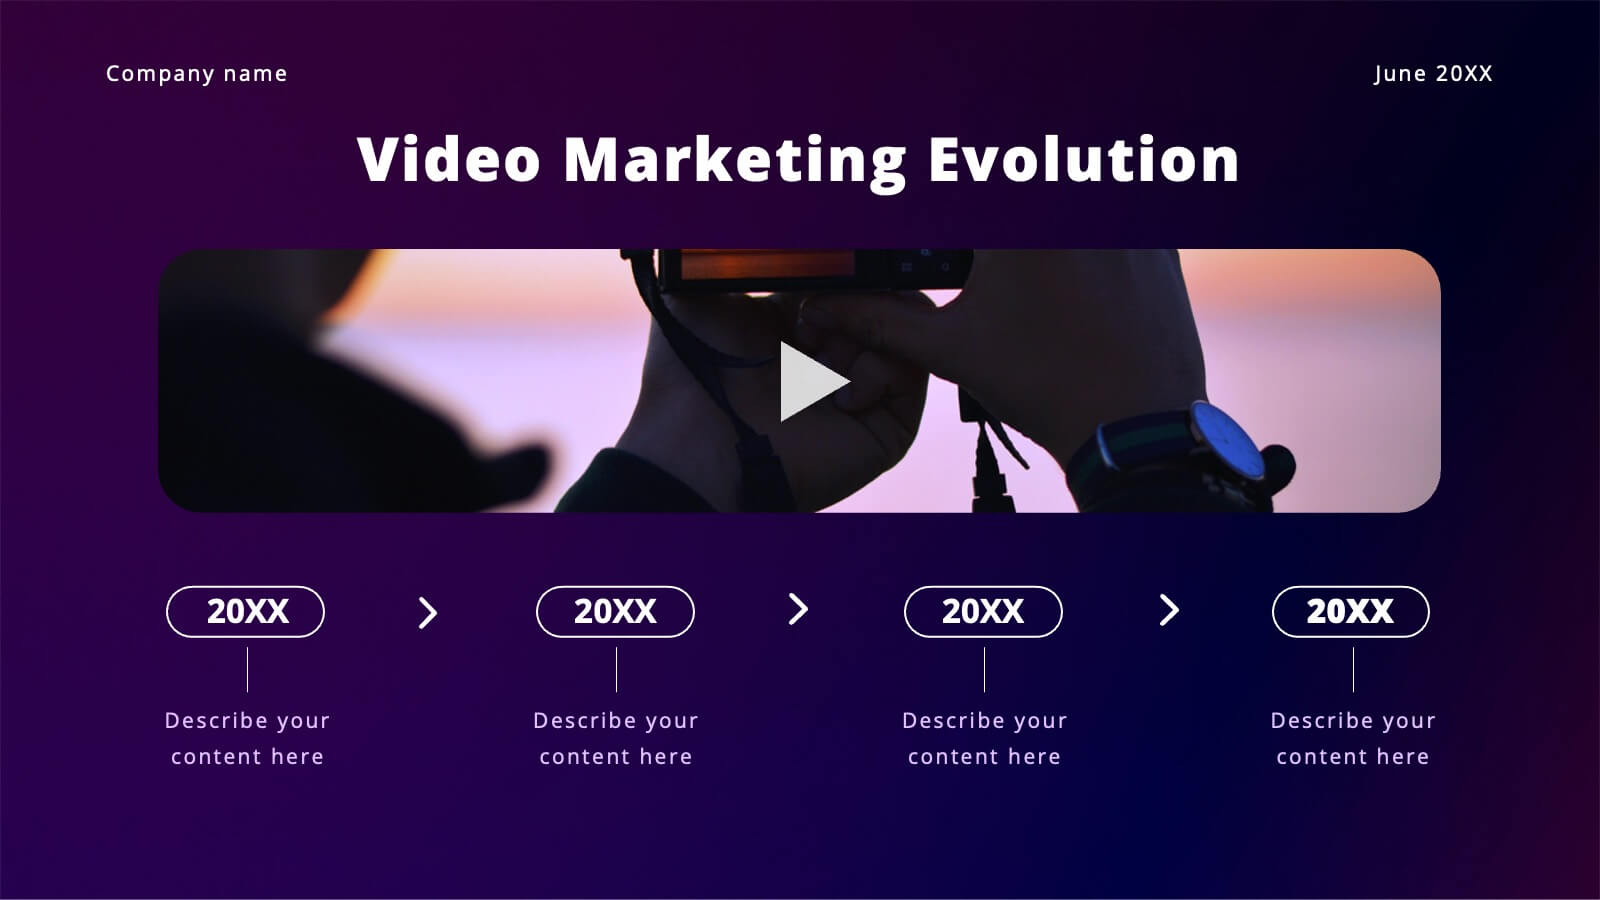
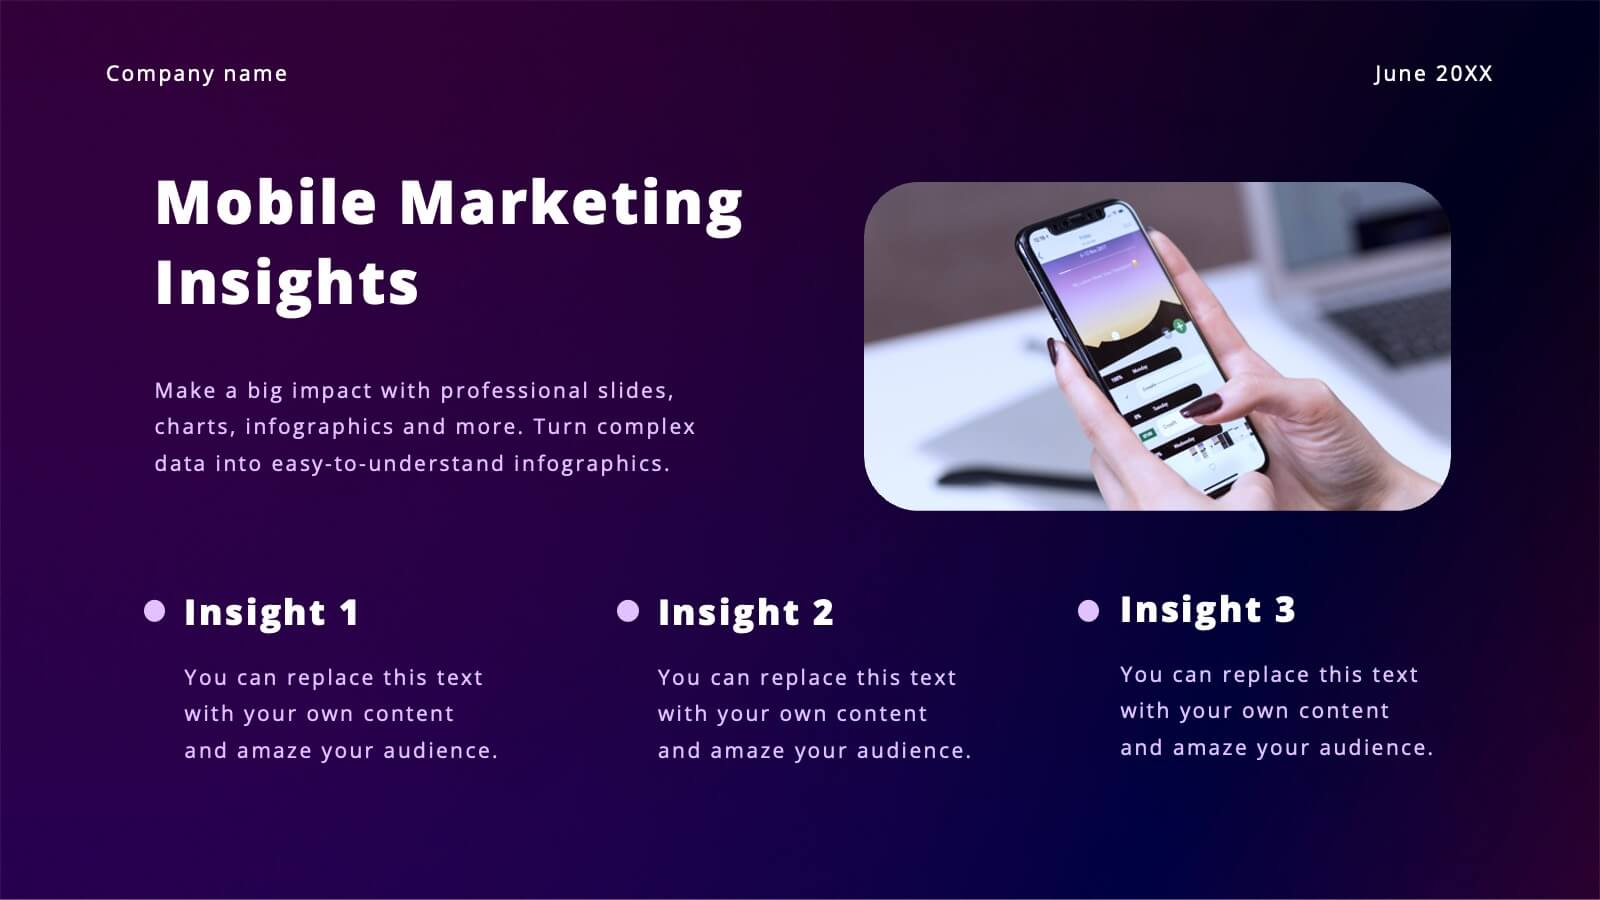
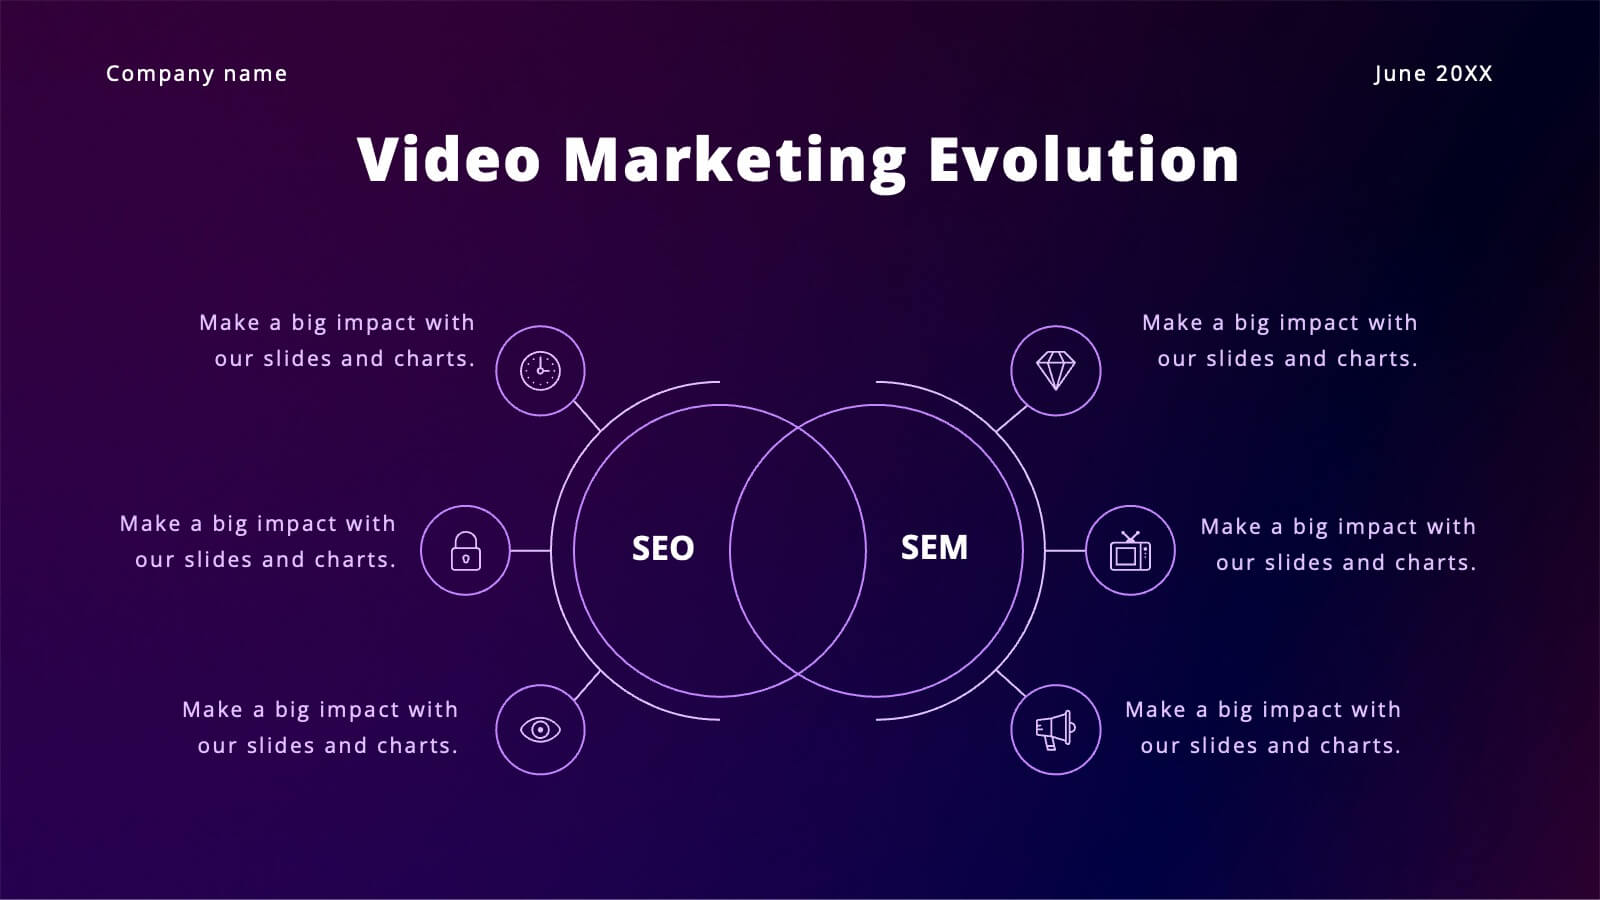
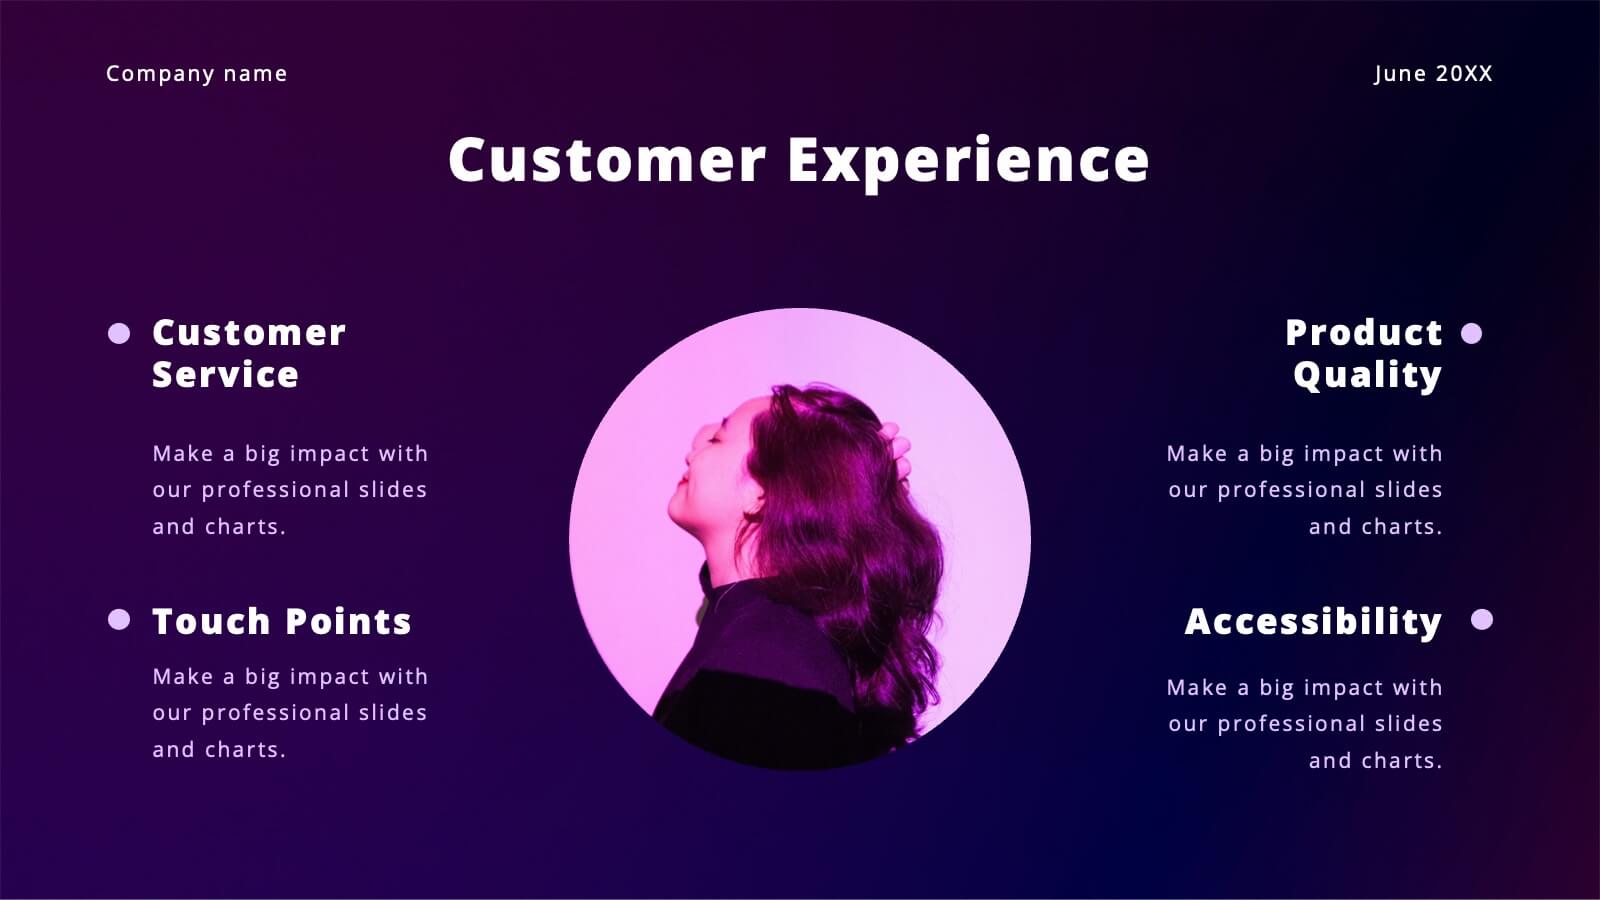
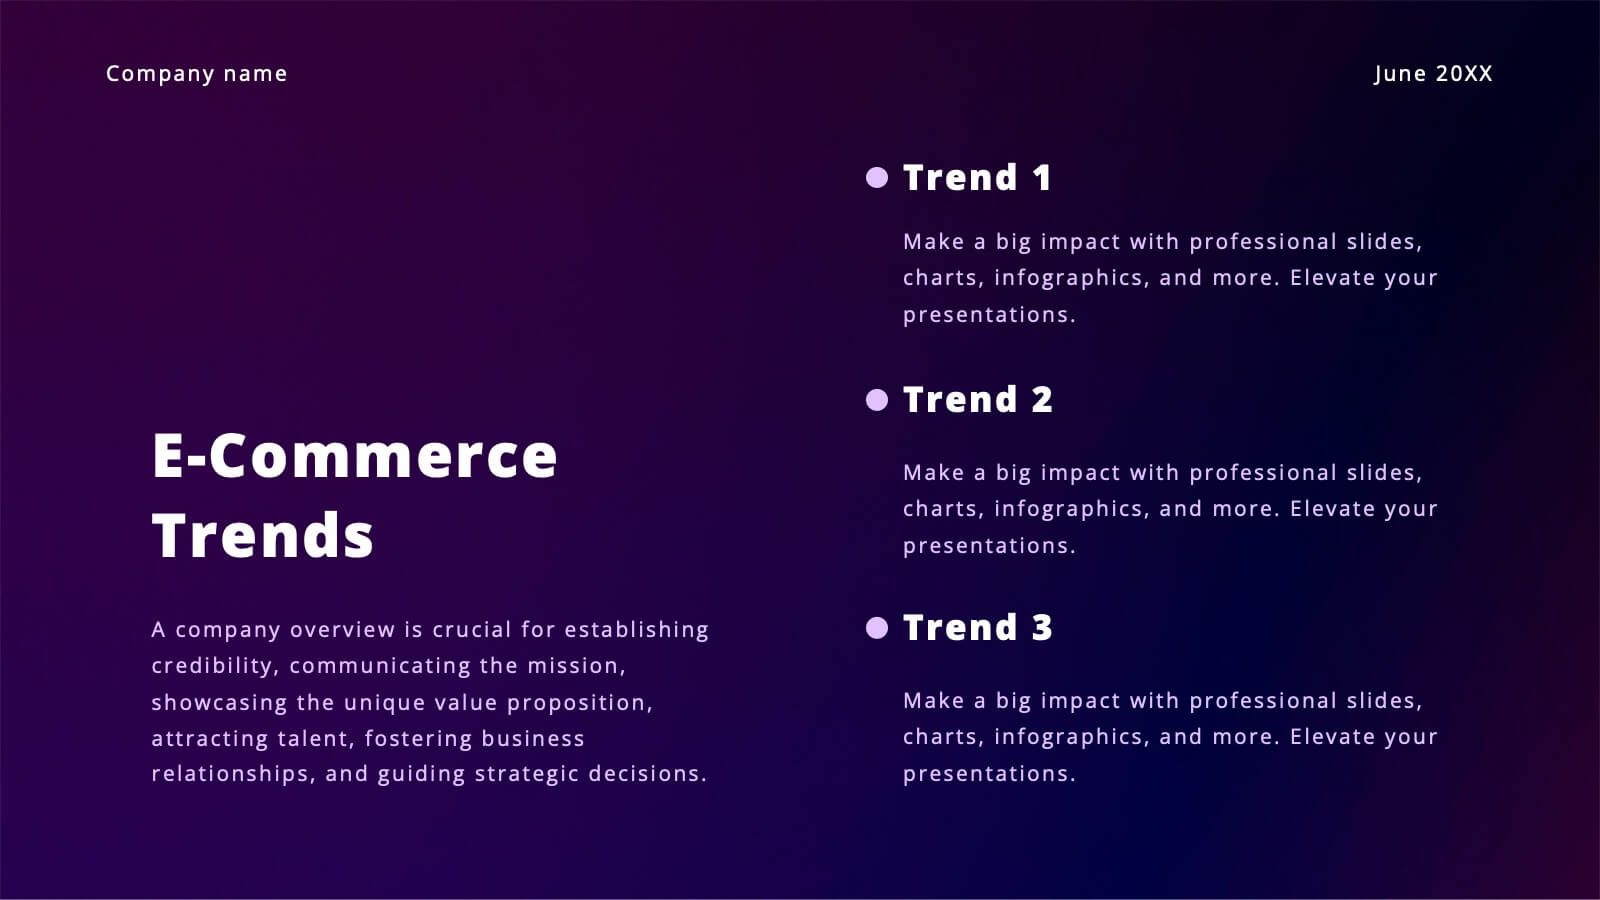
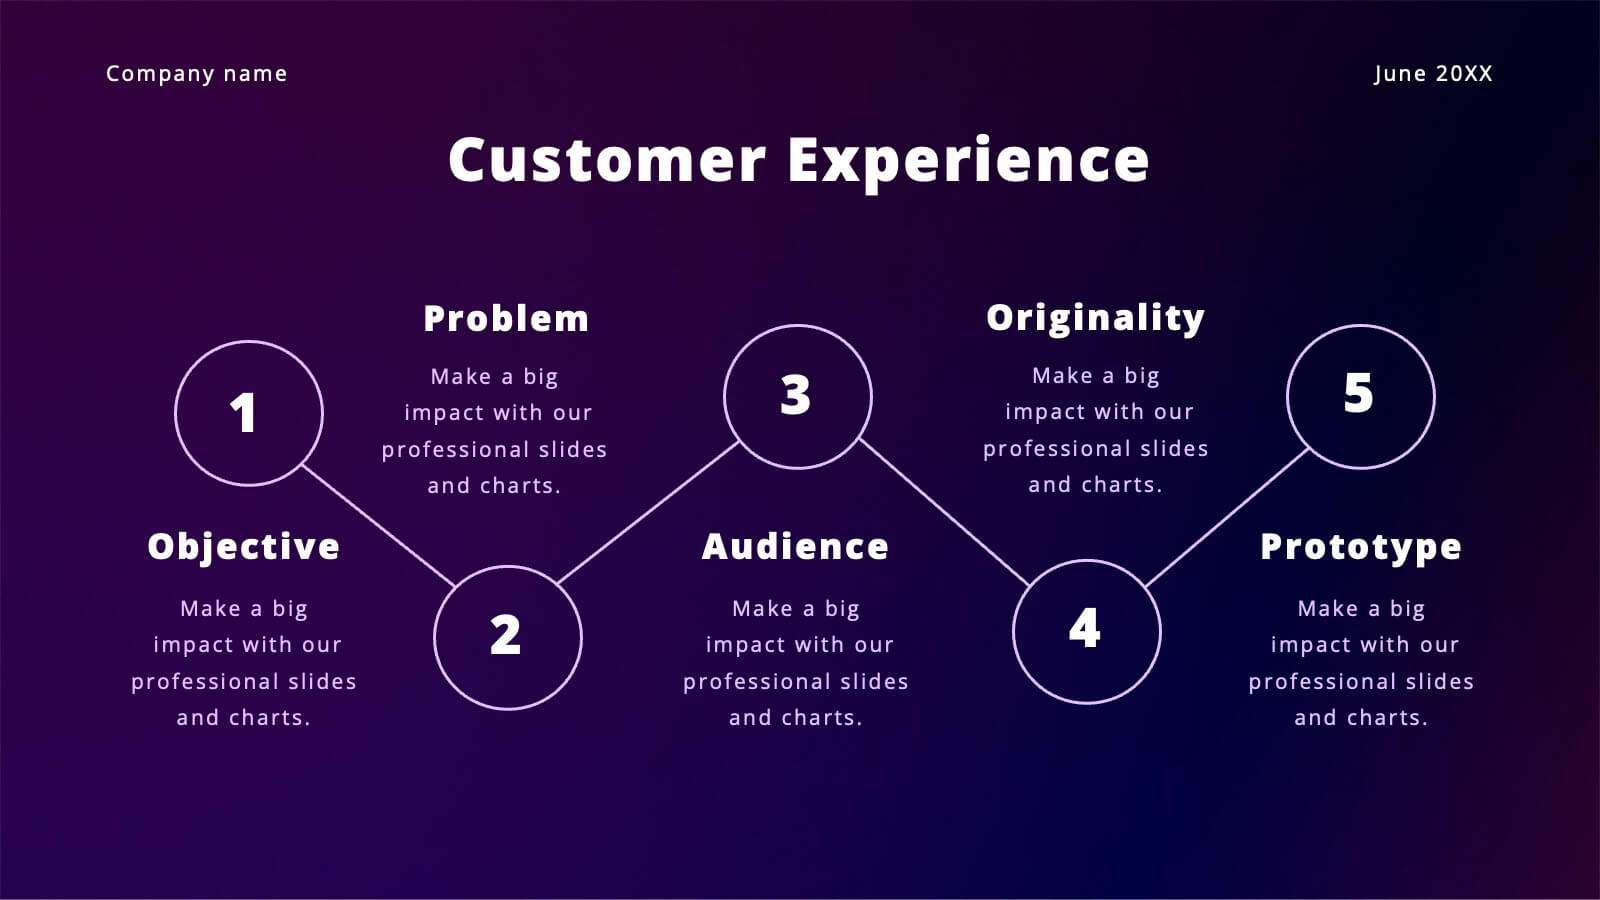
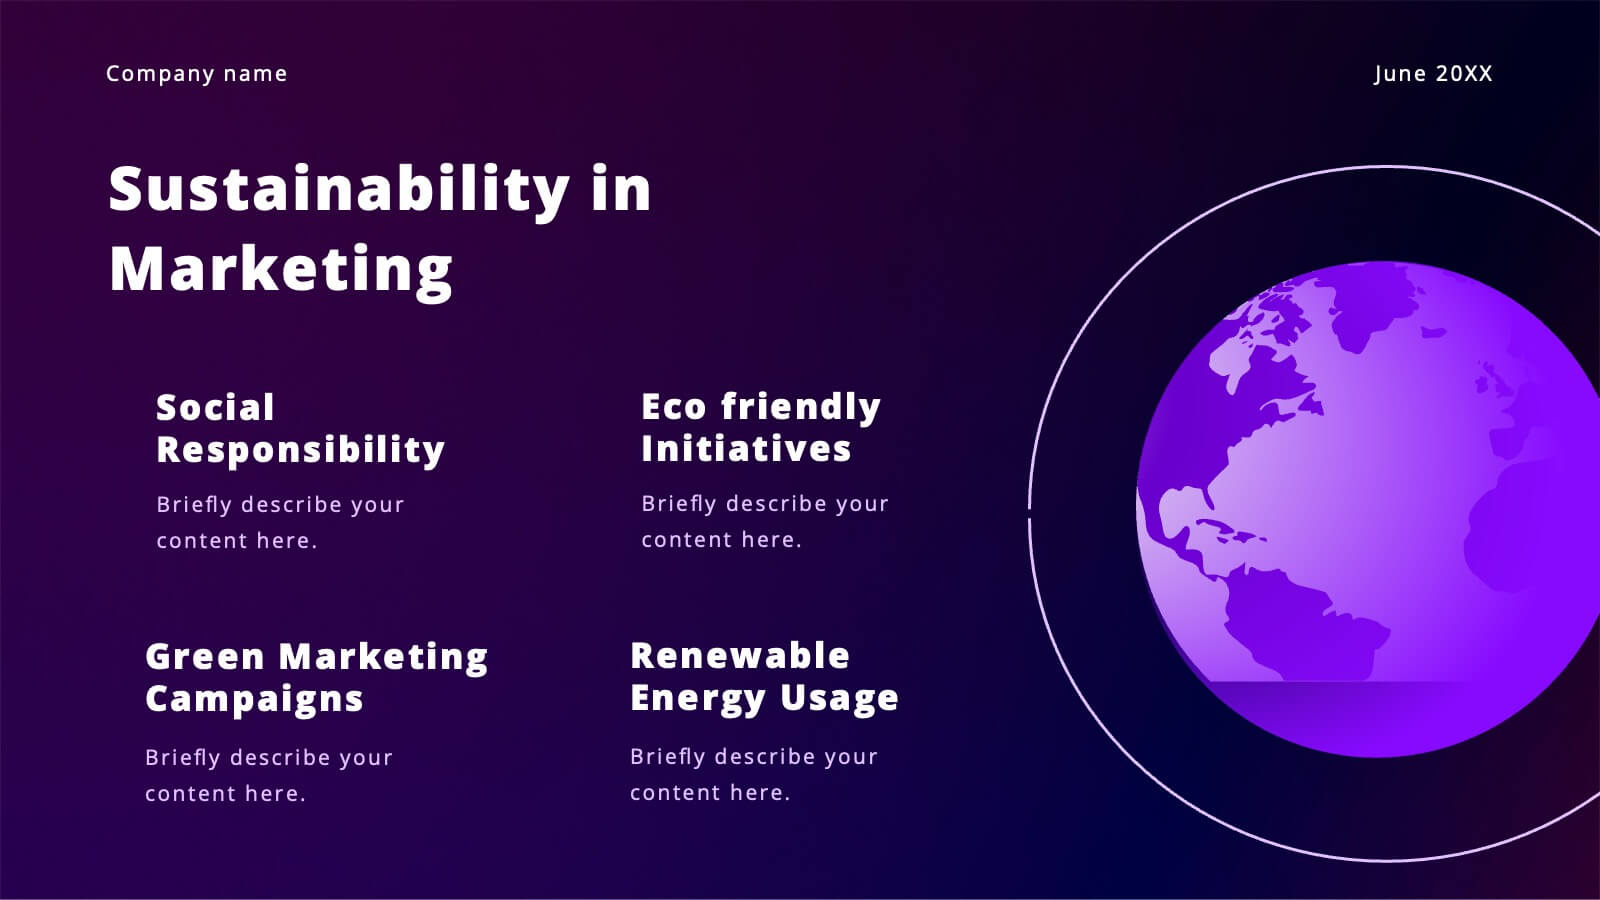
Vibrant Content Marketing Pitch Deck Presentation
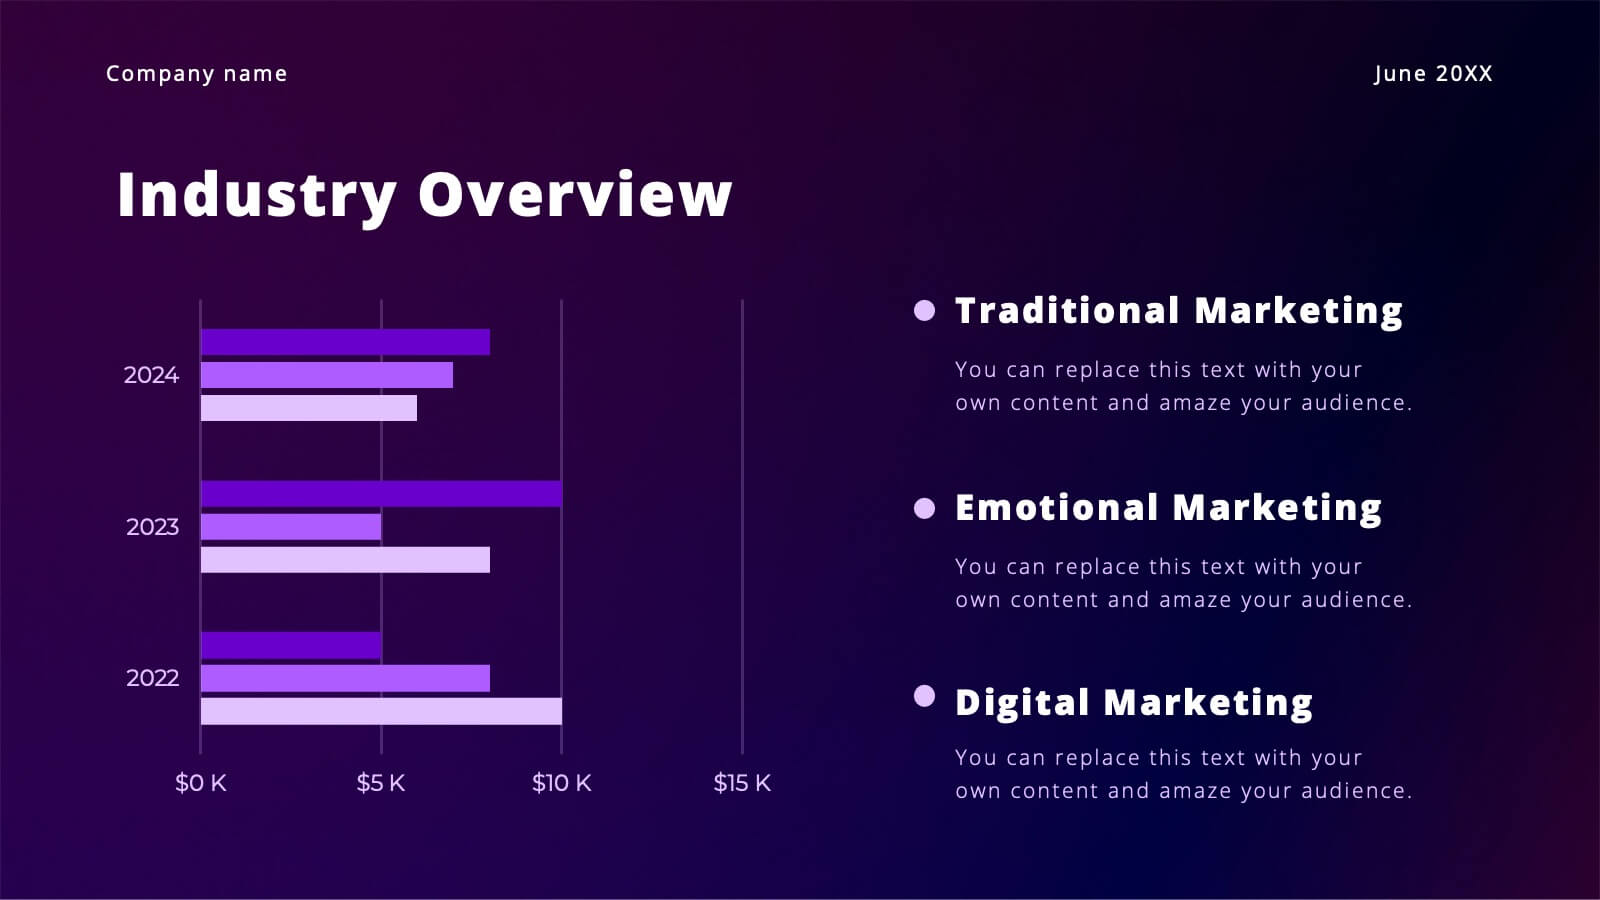
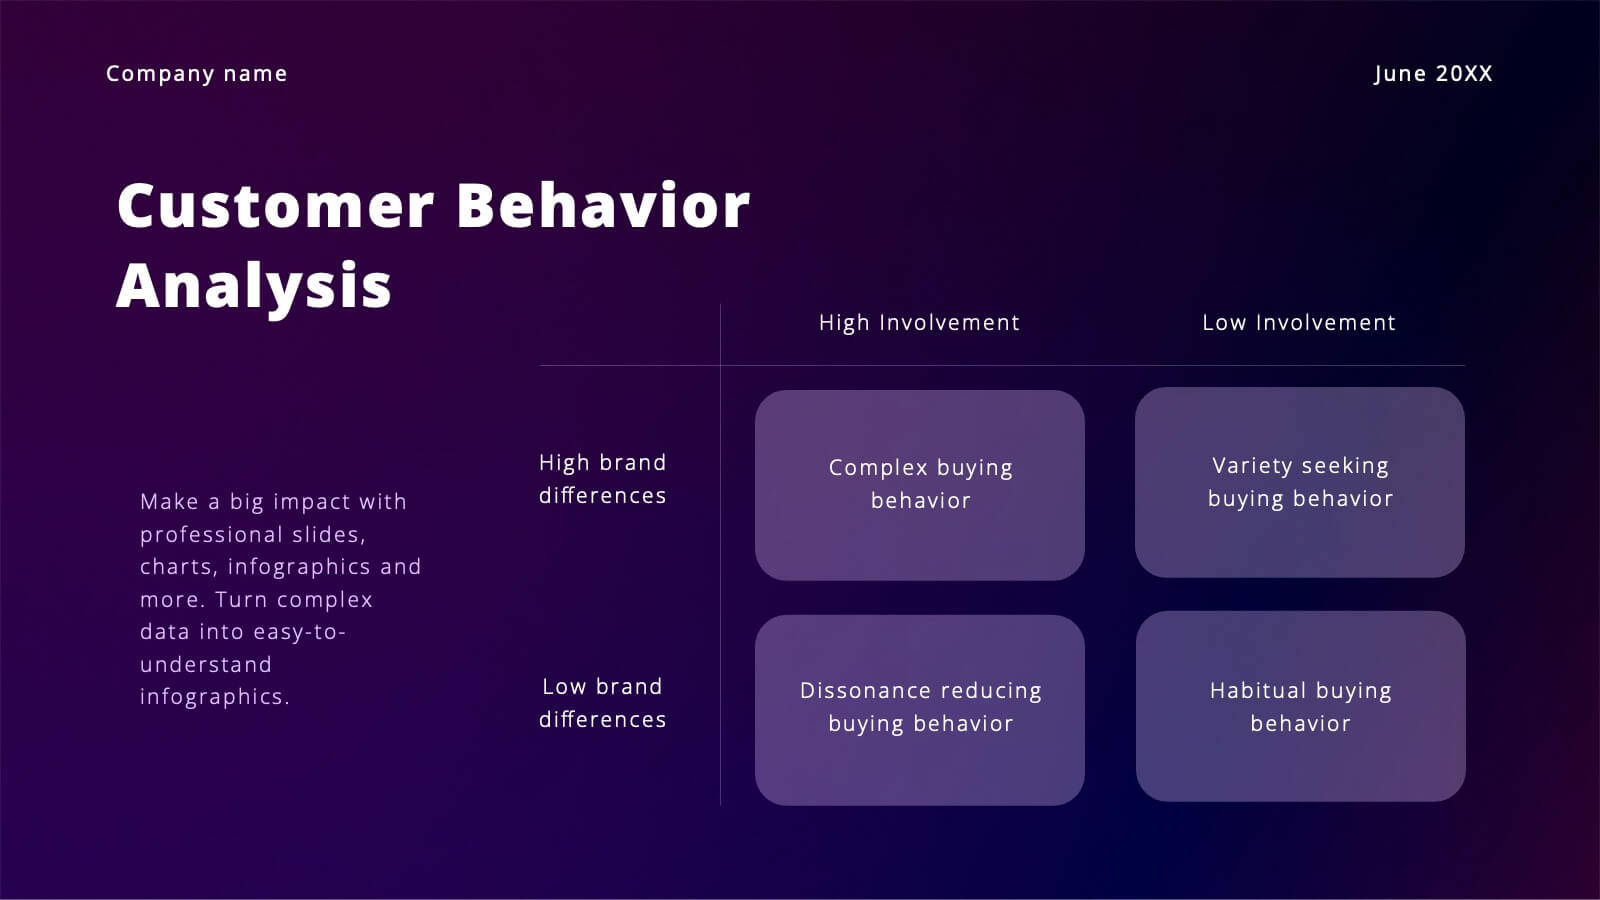
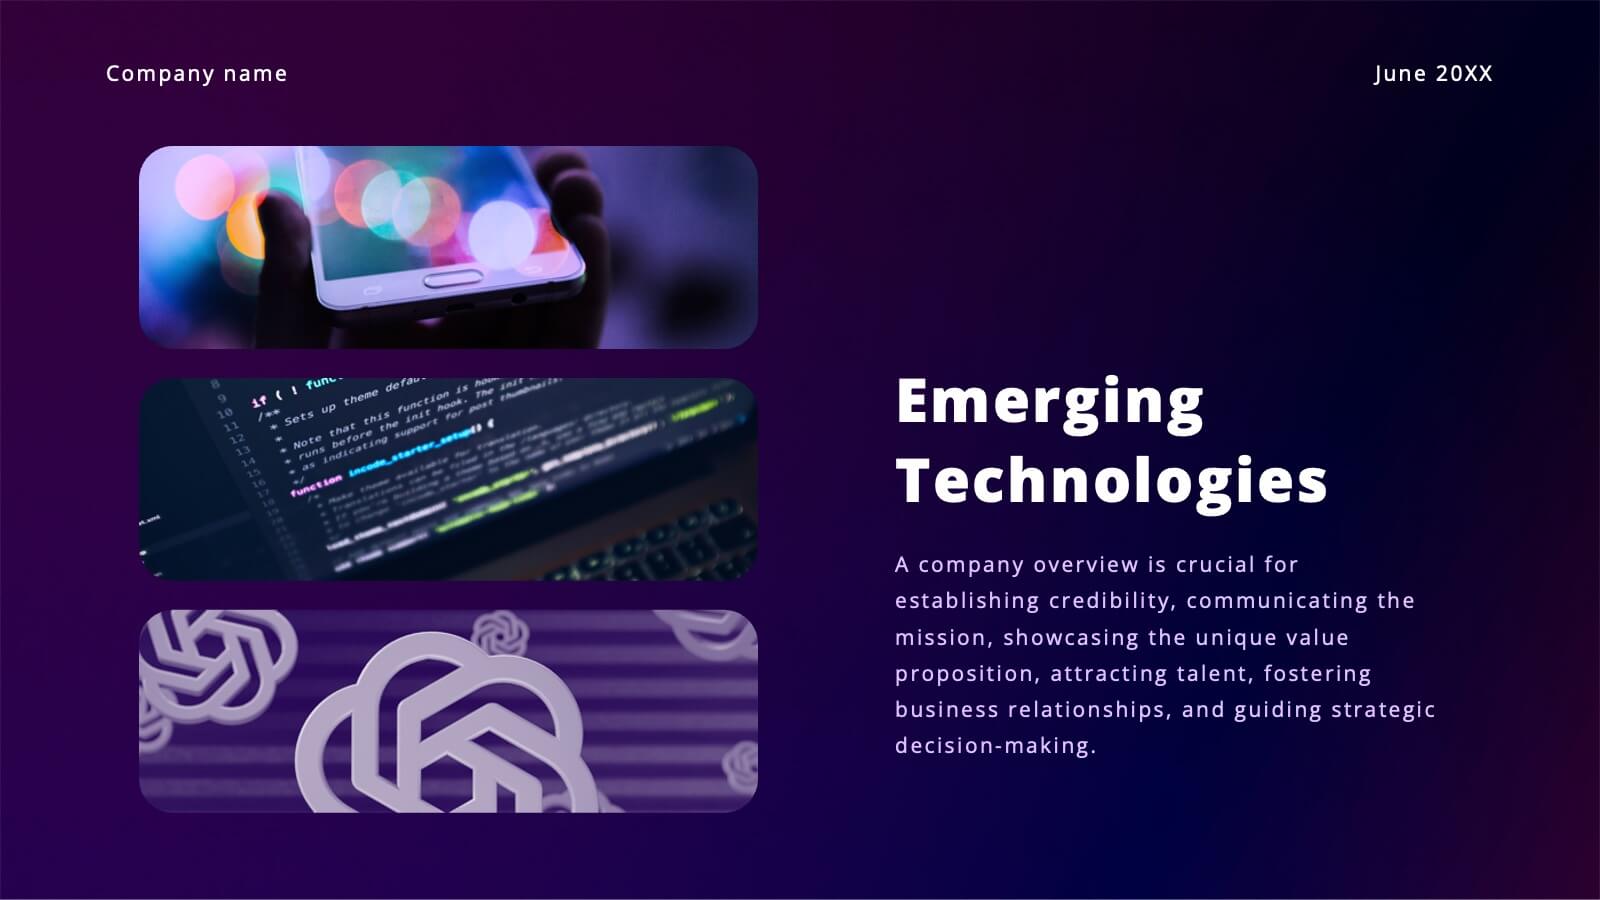
Boost your marketing pitch with this vibrant deck! Covering industry overviews, customer behavior analysis, and emerging technologies, it’s designed to captivate your audience. Highlight social media strategies, data-driven marketing, and e-commerce trends effortlessly. Perfect for presenting a comprehensive marketing plan. Compatible with PowerPoint, Keynote, and Google Slides. Make your next pitch stand out!


7 slides
Job Title Infographic
The slides displayed offer a range of stylish and clear title designs for various business and creative presentations, ideal for introducing key concepts and sections within a professional document or presentation. Each slide is crafted to represent themes such as annual reports, digital strategies, and project retrospectives, as well as specialized areas like web design, strategic planning, and SEO. The designs incorporate modern aesthetics with clean lines, bold color palettes, and minimalist graphic elements, ensuring that the titles are not only eye-catching but also effectively convey the subject matter. This variety allows presenters to choose a slide that best fits the tone and topic of their presentation, making each section distinct and engaging for the audience. These slides are perfect for professionals looking to present complex information in an accessible and visually appealing format.