


Features
- 5 Unique slides
- Fully editable and easy to edit in Microsoft Powerpoint, Keynote and Google Slides
- 16:9 widescreen layout
- Clean and professional designs
- Export to JPG, PDF or send by email


Do you have any questions?
Recommend


10 slides
Business Planning and Risk Assessment Presentation
Visualize risk levels and strategic priorities with this matrix-style business planning template. Ideal for mapping uncertainties against impact and likelihood, it supports clear, data-driven decisions. Fully customizable in PowerPoint, Keynote, and Google Slides—perfect for risk reports, operational planning, and stakeholder communication in corporate, finance, or project management settings.


6 slides
ABC Alphabet Infographic
An "Alphabet Infographic" is a visually engaging way to present the letters of the alphabet along with corresponding words or images that start with each letter. This type of infographic is often used in educational settings to teach young children the alphabet and basic vocabulary. Display the letters of the alphabet in a clear and appealing layout. You can arrange them in rows or columns, using a bold and easily readable font. Use colorful and child-friendly illustrations for the images associated with each letter. This will make the infographic more captivating and engaging for young learners.
8 slides
Business Growth and Progress Tracking Presentation
Visualize success with this upward-arrow roadmap template designed to highlight four key stages of business development. Ideal for managers, analysts, and entrepreneurs, this slide uses milestone icons and clean, directional layout to emphasize progress. Fully editable in PowerPoint, Keynote, and Google Slides for seamless customization.


4 slides
Left and Right Brain Diagram Presentation
Unlock the perfect blend of logic and creativity with a visual layout that highlights how analytical thinking and imaginative ideas work together. This presentation makes it easy to compare concepts, explain processes, and illustrate dual perspectives with clarity and color. Fully compatible with PowerPoint, Keynote, and Google Slides.


3 slides
Spider Diagram for Concept Mapping Presentation
Visualize complex data relationships with clarity using the Spider Diagram for Concept Mapping Presentation. This template is perfect for comparing multiple variables across categories, making it ideal for performance reviews, strategic analysis, and brainstorming sessions. Fully editable and compatible with PowerPoint, Keynote, and Google Slides.


21 slides
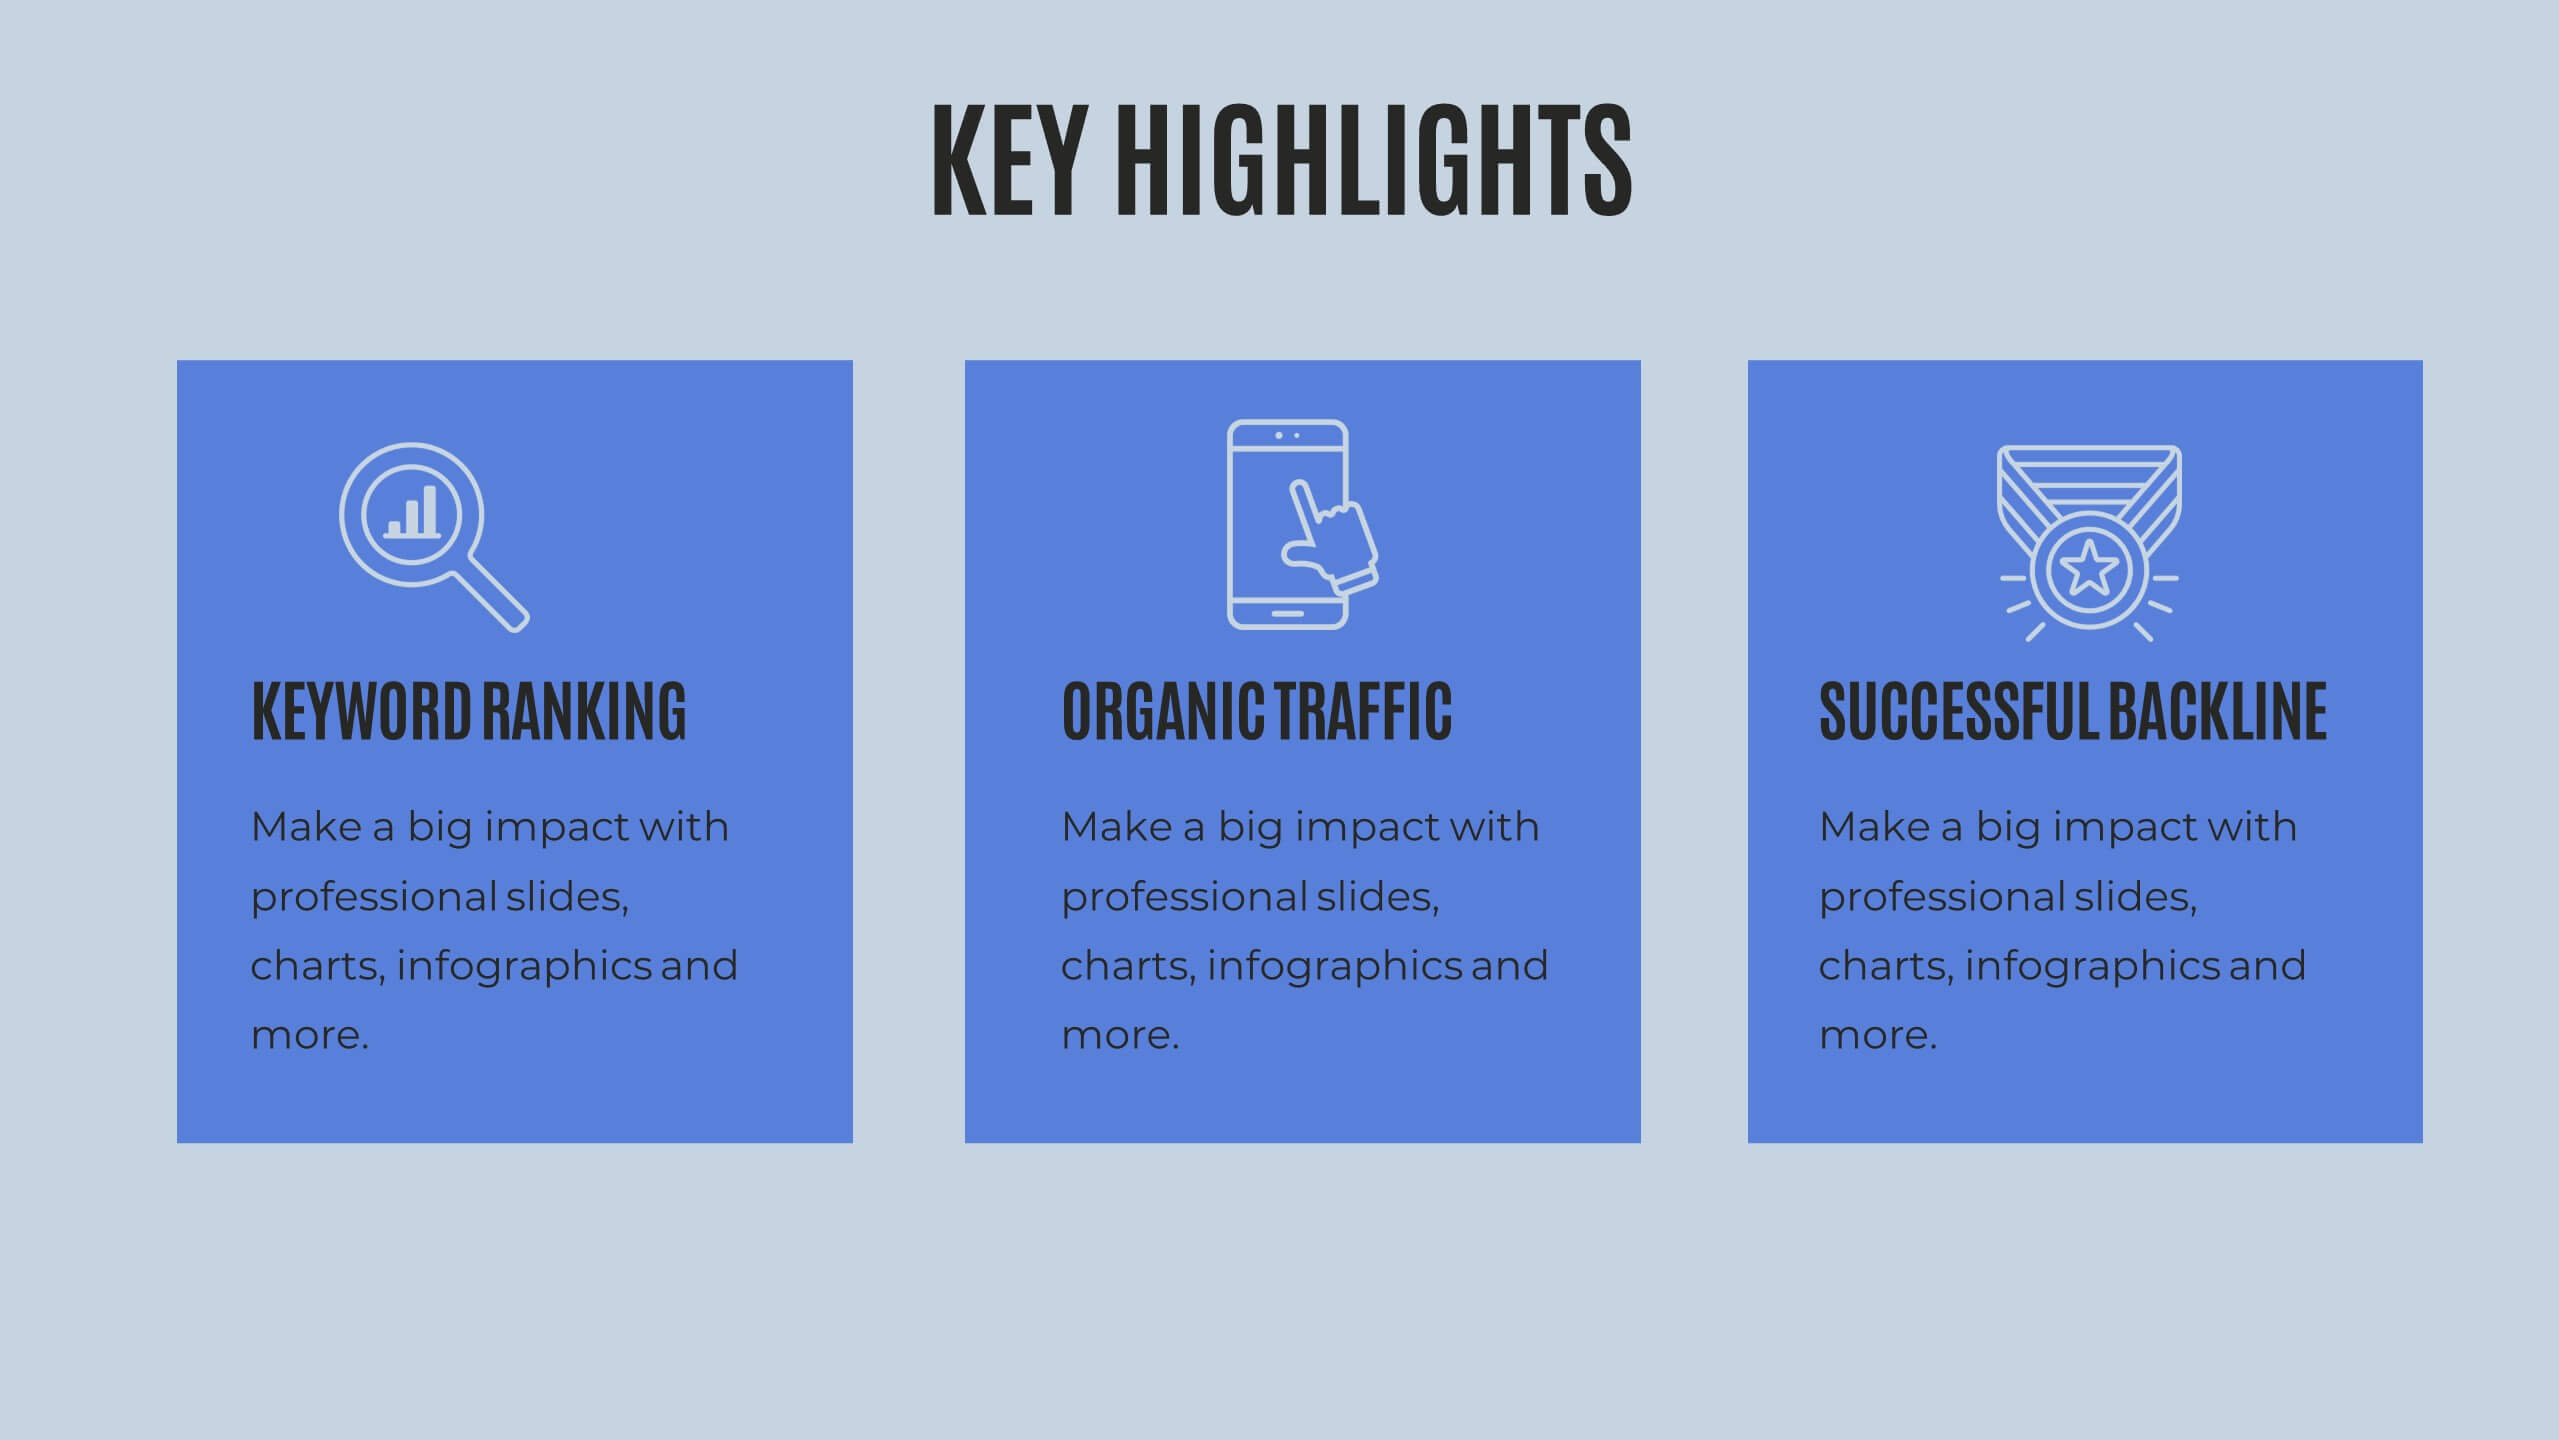
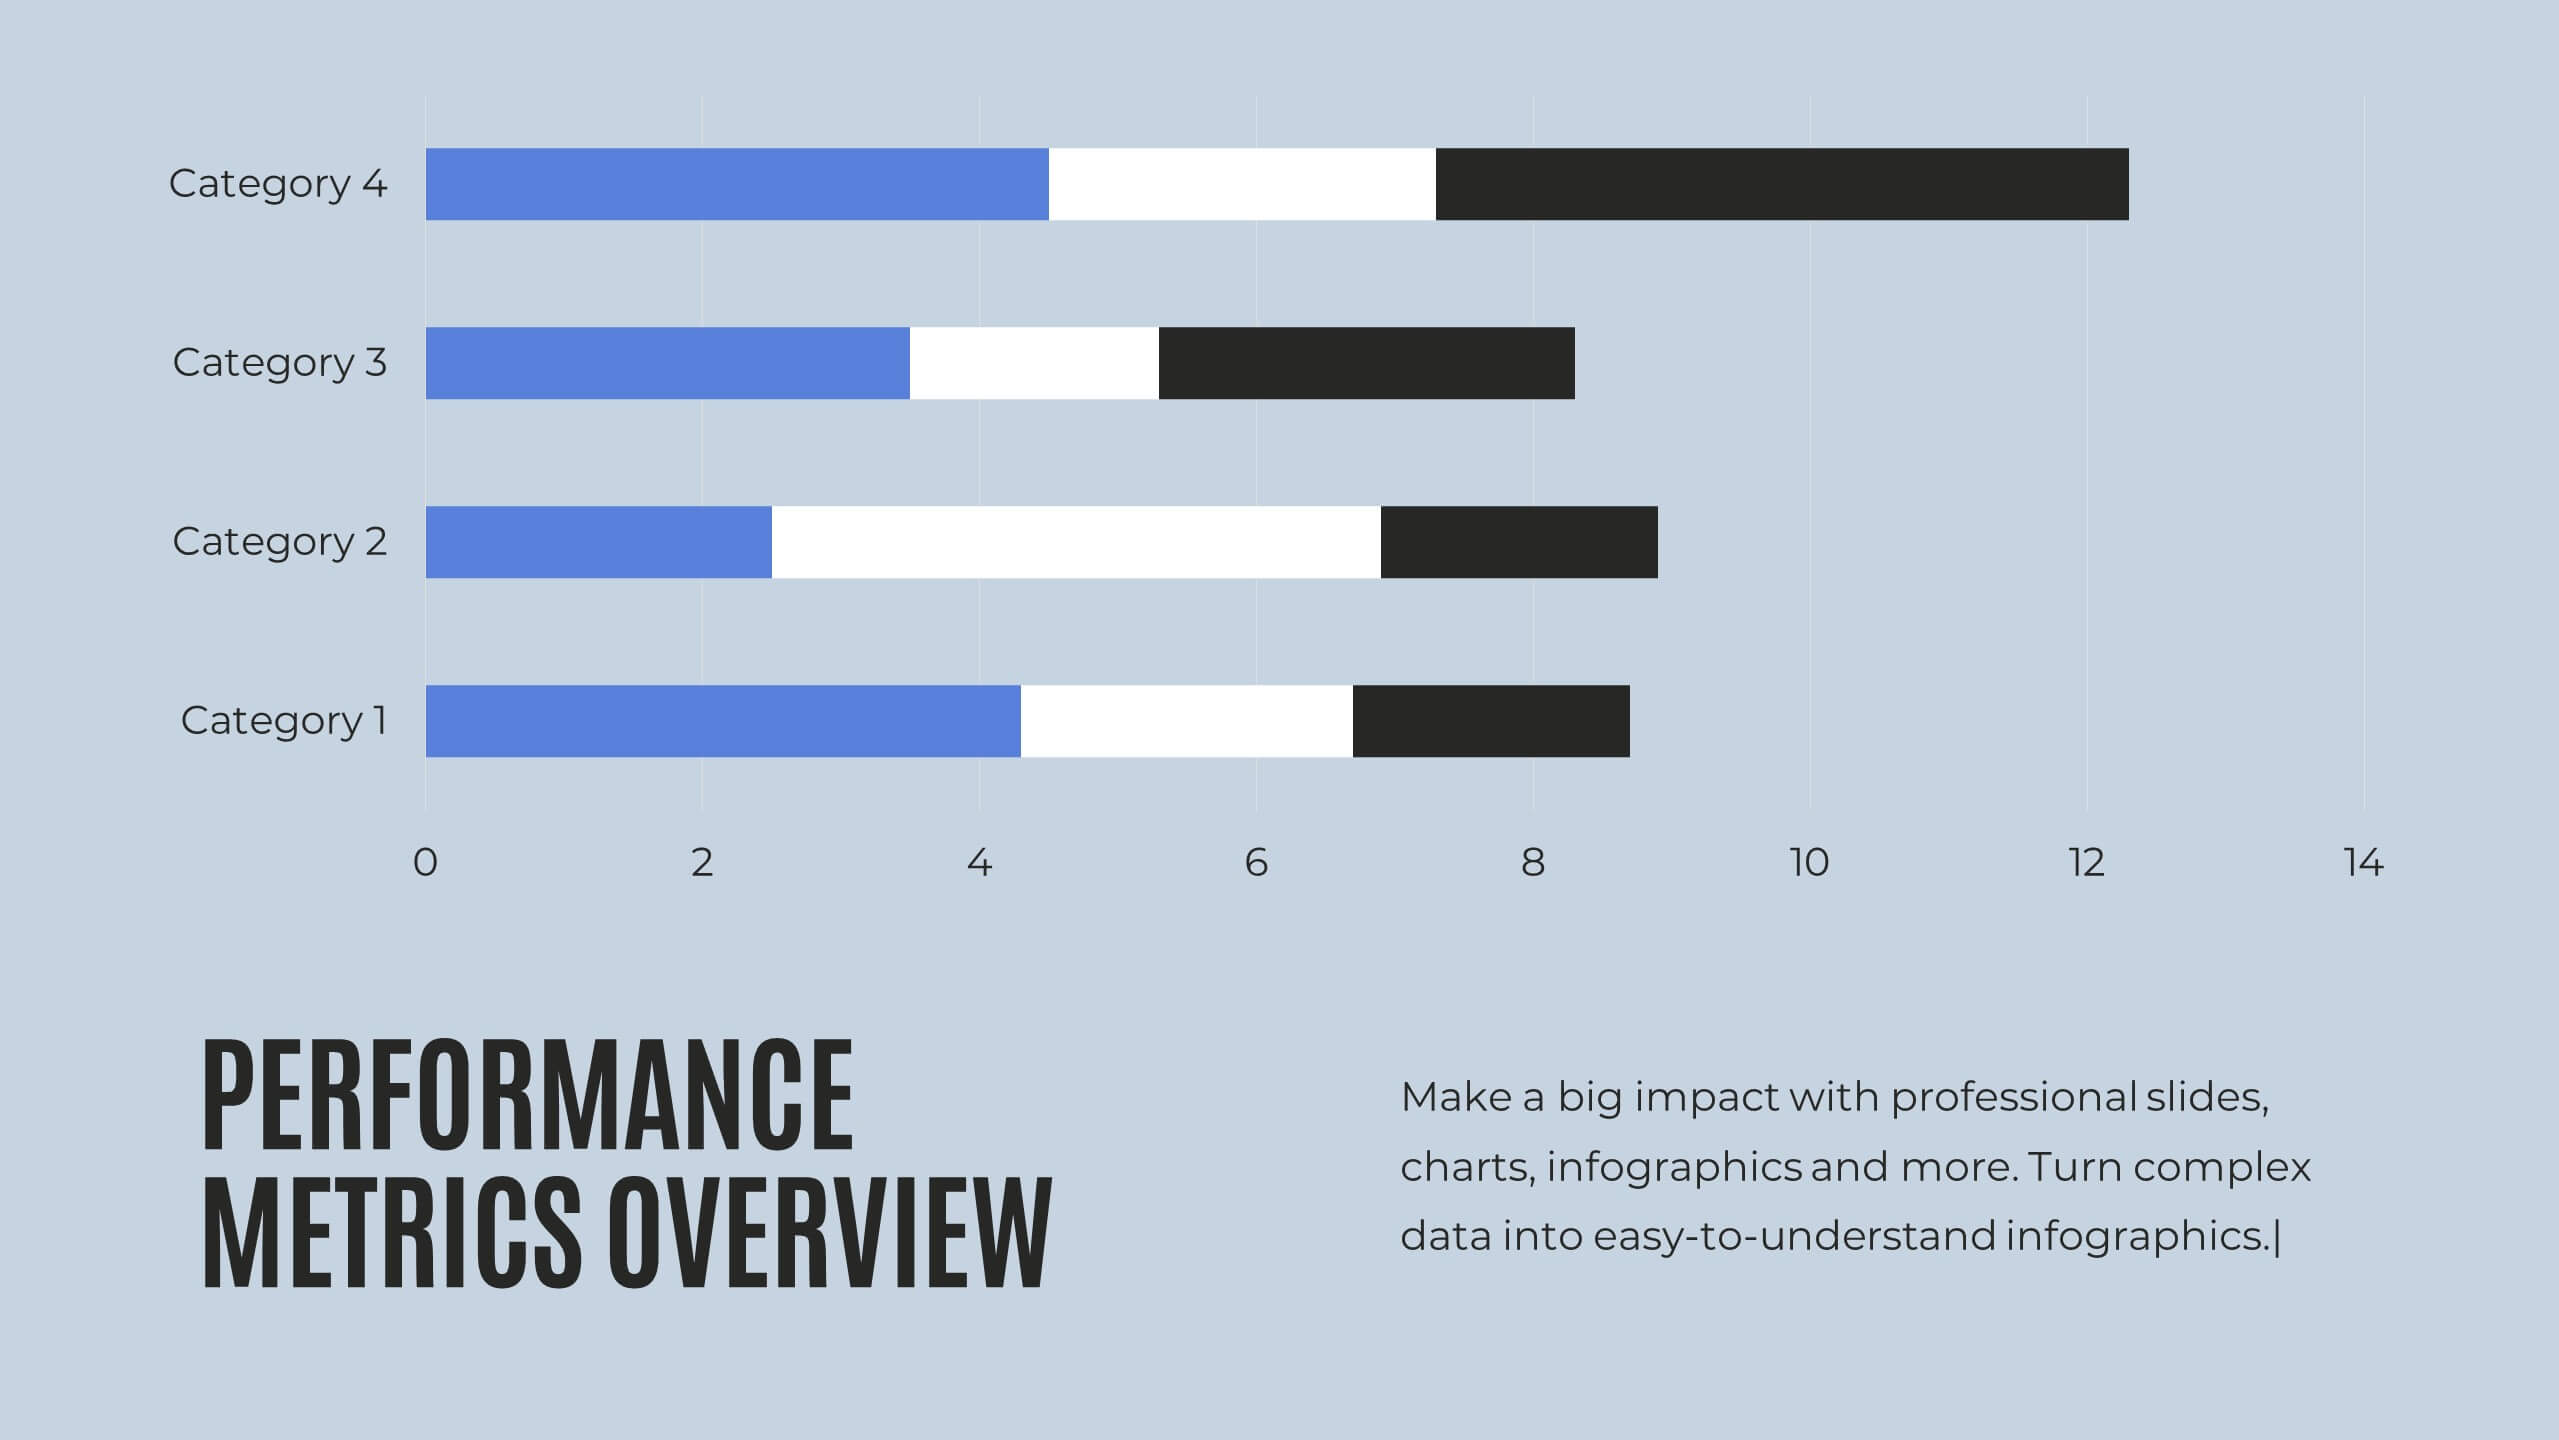
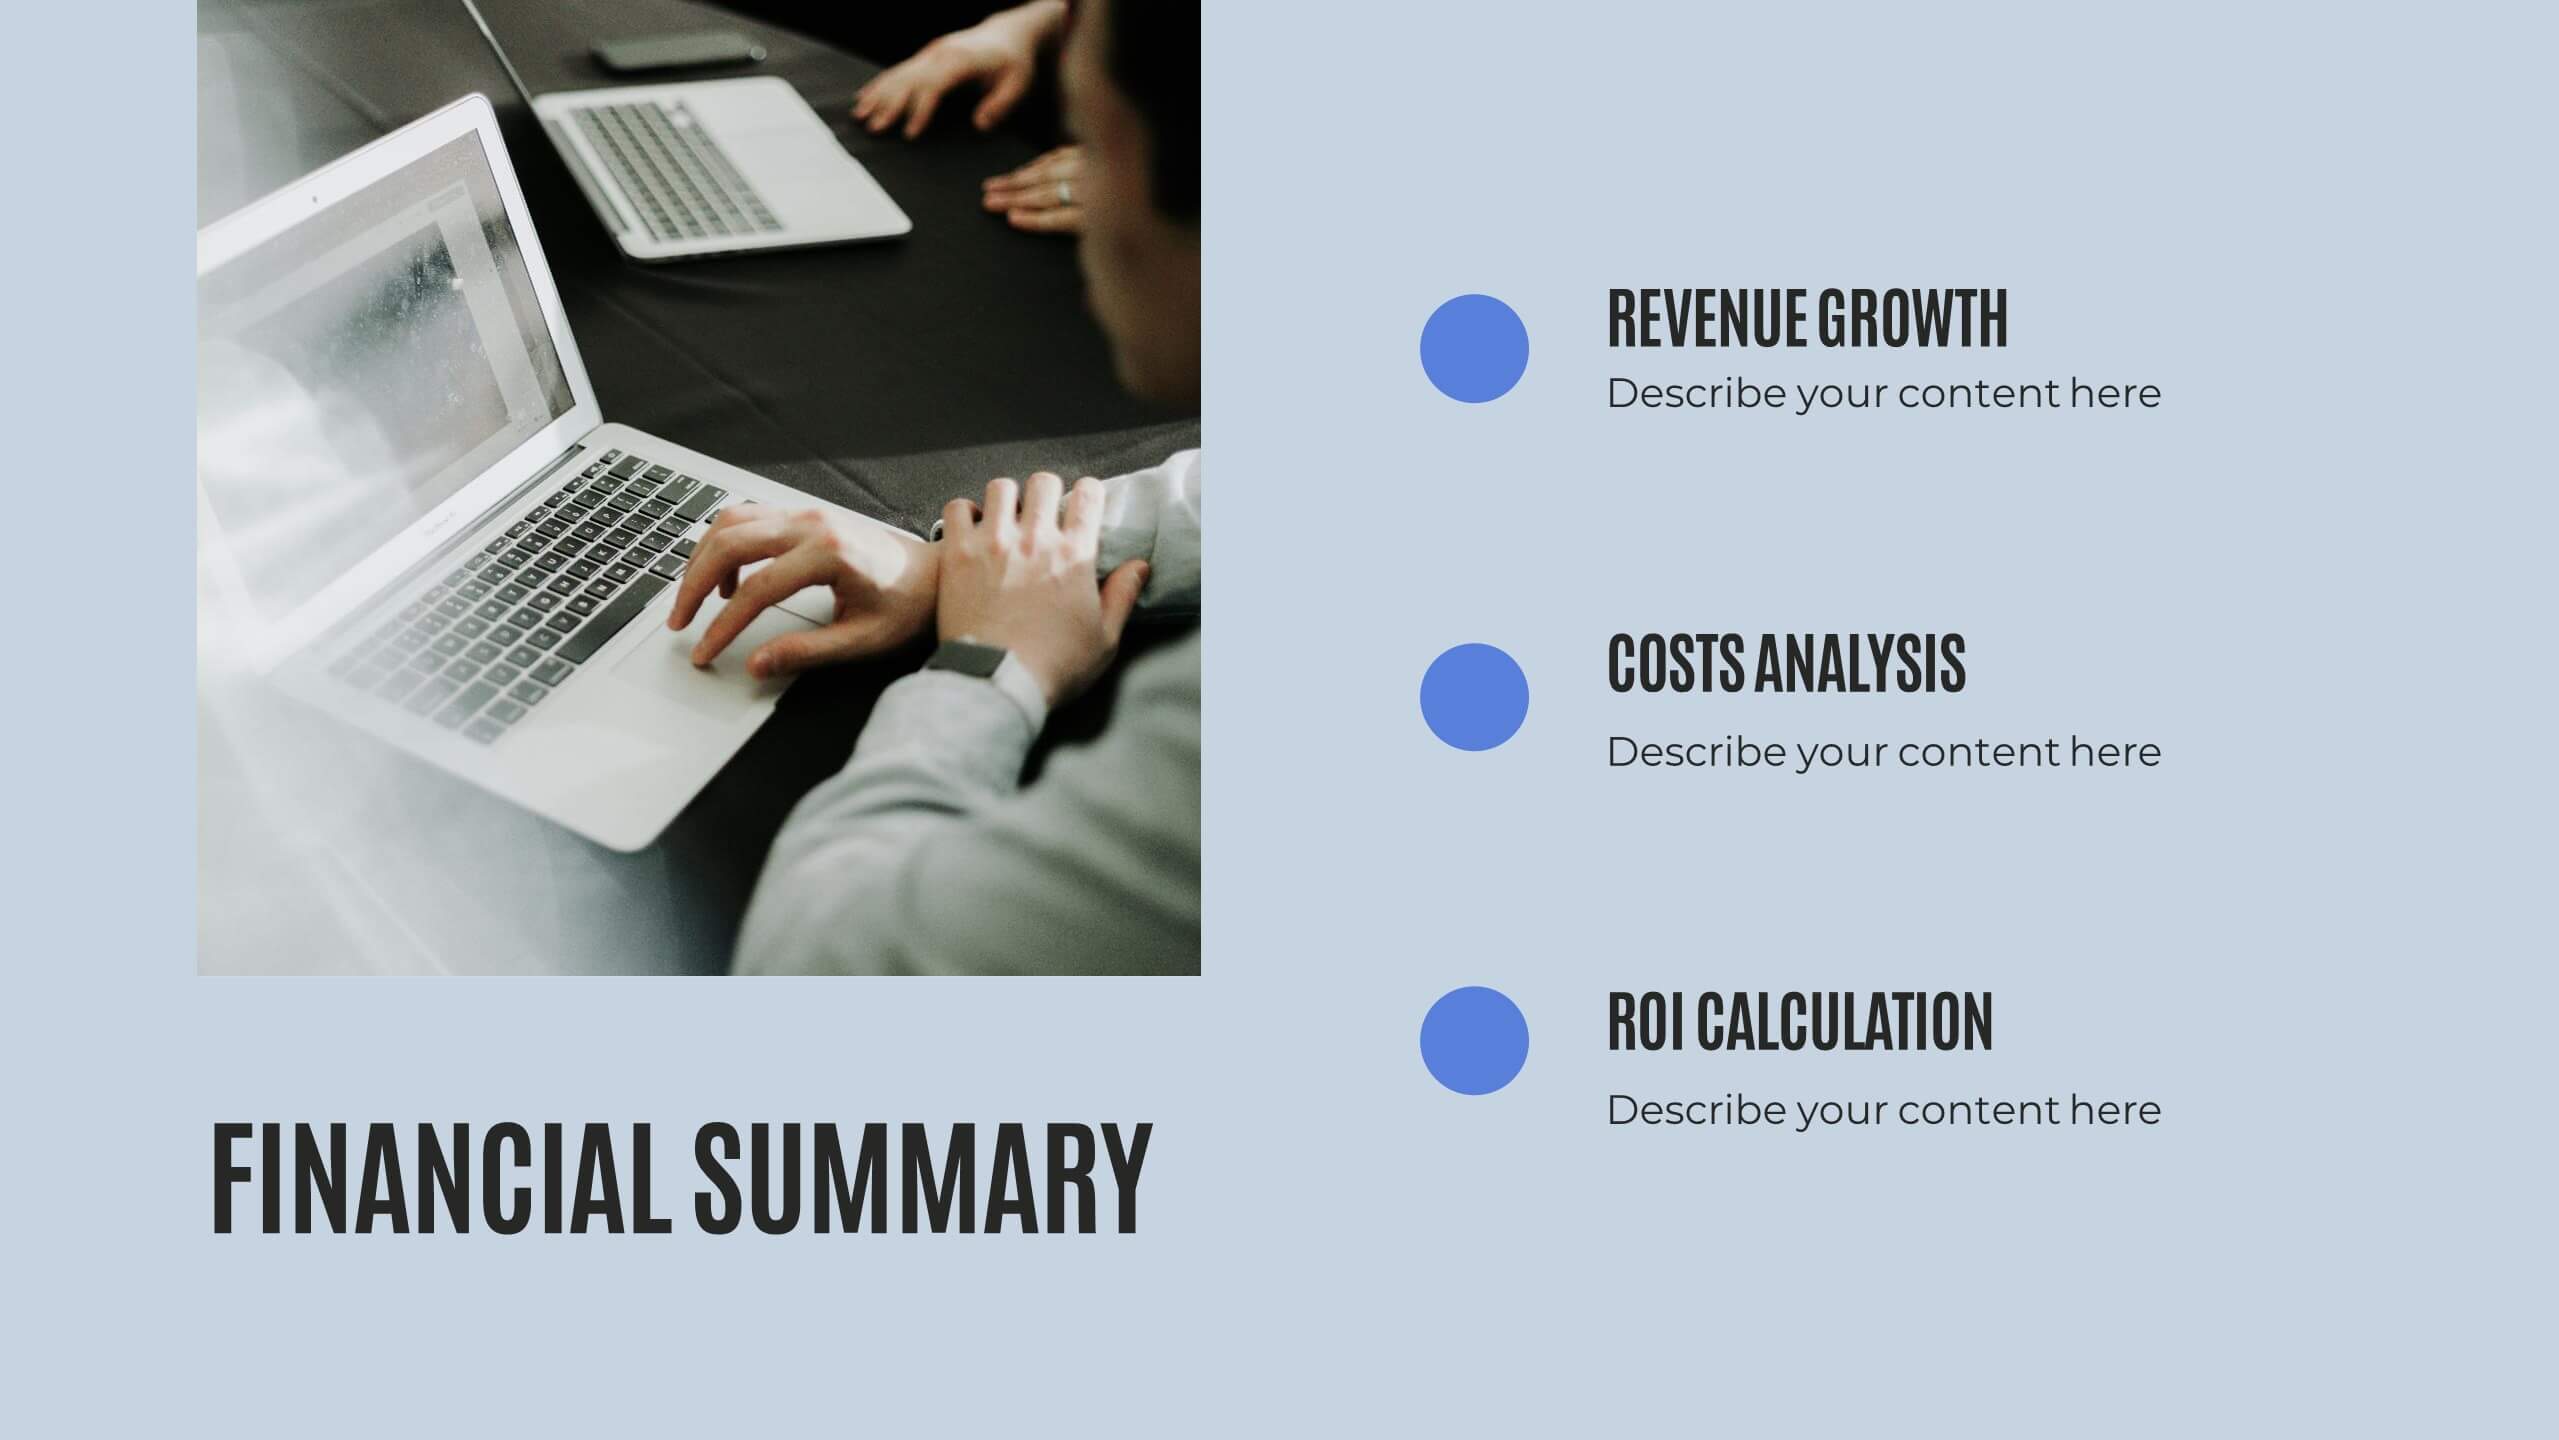
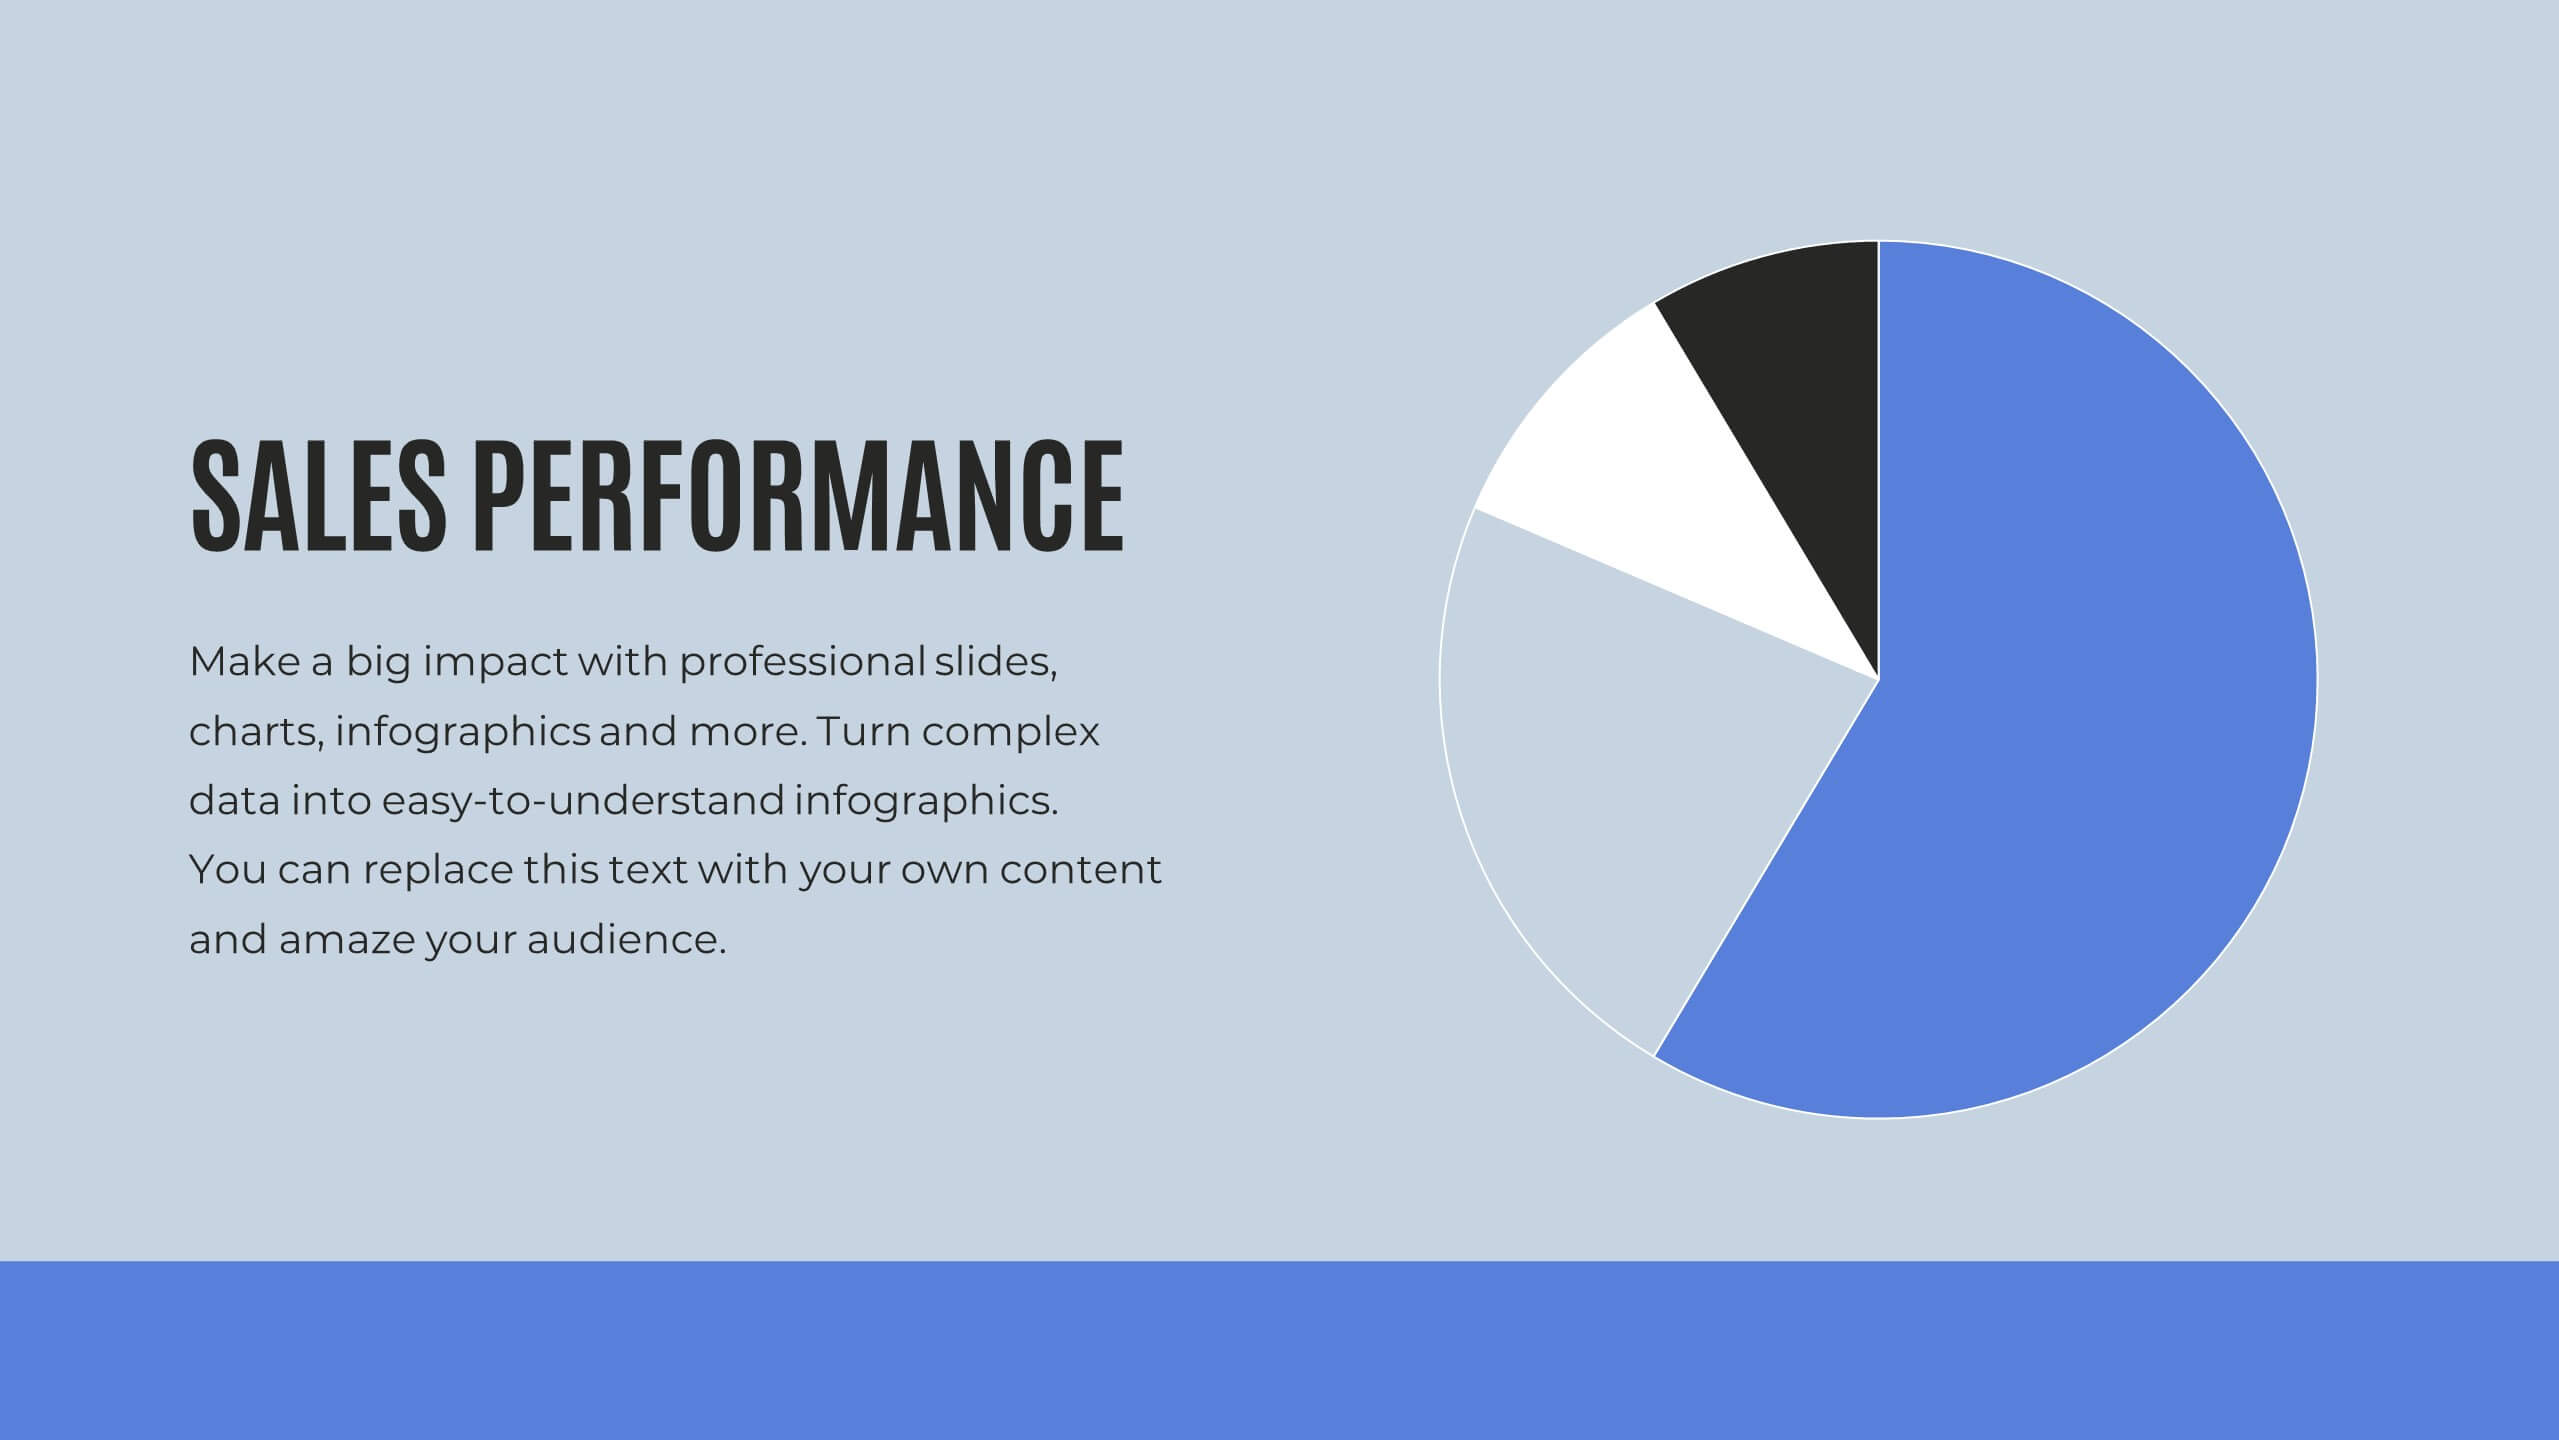
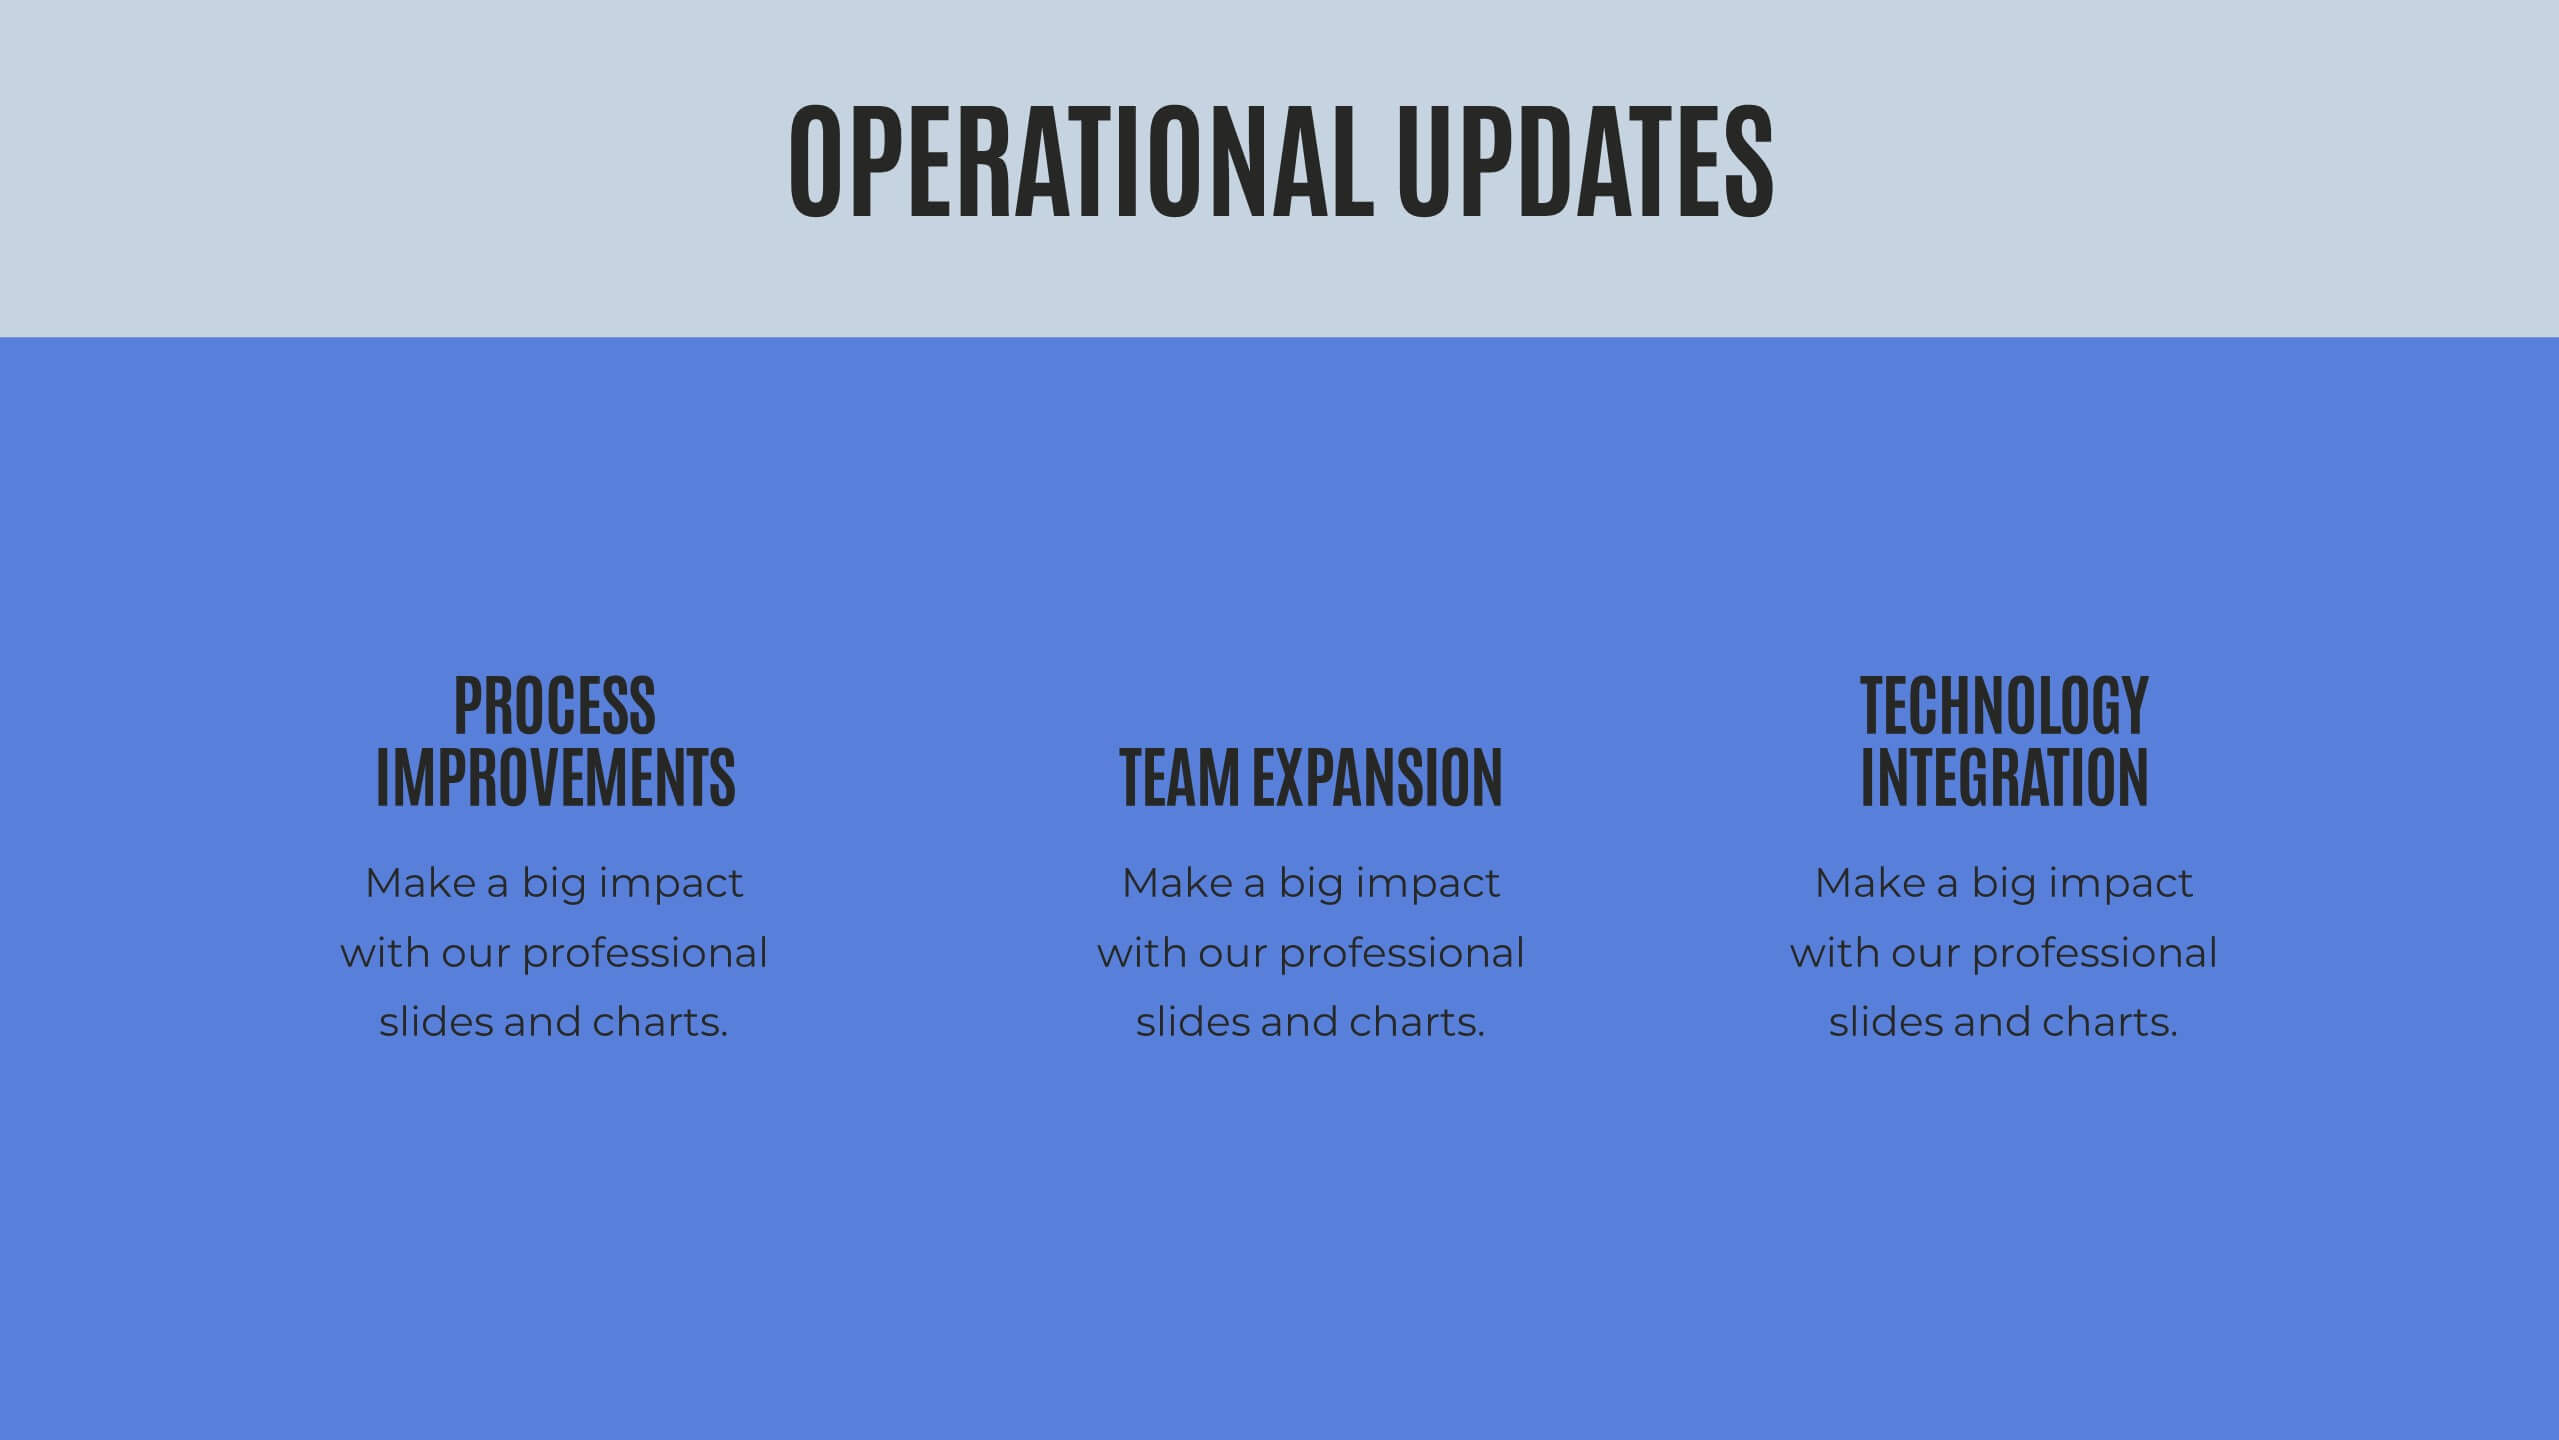
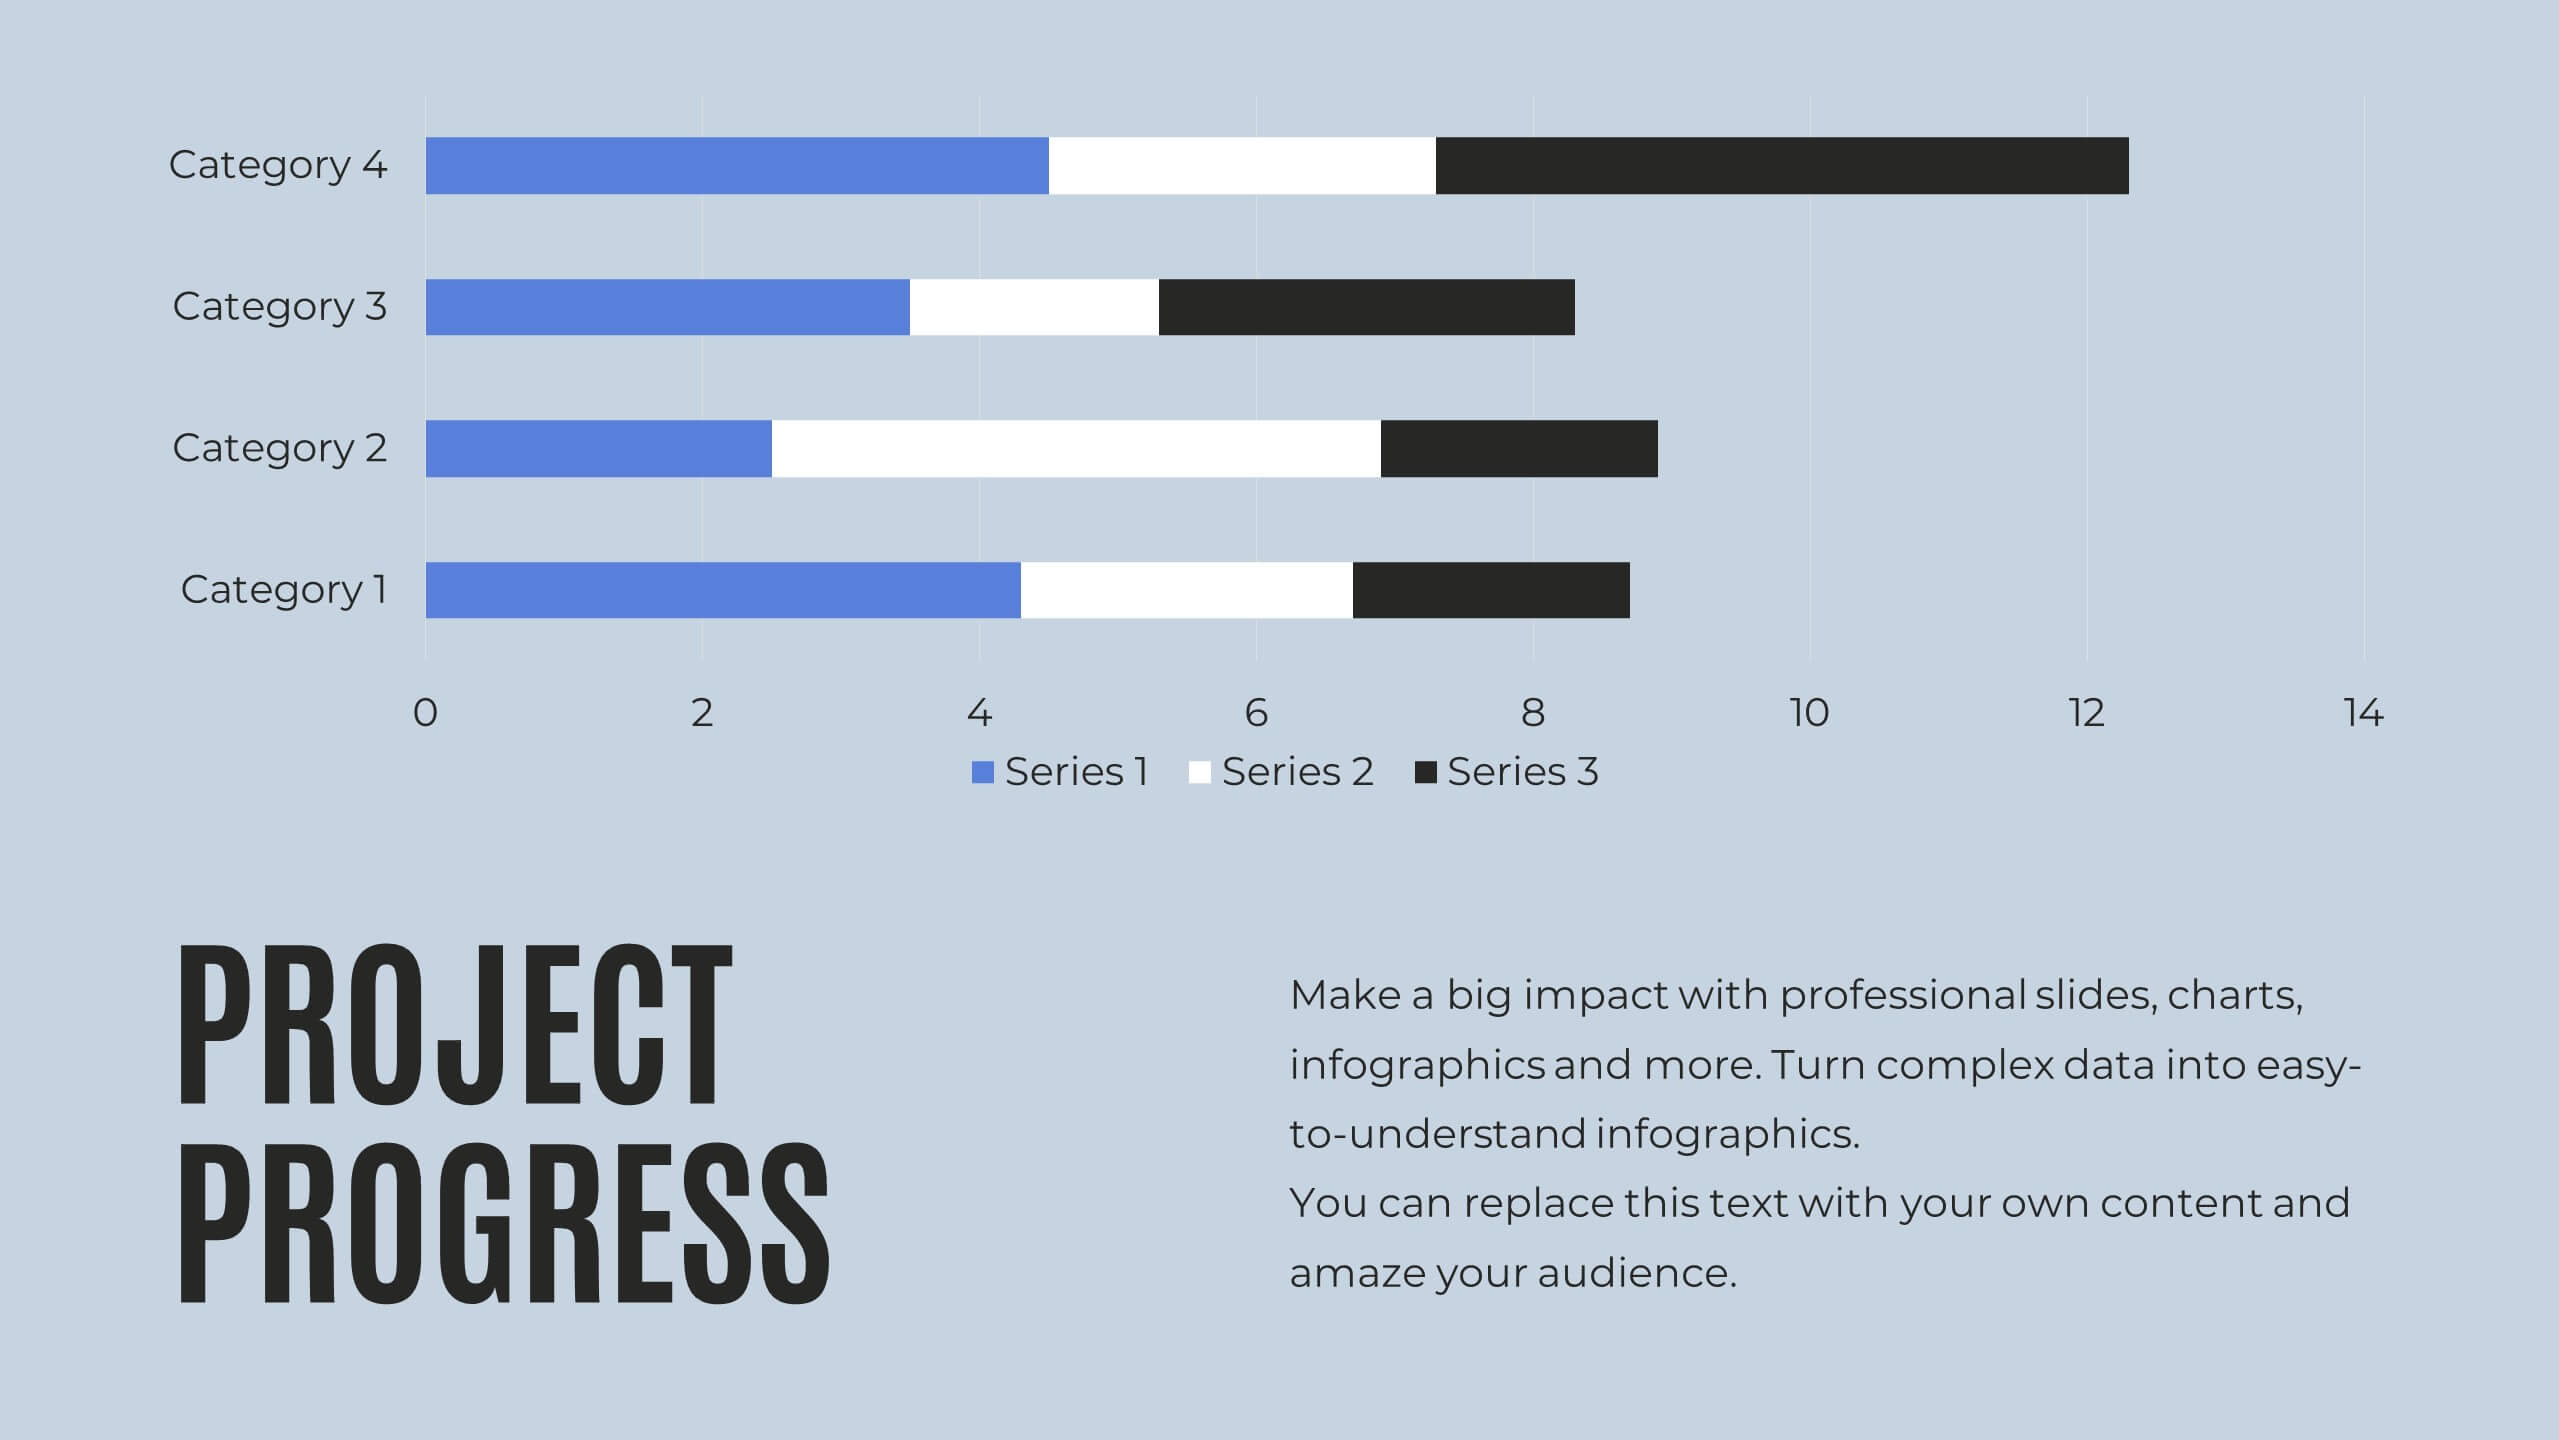
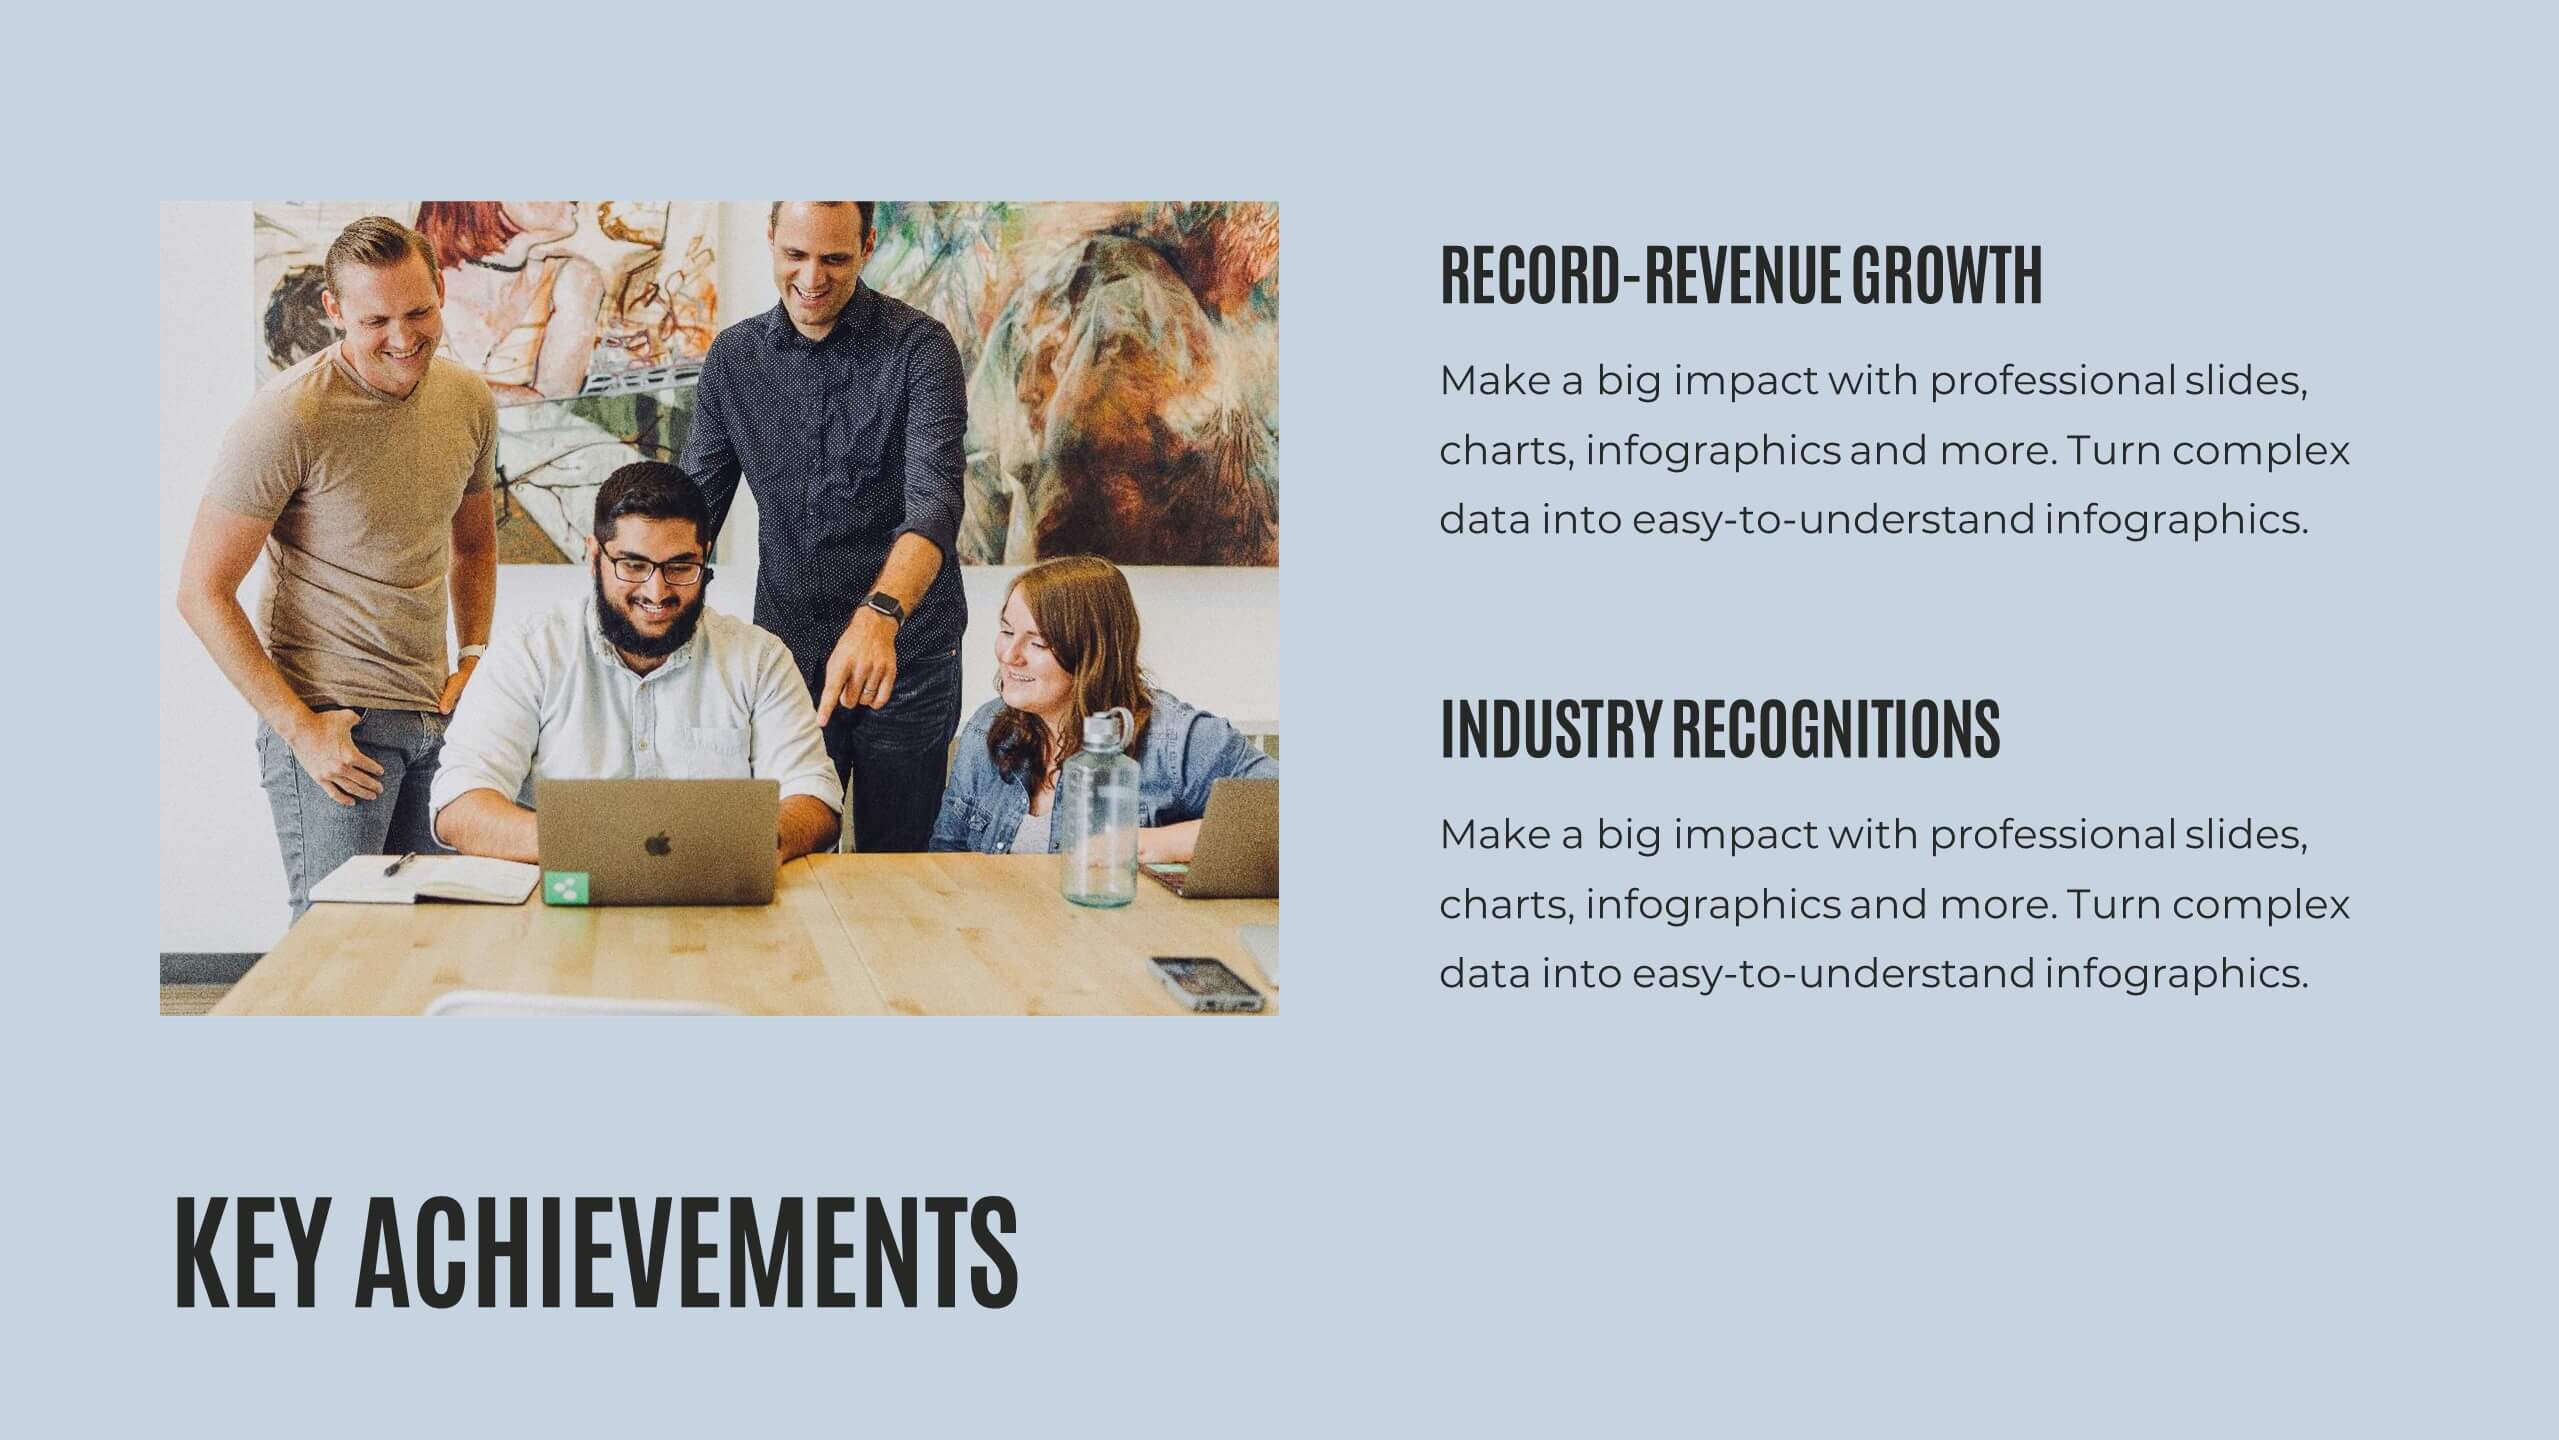
Quill Research Findings Report Presentation
Illuminate your findings with this comprehensive research report template! Perfect for presenting key highlights, performance metrics, and financial summaries, it features professional slides for project progress, risk assessments, and market trends analysis. Engage your audience with clear visuals and detailed content. Compatible with PowerPoint, Keynote, and Google Slides for seamless presentations on any platform.


5 slides
Global Warming Crisis Infographics
Global Warming refers to the long-term increase in the Earth's average surface temperature, primarily caused by the buildup of greenhouse gases in the atmosphere. This vertical infographics includes information about the effects of climate change on the planet. There are designed sections where you can feature data on rising temperatures, sea levels, and extreme weather events. These infographics feature unique designs that incorporate colors and images that convey the severity and urgency of this crisis. The goal of this template is to raise awareness about the need to address the global warming crisis and mitigate the impact of climate change.


21 slides
Tourmaline Project Proposal Presentation
This sleek design proposal template covers all essential sections like project summary, objectives, goals, and deliverables. With a modern and professional layout, it's perfect for presenting solutions and methodologies. Compatible with PowerPoint, Keynote, and Google Slides, it’s designed to impress clients and stakeholders with clear, structured information.


4 slides
Corporate Growth and Strategy Map Presentation
Visualize your business development path with this layered strategy map. Ideal for showcasing organizational goals, strategic initiatives, and cascading growth stages. Each level is clearly structured for easy customization, making it perfect for leadership planning, corporate roadmaps, or strategic reviews in PowerPoint, Keynote, or Google Slides.


4 slides
Sales and Reach Across Asia Map Presentation
Visualize your company’s market presence with the Sales and Reach Across Asia Map Presentation. Featuring clean markers, color-coded regions, and icon-labeled highlights, this template helps you clearly showcase key sales zones, distribution channels, or growth markets across Asia. Perfect for business reviews, expansion pitches, and performance updates. Fully editable in PowerPoint, Keynote, Google Slides, and Canva.


26 slides
Clean Company Profile Presentation
Present your organization with poise using this clean company profile template. The design marries minimalist aesthetics with functional elegance, embodying a professional and polished look. The crisp layout is dotted with geometric shapes and a calm color palette, reflecting a modern corporate image. It’s perfect for businesses wanting to communicate their mission, team, and milestones succinctly. The 'Meet Our CEO' slide introduces leadership with clarity, while the 'Four Option Slide' breaks down services or products into an easy-to-digest format. Financial achievements gain prominence on the 'Big Number Slide', and the 'World Map Infographic' illustrates global reach. This design is not just about presenting facts; it’s about telling your company’s story with sophistication. From first glance to final slide, it’s crafted to convey a narrative of reliability, innovation, and corporate integrity. Use it for investor briefings, internal meetings, or partnership pitches and establish an image of impeccable professionalism.


5 slides
Business Pillars for Success Presentation
Present your organization's core values or strategic foundations with this column-style infographic. Each pillar represents a distinct success factor, ideal for visualizing business frameworks, goals, or leadership principles. Fully editable in PowerPoint, Keynote, or Google Slides to match your brand and message.


4 slides
Executive Business Planning Roadmap Presentation
Outline your strategic initiatives with this Executive Business Planning Roadmap. Ideal for mapping product development, quarterly goals, or department plans, this slide helps visualize key stages across multiple projects. Easy to edit in PowerPoint, Keynote, and Google Slides—perfect for leadership updates, planning meetings, or executive-level presentations.


4 slides
Veterinary Care and Health Tips Presentation
Keep your audience engaged with this clean, friendly infographic layout perfect for sharing animal care advice and clinic insights. Ideal for veterinarians or pet health professionals, it helps communicate tips, services, and best practices clearly. Fully editable and compatible with PowerPoint, Keynote, and Google Slides for easy customization.


3 slides
Company Mission Overview Presentation
Bring your message to life with a bright, modern slide that highlights purpose, direction, and organizational goals in a clean, engaging layout. This presentation helps you communicate mission-driven insights with clarity and visual impact, making it ideal for internal teams or stakeholders. Fully compatible with PowerPoint, Keynote, and Google Slides.


4 slides
Business Milestone Roadmap Presentation
Visualize your company's journey with this curved-road milestone infographic. Perfect for tracking key goals, quarterly achievements, or strategic plans, this template uses clear markers along a winding path to emphasize progress and direction. Ideal for business updates, project timelines, or growth strategies. Fully editable in PowerPoint, Keynote, and Google Slides.


4 slides
Mirror Data Distribution Butterfly Format Presentation
Present side-by-side comparisons with clarity using the Mirror Data Distribution Butterfly Format Presentation. This layout helps visualize balanced data sets, performance comparisons, or goal vs. outcome metrics with mirrored bars and intuitive icons. Fully customizable in Canva, PowerPoint, Google Slides, and Keynote to match your brand's aesthetic and message.