


Features
- 22 Unique Slides
- Fully editable and easy to edit in Microsoft Powerpoint, Keynote and Google Slides
- 16:9 widescreen layout
- Clean and professional designs
- Export to JPG, PDF or send by email


Do you have any questions?
Recommend


20 slides
Aurumix Agency Portfolio Presentation
Make a lasting impression with this bold and creative agency portfolio presentation. Designed to showcase your services, case studies, client success stories, and campaign strategies, this template helps highlight your agency’s expertise with confidence. Fully customizable and compatible with PowerPoint, Keynote, and Google Slides for a seamless, professional presentation experience.


4 slides
Virtual Learning Experience Design Presentation
Bring your online classroom ideas to life with this modern and visual-first design! This infographic presentation breaks down the key components of virtual learning experience design—perfect for mapping student touchpoints, engagement strategies, and content flow. Fully editable and easy to use in PowerPoint, Keynote, and Google Slides for fast customization.


6 slides
Audience Segmentation by Region Presentation
Discover where your audience truly connects with a visually engaging layout that highlights market insights across regions. This presentation helps businesses identify, compare, and target audiences by location for smarter decision-making. Fully customizable and compatible with PowerPoint, Keynote, and Google Slides for seamless professional use and presentation flexibility.


4 slides
Comparative Assessment Using Harvey Ball Chart Presentation
Make your evaluations easier to understand with this Harvey Ball chart template. Designed for performance comparison, efficiency scoring, or feature benchmarking, this layout supports up to 4 items and 3 criteria. Each element is clearly visualized for quick decision-making. Fully editable in PowerPoint, Keynote, or Google Slides—ideal for business strategy, operations, or HR presentations.


6 slides
Go-to-Market Launch Plan Presentation
Launch with confidence using this Go-to-Market Launch Plan Presentation. This clean, step-by-step visual framework highlights each phase of your GTM strategy—from market research to execution metrics. Ideal for startups, product managers, and marketing teams. Fully customizable in PowerPoint, Keynote, and Google Slides.


28 slides
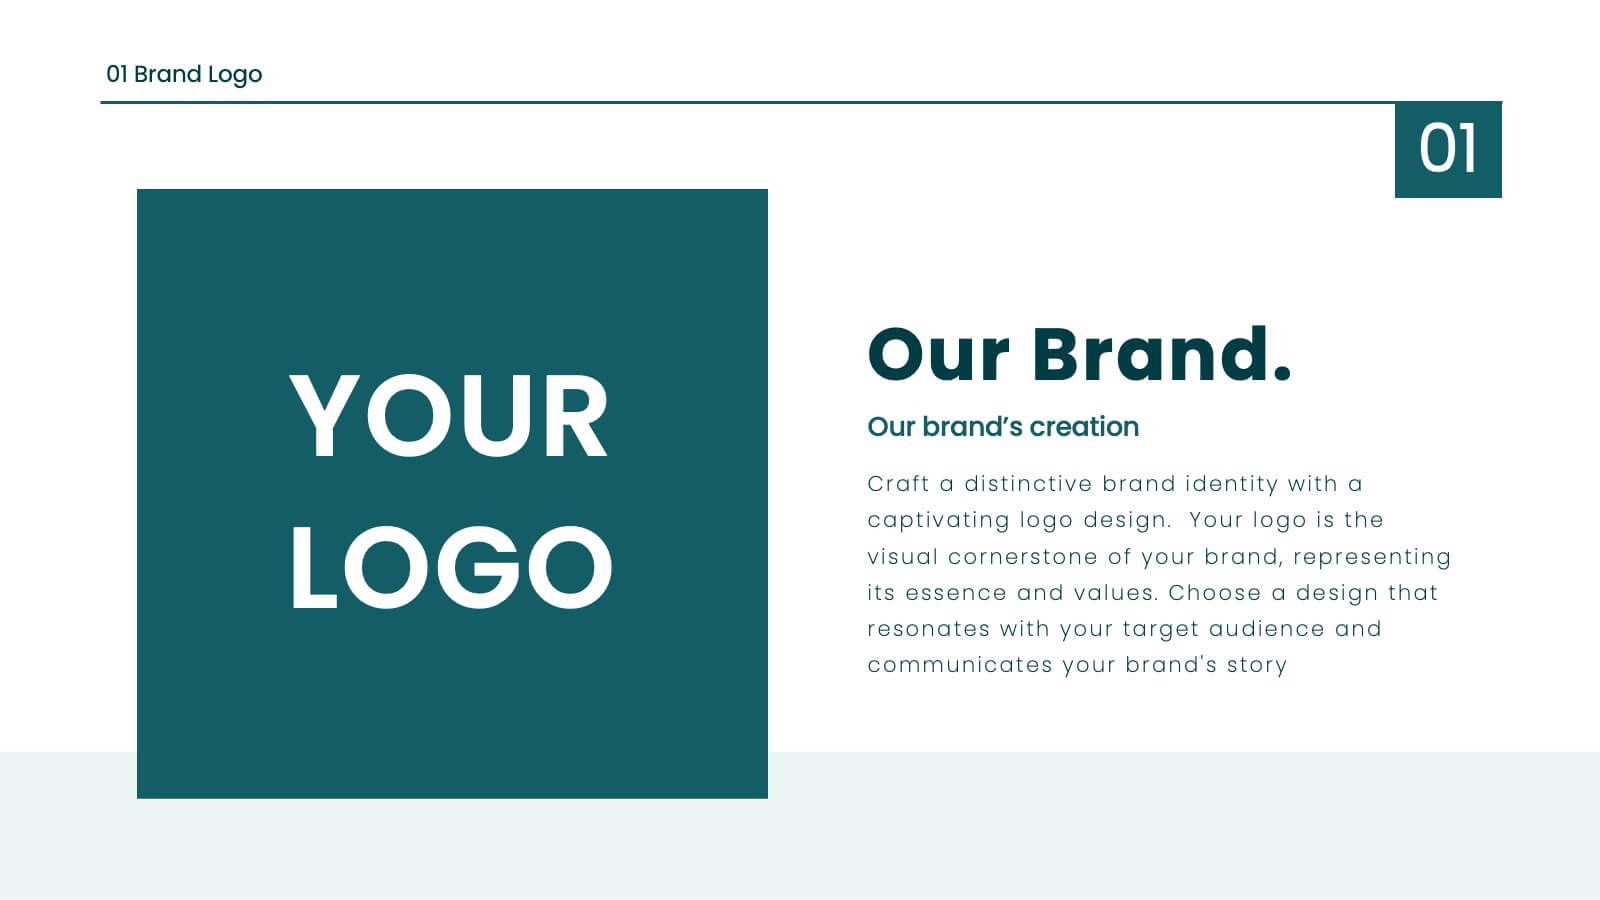
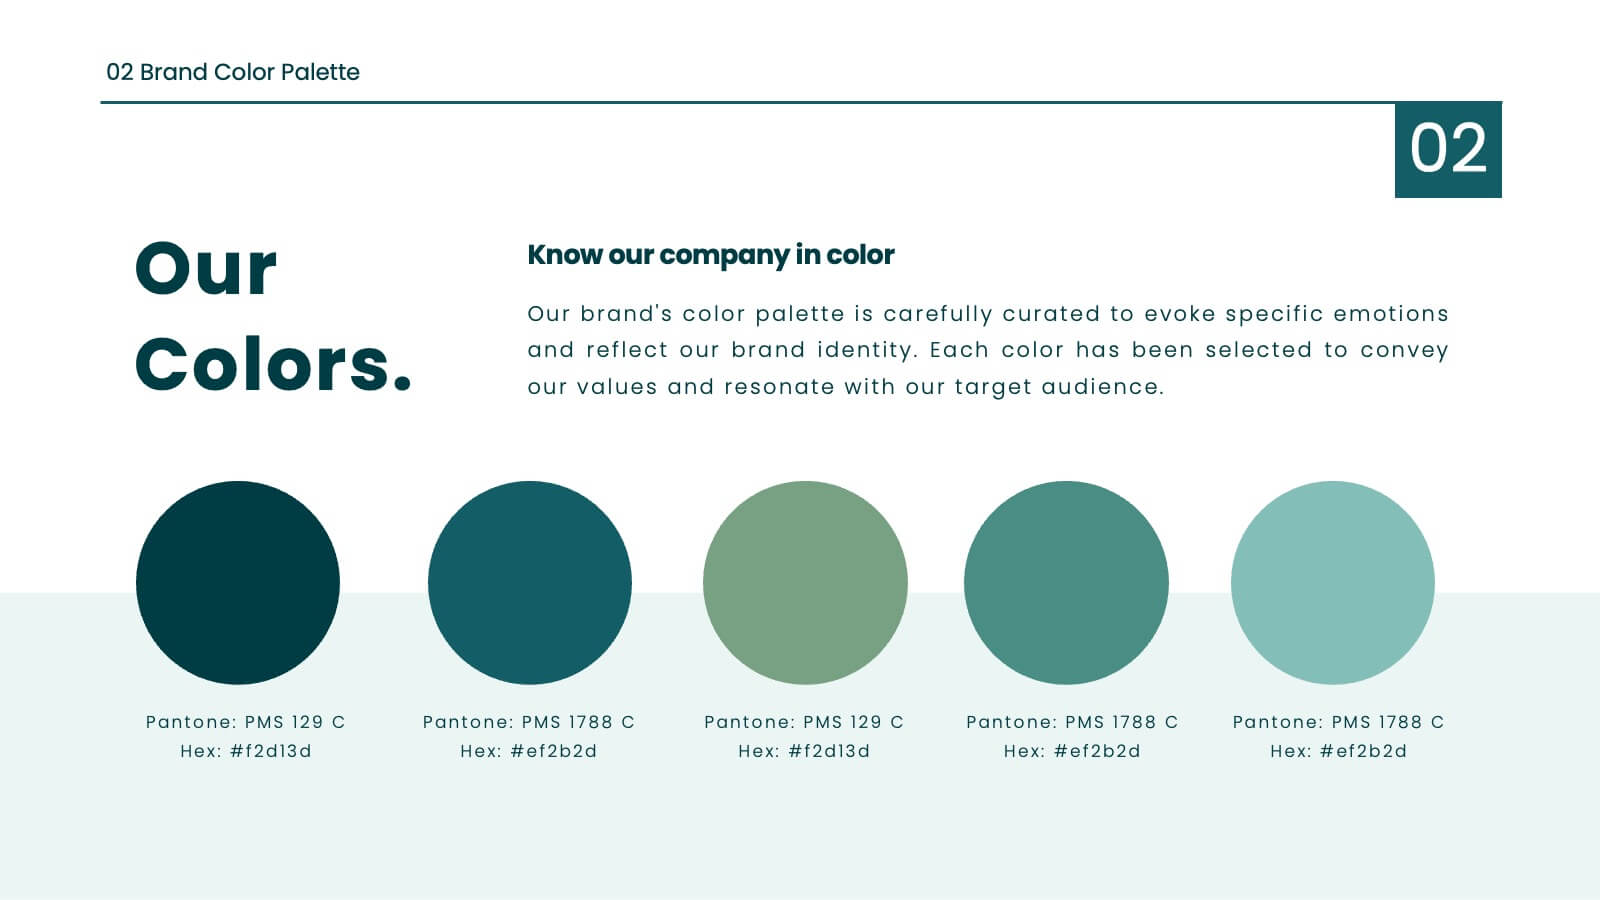
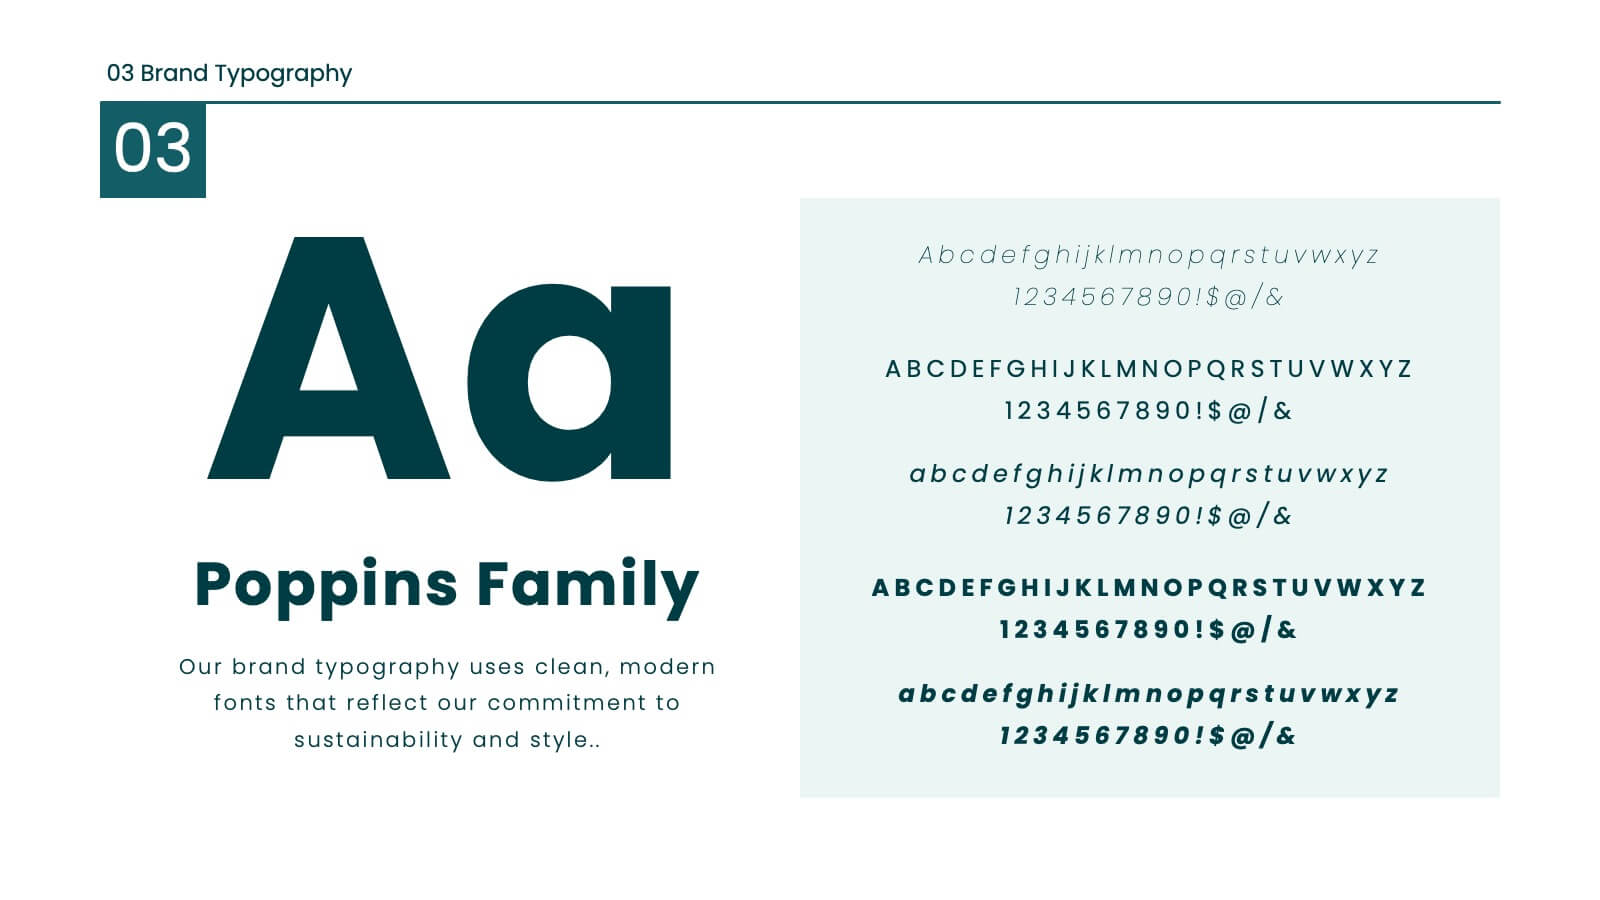
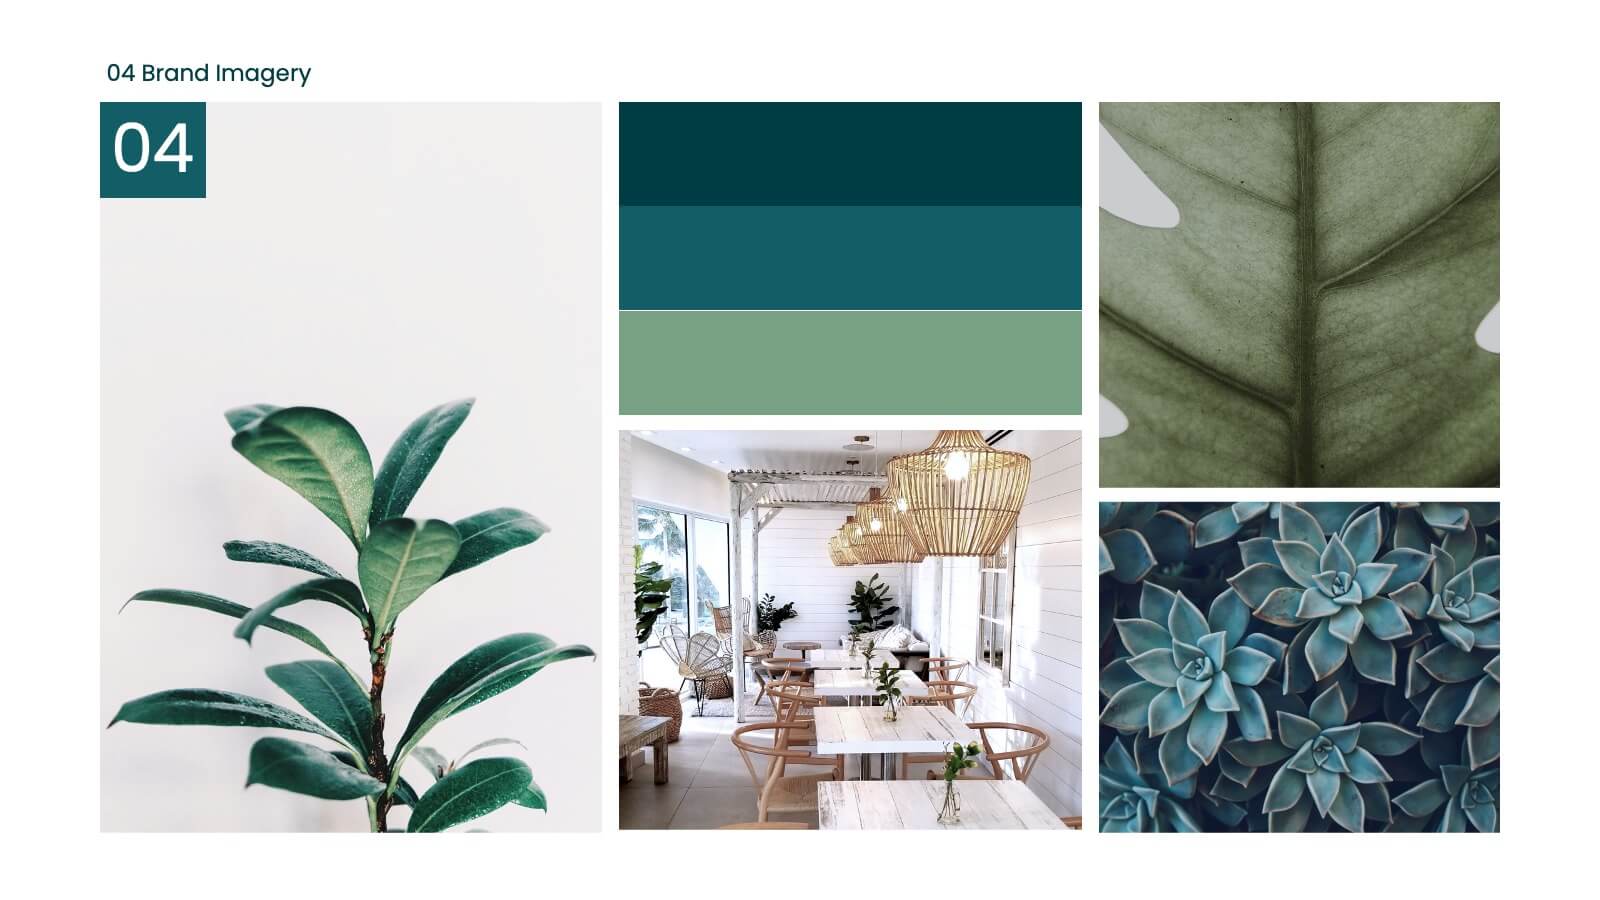
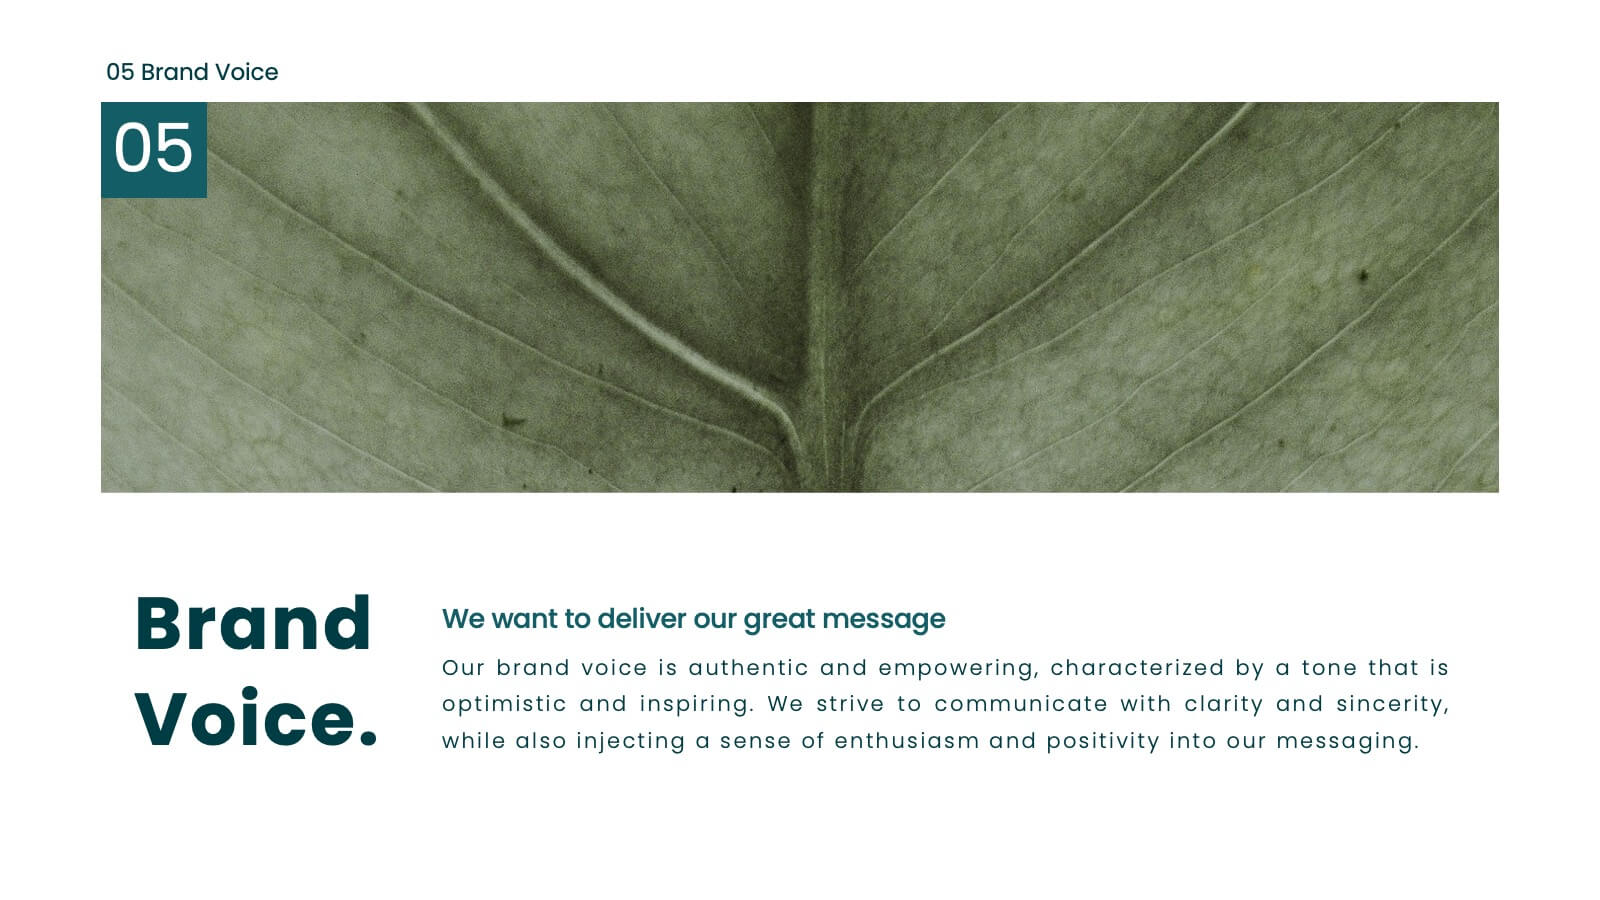
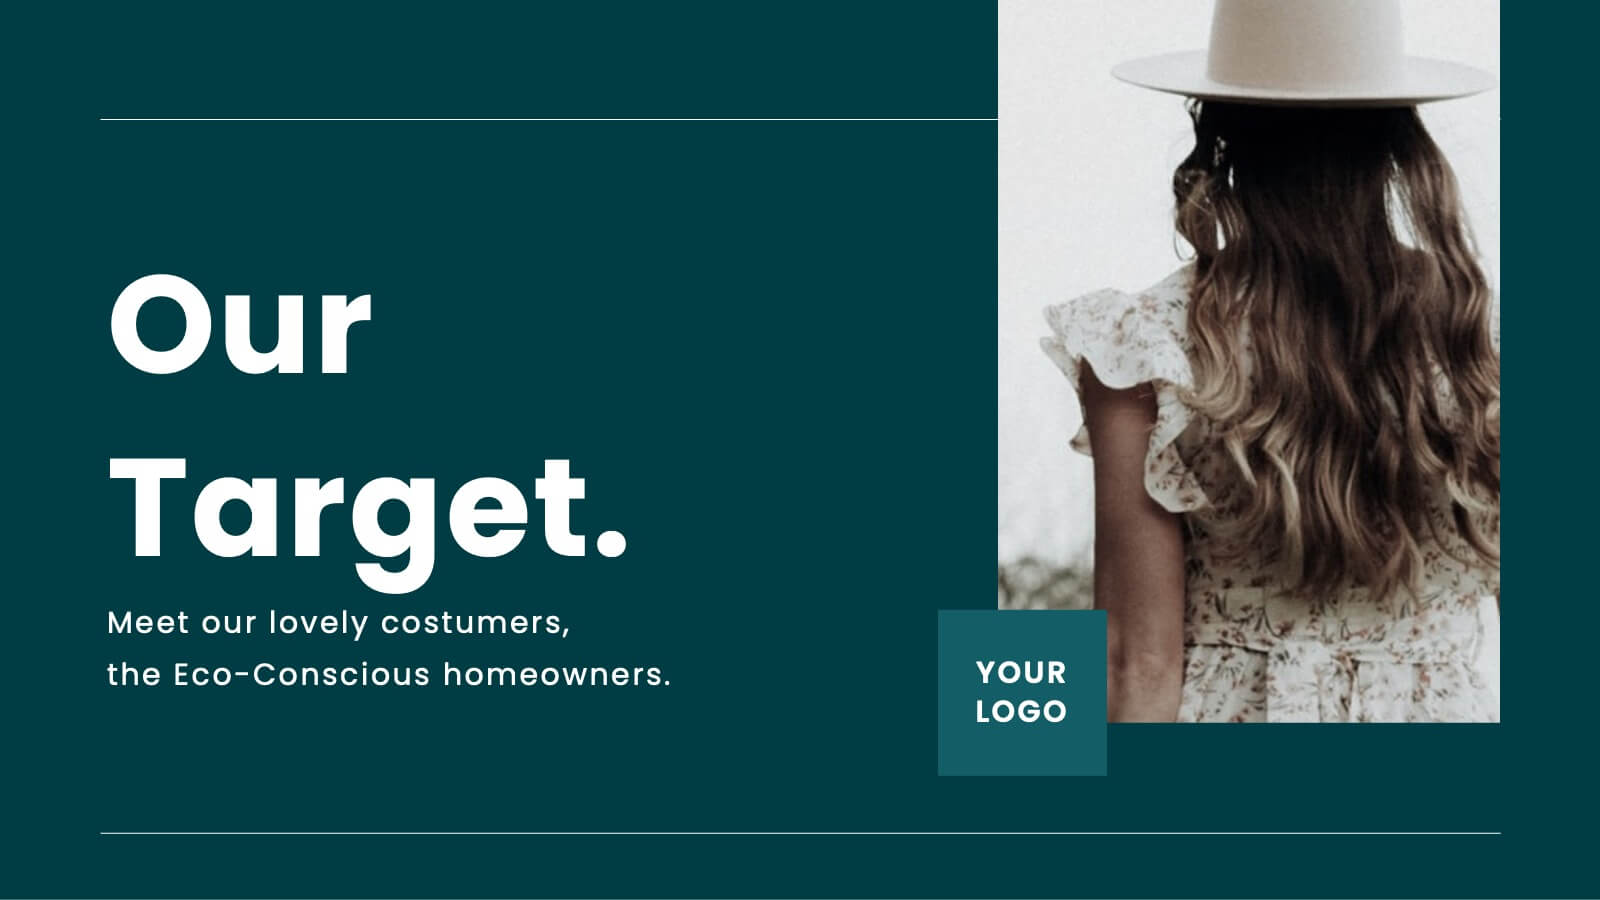
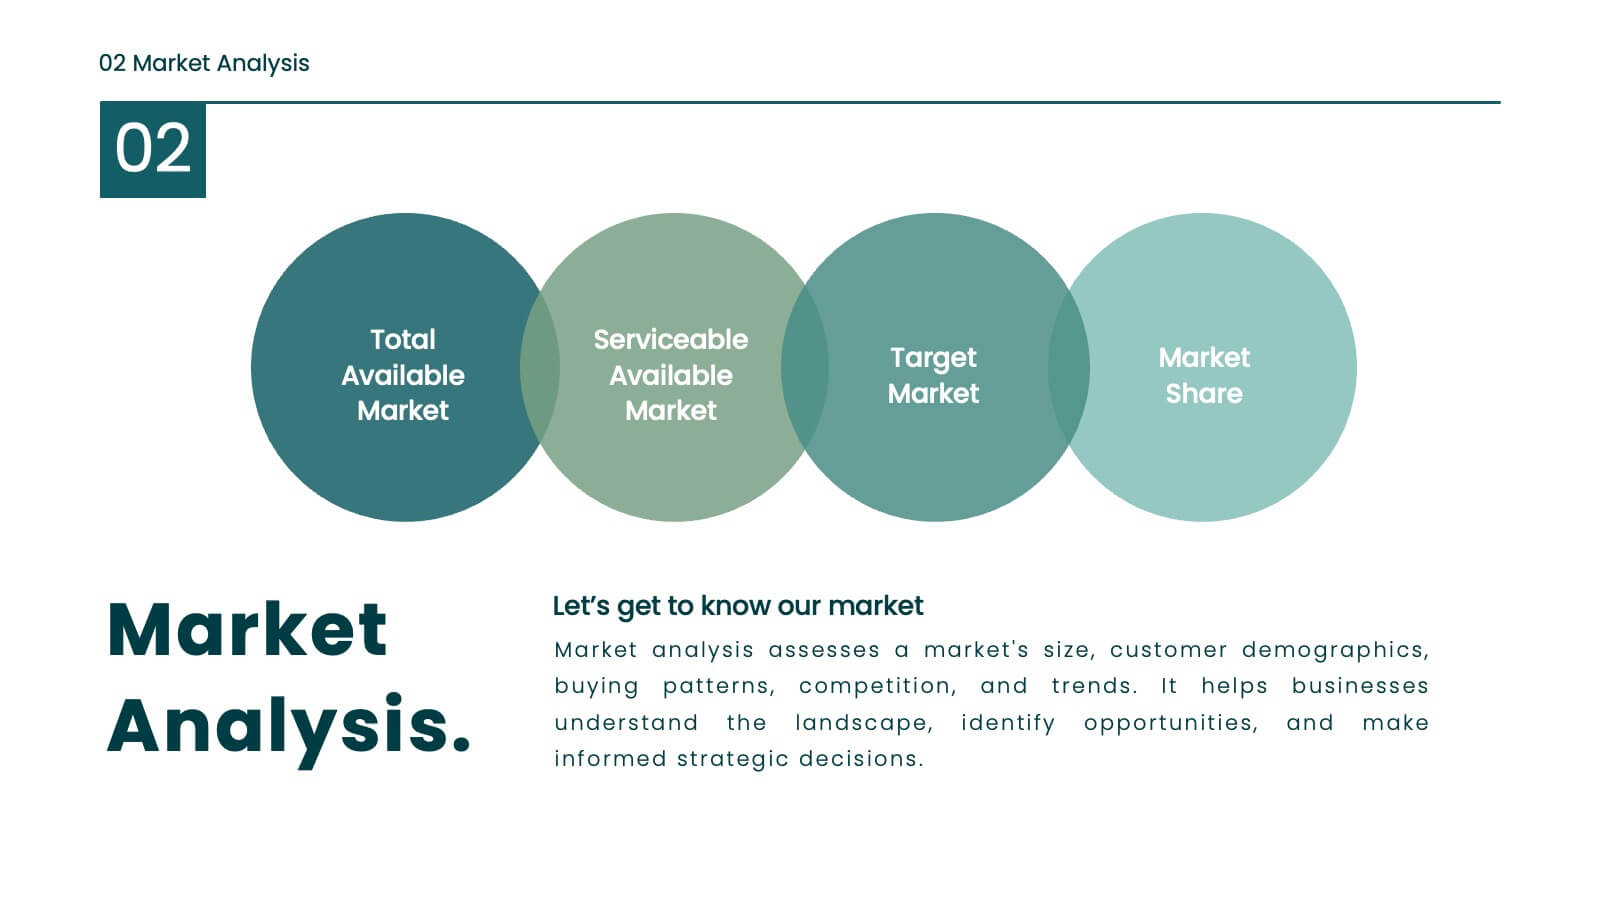
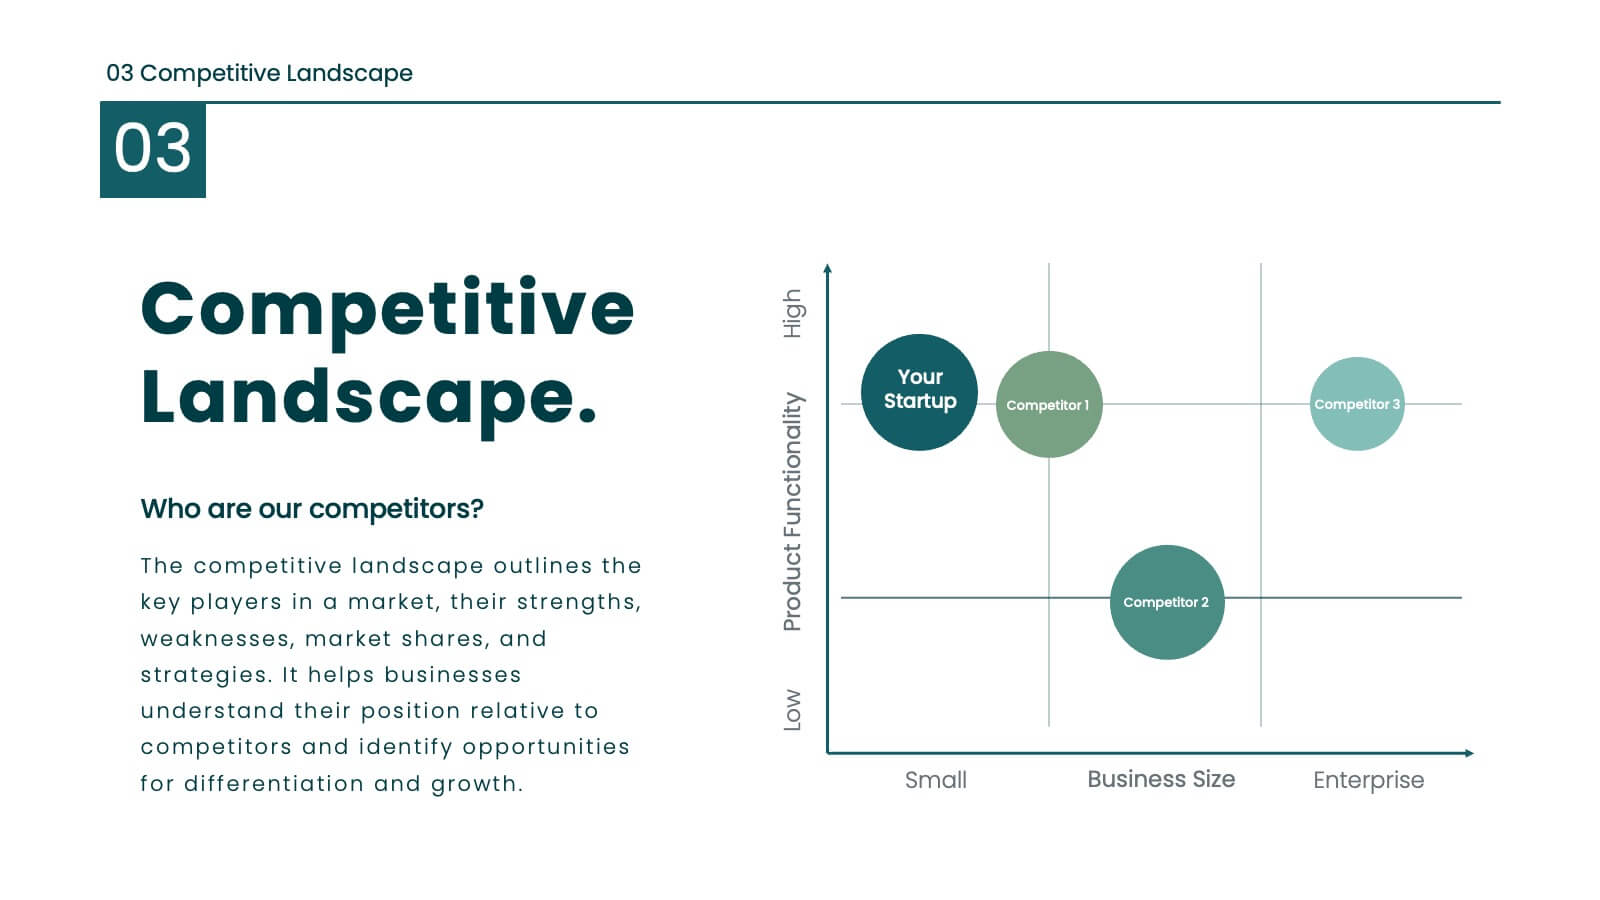
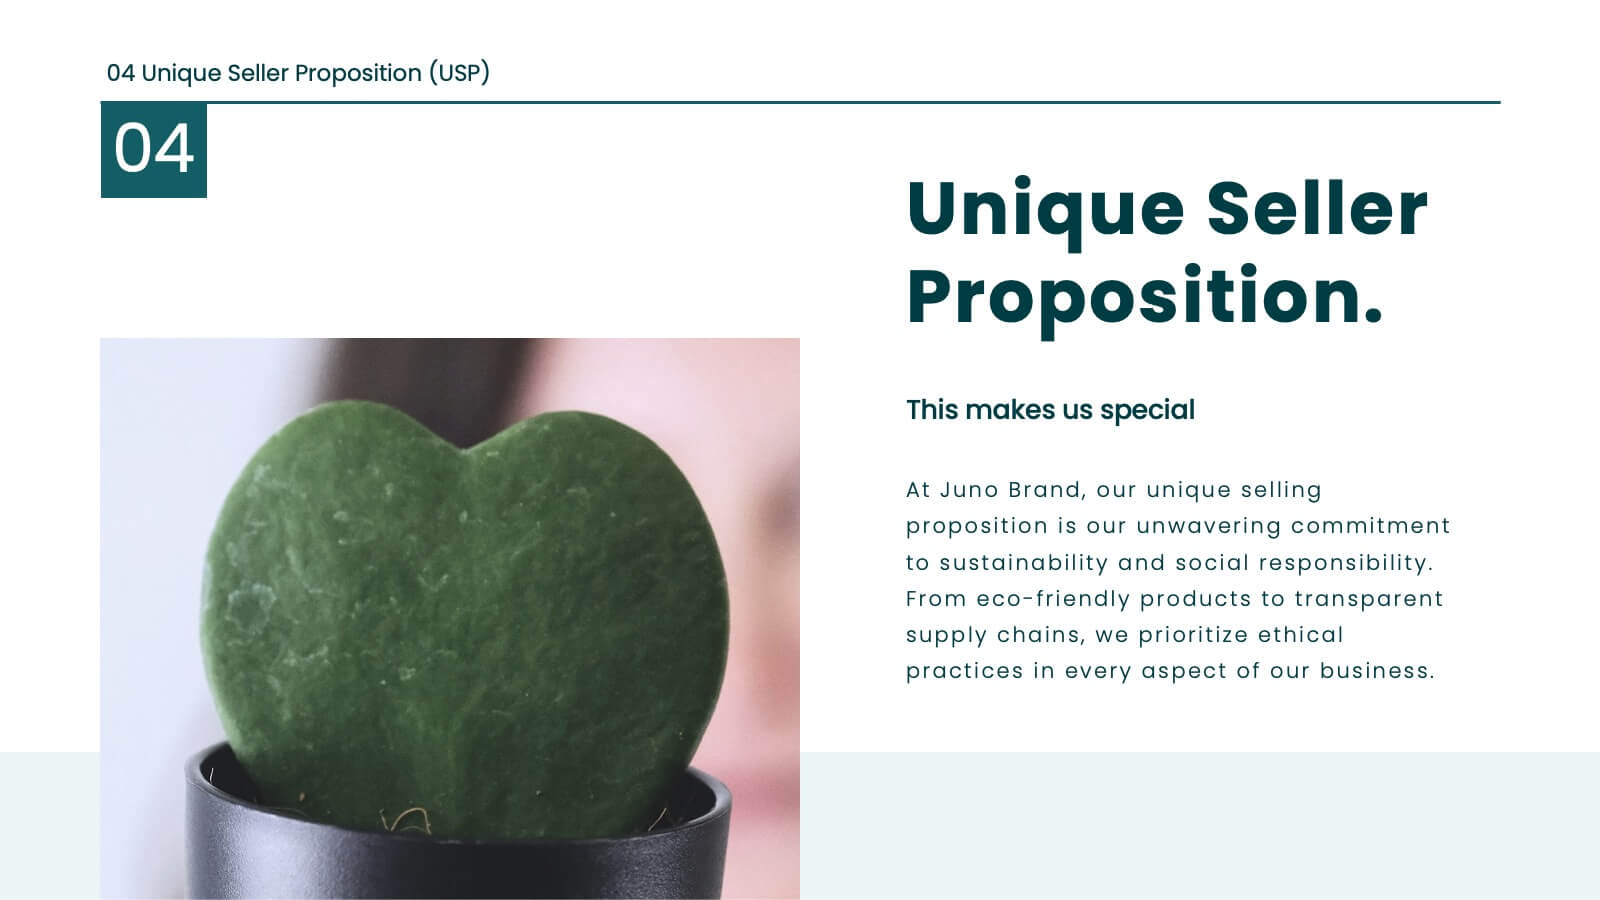
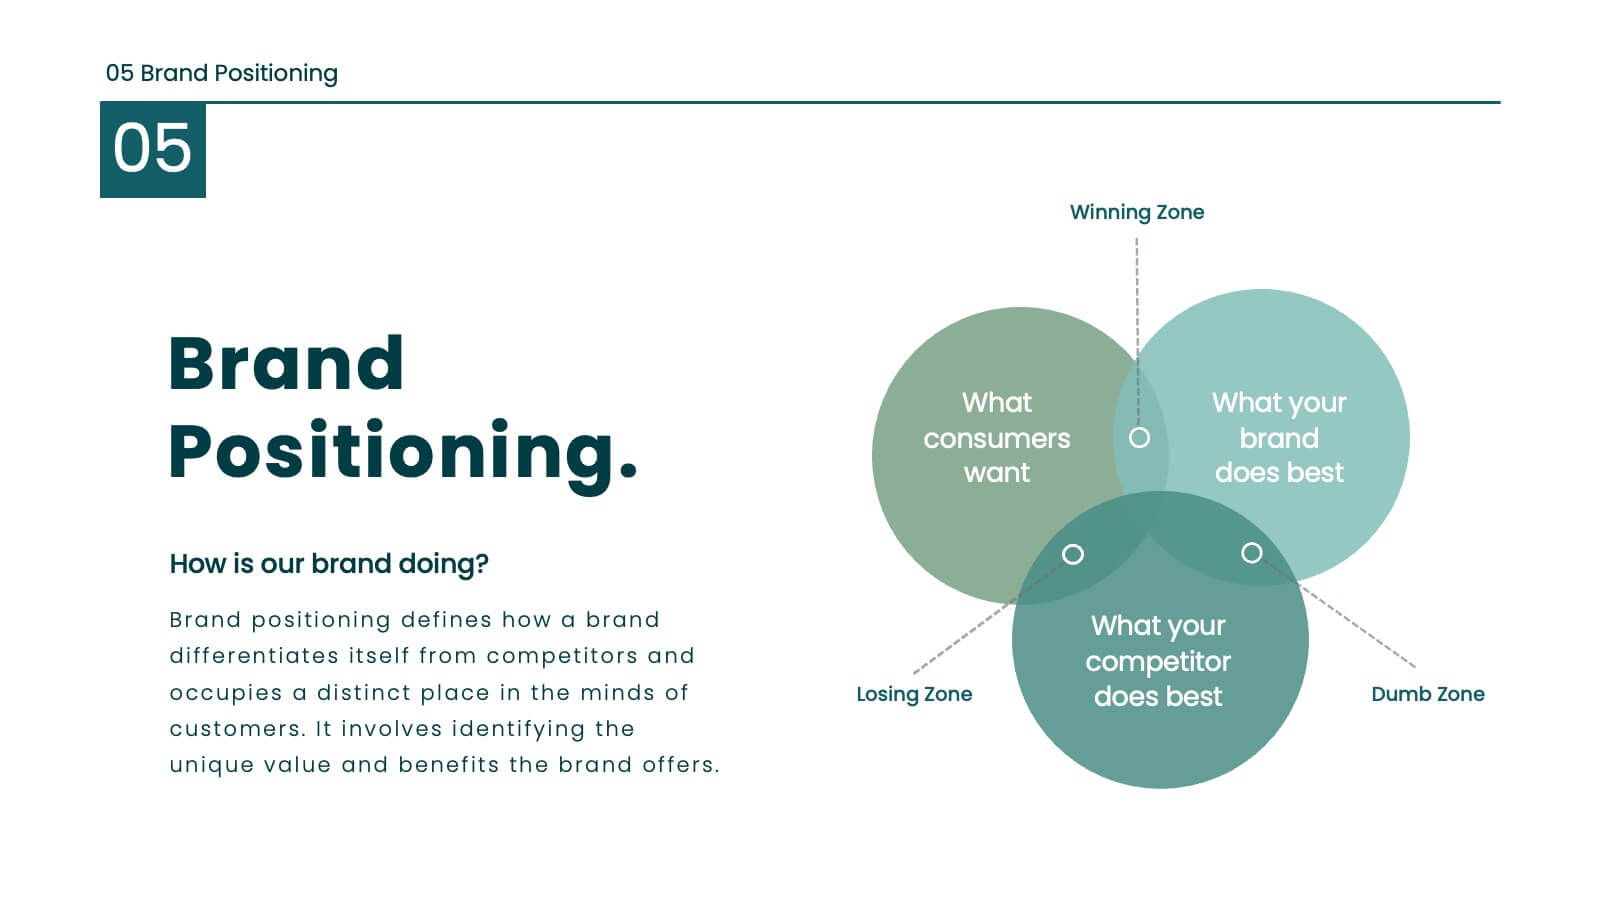
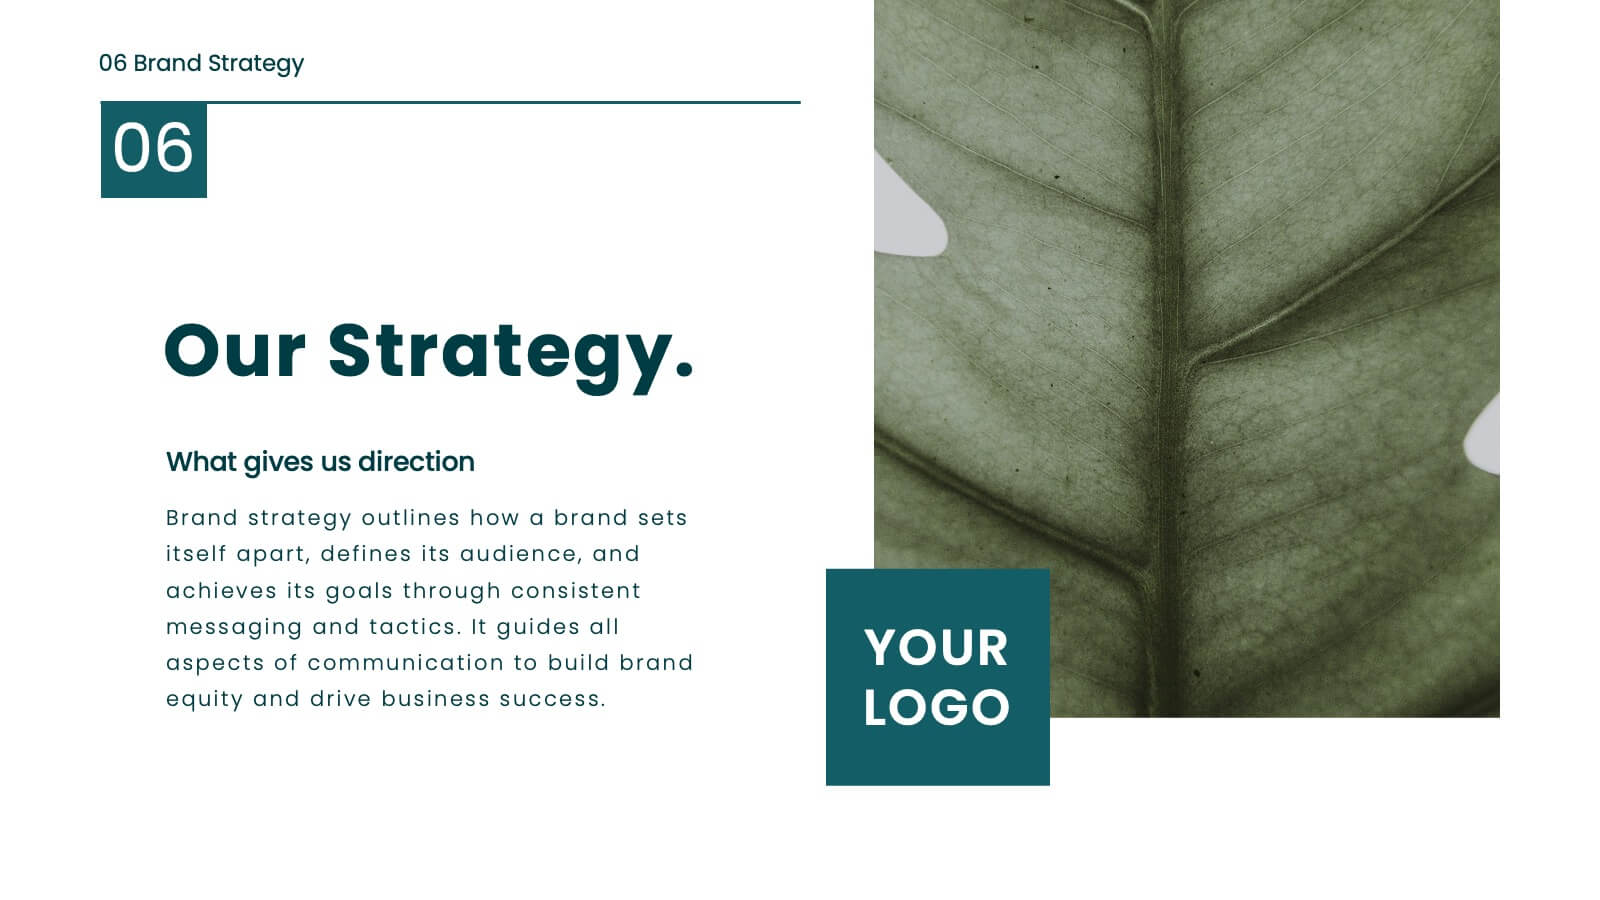
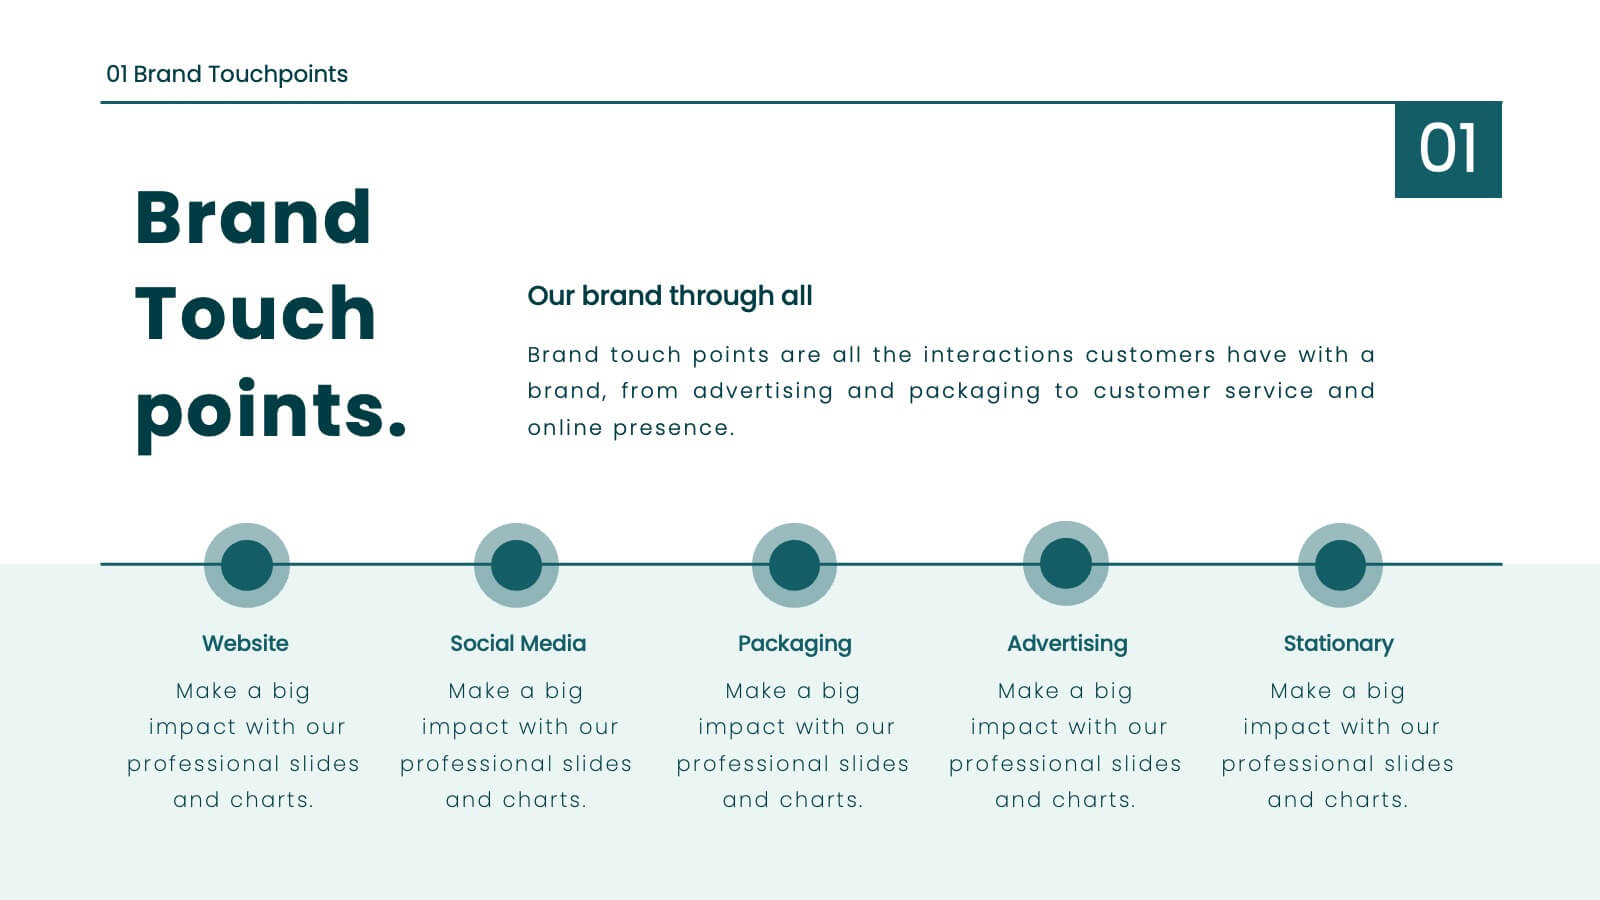
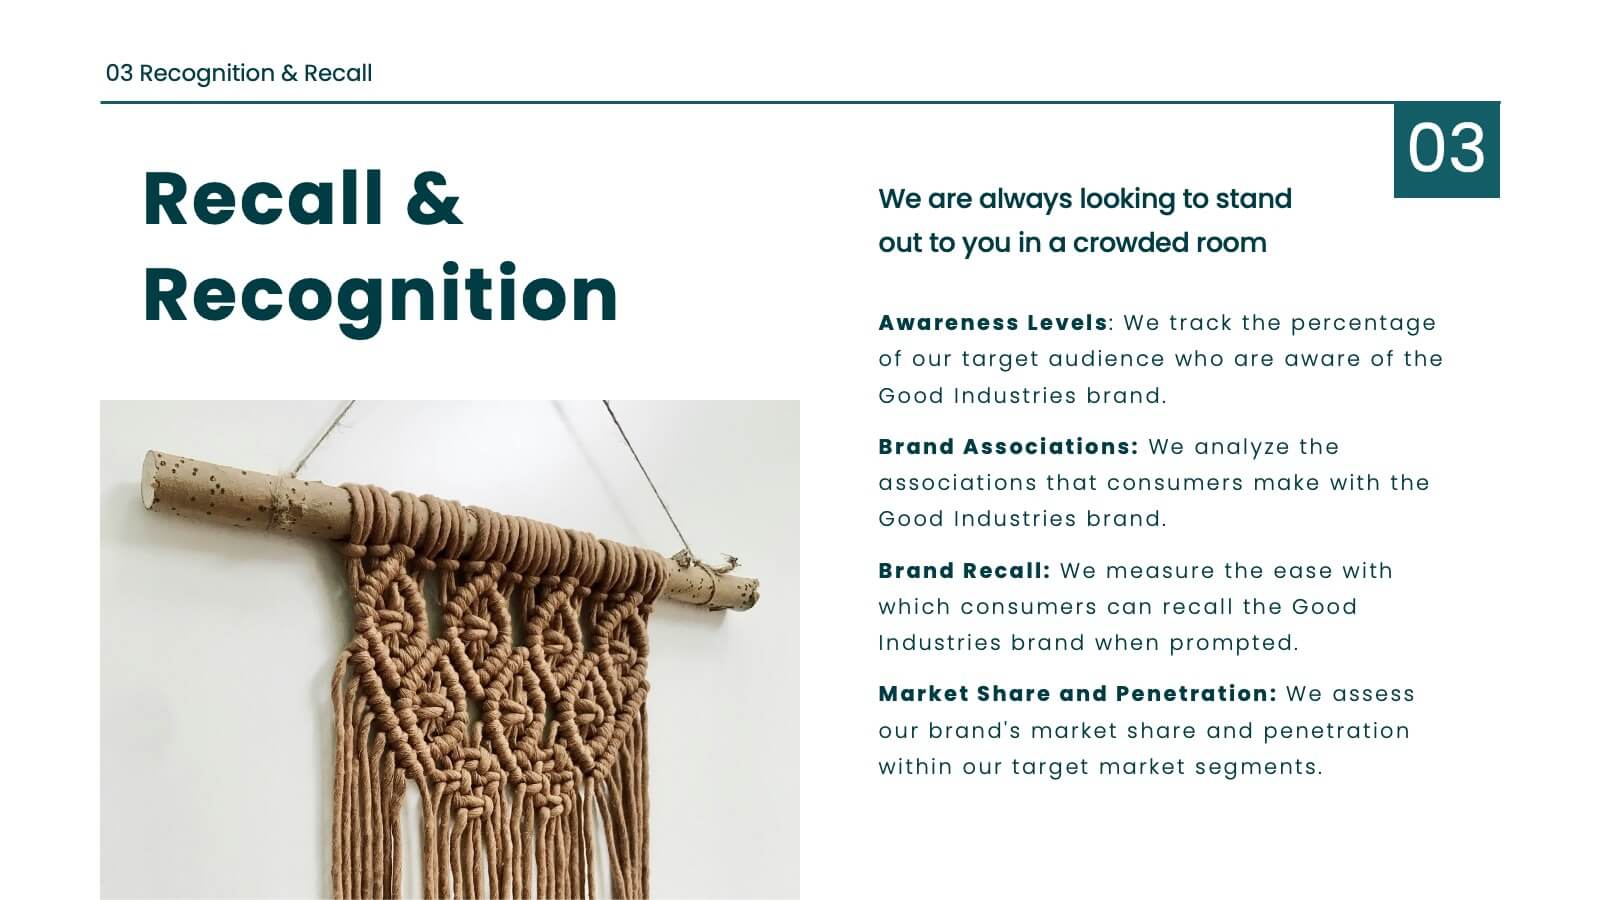
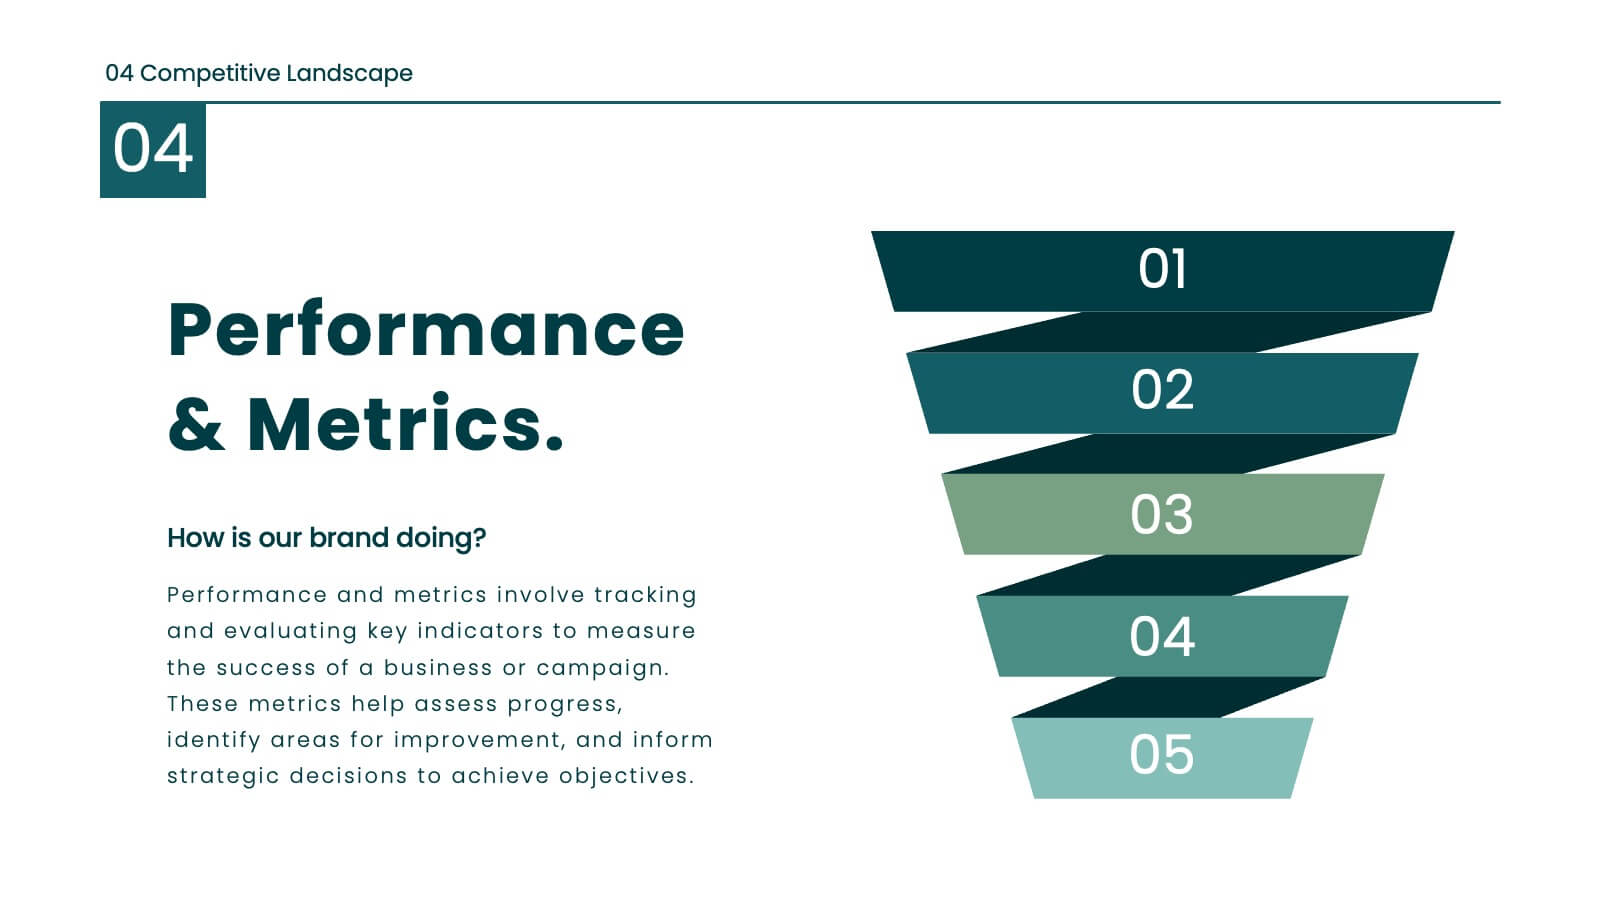
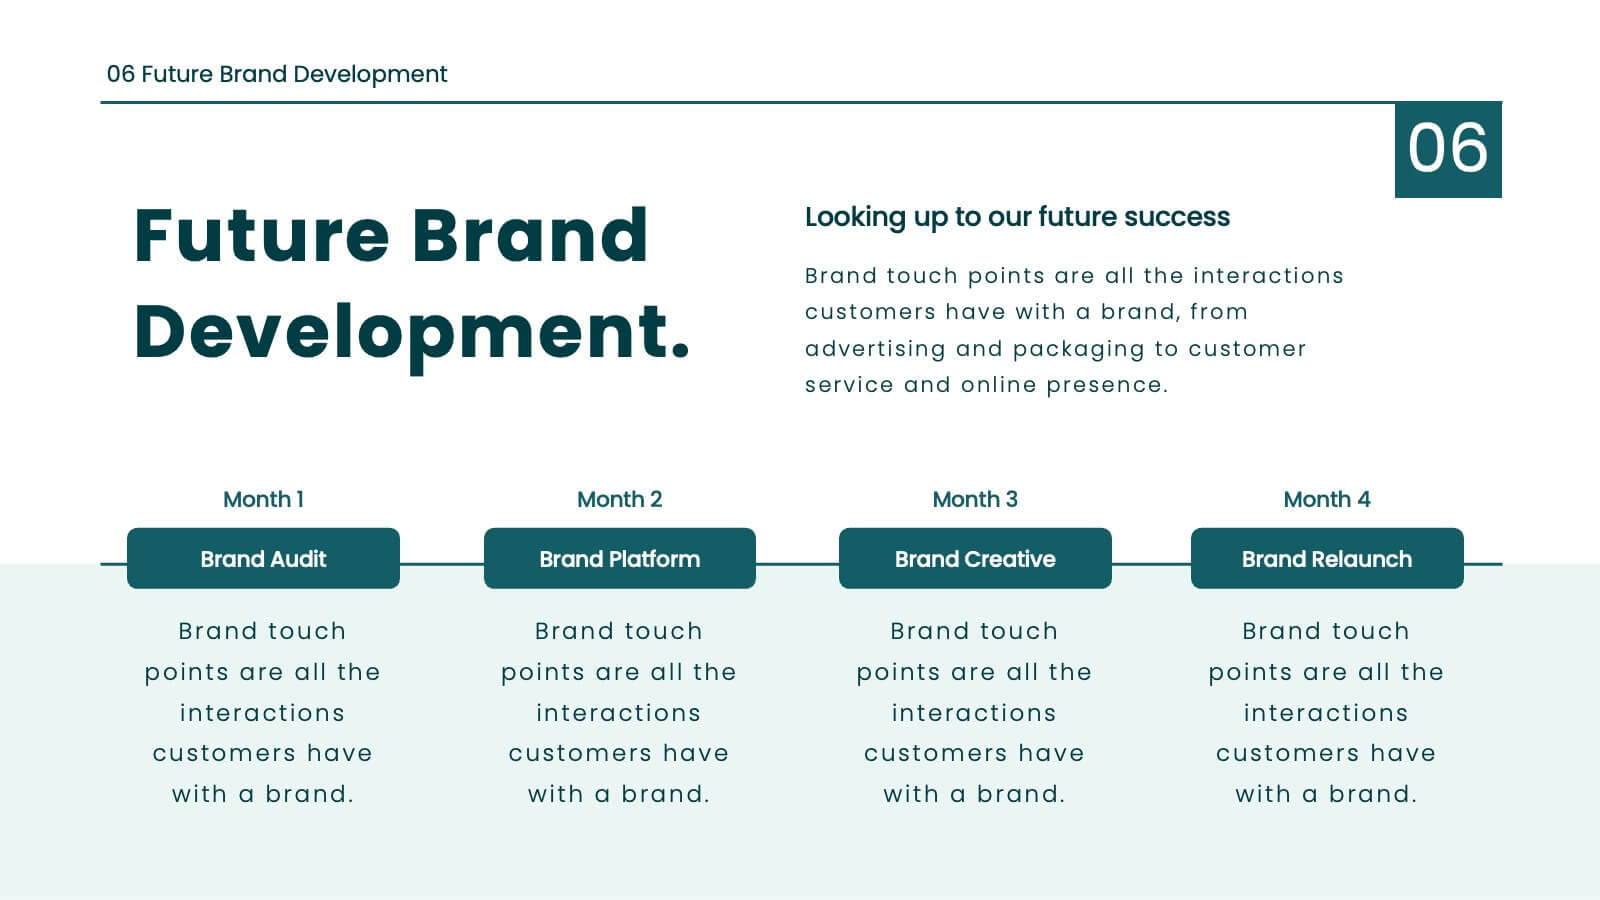
Juno Brand Guidelines Proposal Presentation
Define your brand's identity with this comprehensive, stylish presentation template. Perfect for detailing brand guidelines, vision, mission, and market analysis, it features a clean design with a professional layout. Highlight key elements like color palettes, typography, and unique selling propositions to ensure consistency and clarity. Compatible with PowerPoint, Keynote, and Google Slides, it’s ideal for any platform.


7 slides
Law and Compliance Presentation
Bring order and precision to your reports with this modern, structured layout designed to simplify complex regulations and policies. Perfect for presenting legal processes, compliance updates, or governance strategies, it blends professionalism with clarity. Fully compatible with PowerPoint, Keynote, and Google Slides for seamless editing and presentation flexibility.


5 slides
End-to-End Process Flow Framework Presentation
Visualize your operations from start to finish with the End-to-End Process Flow Framework Presentation. This clean, arrow-based layout is perfect for outlining workflows, project stages, or business processes step by step. Fully customizable in Canva, PowerPoint, and Google Slides to suit any team or strategic need.


26 slides
Solar Energy Company Profile Presentation
Step into the radiant world of solar energy, where the sun’s power promises a greener tomorrow. This playful, vibrant template, painted in refreshing shades of green and light tan yellow, encapsulates the joy and promise of renewable energy. Decked with sun-kissed graphics, spirited icons, and illuminating image placeholders, it brings the power of solar to the forefront. Effortlessly adaptable to Powerpoint, Keynote, or Google Slides. A ray of sunshine for green startups, environmental educators, energy consultants, or anyone eager to spread the word about solar solutions. Illuminate your ideas; let the power of the sun shine through.


4 slides
Executive Summary Business Presentation
Summarize key business insights effectively with this executive summary template! Designed to present an overview of your strategy, problem statement, solutions, and conclusions in a structured format, this layout ensures clarity and impact. Ideal for reports, proposals, and business plans. Fully customizable and compatible with PowerPoint, Keynote, and Google Slides.


4 slides
Modern Digital Security Trends Presentation
Stay ahead in the digital age with this sleek and informative template designed to showcase emerging technologies, cybersecurity updates, and online protection insights. Its clean, modern layout makes complex information easy to digest. Fully compatible with PowerPoint, Keynote, and Google Slides for seamless customization and professional presentations.


7 slides
Bowtie Strategy Mapping Presentation
Turn your strategies into a clear visual roadmap with a bold, connected flow that highlights every stage of your process. This presentation helps you organize goals, actions, and outcomes in a structured, engaging layout. Fully editable and compatible with PowerPoint, Keynote, and Google Slides for seamless customization.


6 slides
Alphabet Infographic and Typography Layout Presentation
Showcase key information with visual flair using this Alphabet Infographic and Typography Layout. The bold letter "A" is constructed from geometric shapes, each linked to editable text areas—ideal for presenting 6 grouped ideas or segmented data. Fully compatible with PowerPoint, Canva, and Google Slides. Perfect for modern, clean presentations.
8 slides
Creative Alphabet Visual Reference Presentation
This creative presentation uses a bold A–B–C visual structure to highlight key points in a clean, modern layout. Ideal for overviews, comparisons, or step-by-step frameworks. Fully customizable in Canva, it balances design and clarity—perfect for business strategies, education, or visual storytelling with strong alphabetical cues and icon integration.


3 slides
Business Report Summary Slides Presentation
Kick off your report with a slide that feels clean, modern, and effortlessly clear. This presentation helps you summarize key insights, highlight performance updates, and present essential findings in a structured, visual format. It’s ideal for monthly reviews, strategy reports, and stakeholder updates. Fully compatible with PowerPoint, Keynote, and Google Slides.


5 slides
Business Model Canvas and Strategy Presentation
Visualize your entire business model in one clean, structured slide. This presentation template breaks down key areas—Partners, Activities, Value Propositions, Customers, Channels, Costs, and Revenue—into a color-coded layout for strategic clarity. Perfect for startups, consultants, or internal strategy teams. Fully editable in PowerPoint, Keynote, and Google Slides.


19 slides
Dynamo Product Roadmap Presentation
Introduce your product roadmap with this professional template! Showcase customer pain points, demonstrate how your product solves problems, and provide a detailed product overview. Highlight your competitive analysis, marketing and sales strategy, and distribution channels. Perfect for presenting support information and engaging in Q&A sessions. Compatible with PowerPoint, Keynote, and Google Slides for versatile presentations.