


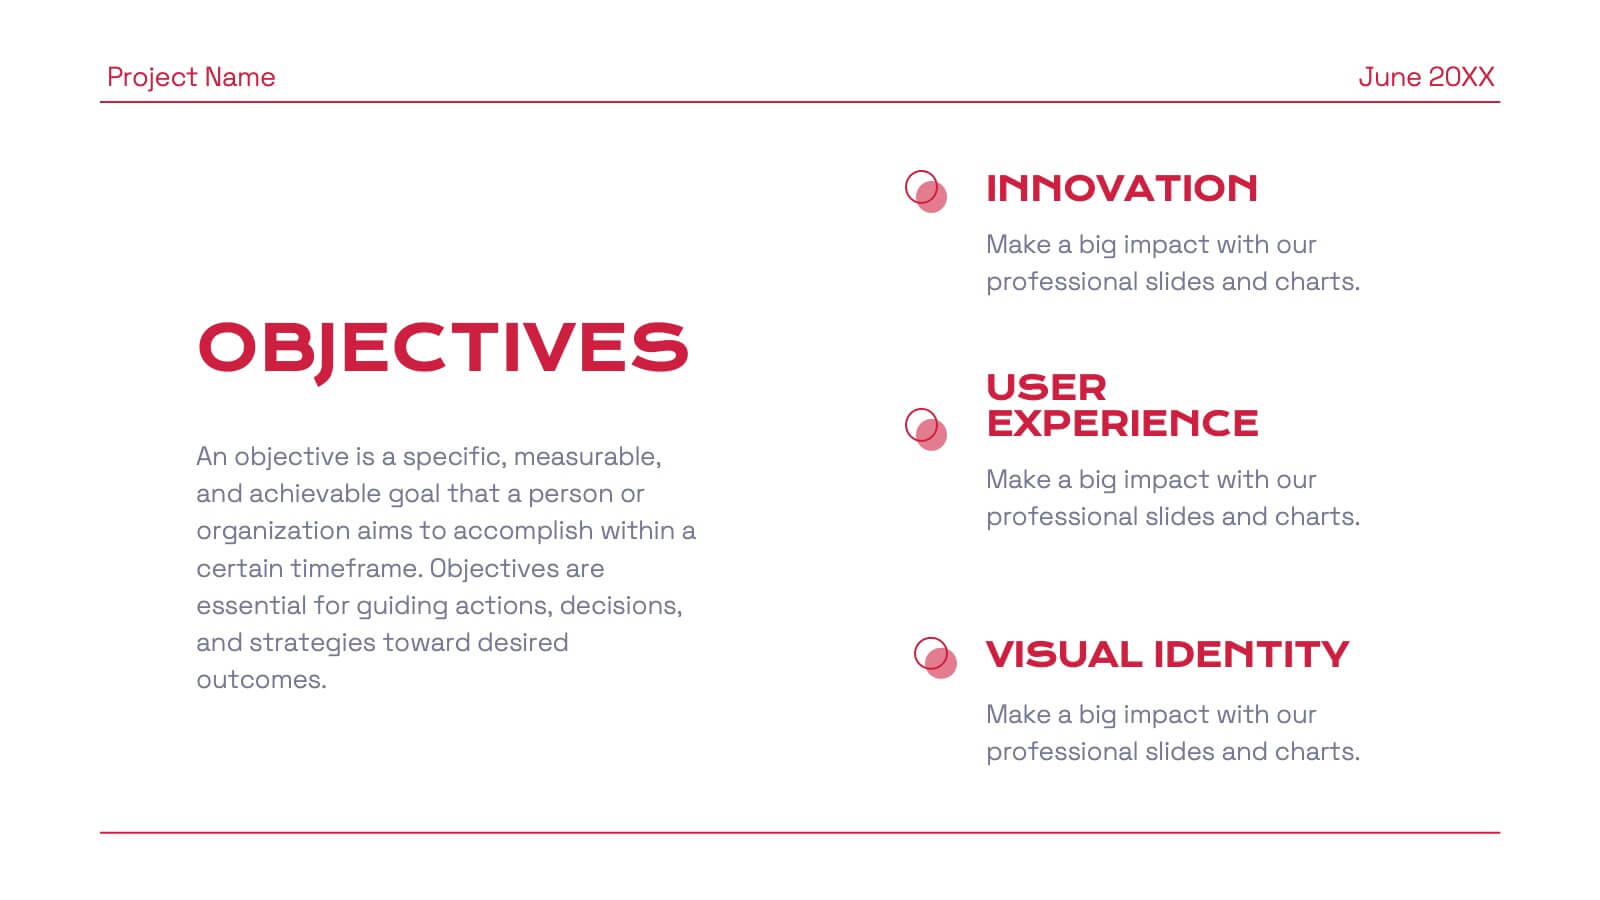
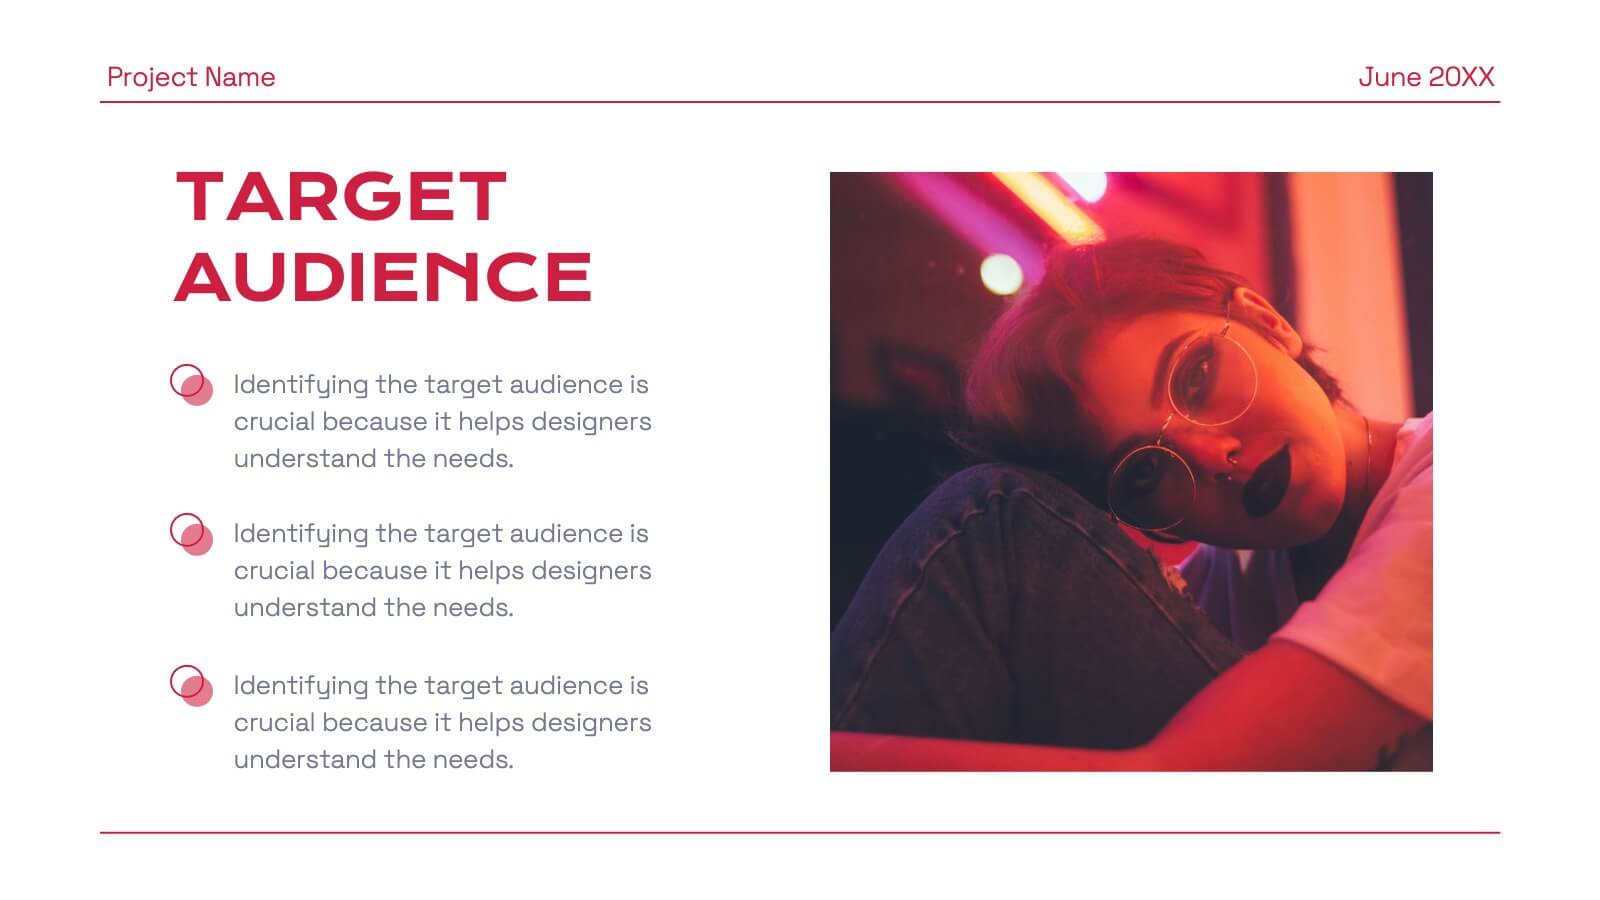
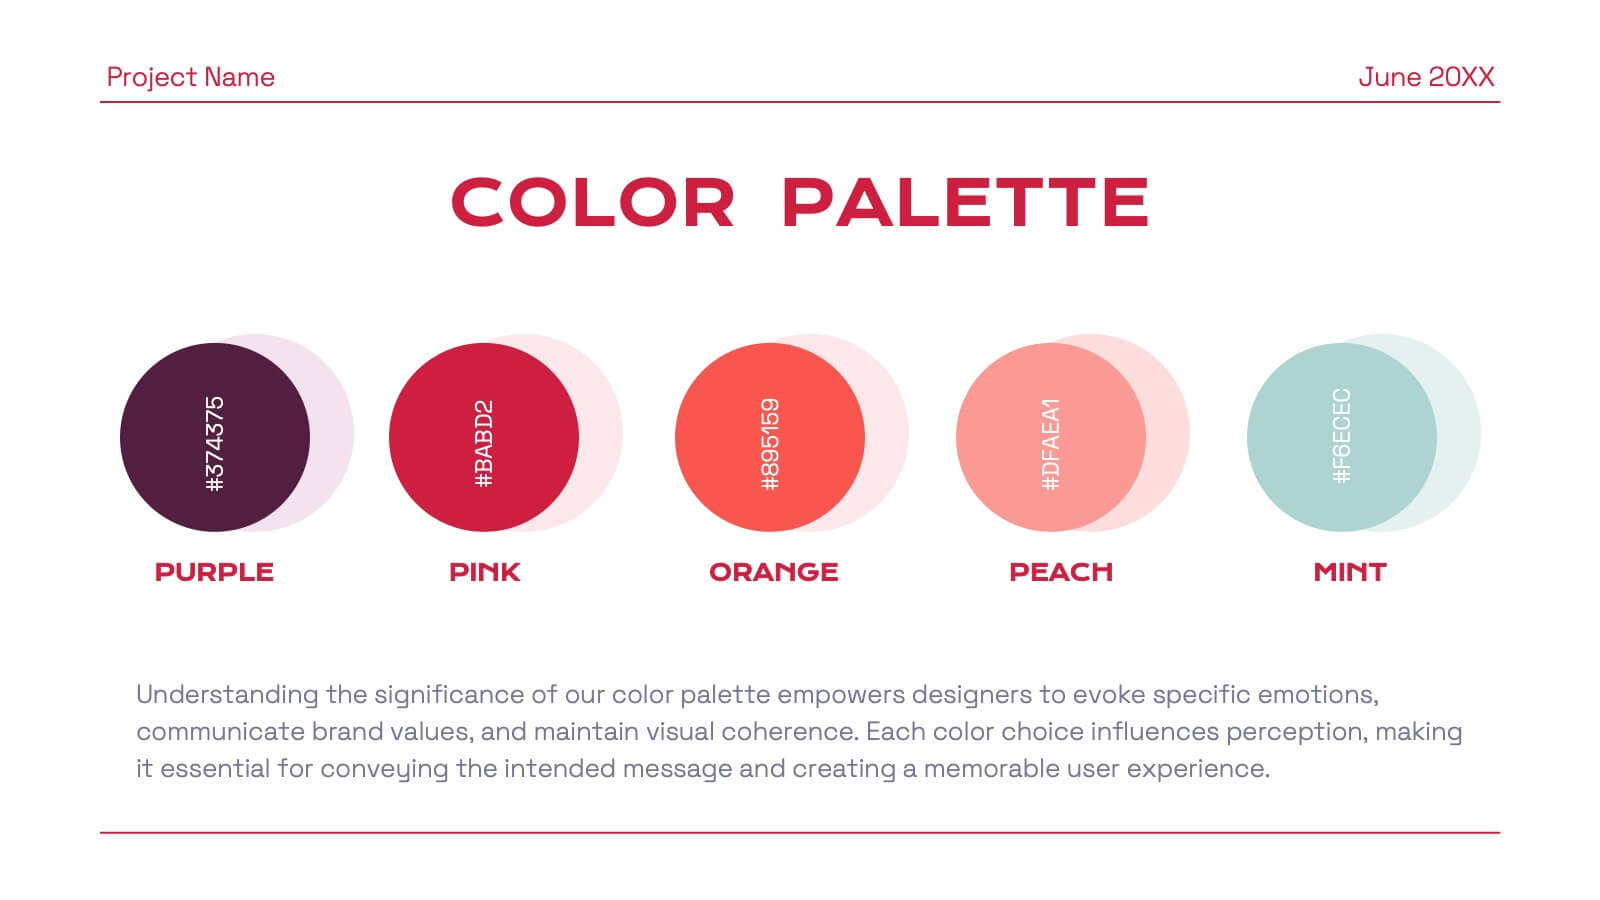
Features
- 26 Unique slides
- Fully editable and easy to edit in Microsoft Powerpoint, Keynote and Google Slides
- 16:9 widescreen layout
- Clean and professional designs
- Export to JPG, PDF or send by email


Do you have any questions?
Recommend


4 slides
Blockchain and Cryptocurrency Market Analysis Presentation
Present complex blockchain structures and crypto market layers with clarity using the Blockchain and Cryptocurrency Market Analysis presentation template. Featuring a stacked cylinder diagram with four interactive data points, this layout is ideal for breaking down transaction flows, network layers, or decentralized finance (DeFi) ecosystems. Each title block offers space for concise key insights. Best suited for blockchain consultants, fintech startups, and crypto analysts. Fully compatible with PowerPoint, Keynote, and Google Slides.


6 slides
Leadership Vision and Strategy Presentation
Present your organization’s goals with this leadership vision and strategy template, designed with a hierarchy graphic to represent team structure and growth. Perfect for strategic planning, leadership meetings, and corporate presentations. Fully editable in Canva, PowerPoint, or Google Slides, making it easy to customize colors, text, and layout to fit your brand.


26 slides
Arana Presentation Template
Arana is a minimal and stylish template to create stunning presentations. This template is perfect for training your business staff or team on how to use various services or products. It's easy to use, resulting in high quality presentations that look great to your clients or customers. Its slide designs can be used with each other to make more elaborate presentations complete with charts, images and text boxes. Arana simple yet stylish design makes it easy for anyone to use. With the large amount of information included, your presentation will look lighter, appealing, and easy to understand.


26 slides
Construction Engineering Dark Presentation
Elevate your project narratives with our construction engineering dark presentation template, tailored specifically for industry professionals who desire clarity and precision. This template, steeped in dark shades complemented by stark orange and green accents, offers a sophisticated canvas for your plans. It's an essential asset for construction engineers and contractors seeking to outline project scopes, or innovative engineering solutions. Compatible with Powerpoint, Keynote, and Google Slides. Included are purposeful graphics and technical icons, all arranged to underscore your presentation's professionalism and comprehensive nature.


6 slides
Business Overview Company Profile Presentation
Present Your Business with a Dynamic Overview! The Business Overview Company Profile template features a modern circular flow design, perfect for showcasing company insights, key strategies, and core values. With six structured content sections, this layout helps you present information in a clear and engaging way. Whether you're introducing your business or outlining corporate initiatives, this fully editable template in PowerPoint, Keynote, and Google Slides ensures a polished and professional presentation for any industry.


7 slides
Financial Health and Budget Planning Presentation
Present your budgeting journey with clarity using the Financial Health and Budget Planning Presentation. This slide features a horizontal flow diagram with six editable steps—perfect for outlining savings strategies, expense tracking, or financial goals. Each icon-based block helps highlight key actions. Fully customizable in PowerPoint, Canva, and Google Slides.


6 slides
Business Strategy Pyramid Presentation
Outline your strategic priorities with clarity using the Business Strategy Pyramid Presentation. This template features a five-step 3D pyramid that highlights key business goals, initiatives, or stages. Each layer includes icons and numbered sections for easy interpretation. Ideal for strategy meetings, executive briefings, and growth plans. Fully editable in PowerPoint, Keynote, and Google Slides.


6 slides
Design Thinking 5-Stage Model Presentation
Turn creativity into structured innovation with a clean, circular layout that guides your audience through each phase of problem-solving and ideation. Ideal for workshops, strategy sessions, or innovation pitches, this presentation makes complex processes easy to follow. Fully compatible with PowerPoint, Keynote, and Google Slides for seamless editing.


5 slides
Group Dynamics and Work Roles Presentation
Visualize team roles and responsibilities clearly with the Group Dynamics and Work Roles Presentation. This horizontal timeline layout highlights individual contributions and their position in the workflow, making it ideal for team structure, leadership roles, or project stages. Fully editable in Canva, PowerPoint, or Google Slides for smooth collaboration.


22 slides
Crystal Business Plan Presentation
This business plan template is ideal for presenting strategies, conference overviews, and session details. With slides for keynote speakers, breakout sessions, and networking breaks, it offers a dynamic and professional layout. Compatible with PowerPoint, Keynote, and Google Slides, it ensures a clear and organized flow for any business presentation.


26 slides
Building Community Networks Presentation
Strengthen connections and foster collaboration with this engaging presentation on building community networks. Covering key topics like social engagement, resource sharing, grassroots initiatives, and digital networking, this template helps highlight strategies for creating meaningful relationships. Fully customizable and compatible with PowerPoint, Keynote, and Google Slides for a seamless and impactful presentation experience.


26 slides
Corporate Finance Presentation
The "Corporate Finance" template is your financial compass for presentations that require a mix of precision and clarity. Tailored for use on PowerPoint, Keynote, and Google Slides, it is perfect for demystifying the world of corporate finance. Commence with the "Wealth strategies designed for your unique journey" slide to capture the tailored approach of your financial services. The "Table of Contents" neatly outlines the topics such as investment strategies, risk management, and financial forecasting. Introduce the minds behind the numbers with "Meet Our CEO" and "Meet Our Team" slides. Utilize the "Three Option Slide" to present different financial models, and the "Chart Slide" to depict financial performance. The "Bringing a new perception of investing" slide can redefine investment approaches, while "Feel good with Earning, Feel free to call us." invites engagement. Every slide offers the opportunity to infuse data-driven insights with compelling visuals, ensuring that your "Corporate Finance" presentation not only informs but also impresses your corporate audience.


5 slides
Professional Relationship Network Presentation
Map out key business connections using this Professional Relationship Network template. Ideal for showcasing client relationships, internal team dynamics, or communication hierarchies. This clean, modern design helps clarify roles and links across stakeholders. Fully editable and compatible with PowerPoint, Keynote, and Google Slides for flexible use in any setting.


5 slides
Visual Gap Analysis Between Goals and Results Presentation
Hit the bullseye by clearly showing the gap between what was planned and what was achieved. This sleek, target-based presentation design helps visualize discrepancies between goals and results in a way that's easy to grasp and great for decision-making. Fully compatible with PowerPoint, Keynote, and Google Slides.


5 slides
Client Engagement Journey Touchpoints
Map out every stage of client interaction with the Client Engagement Journey Touchpoints Presentation. This visual slide template highlights four key customer touchpoints, with a central user icon to emphasize the client-centric approach. Ideal for showcasing brand awareness, first contact, engagement strategies, and conversion steps. Easily customizable in PowerPoint, Keynote, and Google Slides.


6 slides
Internal Communication Framework Presentation
Foster stronger collaboration with this visual internal communication framework template. Ideal for showcasing how information flows within departments, this layout helps clarify messaging channels, responsibilities, and feedback loops. Whether you're streamlining communication strategies or presenting team structures, it’s fully editable and works seamlessly with PowerPoint, Keynote, and Google Slides.
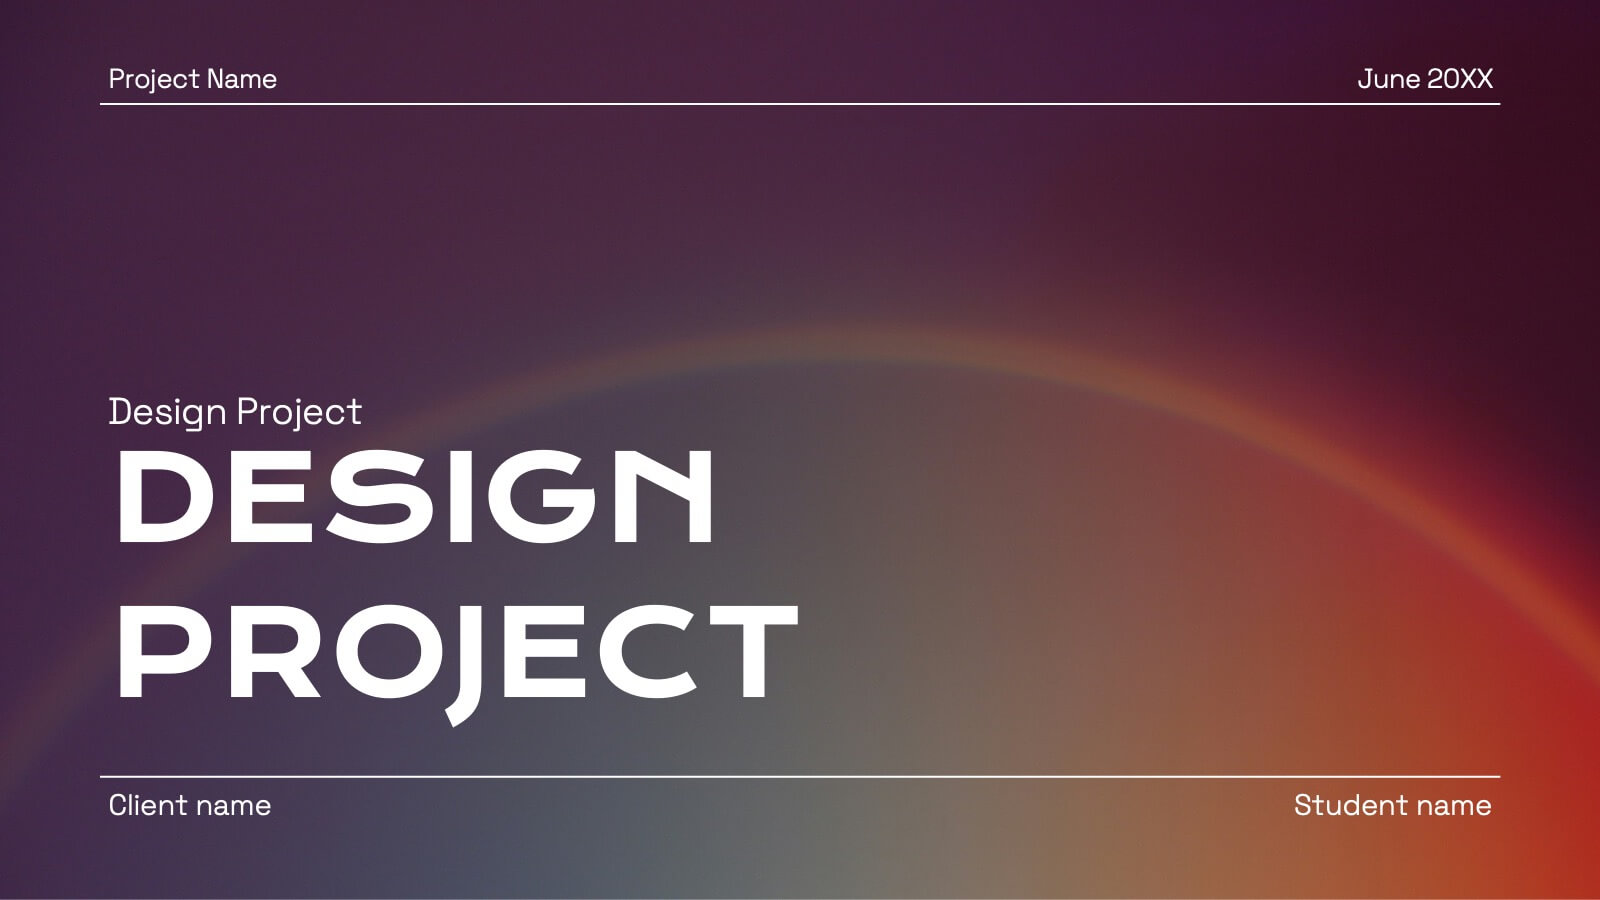
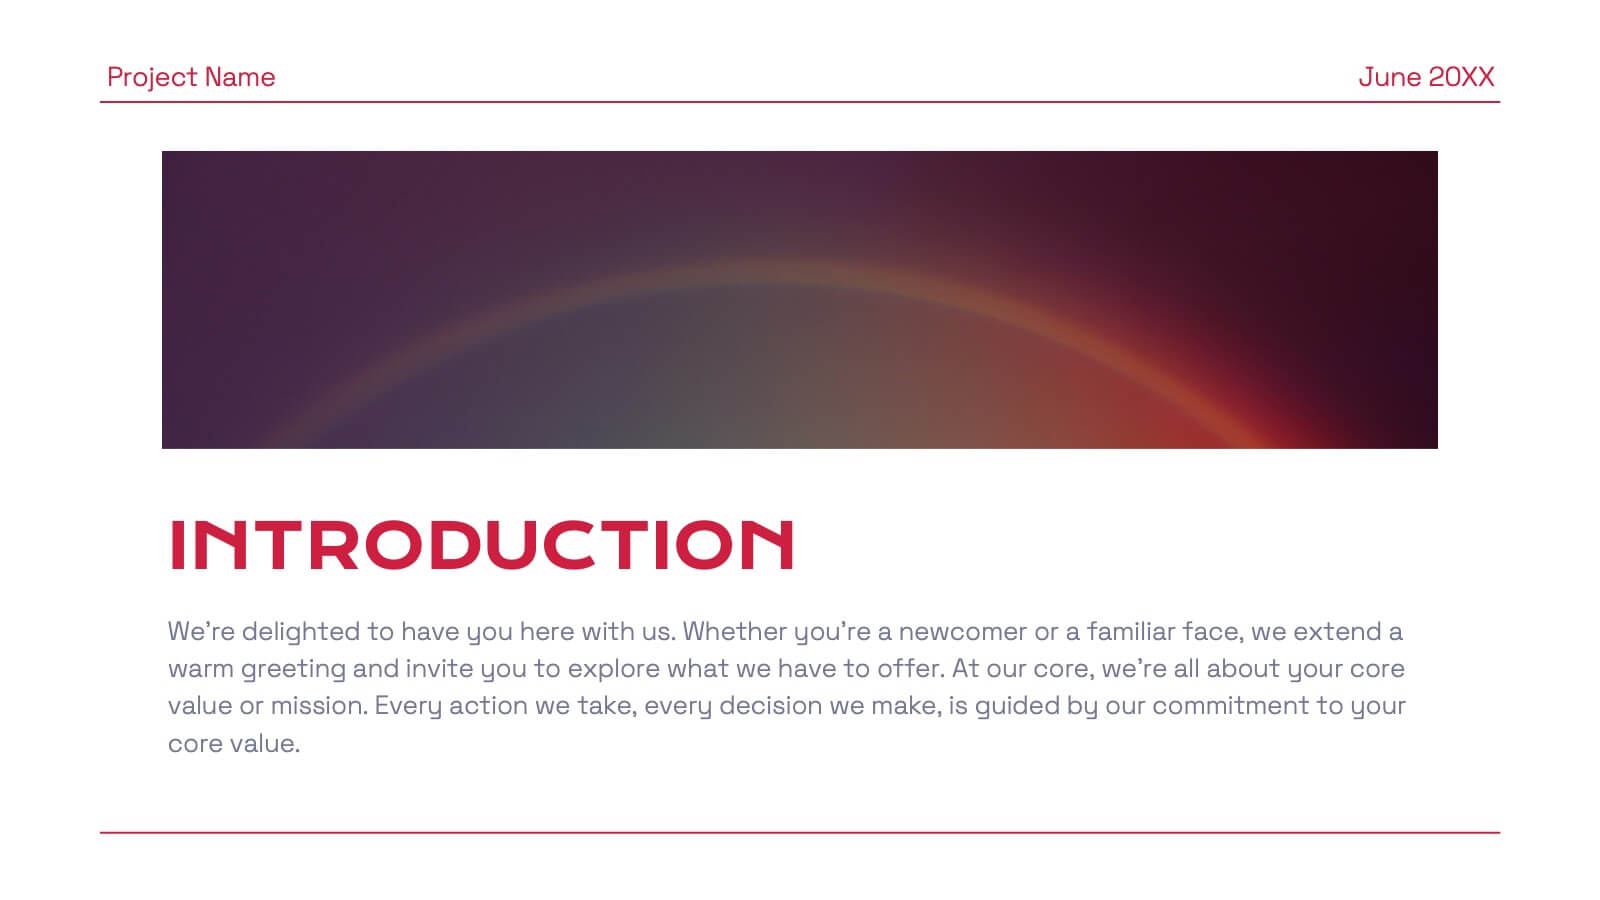
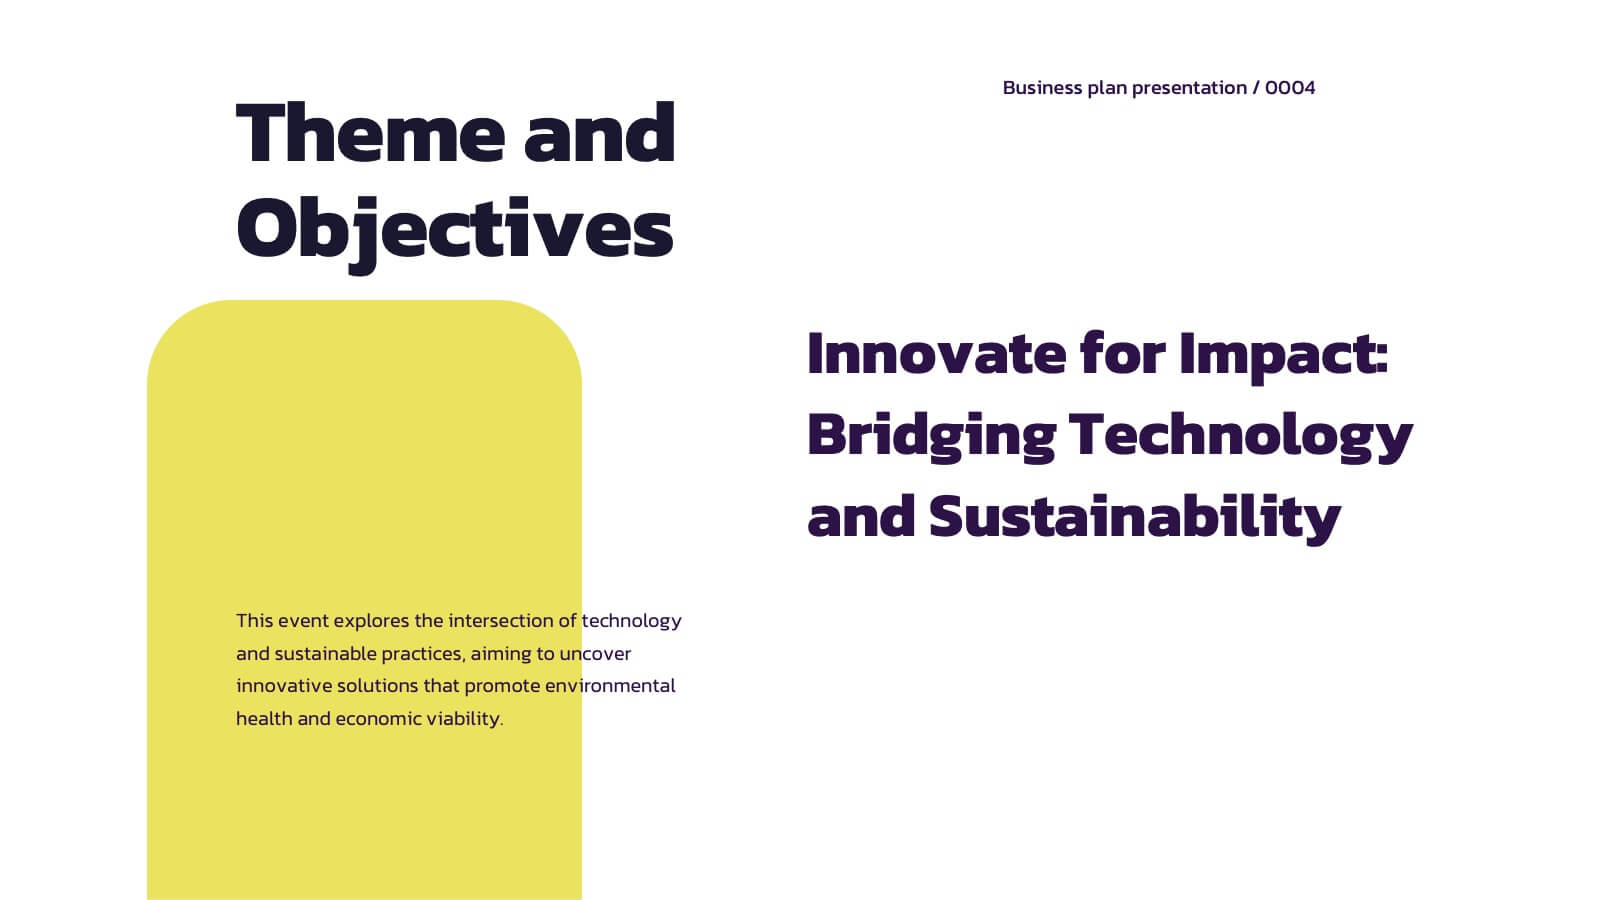
22 slides
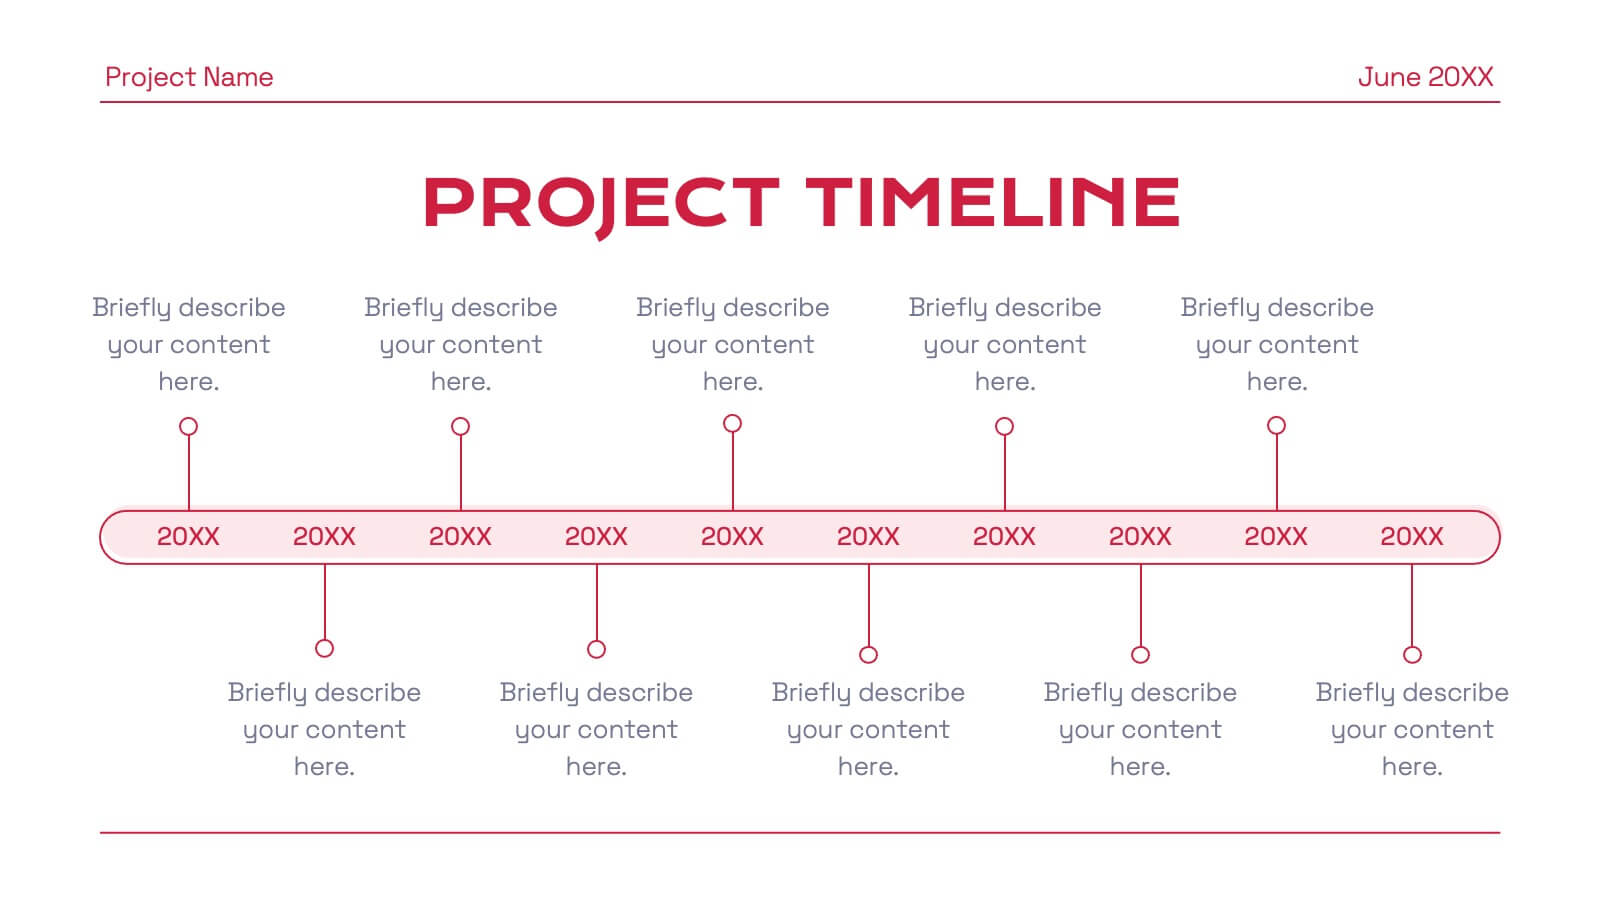
Eclipse Graphic Design Project Plan Presentation
Develop a winning marketing strategy with this dynamic template. Dive into current trends, consumer behavior, and innovative techniques. Perfect for social media, influencer marketing, and data-driven campaigns. Fully compatible with PowerPoint, Keynote, and Google Slides.