
Features
- 5 Unique slides
- Fully editable and easy to edit in Microsoft Powerpoint, Keynote and Google Slides
- 16:9 widescreen layout
- Clean and professional designs
- Export to JPG, PDF or send by email


Do you have any questions?
Recommend


6 slides
Post Office Scenes Infographics
The "Post Office Scenes" infographic template, designed for PowerPoint, Keynote, and Google Slides, is an ideal tool for postal services, logistics companies, and educational settings. This engaging template provides a detailed overview of everyday activities in a post office, making it perfect for a range of presentations. This template showcases key aspects of post office operations, including mail sorting, customer service interactions, and package handling. Its design is structured to convey the intricacies of postal services in an easy-to-understand and visually appealing manner. This makes it highly effective for training purposes, educational presentations, or explaining postal logistics in corporate environments. Adopting a professional color scheme that reflects the atmosphere of a postal service, the design is both thematic and informative. It captures the essence of a post office environment, enhancing the educational impact of the presentation. Whether used for staff training, classroom teaching, or corporate presentations, this template ensures a comprehensive and clear understanding of post office scenes and operations.


4 slides
Corporate Company Profile Overview Presentation
Present your business story with clarity and impact using this sleek company profile layout. Designed for corporate overviews, it highlights key points alongside a modern visual backdrop. Ideal for executive summaries, strategy decks, or investor briefings—fully editable in PowerPoint, Keynote, and Google Slides for effortless customization and professional results.


7 slides
Design Team Infographic
The displayed slides are specifically tailored for design teams, reflecting a strong focus on visual elements that convey creative processes and team structures. Each slide is crafted to enhance the presentation of design projects, illustrating workflows, team roles, and project milestones with a visually appealing approach. The collection utilizes a vibrant color palette and dynamic shapes to keep the viewer engaged, making these templates ideal for showcasing design projects, brainstorming sessions, and team capabilities in a clear and aesthetically pleasing manner. The templates feature various layouts including organizational charts, process diagrams, and brainstorming tools that facilitate effective communication of design concepts and strategies. They are designed to be versatile, supporting a wide range of design projects from graphic and digital design to UI/UX prototypes. This set serves as an essential tool for design teams to demonstrate their methods, track project progress, and showcase their creative solutions to clients or stakeholders, ensuring that every aspect of the design process is both understood and visually compelling.


7 slides
Annual Report Infographics Presentation Template
Annual reports are comprehensive documents designed to provide readers with information about a company's performance in the preceding year with a focus on all major aspects of its operations. They help investors, competitors and other stakeholders understand how well a business is performing. This template is designed to help users produce annual reports for their company. Annual reports provide insights into the company's direction in the preceding year. This template includes many features to make your document as professional as possible and includes various charts and graphs.


8 slides
Investment and Risk Business Case Presentation
Assess investment risks with confidence using this dynamic business case template. Designed for clear visualization, it categorizes risk levels from high to low, helping professionals analyze financial decisions effectively. Perfect for finance, business strategy, and market evaluation, this template is fully compatible with PowerPoint, Keynote, and Google Slides.


22 slides
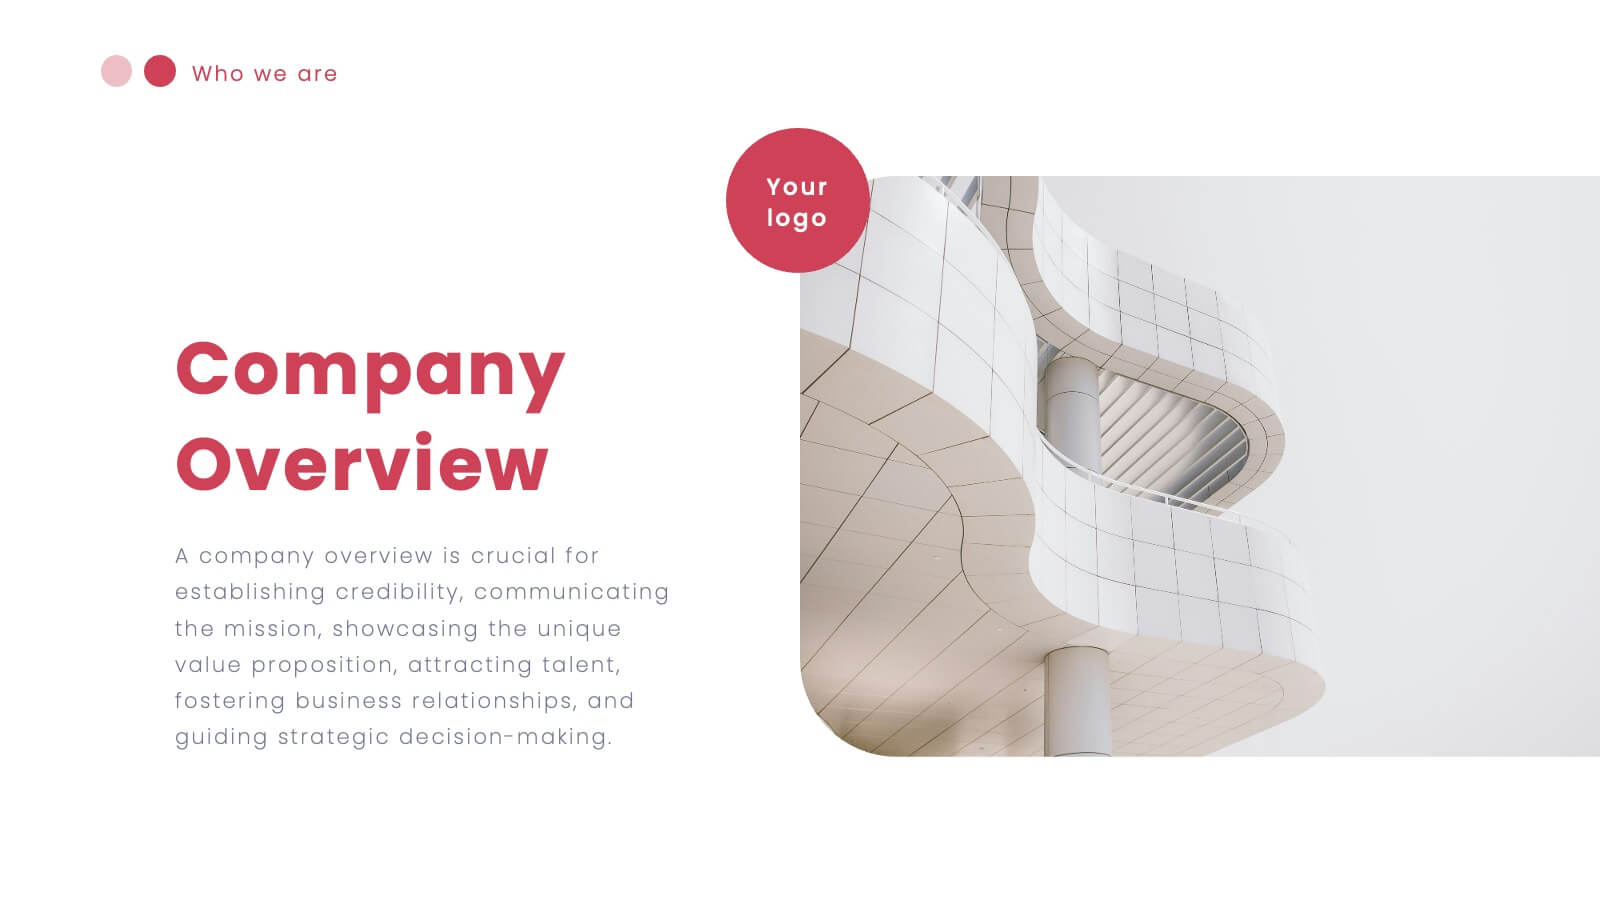
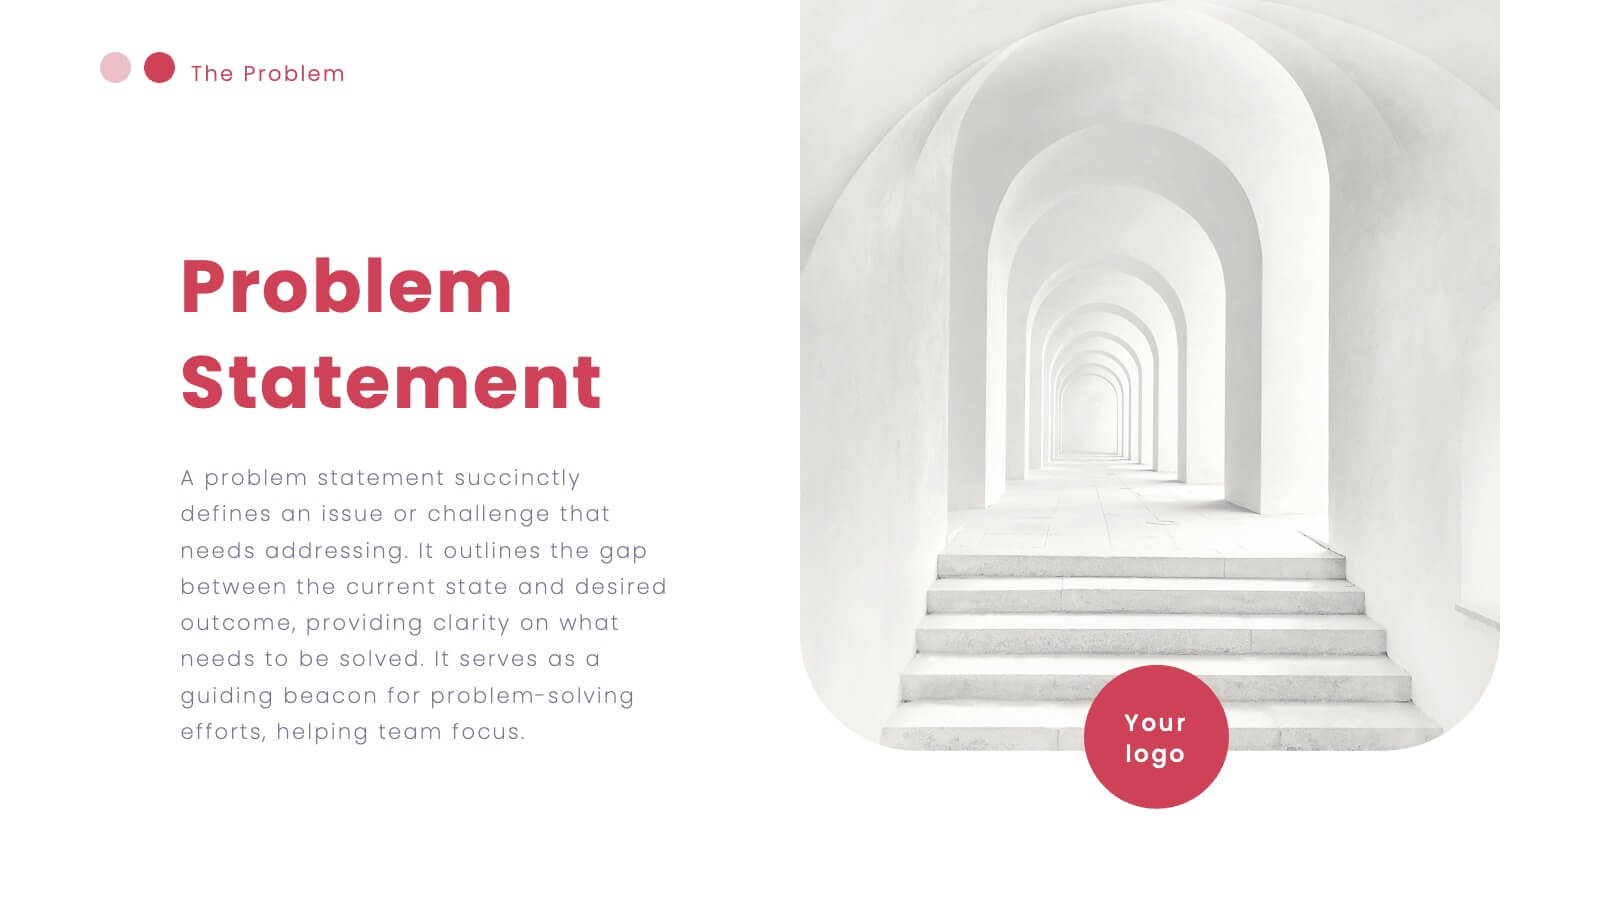
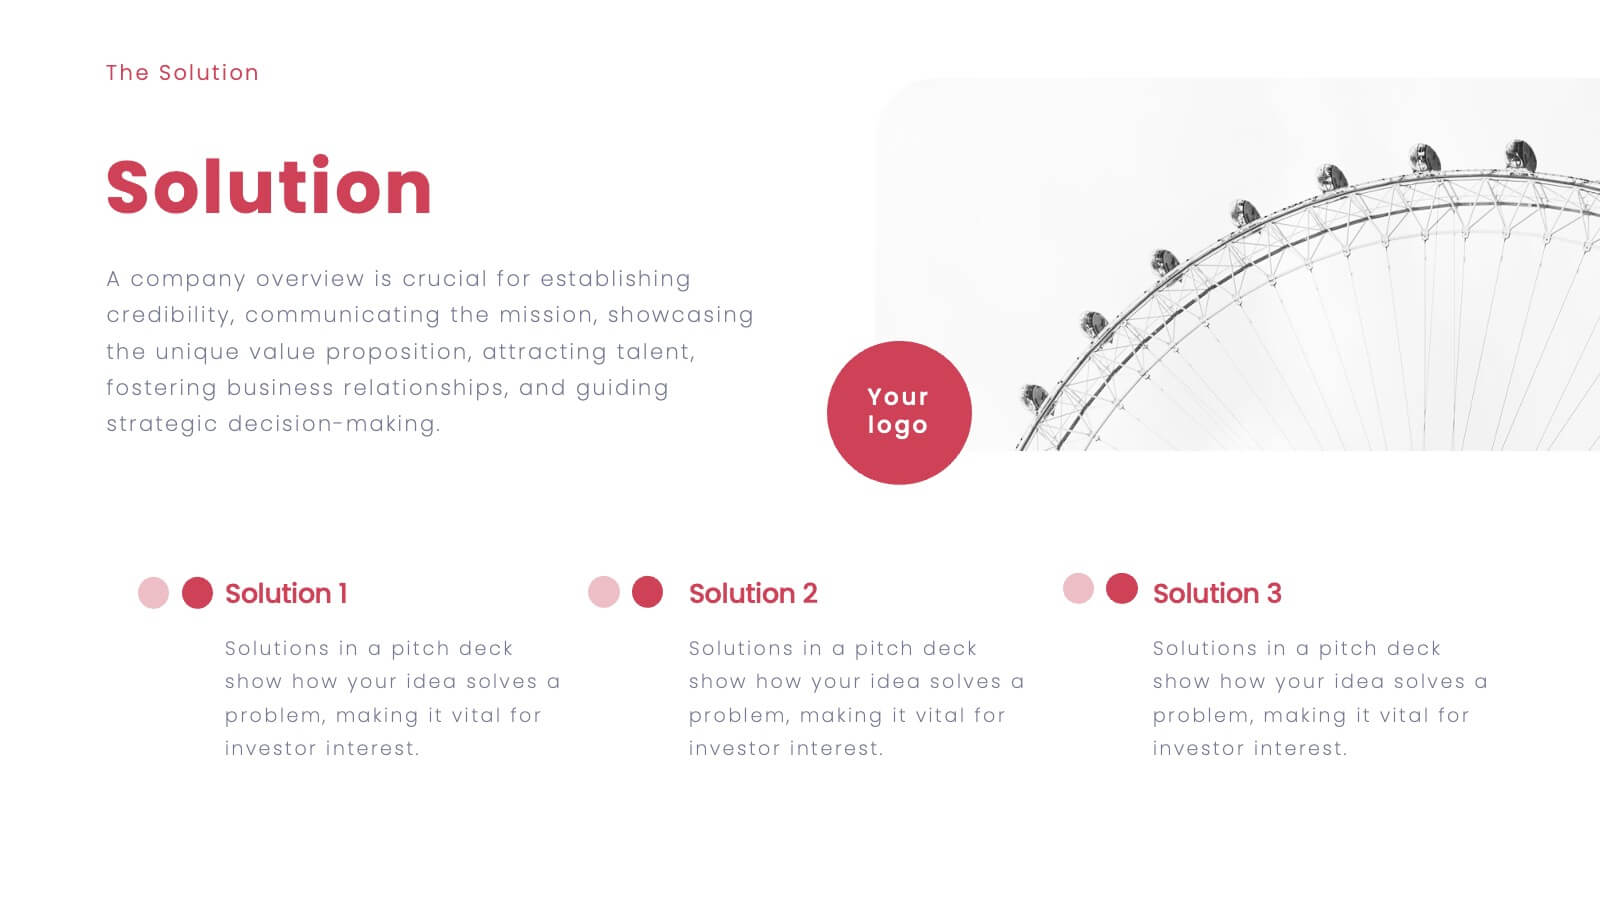
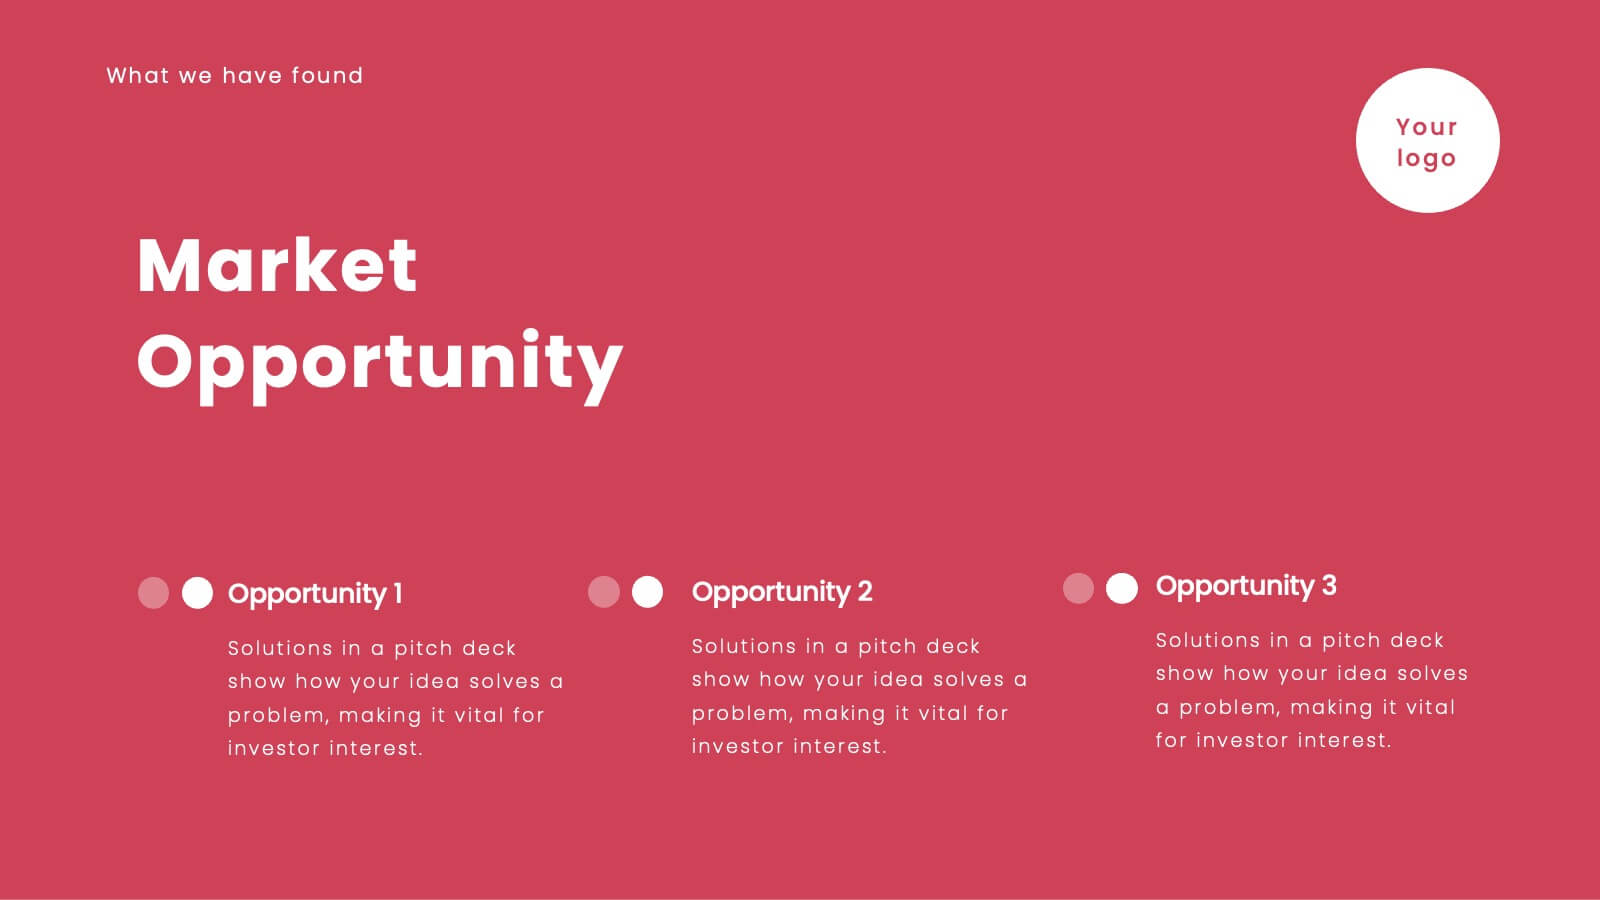
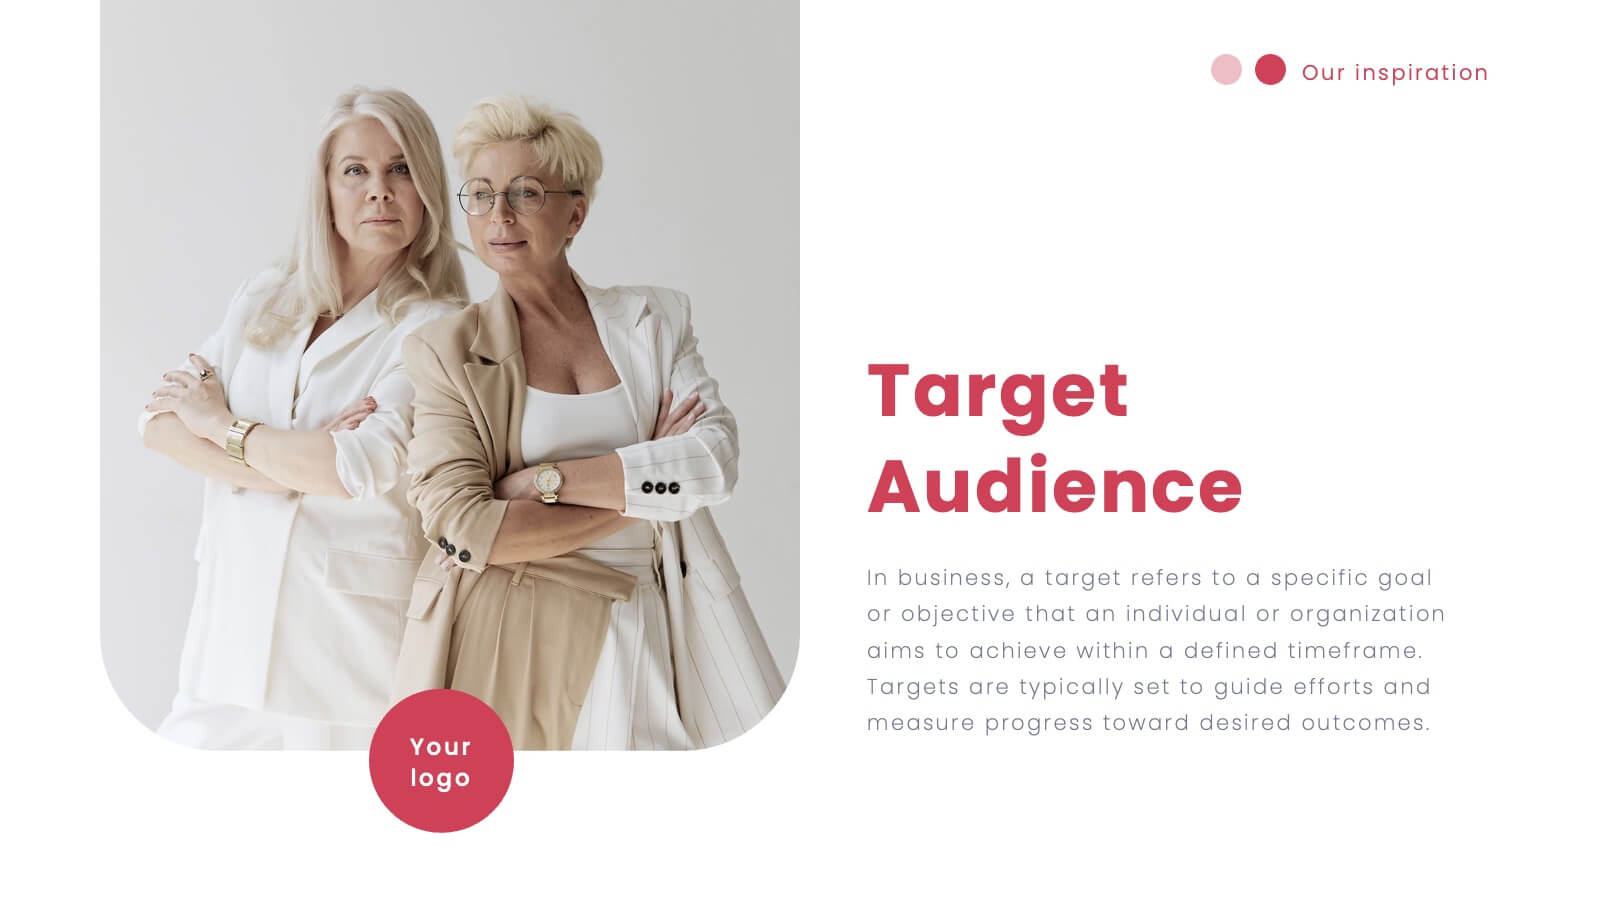
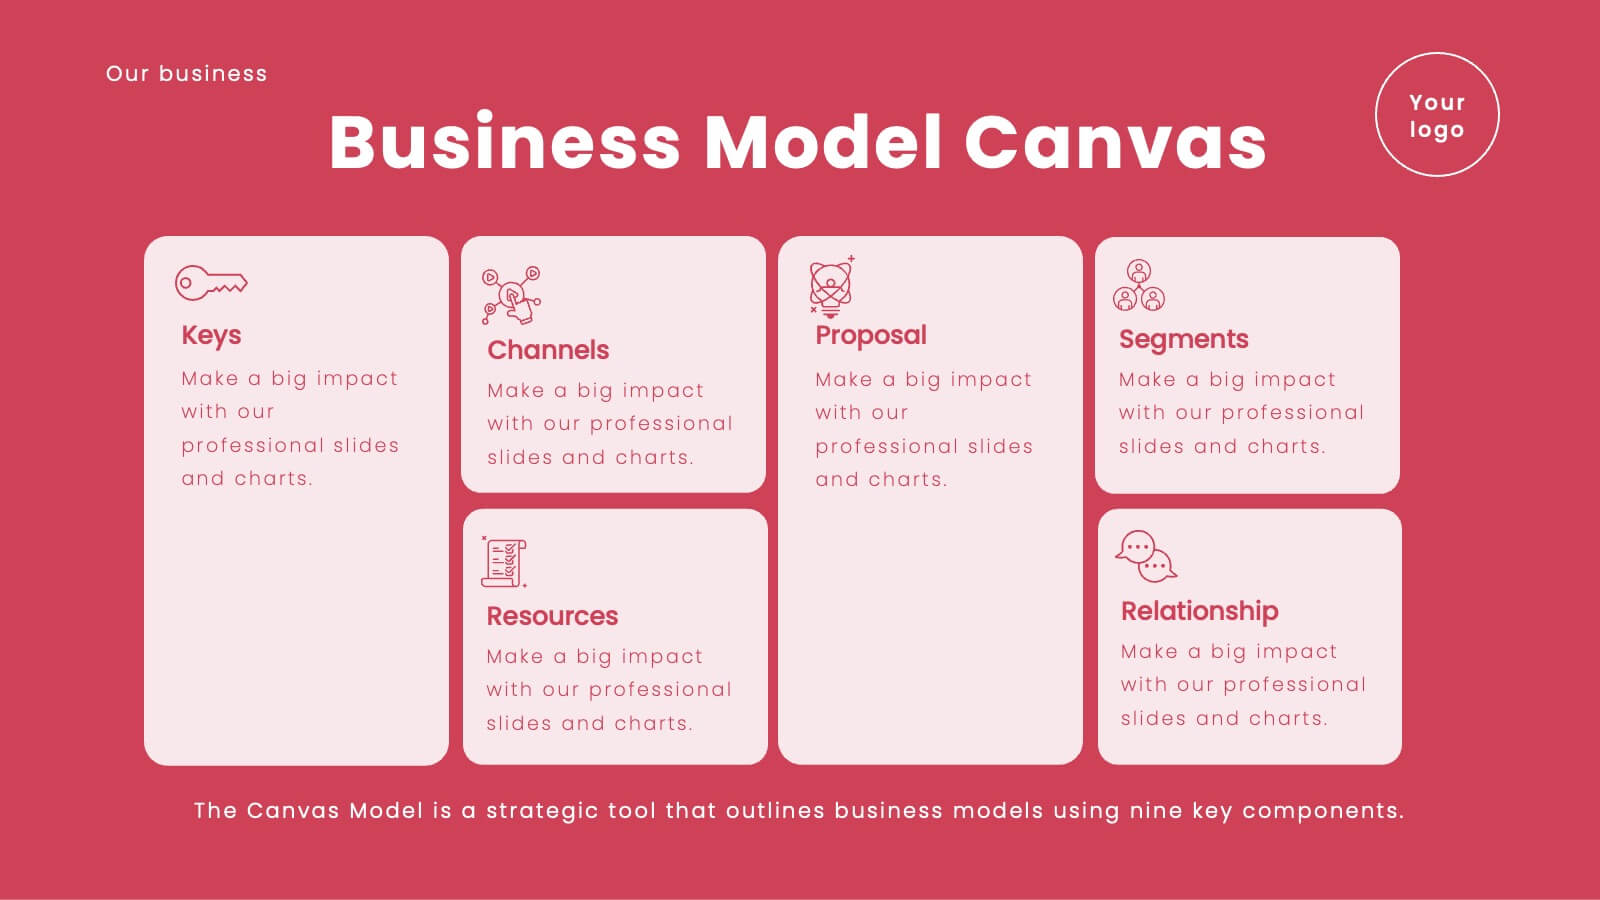
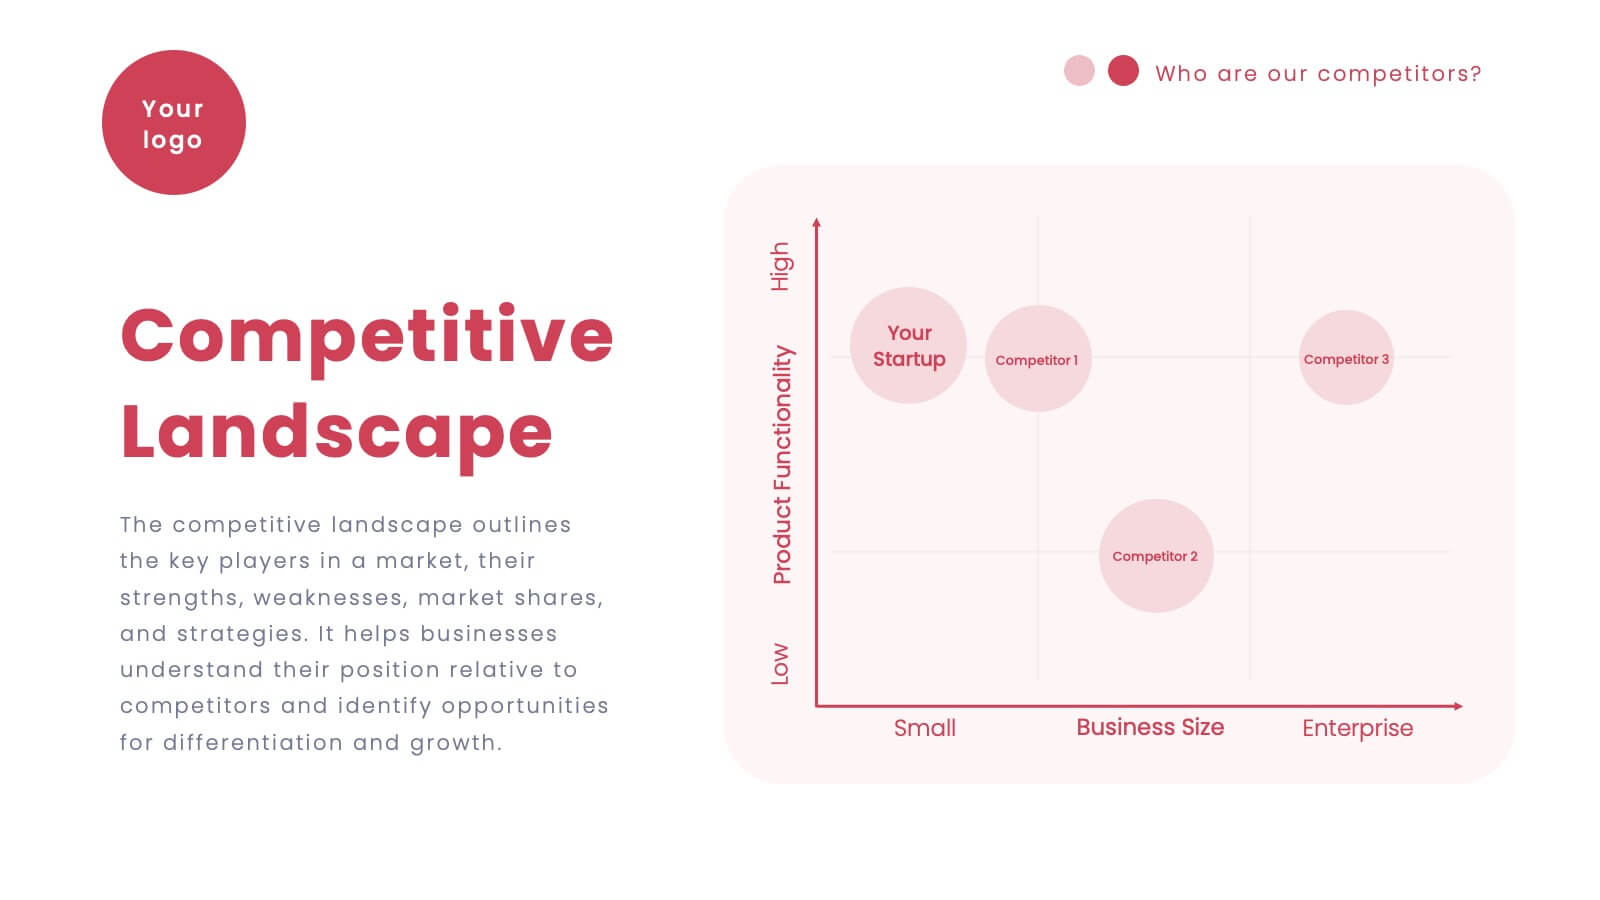
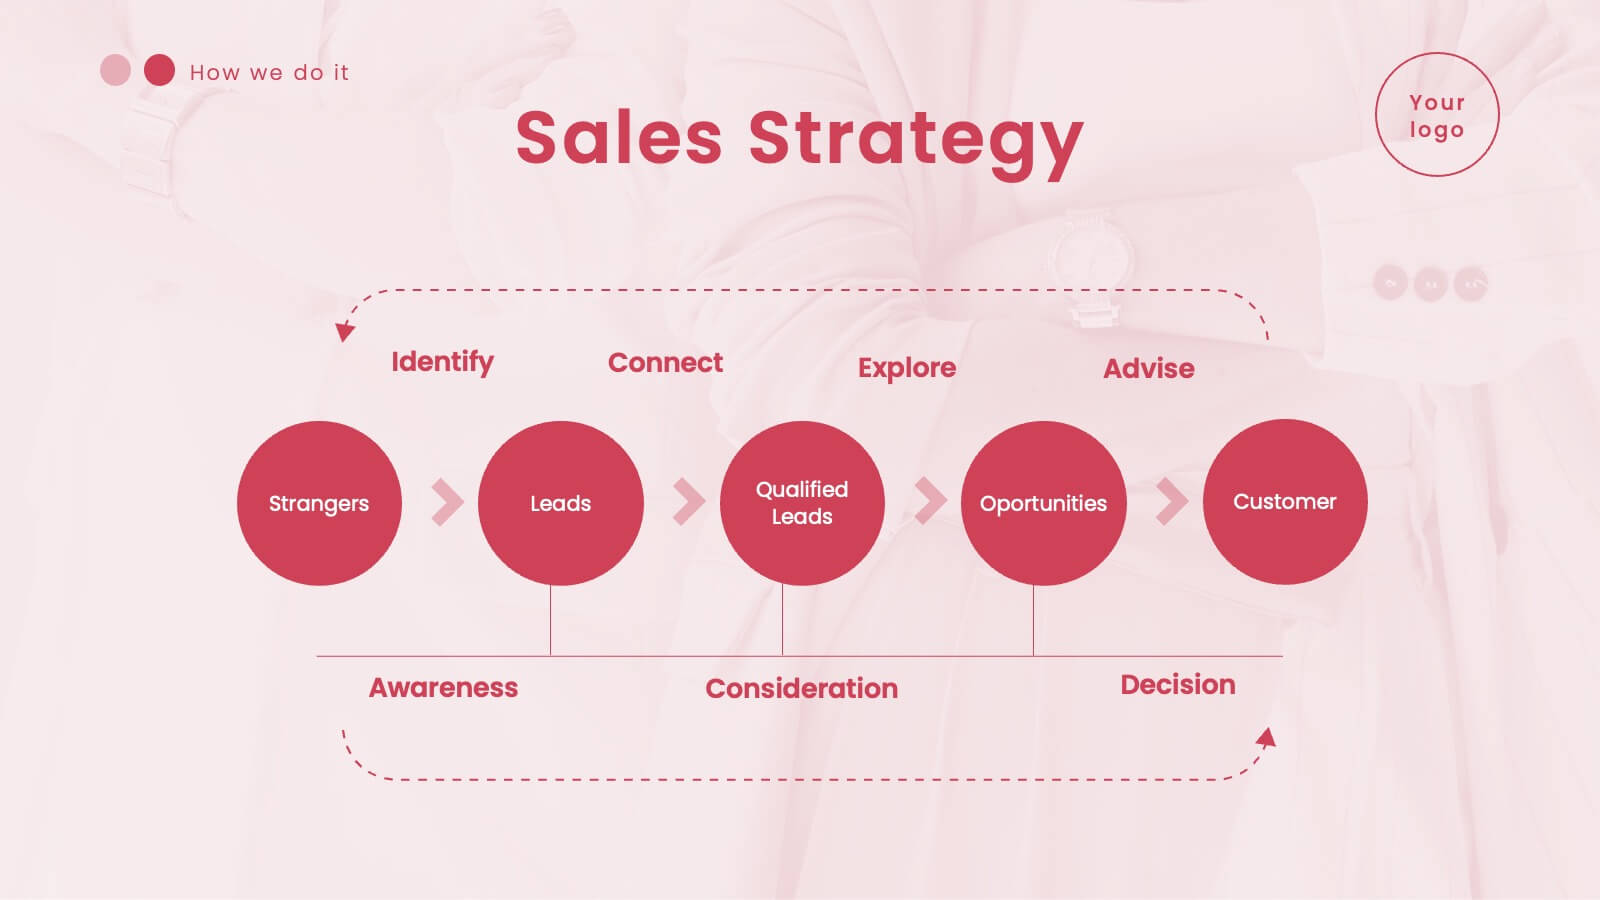
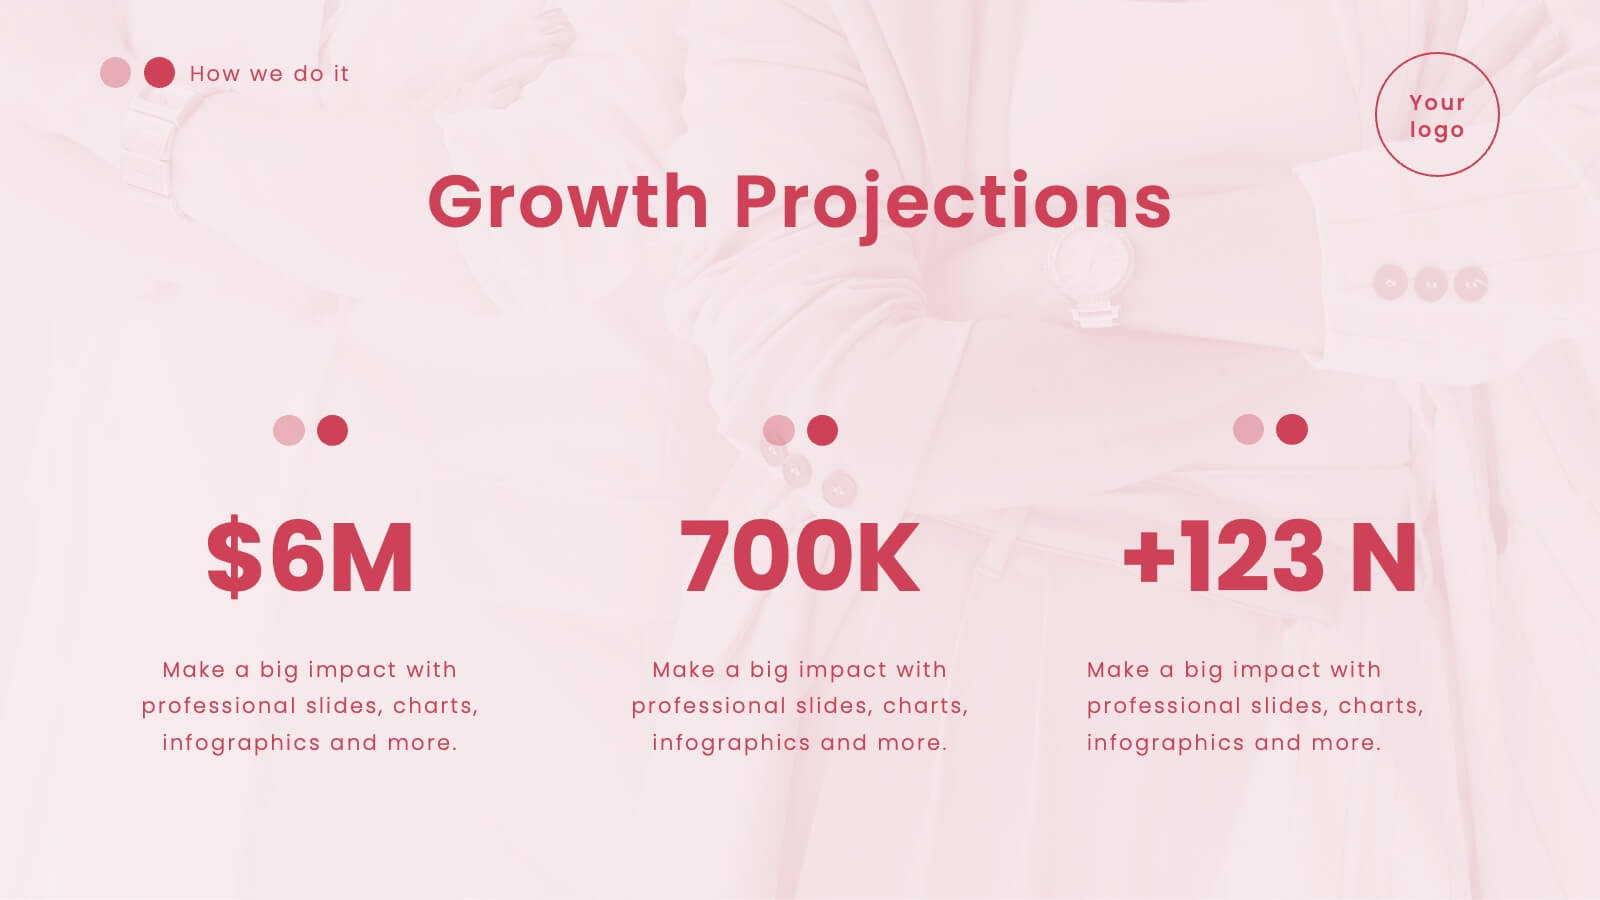
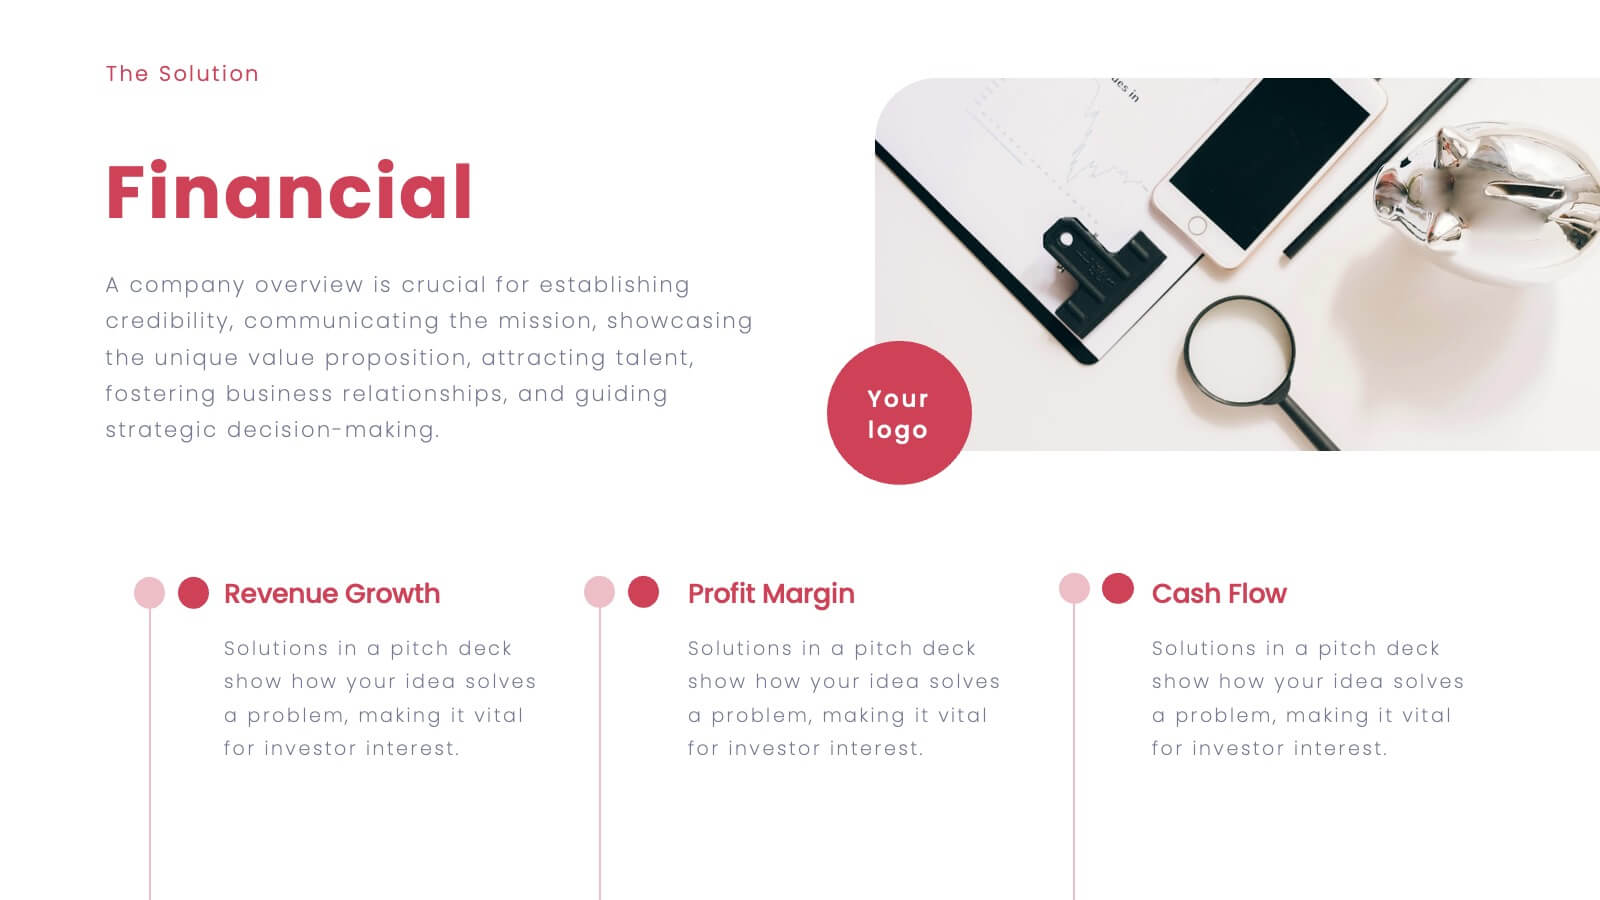
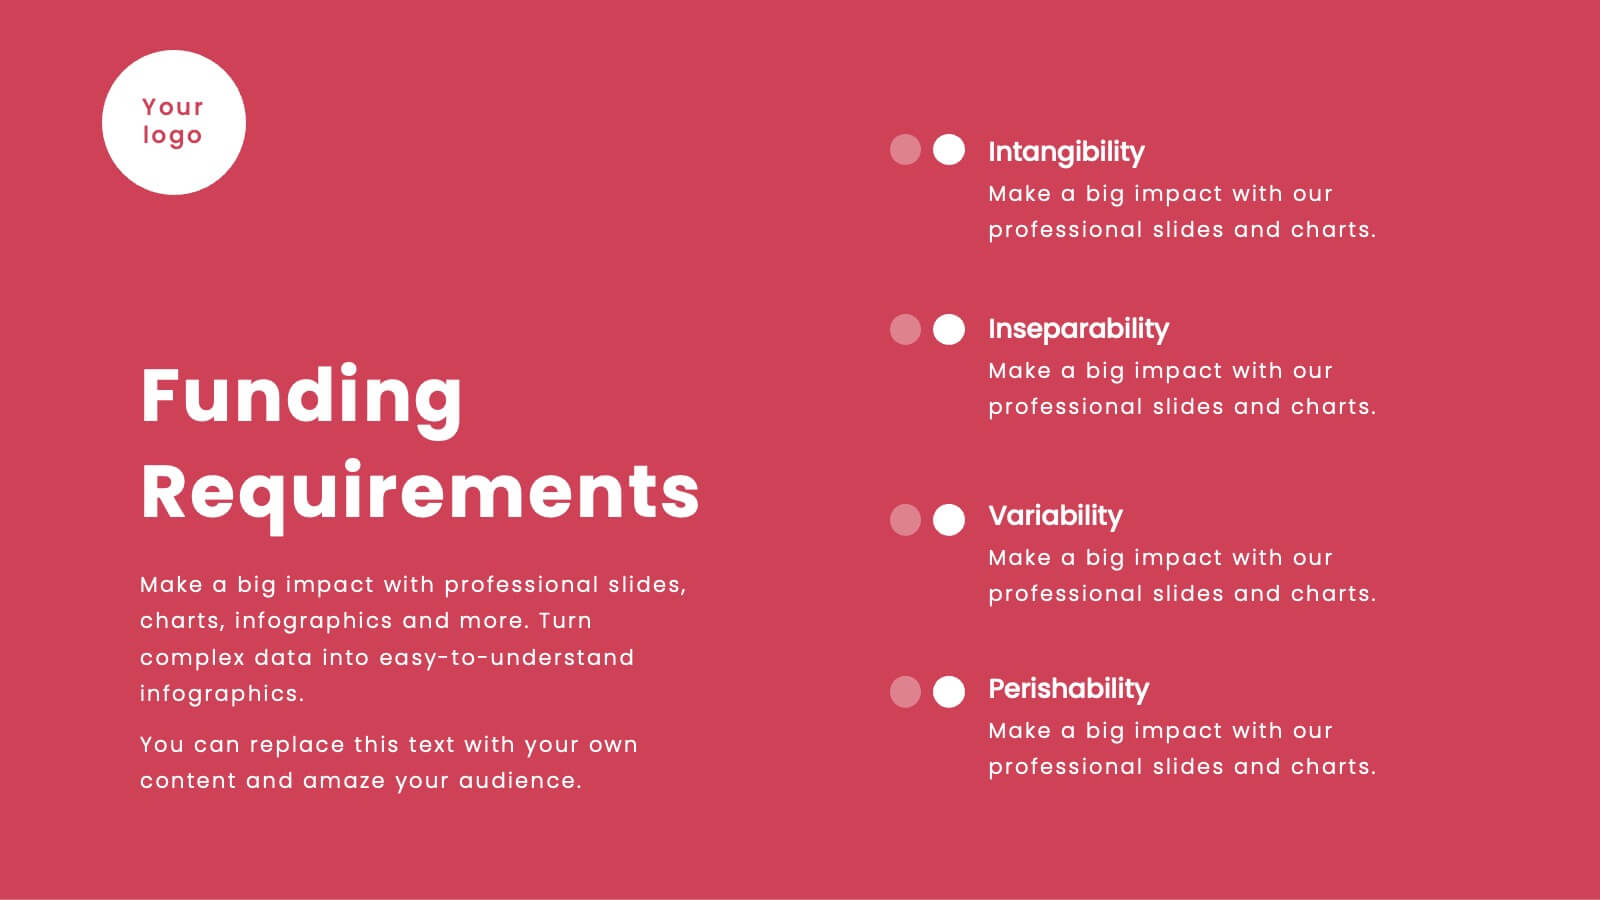
Vortex Startup Pitch Deck Presentation
Launch your ideas into action with this vibrant red pitch deck template, designed to captivate and inform potential investors. It covers everything from company overview to financials and market strategy, ensuring your vision is communicated effectively. Compatible with PowerPoint, Google Slides, and Keynote, this template is perfect for startups seeking to impress and engage.


5 slides
Energy Sector Analysis Infographics
The Energy Sector refers to the industry and activities related to the production, generation, distribution, and consumption of energy. This template is a simple and informative tool that allows you to present key information and statistics about the energy sector in an engaging manner. This template is designed to help you showcase data, trends, and insights related to aspects of the energy sector, including renewable energy, fossil fuels, and environmental impacts. Its customizable design and informative layouts make it an ideal choice for educational presentations, or raising awareness and understanding of this and its various dimensions.


6 slides
Pillar Foundation Infographics
Gain insights into Pillar Foundation construction with our customizable infographic template. This template is fully compatible with popular presentation software like PowerPoint, Keynote, and Google Slides, allowing you to easily customize it to illustrate and communicate the key aspects and principles of pillar foundation construction. The Pillar Foundation infographic template offers a visually engaging platform to explore and explain the construction process, types of pillars, materials used, and the significance of pillars in building stability. Whether you're a construction professional, architect, engineer, or simply interested in construction techniques, this template provides a user-friendly canvas to create informative presentations and educational materials. Deepen your knowledge of Pillar Foundation construction with this SEO-optimized infographic template, thoughtfully designed for clarity and ease of use. Customize it to showcase foundation types, construction steps, reinforcement methods, and the role of pillars in supporting structures, ensuring that your audience gains valuable insights into this crucial aspect of construction. Start crafting your personalized infographic today to delve into the world of Pillar Foundation construction.


6 slides
Workplace Safety and Compliance
Simplify safety protocols with this visual workplace compliance slide. Featuring a clear cone-style graphic and three editable sections, it's ideal for outlining procedures, regulations, and training checkpoints. Perfect for HR teams, safety briefings, and internal audits. Editable in PowerPoint, Keynote, and Google Slides.


7 slides
Criminal Law Infographic
The Criminal Law Infographic presents an engaging and informative visual breakdown of key components within the field of criminal law. Each segment highlights different aspects such as crime rates, judicial processes, or enforcement statistics. This template is designed to be user-friendly, making it an ideal choice for legal professionals, or students who need to present complex legal information. Compatible with PowerPoint, Google Slides, and Keynote, it offers a versatile way to communicate legal concepts and data in both educational and professional settings. Its clear structure ensures that viewers can easily follow and comprehend the critical elements of criminal law.


5 slides
Business SWOT Evaluation Framework Presentation
Deliver clear strategic analysis with the Business SWOT Evaluation Framework Presentation. This layout features a modern quadrant design that segments Strengths, Weaknesses, Opportunities, and Threats around a central focus, making your insights easy to digest. Fully editable in PowerPoint, Canva, and Google Slides—perfect for business planning and executive reporting.


5 slides
Modern Design with Geometric Elements Presentation
Elevate your message with this clean, modern layout featuring four-leaf geometric icons and subtle color accents. Perfect for showcasing strategic concepts or business pillars in a stylish, easy-to-read format. Ideal for proposals, updates, or team presentations. Fully editable in PowerPoint, Google Slides, Keynote, and Canva. Professional and versatile.


5 slides
Technology Comparison Infographics
When comparing technologies, it's important to consider various factors that can impact their performance, usability, and suitability for specific purposes. These vertical infographics can be used in various contexts, including product evaluations, technology assessments, investment decisions, and educational presentations. It helps simplify complex information and facilitates the understanding of technology options, enabling individuals and organizations to make well-informed choices that align with their goals and requirements. Compatible with Powerpoint, Keynote, and Google Slides.


6 slides
Effective Time Management Strategie Presentation
Make the most of your hours with this sharp and creative visual layout designed to organize your time-saving game plan. This template highlights key time management strategies, helping you structure priorities and boost daily efficiency. Fully customizable and easy to edit in PowerPoint, Keynote, and Google Slides for seamless presentation use.


8 slides
Effective Team Building Model Presentation
Visualize your strategy for collaboration with the Effective Team Building Model Presentation. This layered block layout is perfect for illustrating step-by-step frameworks, progressive strategies, or hierarchical team development stages. Clean, modern, and color-coded for clarity, it's ideal for internal planning, training, or leadership presentations. Fully editable in PowerPoint, Keynote, Canva, and Google Slides.


6 slides
Transportation and Logistics Jobs Infographic
Transportation and logistics jobs involve managing the movement of goods, materials, and people from one location to another. This infographic template is essential in ensuring the efficient and smooth operation of supply chains, distribution networks, and transportation systems. This infographic is an informative representation of the various job roles and career opportunities available within the transportation and logistics industry. This template is designed to provide valuable insights to individuals seeking careers in this field, as well as professionals looking to explore different career paths within transportation and logistics.


7 slides
Sports Bases Infographic
Step up your game with our sports bases infographic! Designed to captivate sports enthusiasts, coaches, trainers, and educators, this vibrant infographic illuminates the aspects of various sports disciplines. With a crisp blue backdrop coupled with dynamic shades of blue and an array of sporty colors, it provides a visual sprint through the key bases of multiple sports. Ideal for coaches aiming to provide a overview to their teams, or educators introducing students to the fundamentals of sports. Compatible with PowerPoint, Keynote, and Google Slides, you can seamlessly integrate it into your presentations and captivate your audience with a sporty edge.