


Features
- 5 Unique slides
- Fully editable and easy to edit in Microsoft Powerpoint, Keynote and Google Slides
- 16:9 widescreen layout
- Clean and professional designs
- Export to JPG, PDF or send by email


Do you have any questions?
Recommend


21 slides
Rakshasa Project Status Report Presentation
This detailed status report template helps track progress with clarity and precision. Featuring sections on financial summaries, operational updates, key achievements, and market trend analysis, it ensures seamless reporting and decision-making. Perfect for reviewing team productivity, challenges, and upcoming priorities, this template offers easy customization in PowerPoint, Keynote, or Google Slides.


7 slides
Future Vision Infographic
Chart a course towards a visionary future with our Future Vision Infographic Template. This dynamic template is designed to help organizations articulate and visualize their long-term goals and strategies in a clear and compelling way. Each slide offers a unique blend of geometric designs and bold color palettes, ideal for engaging stakeholders and inspiring action. Perfect for corporate presentations, strategic meetings, or digital showcases, this template allows you to lay out your vision with precision. It guides viewers through your roadmap to success, highlighting key milestones and the innovative steps you plan to take. Customize each element to echo your organizational identity and values, ensuring that your future aspirations resonate deeply with your audience. Whether you're aiming to motivate your team, attract investors, or inform your partners, our Future Vision template provides a robust foundation for powerful storytelling and strategic clarity.


4 slides
Daily Time Planning and Scheduling Presentation
Stay organized and maximize productivity with this Daily Time Planning and Scheduling template. Featuring a structured hourly schedule, task folders for tomorrow’s plans and to-do lists, and a dedicated notes section, this slide is designed for professionals, students, and busy individuals. Customize effortlessly to track daily tasks, set priorities, and manage time effectively. Fully compatible with PowerPoint, Keynote, and Google Slides for seamless integration.


24 slides
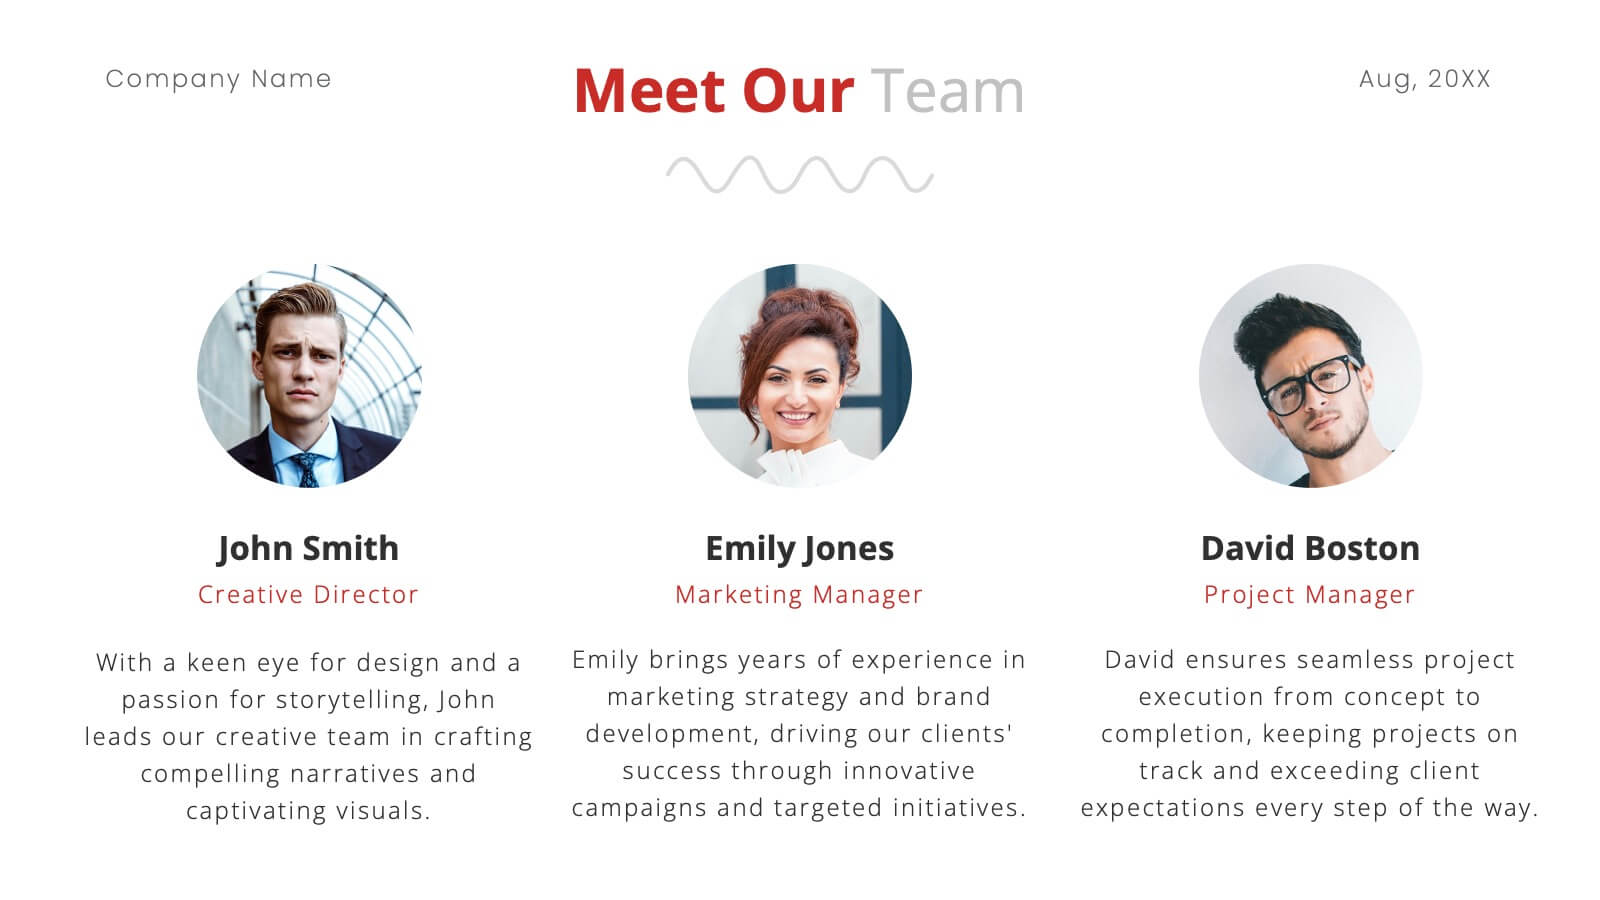
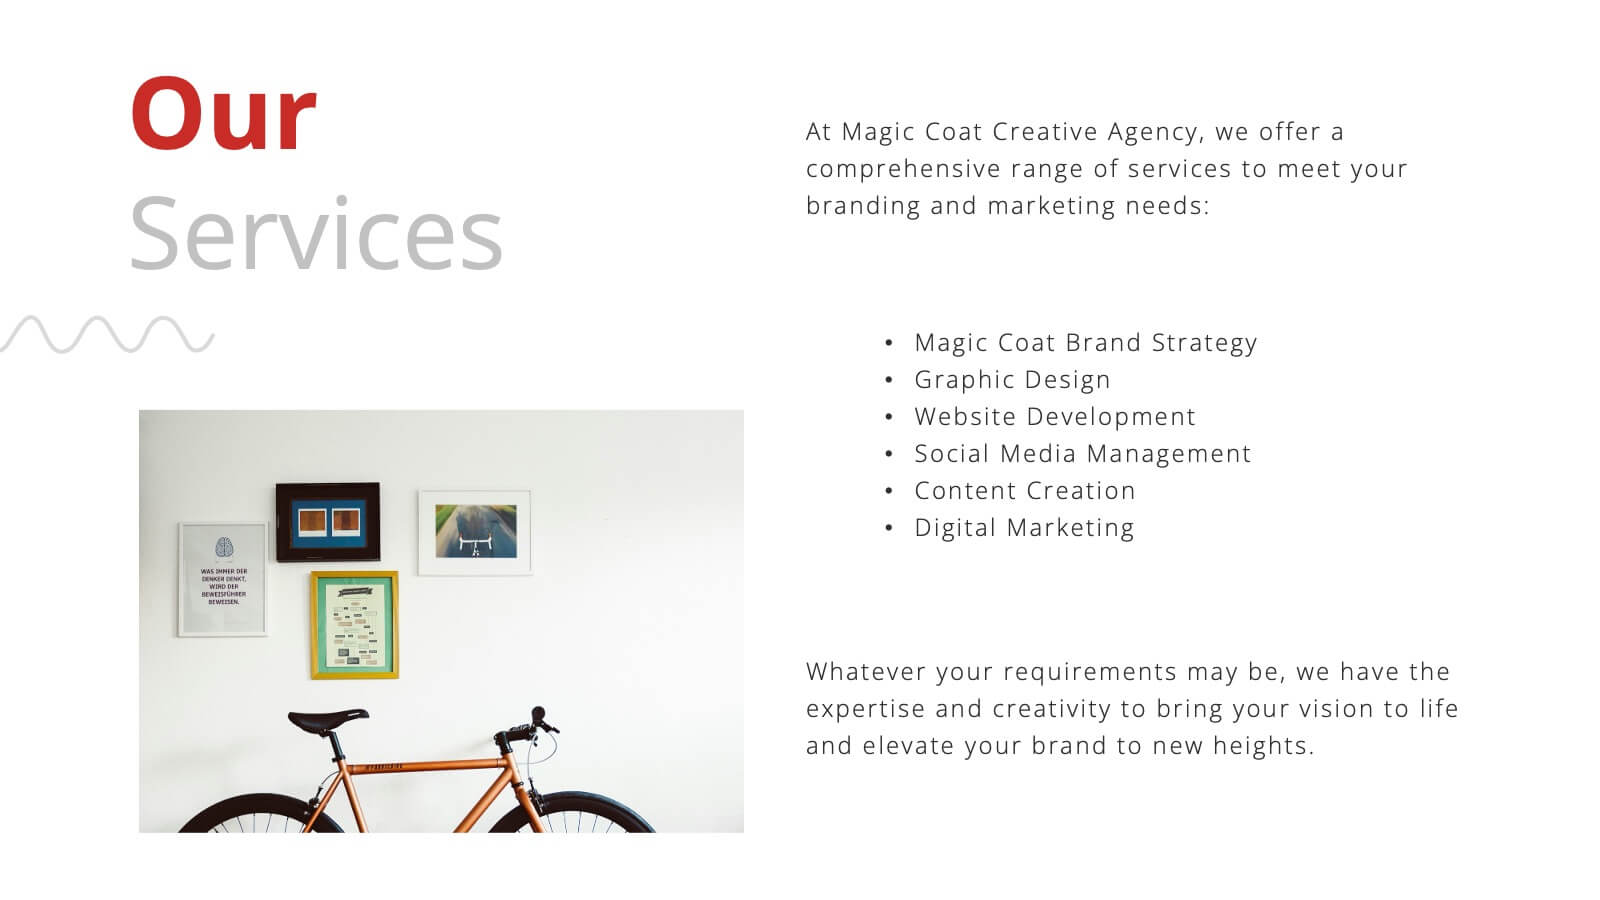
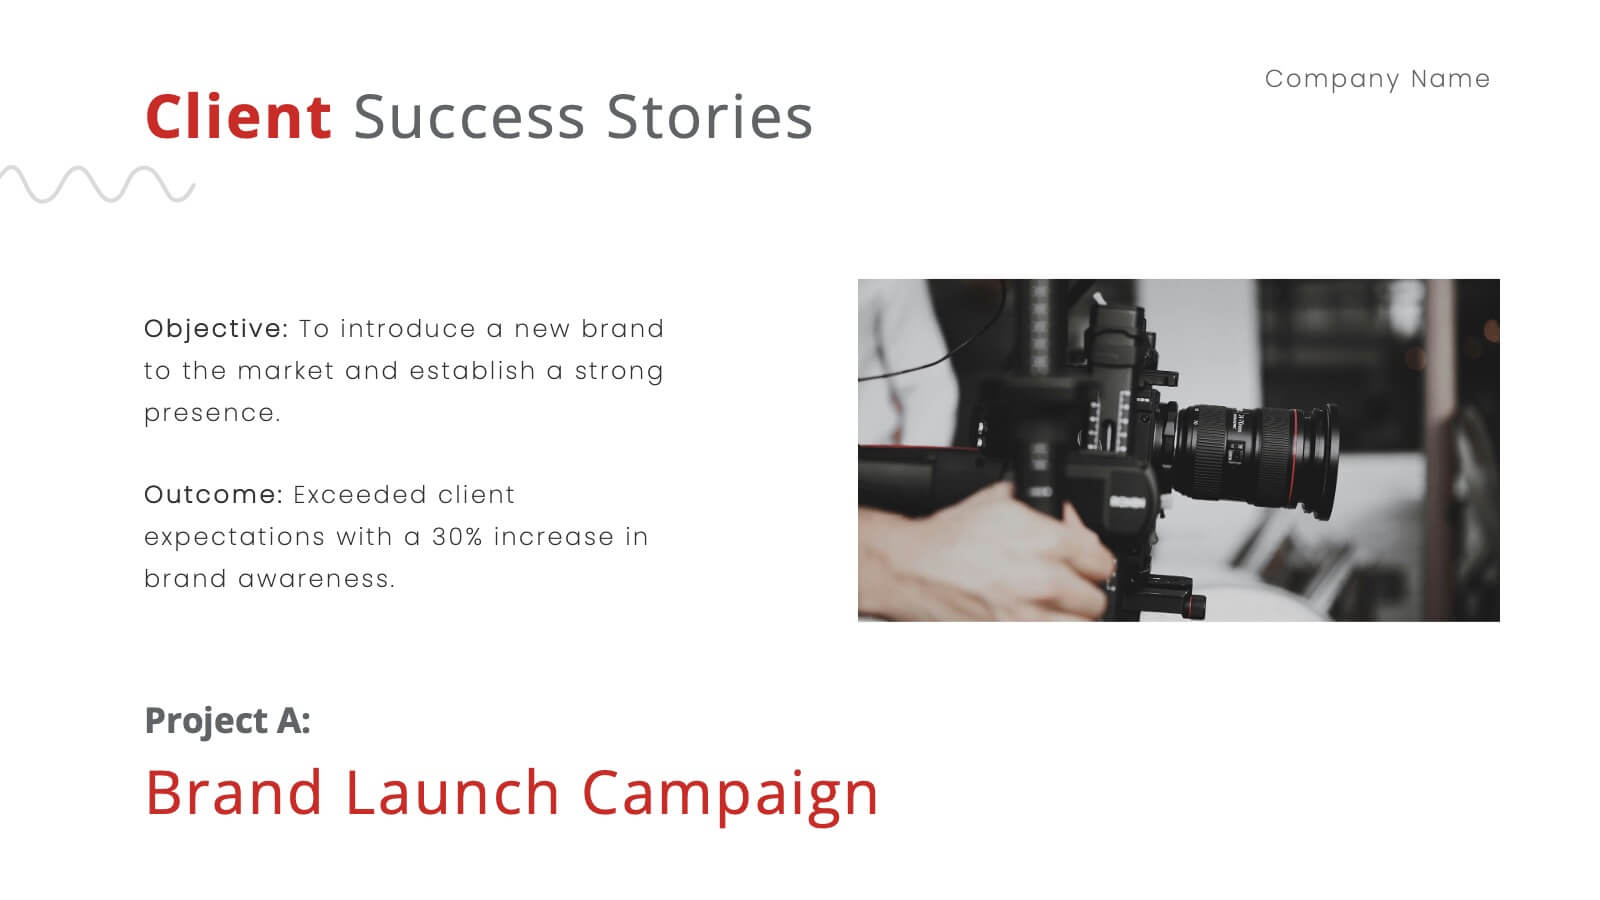
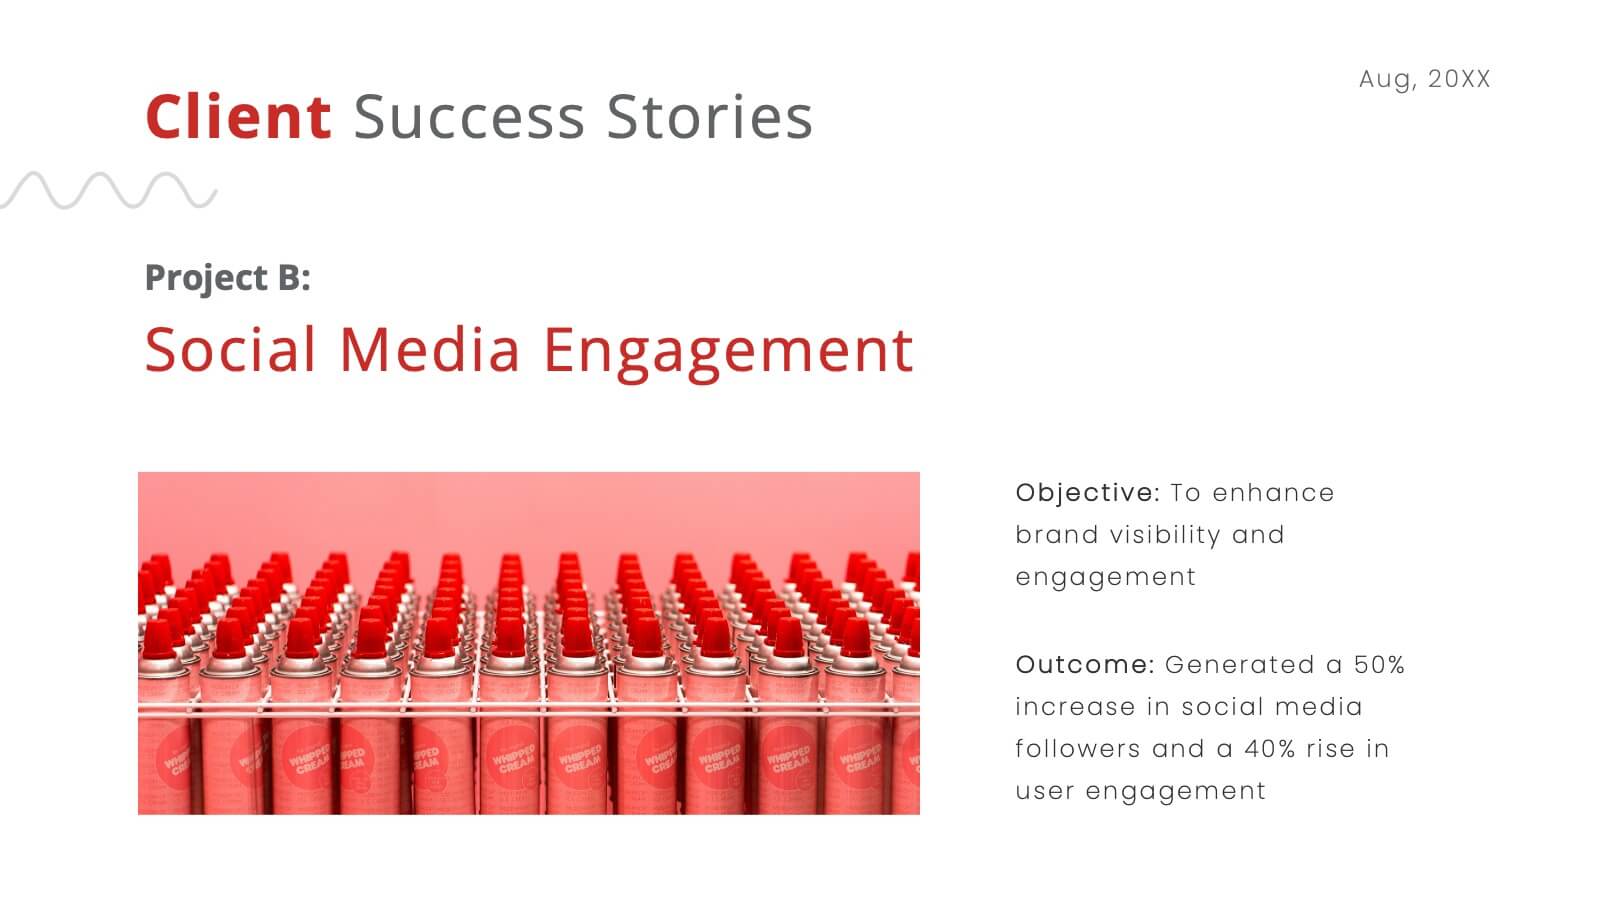
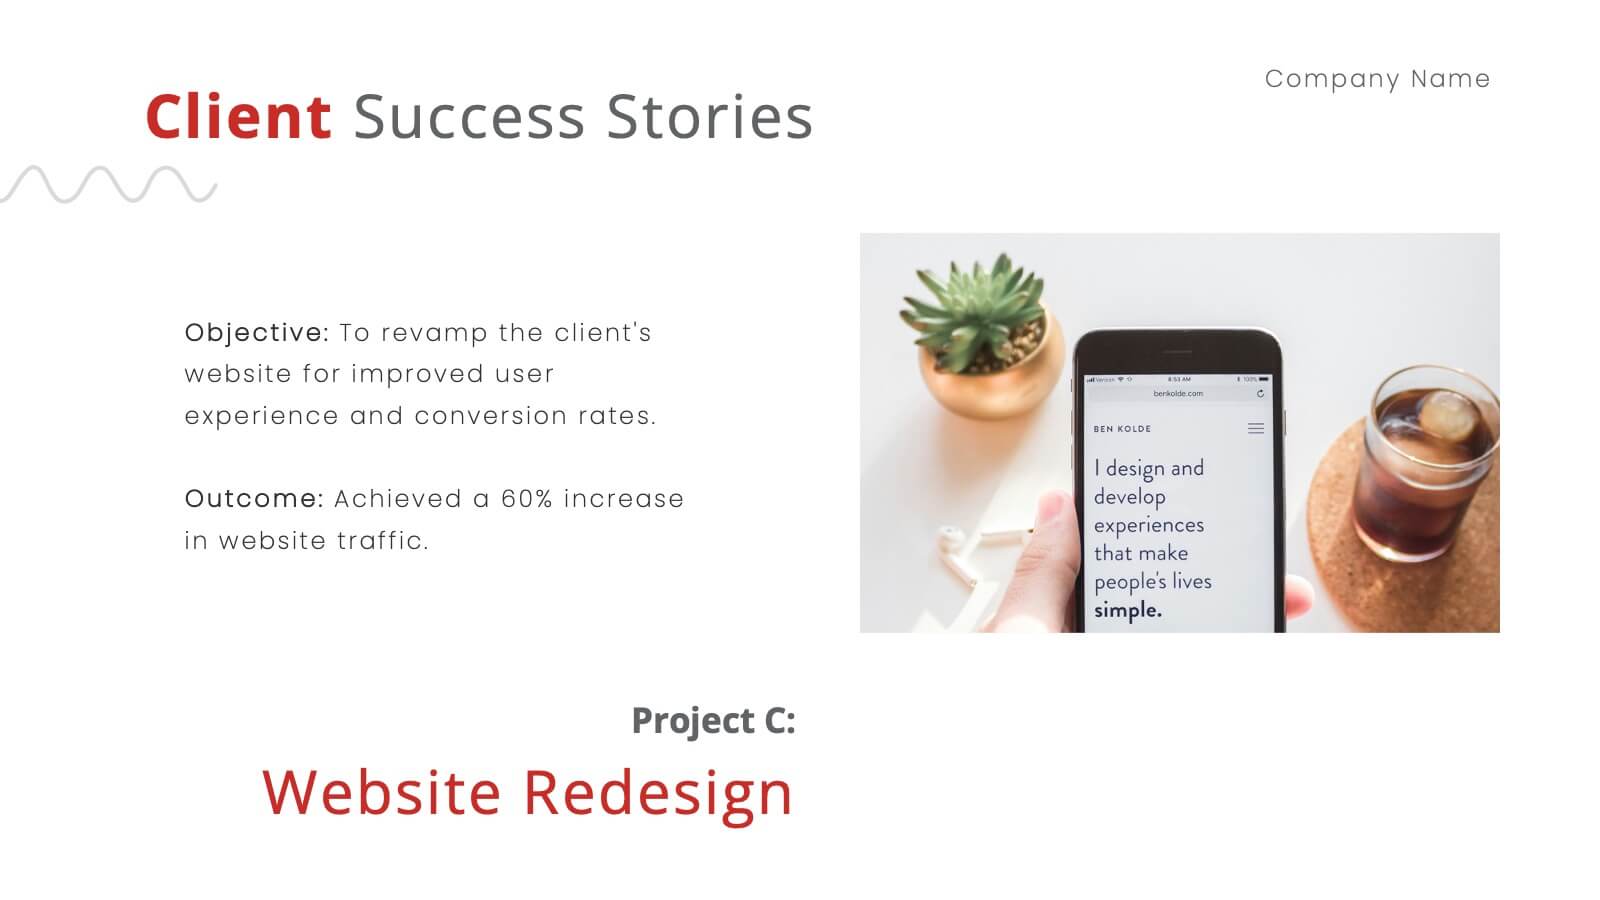
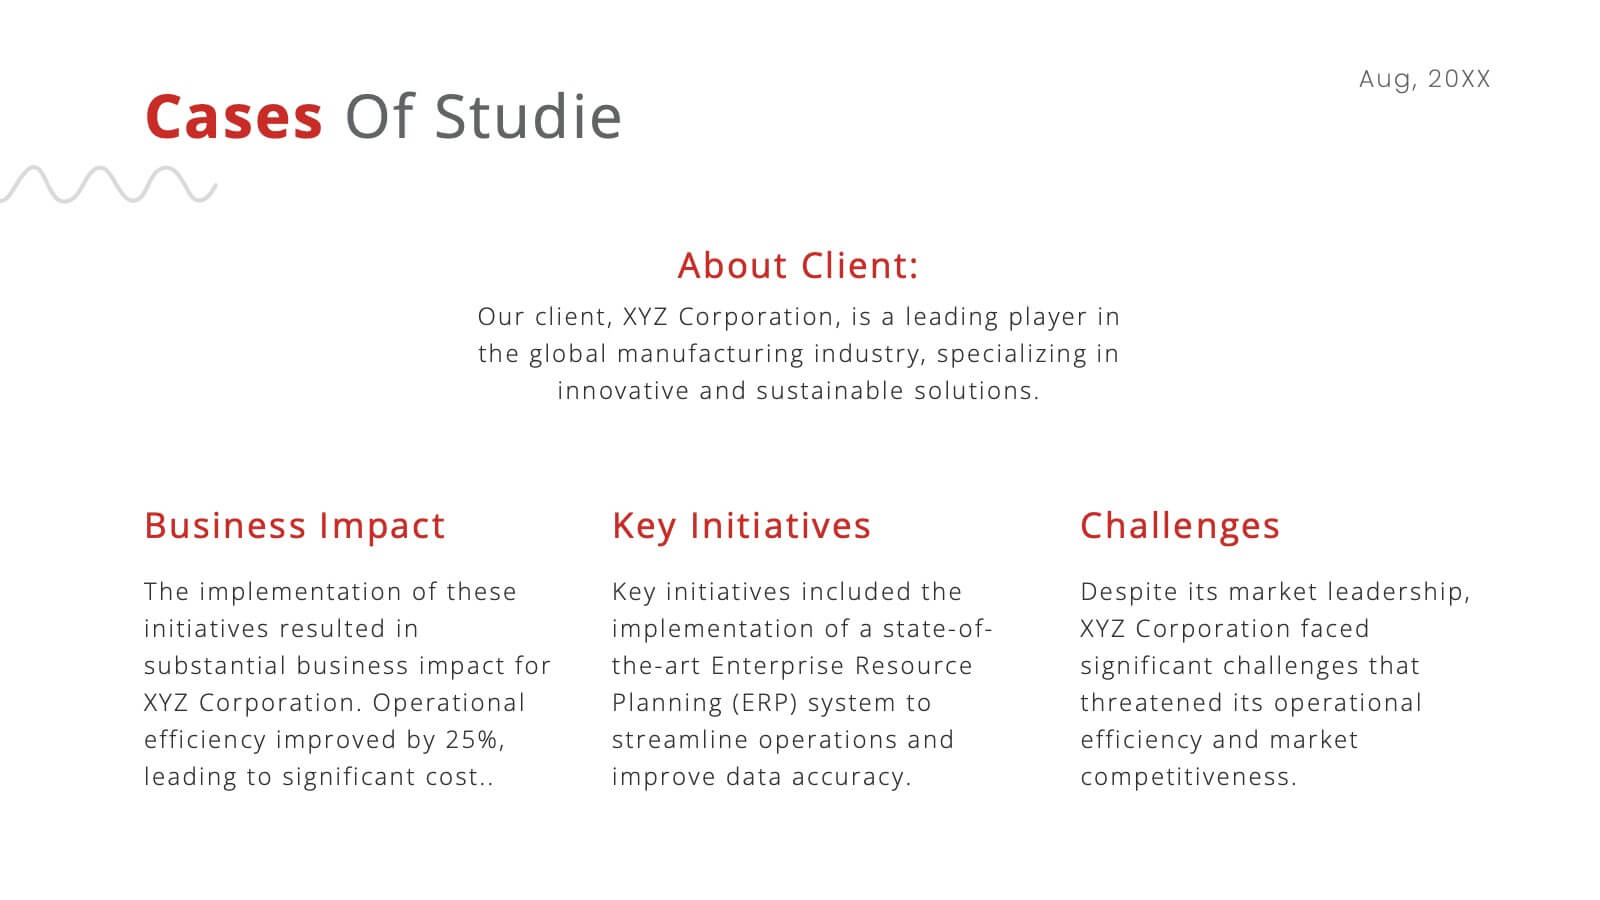
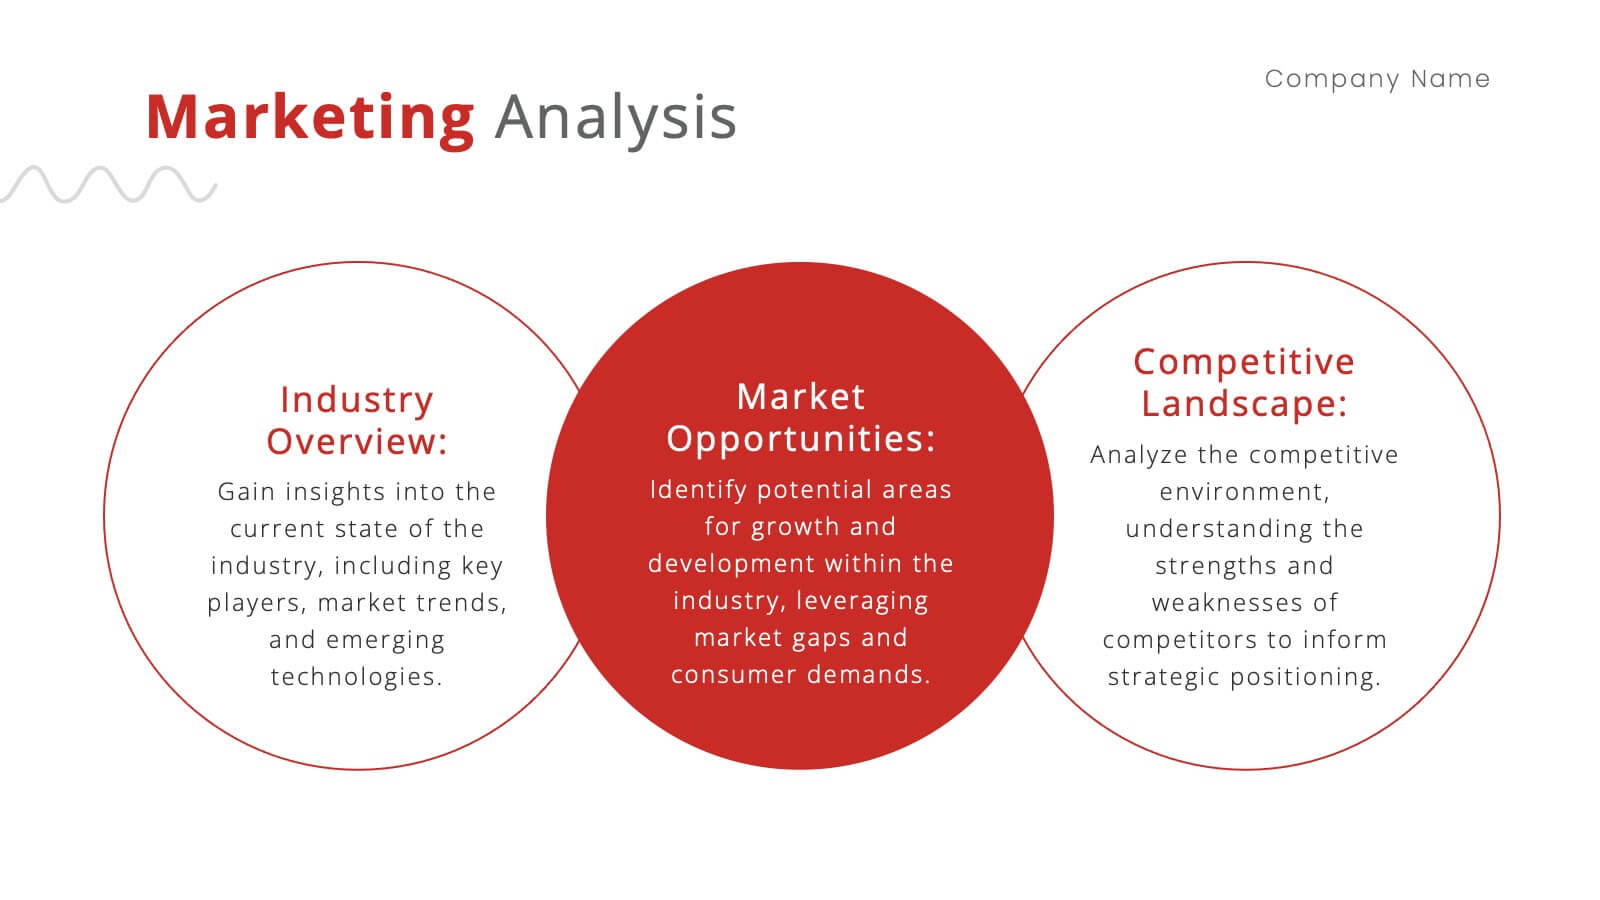
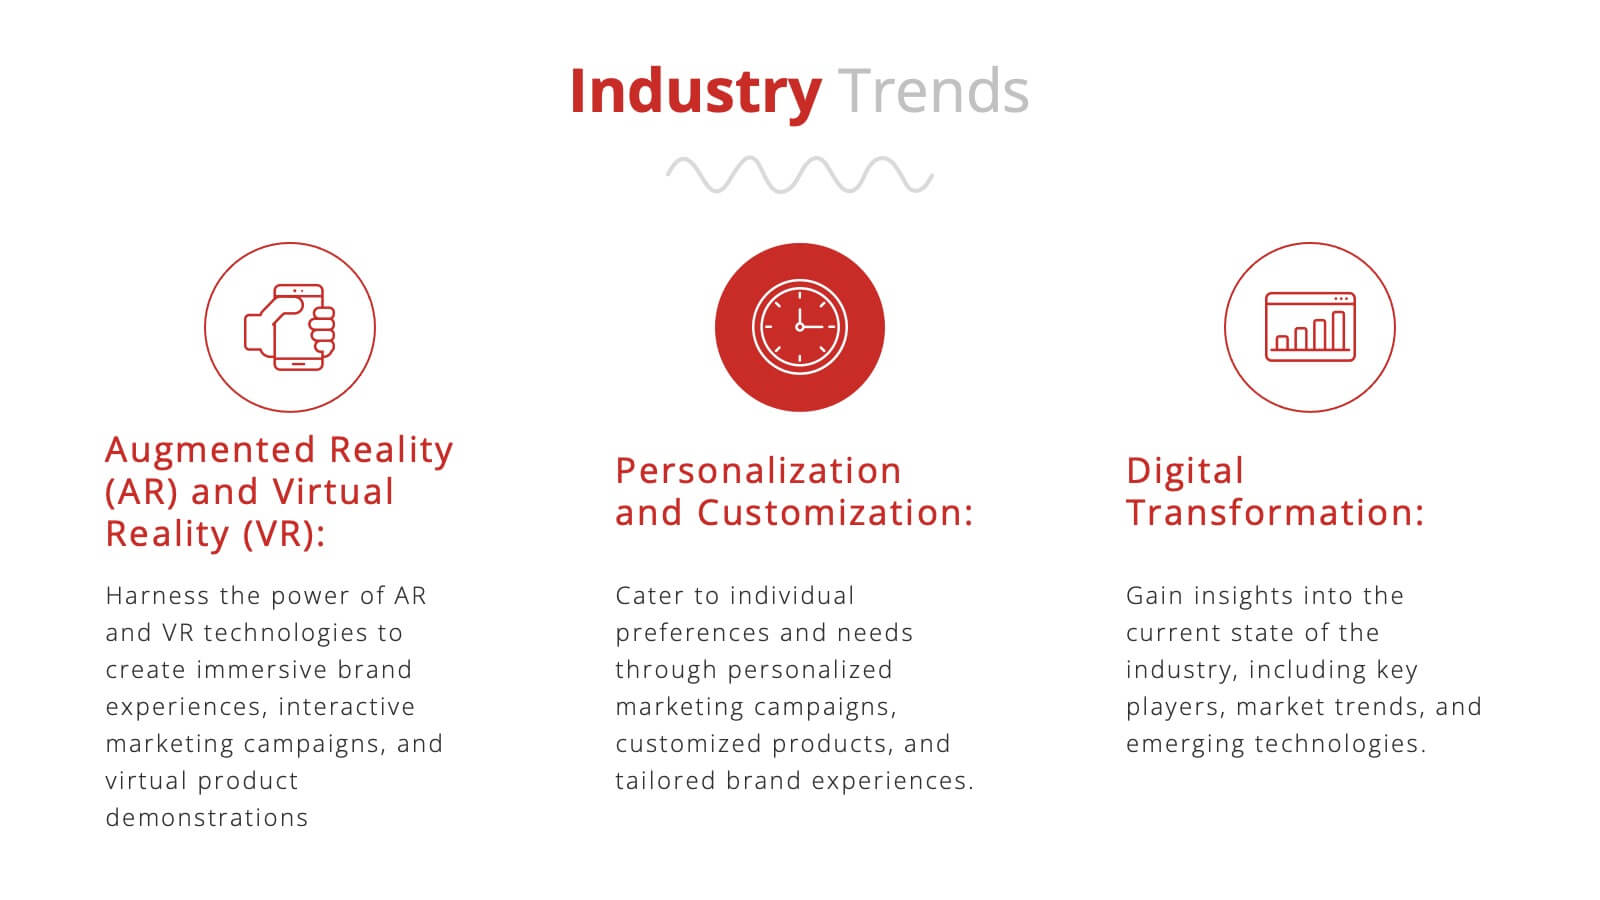
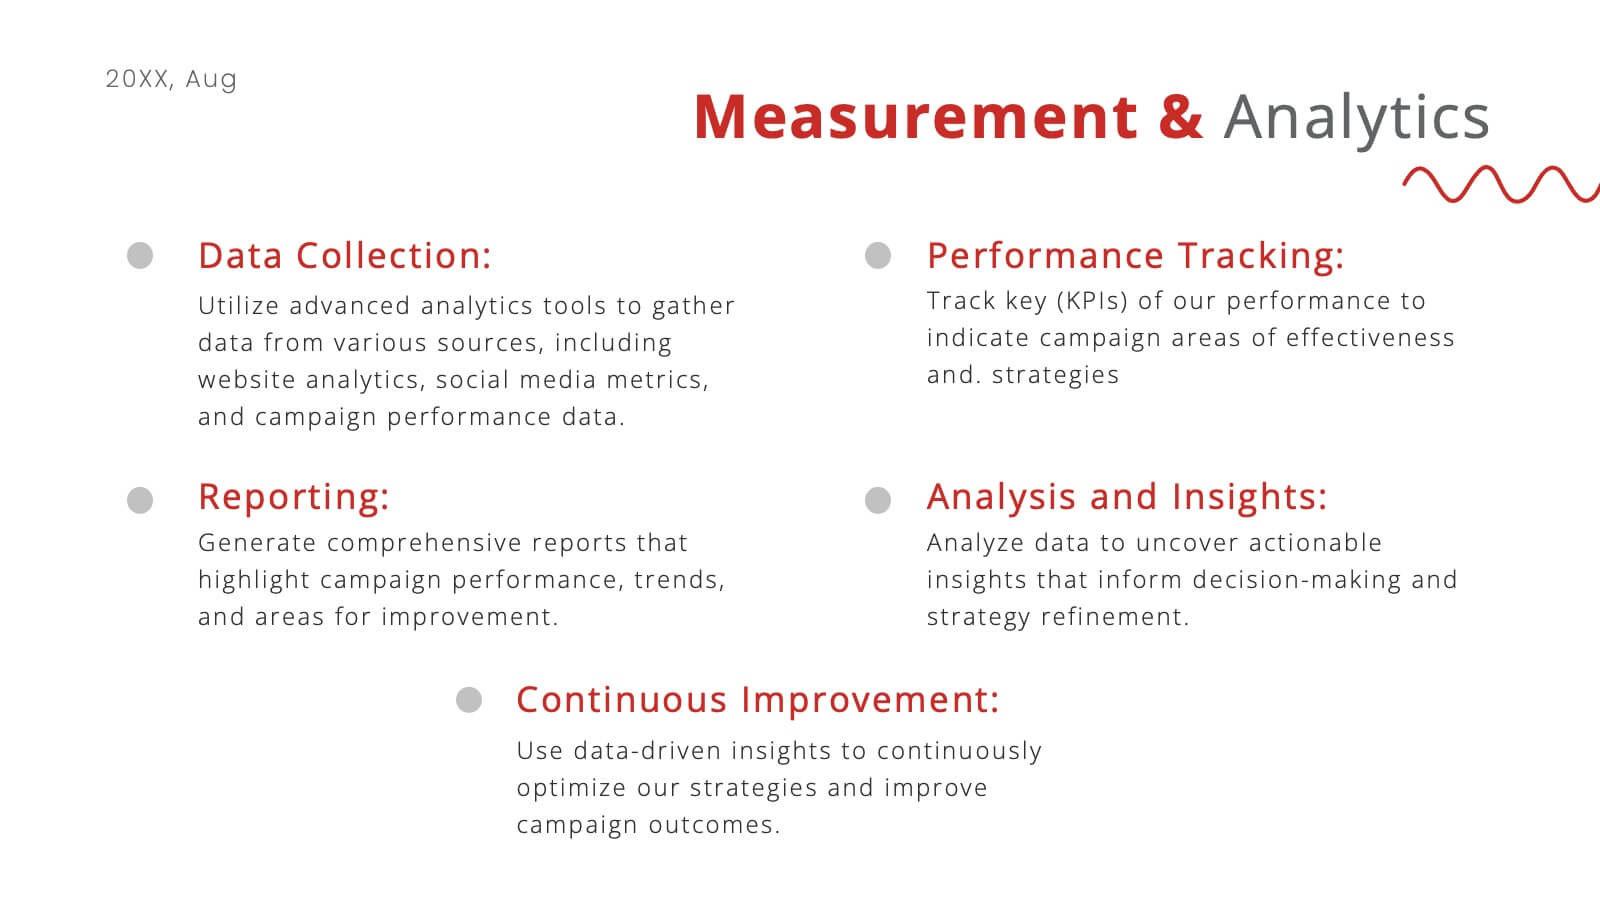
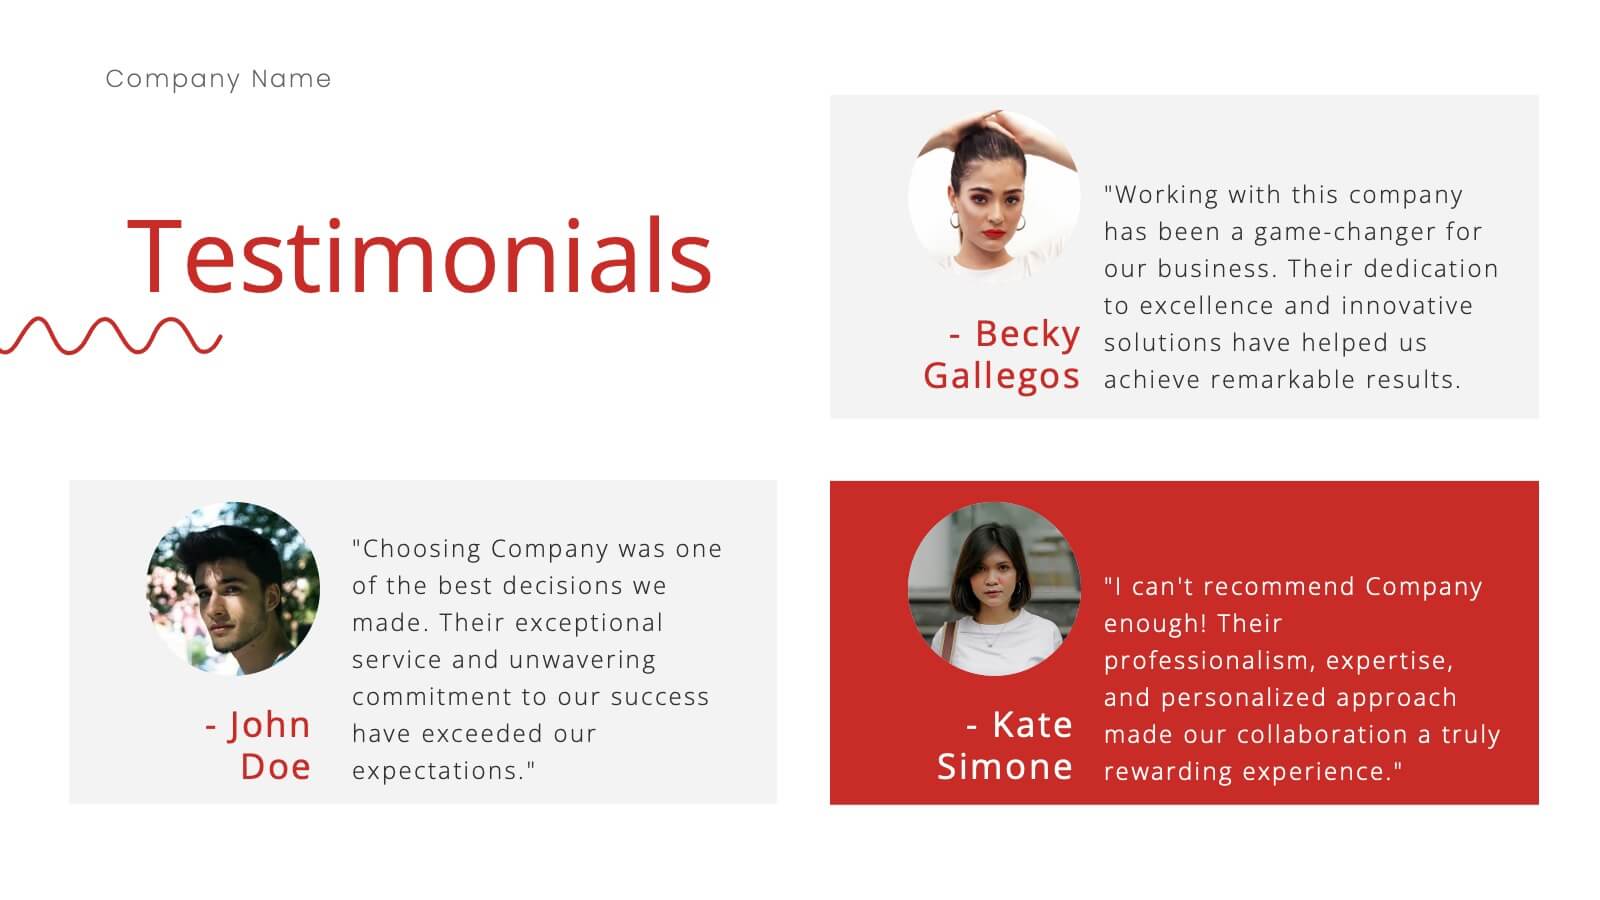
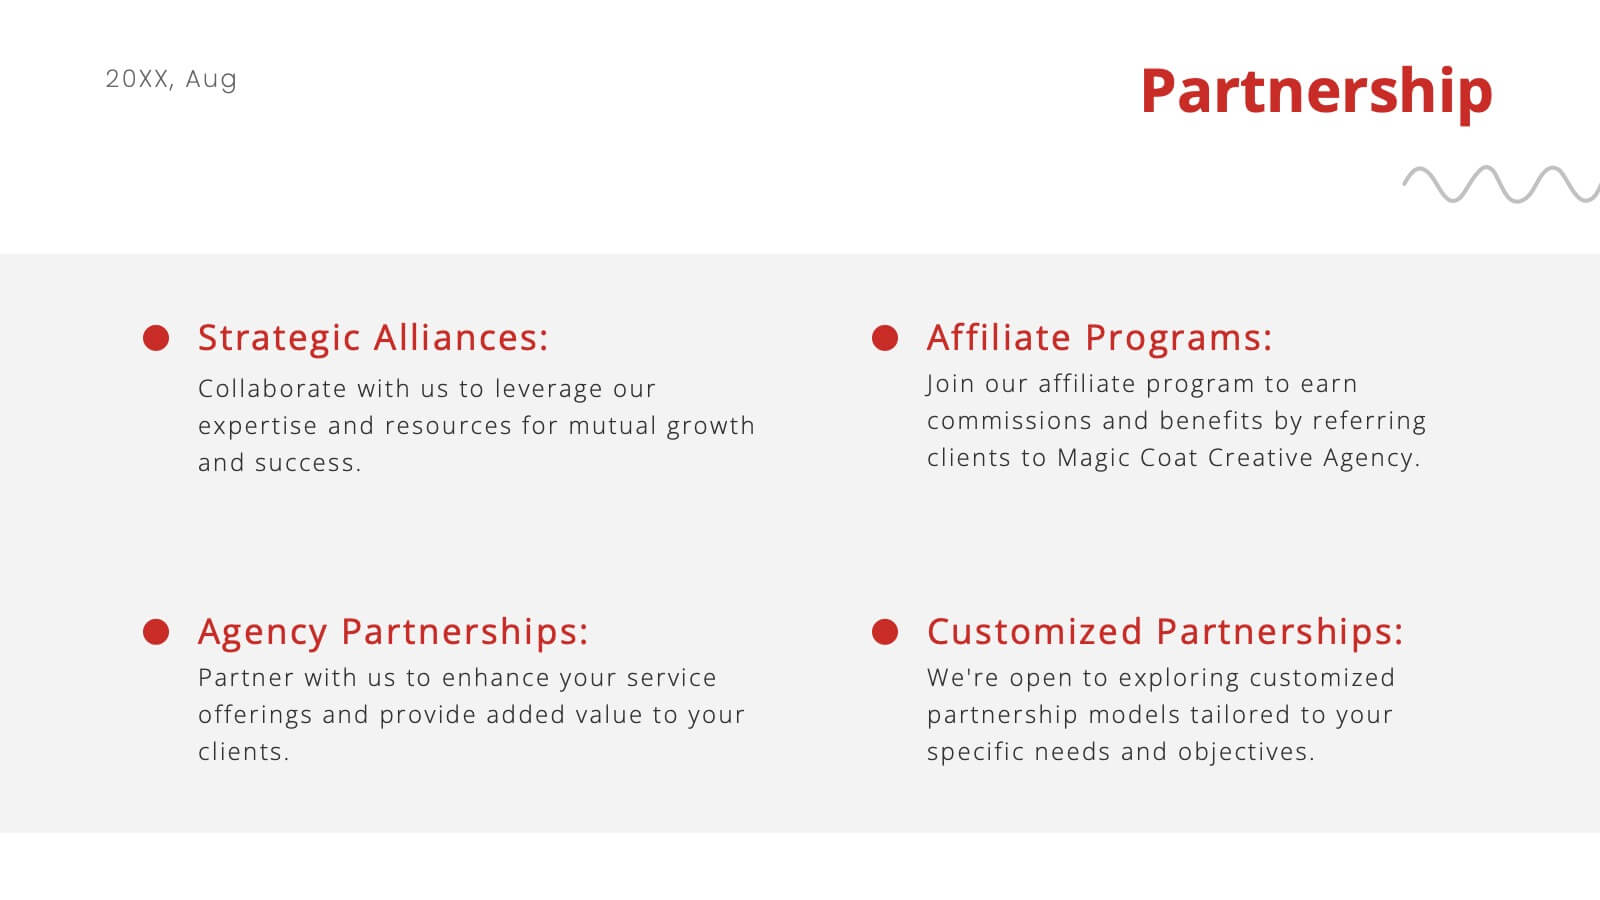
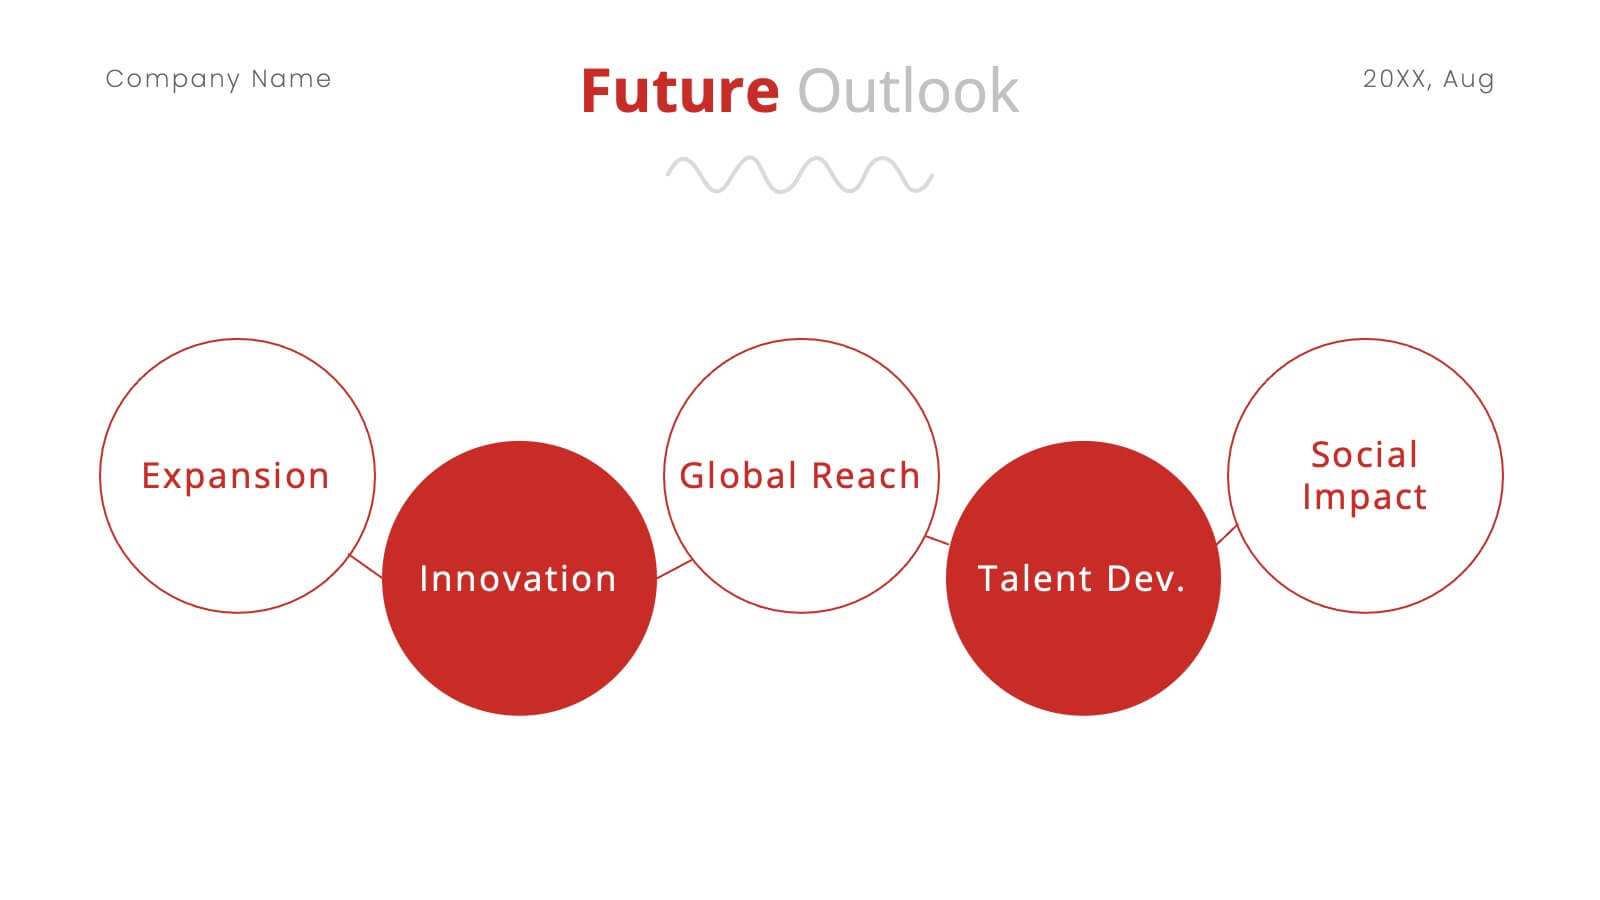
Nickel Advertising Agency Proposal Presentation
Take your advertising agency to the next level with this sleek and modern presentation template! Highlighting your services, team, success stories, and marketing strategies, it’s the perfect tool to showcase your agency’s strengths and capabilities. Fully customizable and compatible with PowerPoint, Keynote, and Google Slides, this template is ideal for impressing potential clients and partners.


7 slides
Flow Chart Infographic Presentation Template
A Flow Chart Infographic uses shapes and lines to show the flow of information, steps in a process, or the relationship between different ideas. Flow Charts are often used in business, education, and technology to show the steps in a process, decision-making flow, or to illustrate the relationship between different pieces of information. This template is perfect for showing how things work or how to do something step by step. This flowchart infographic includes a variety of different charts and description boxes that you can customize with your information to make it work for you.


5 slides
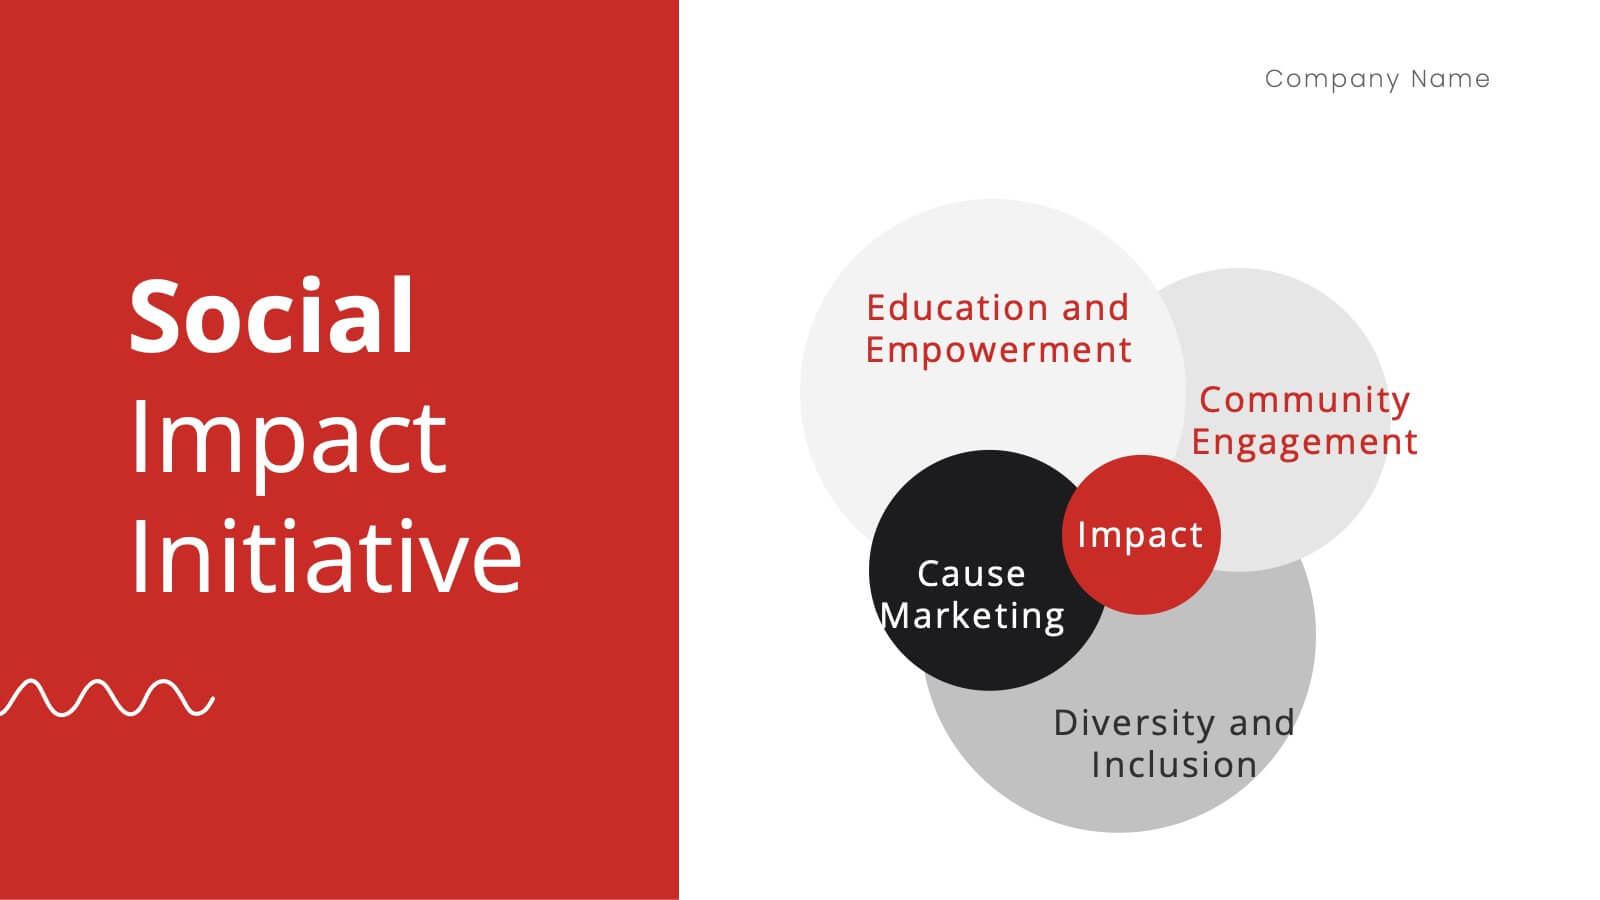
Company Vision and Operations Overview Presentation
Present your company’s mission and structure with this Company Vision and Operations Overview Presentation. Designed around a central eye graphic, it highlights four strategic pillars or core values. Ideal for executive summaries, leadership decks, or internal briefings. Fully editable in Canva, PowerPoint, or Google Slides.


21 slides
Parthenon Marketing Proposal Template Presentation
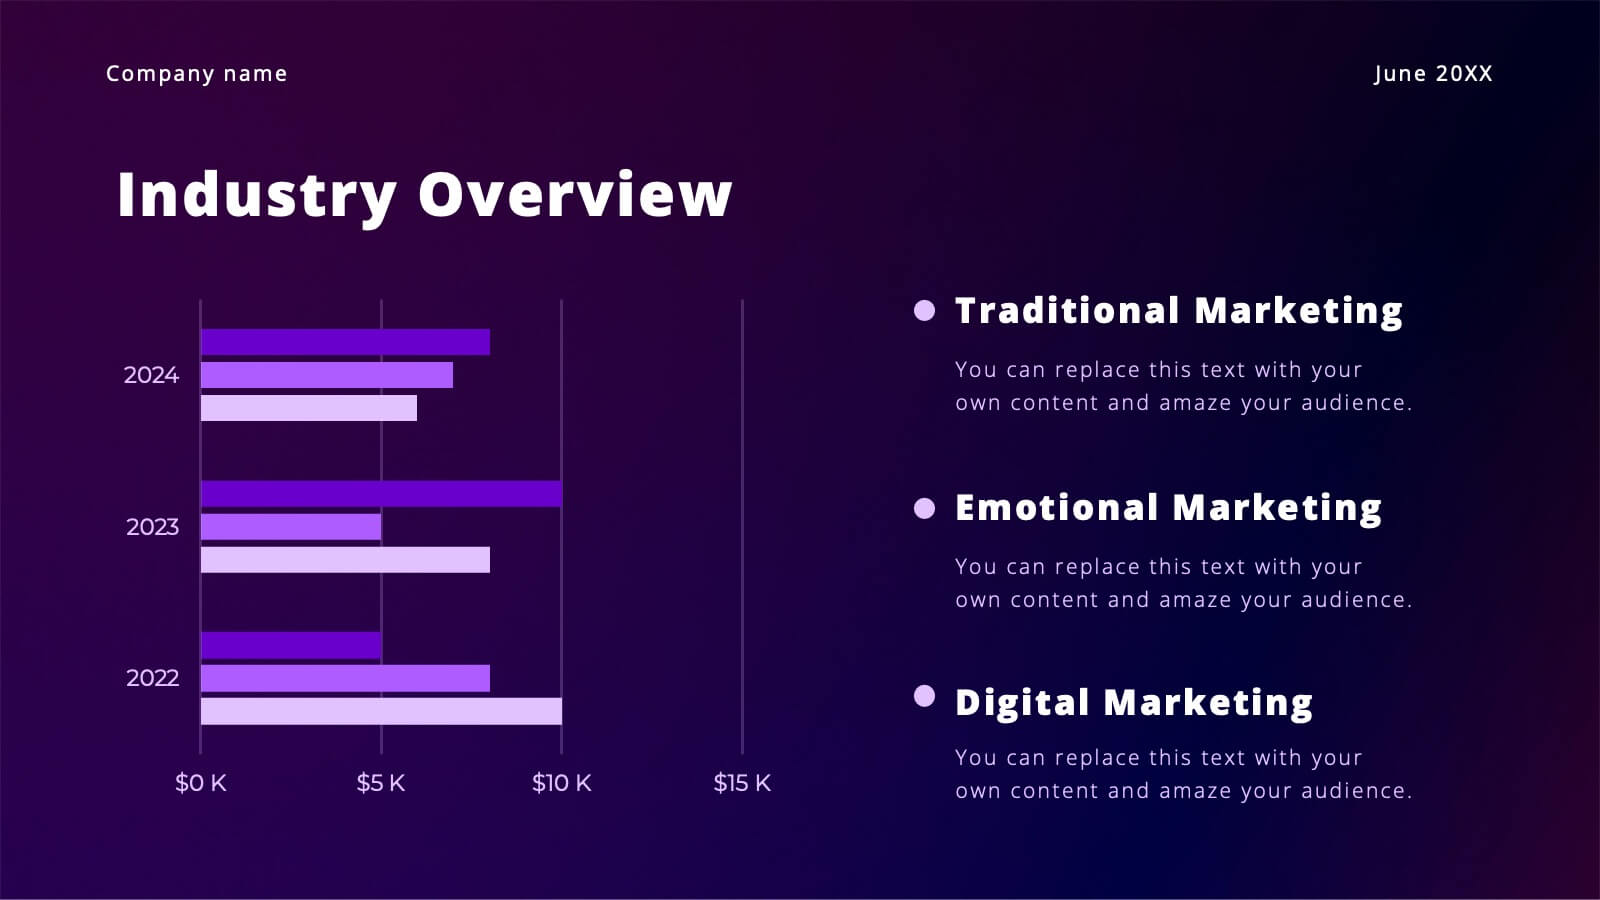
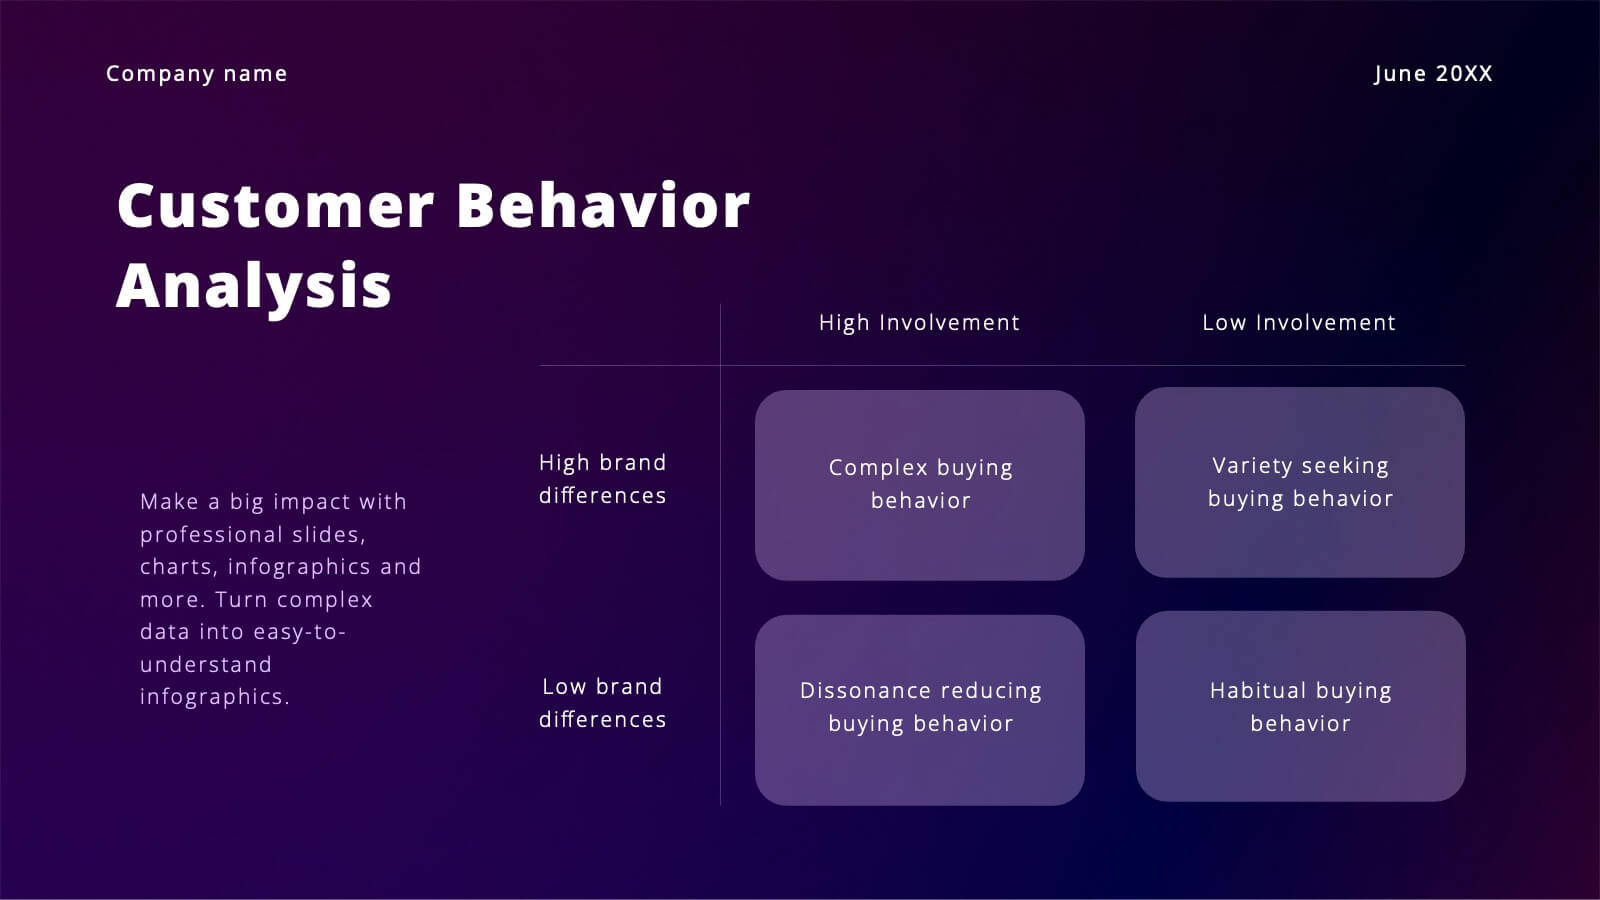
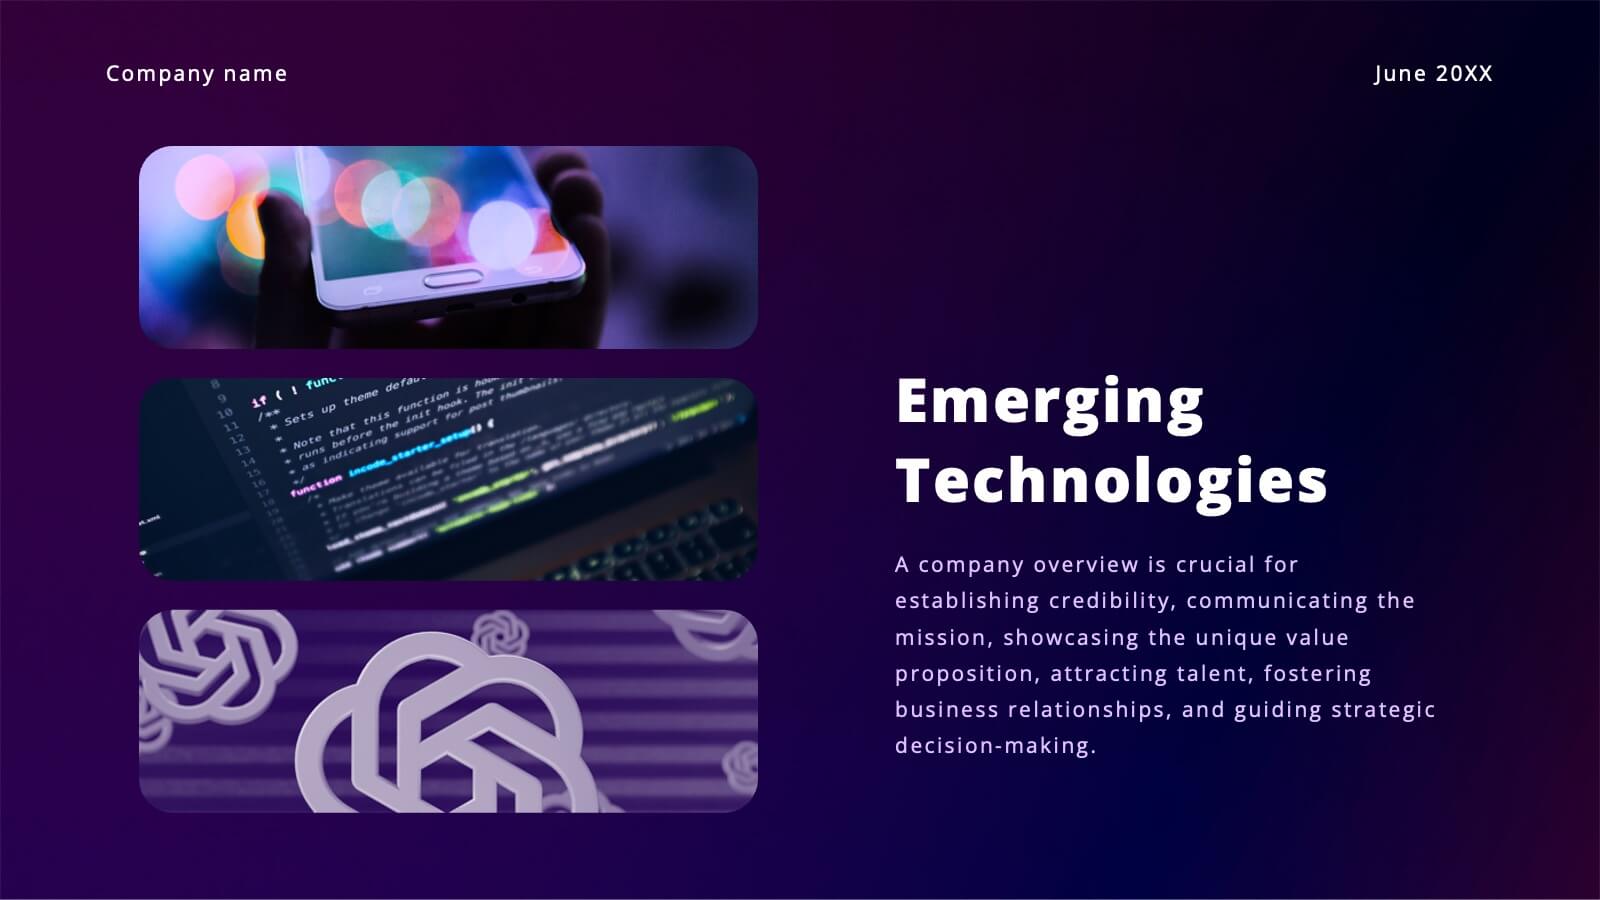
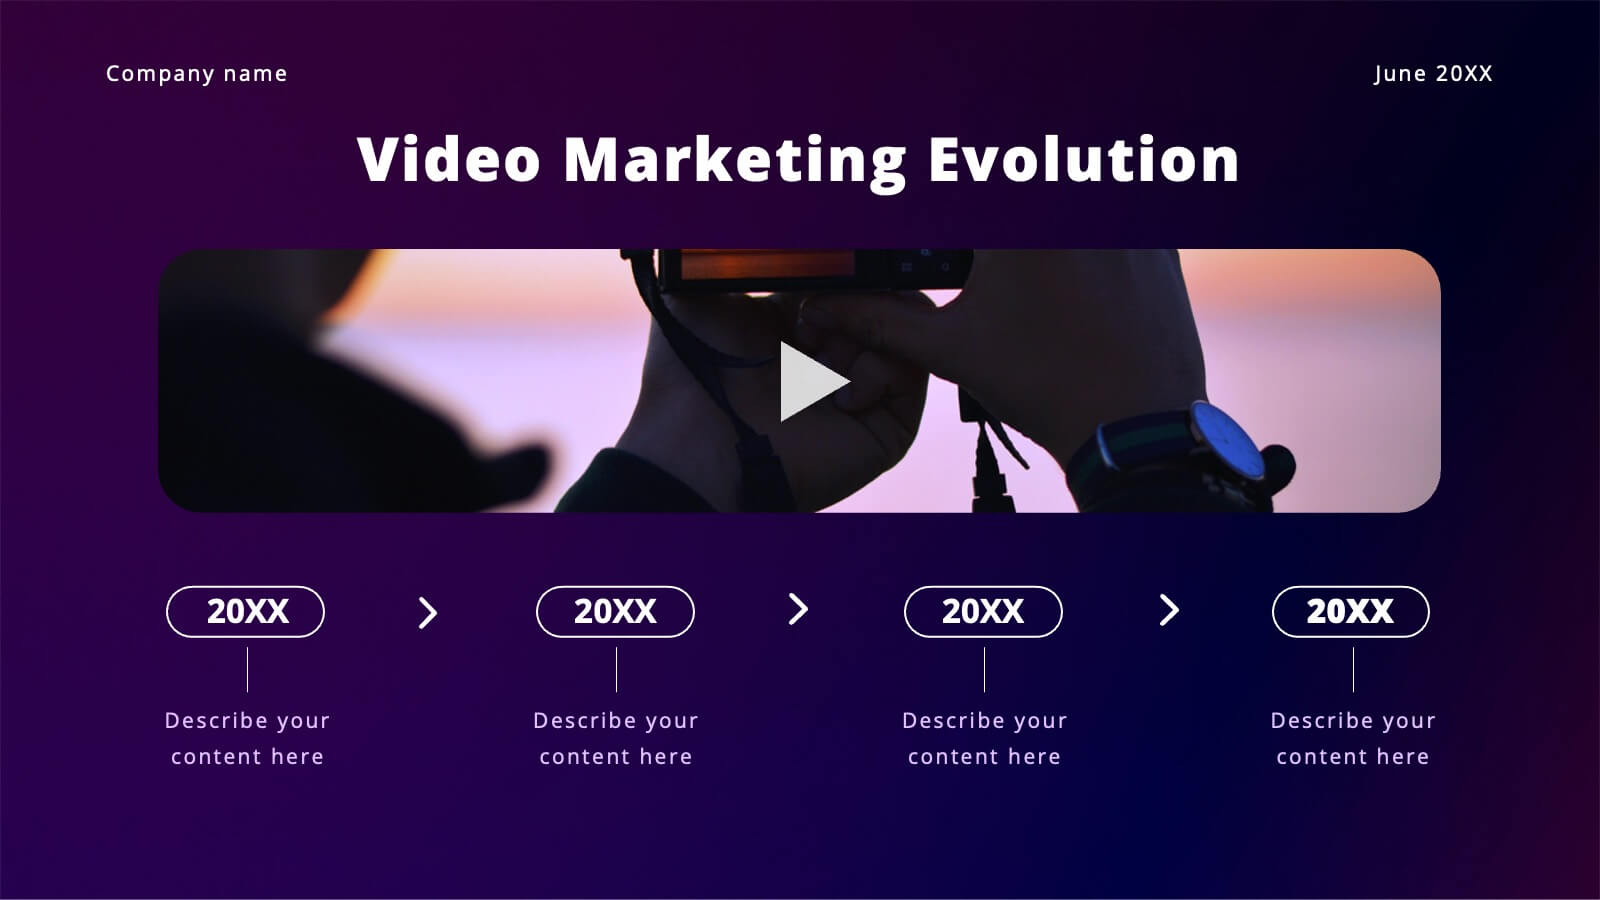
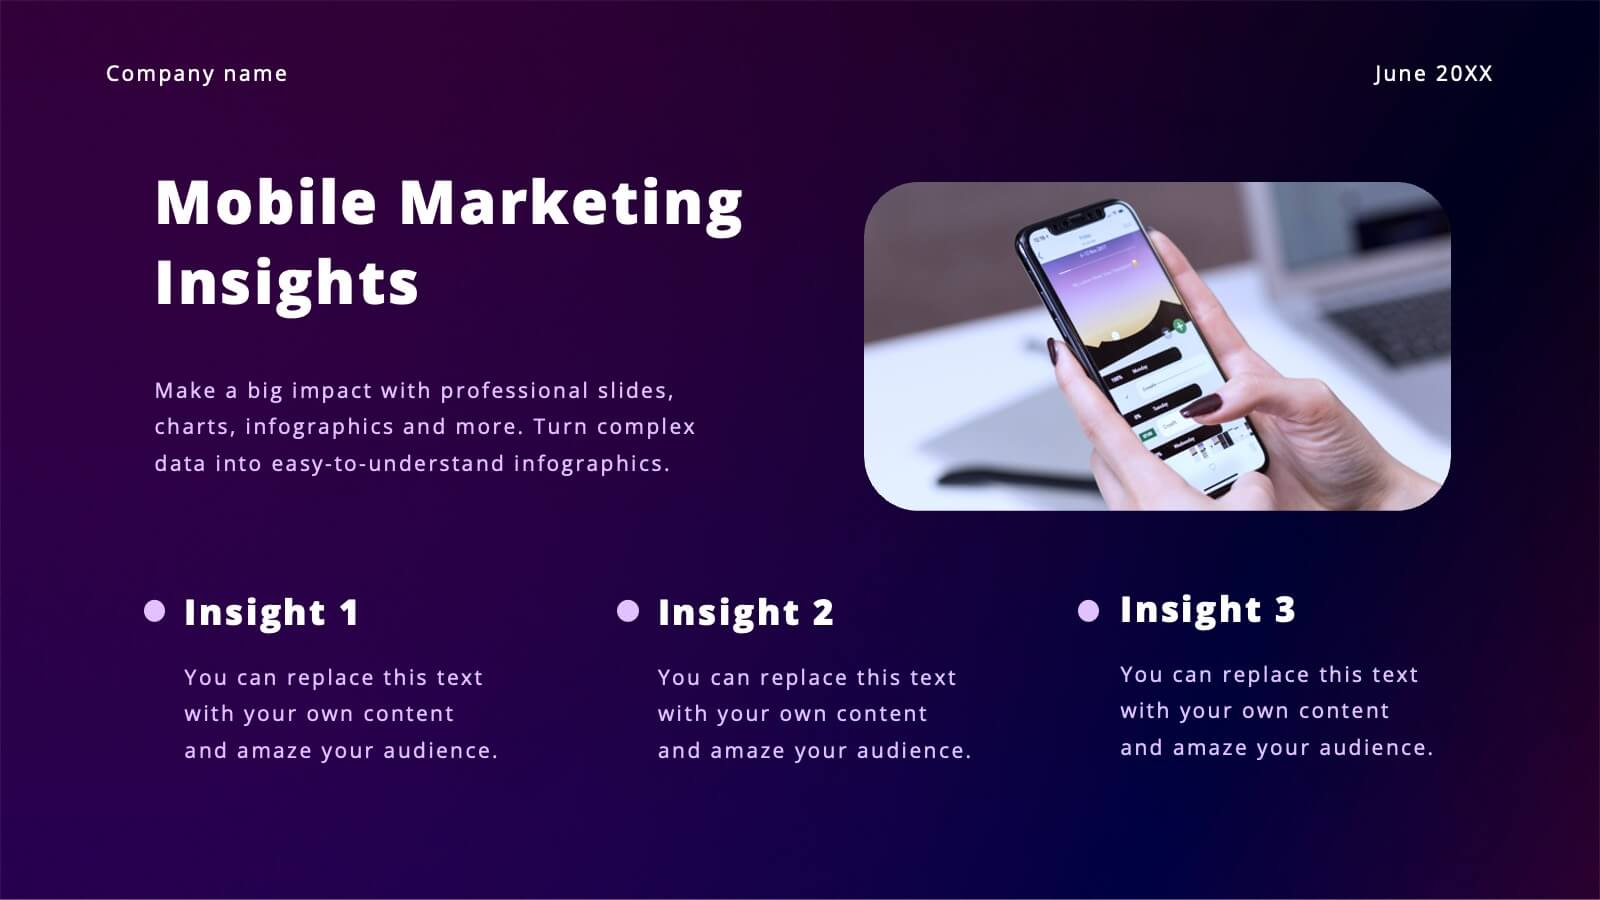
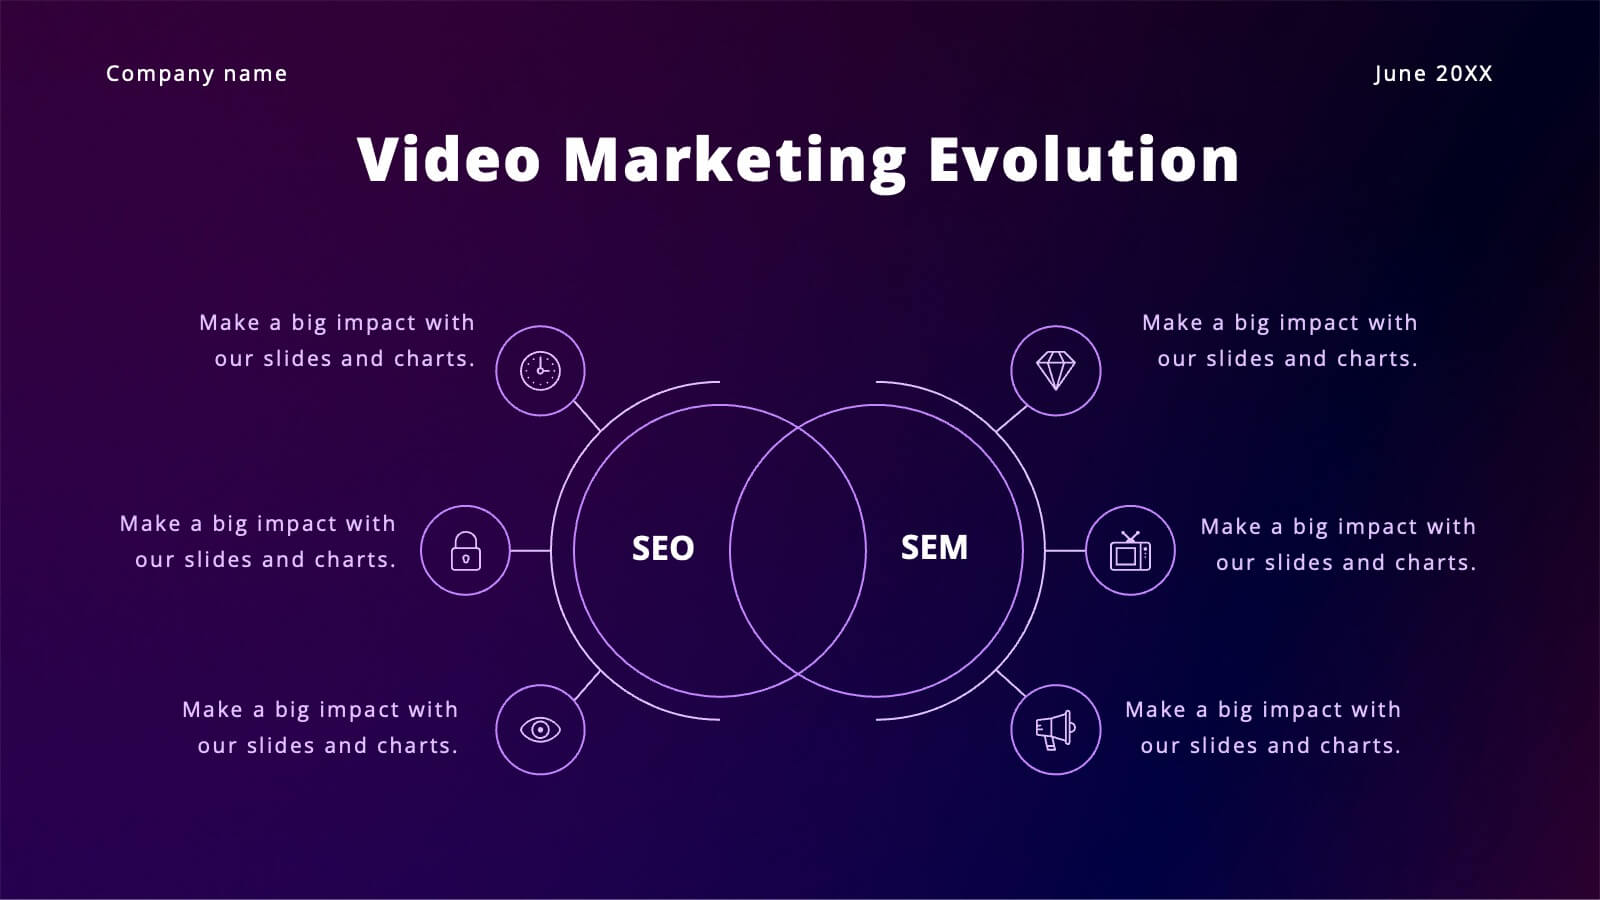
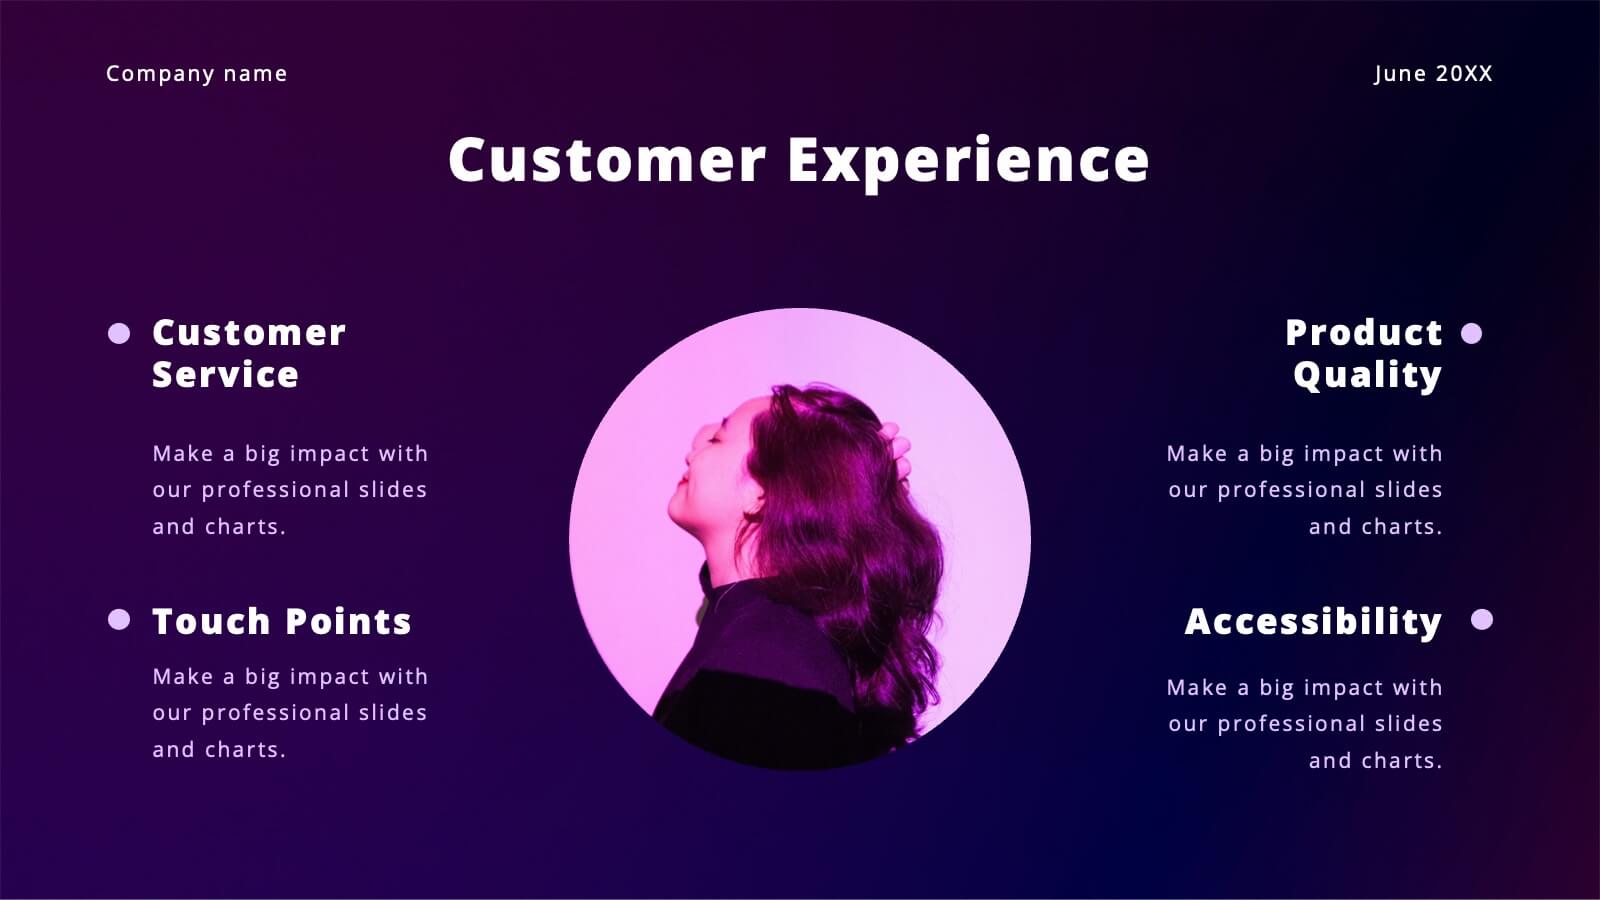
Create an impactful marketing proposal with this vibrant and modern presentation template! Covering key sections such as industry overview, consumer behavior, social media strategies, and emerging technologies, it helps you present your marketing insights with style. Fully customizable and perfect for data-driven marketing plans, this template is compatible with PowerPoint, Keynote, and Google Slides for seamless presentation delivery.


5 slides
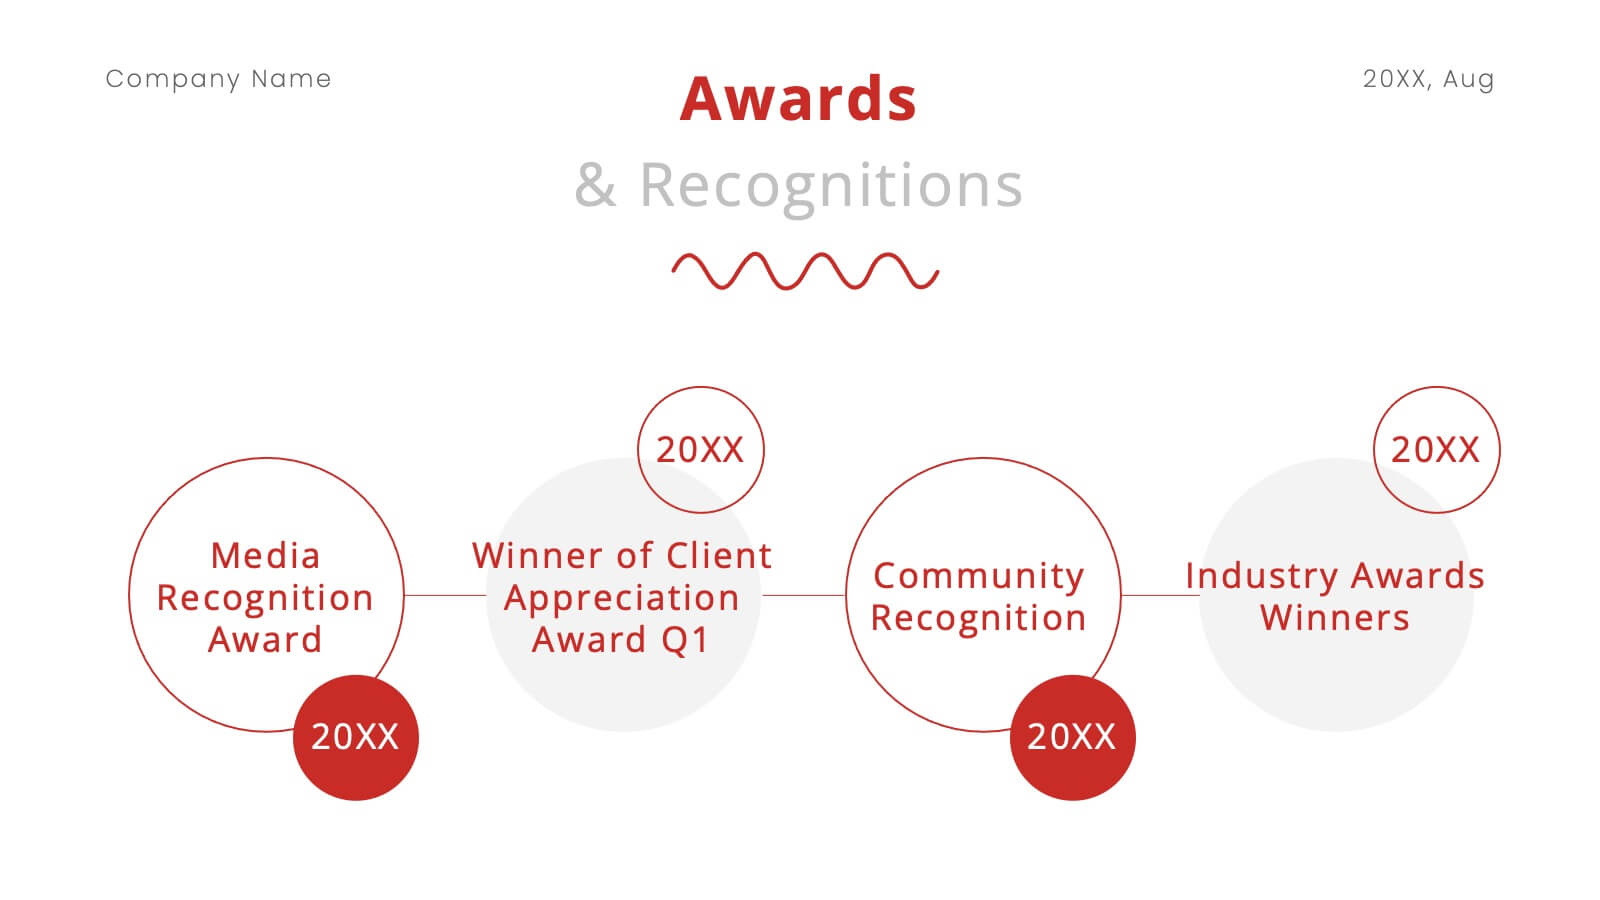
Group Dynamics and Work Roles Presentation
Visualize team roles and responsibilities clearly with the Group Dynamics and Work Roles Presentation. This horizontal timeline layout highlights individual contributions and their position in the workflow, making it ideal for team structure, leadership roles, or project stages. Fully editable in Canva, PowerPoint, or Google Slides for smooth collaboration.

20 slides
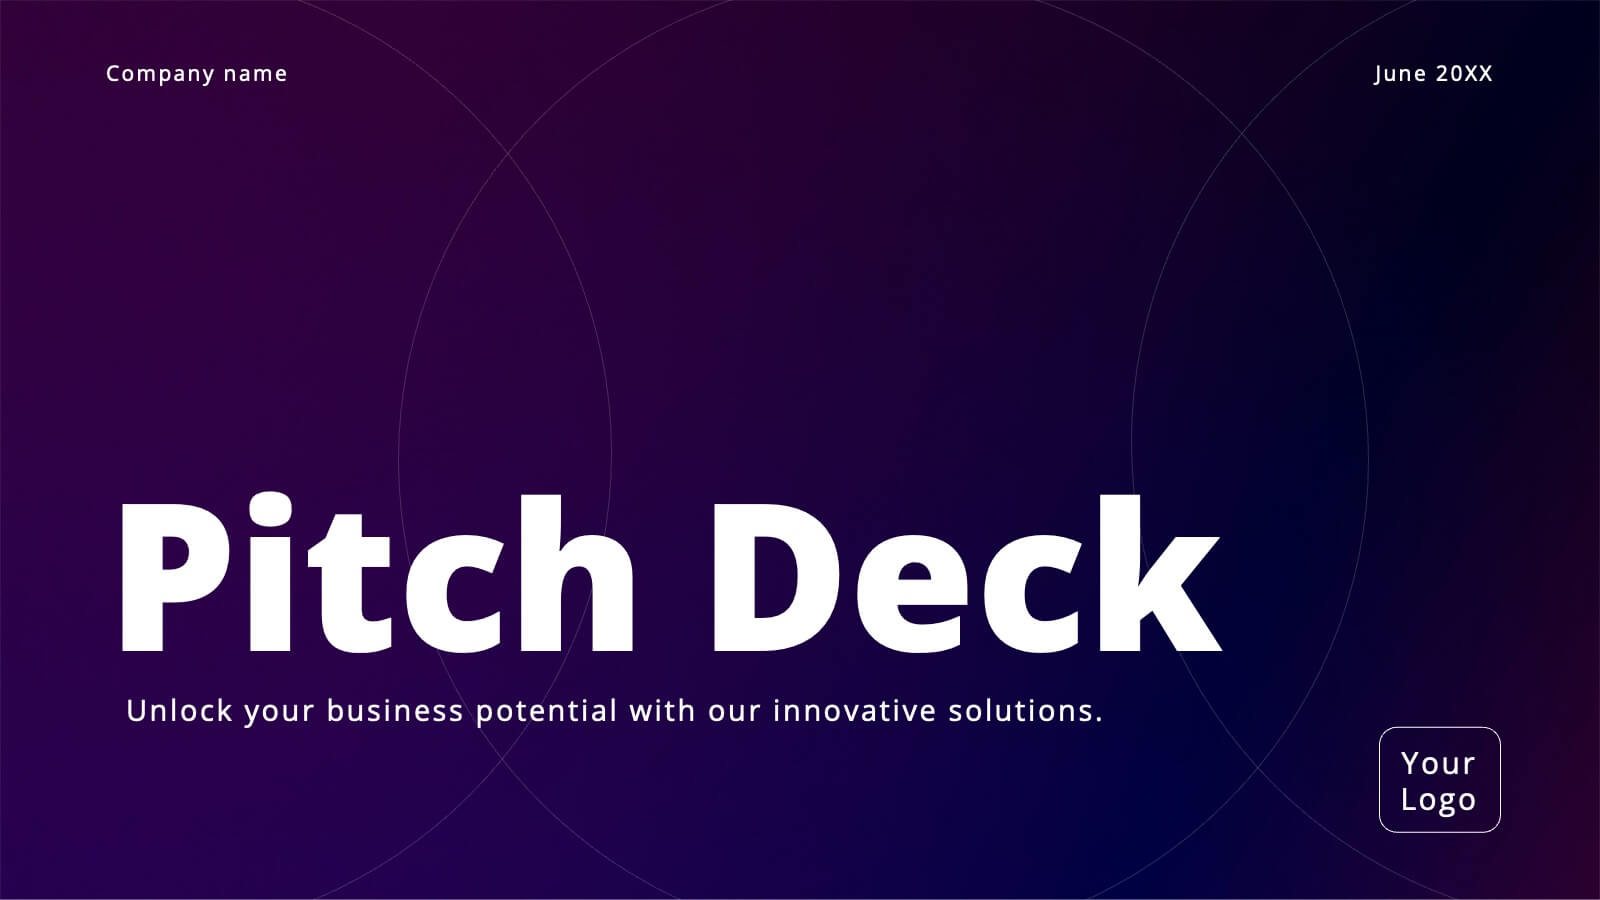
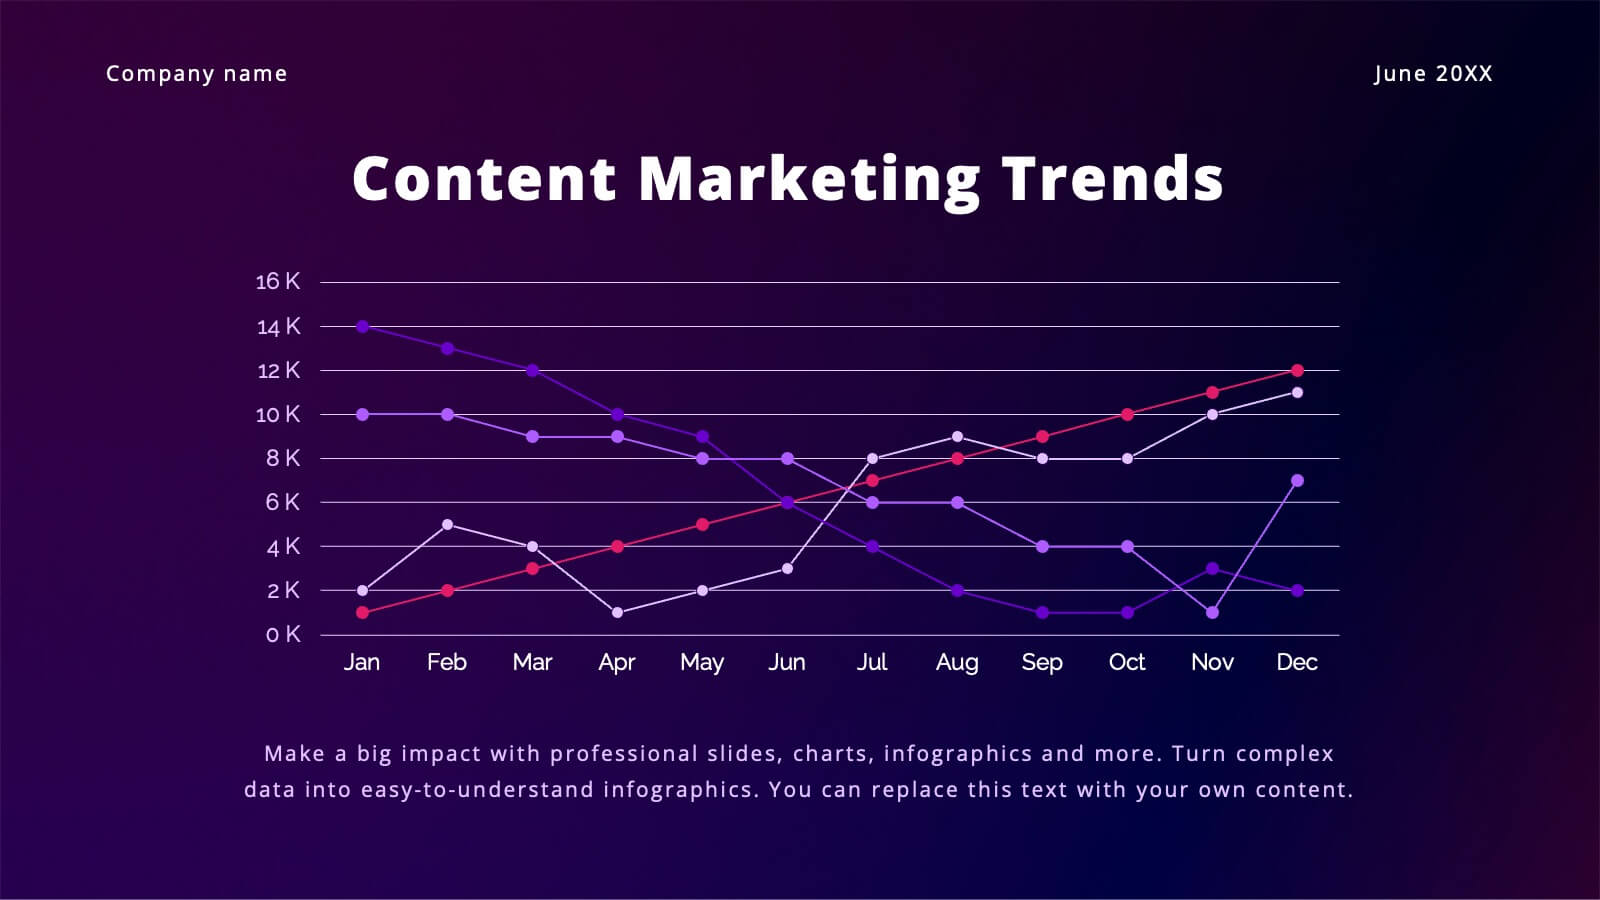
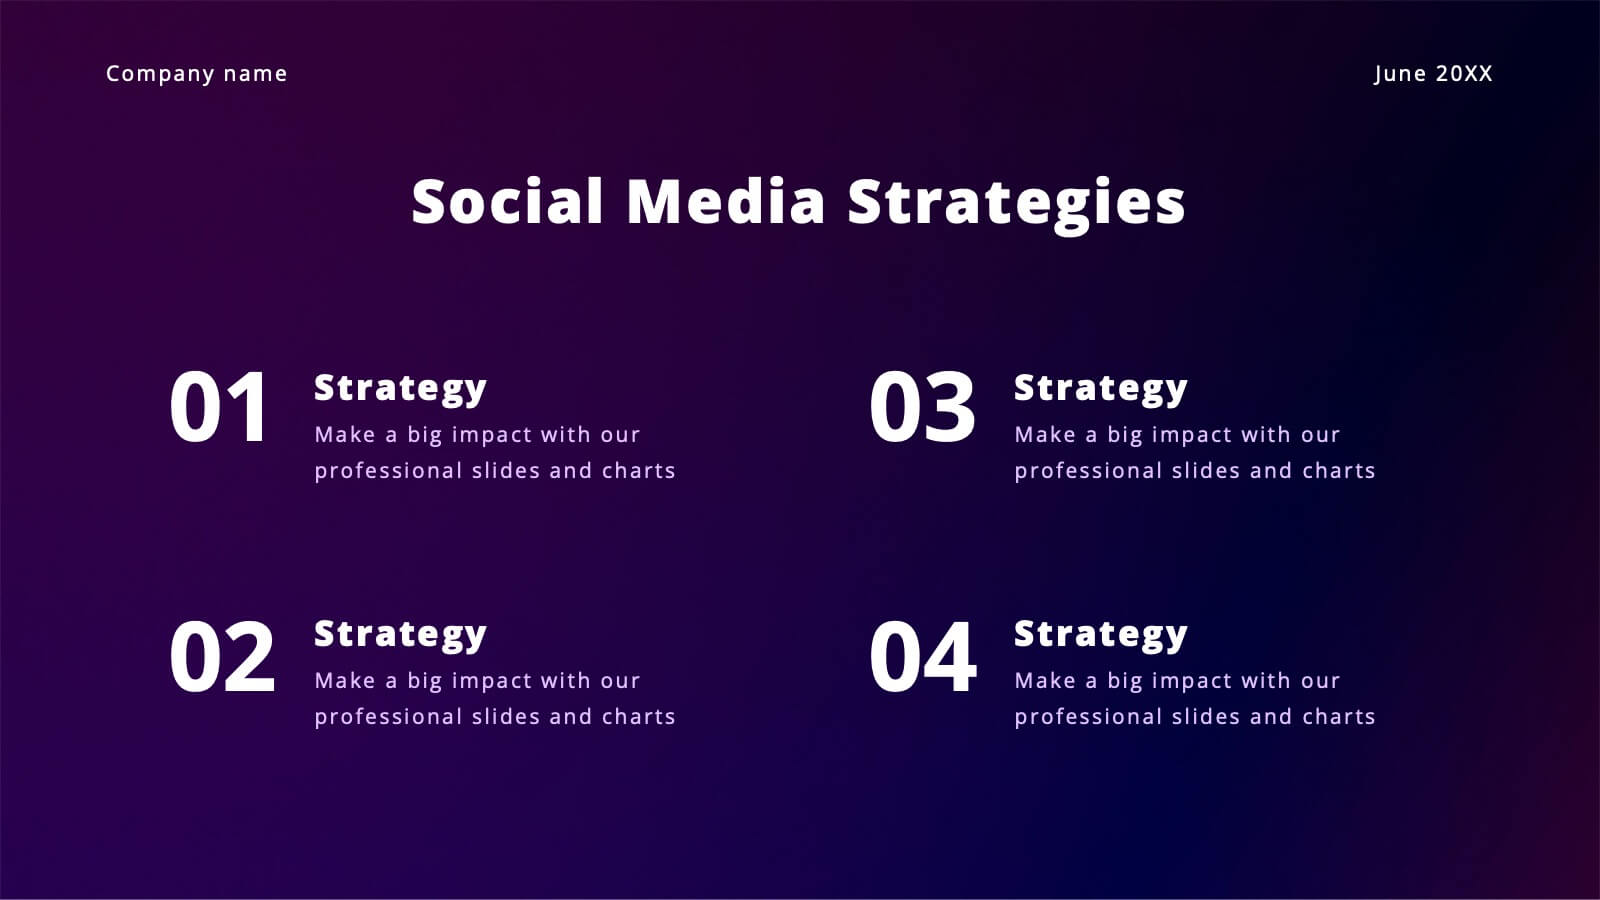
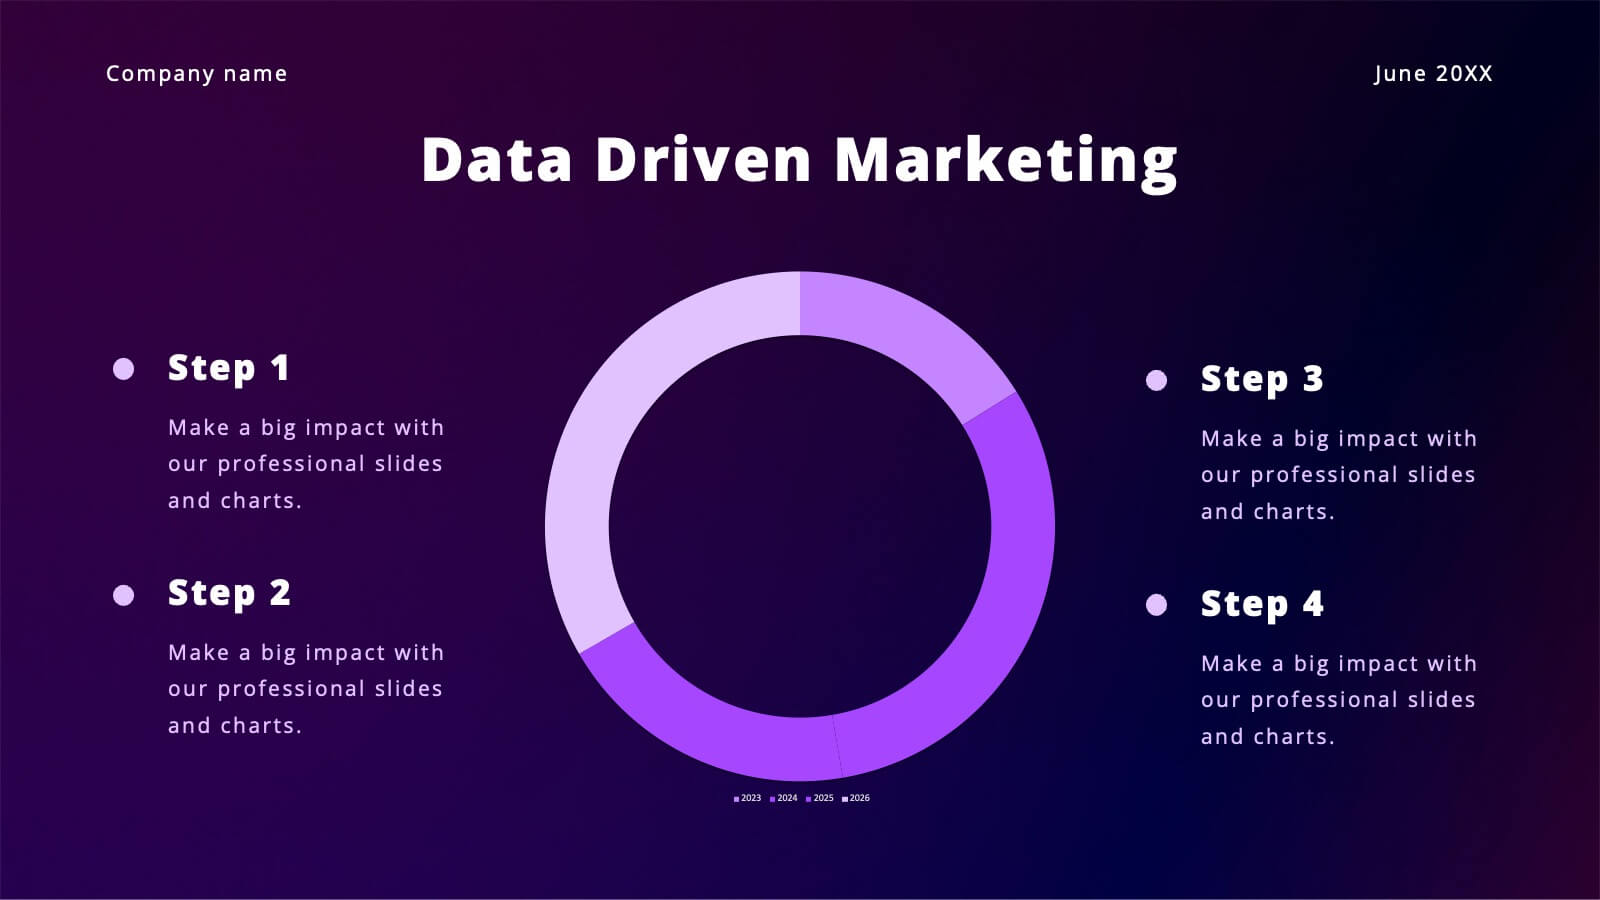
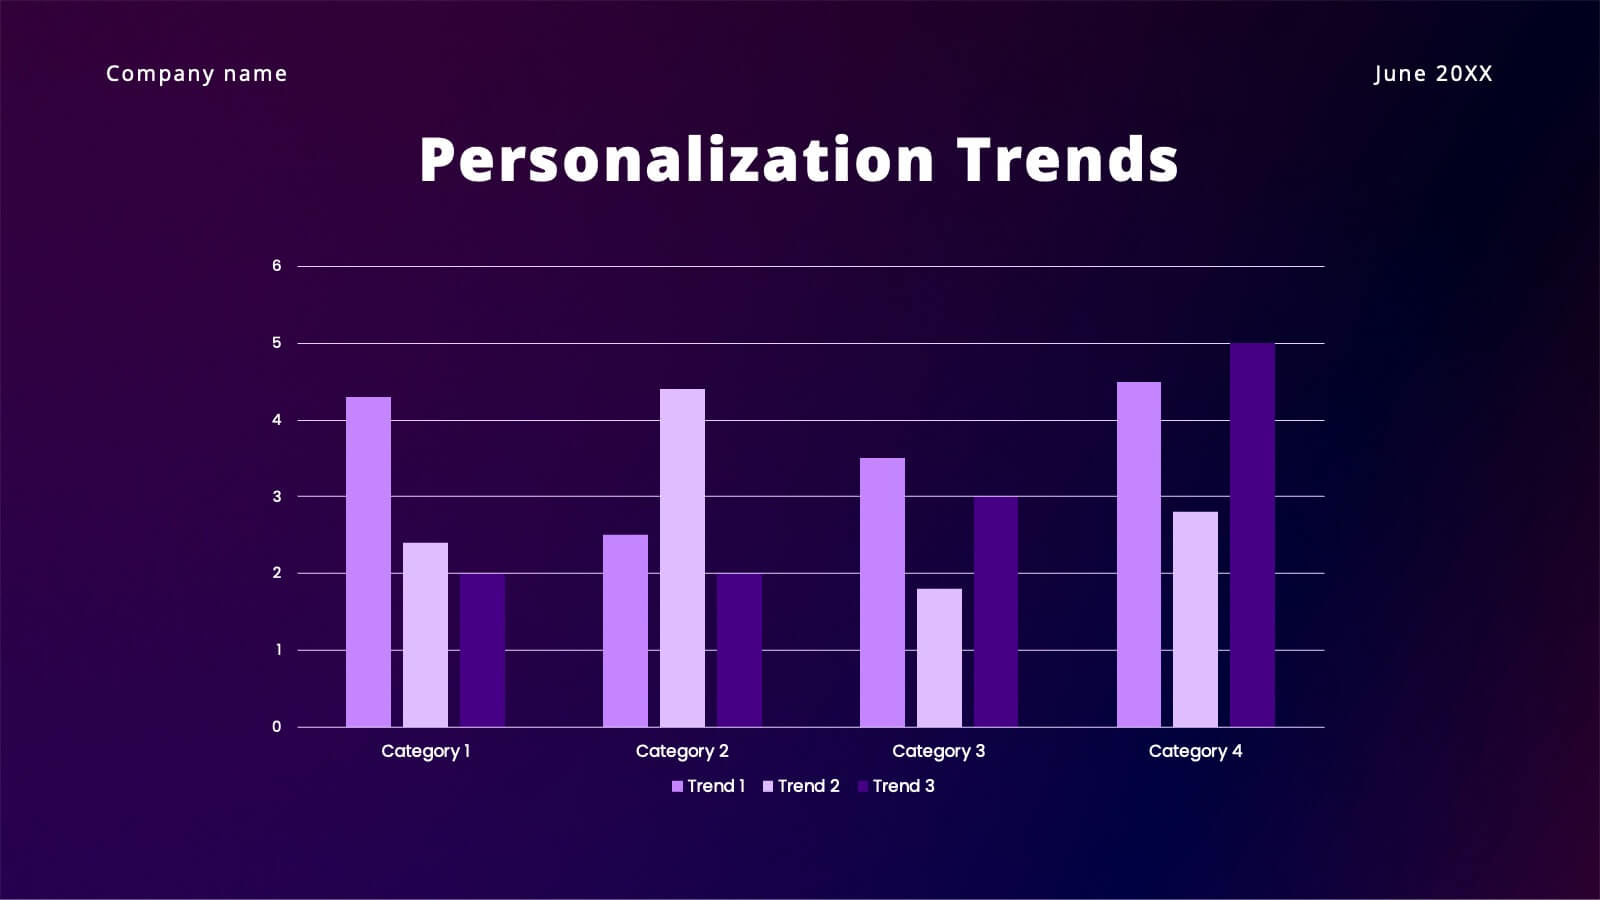
Vibrant Content Marketing Pitch Deck Presentation
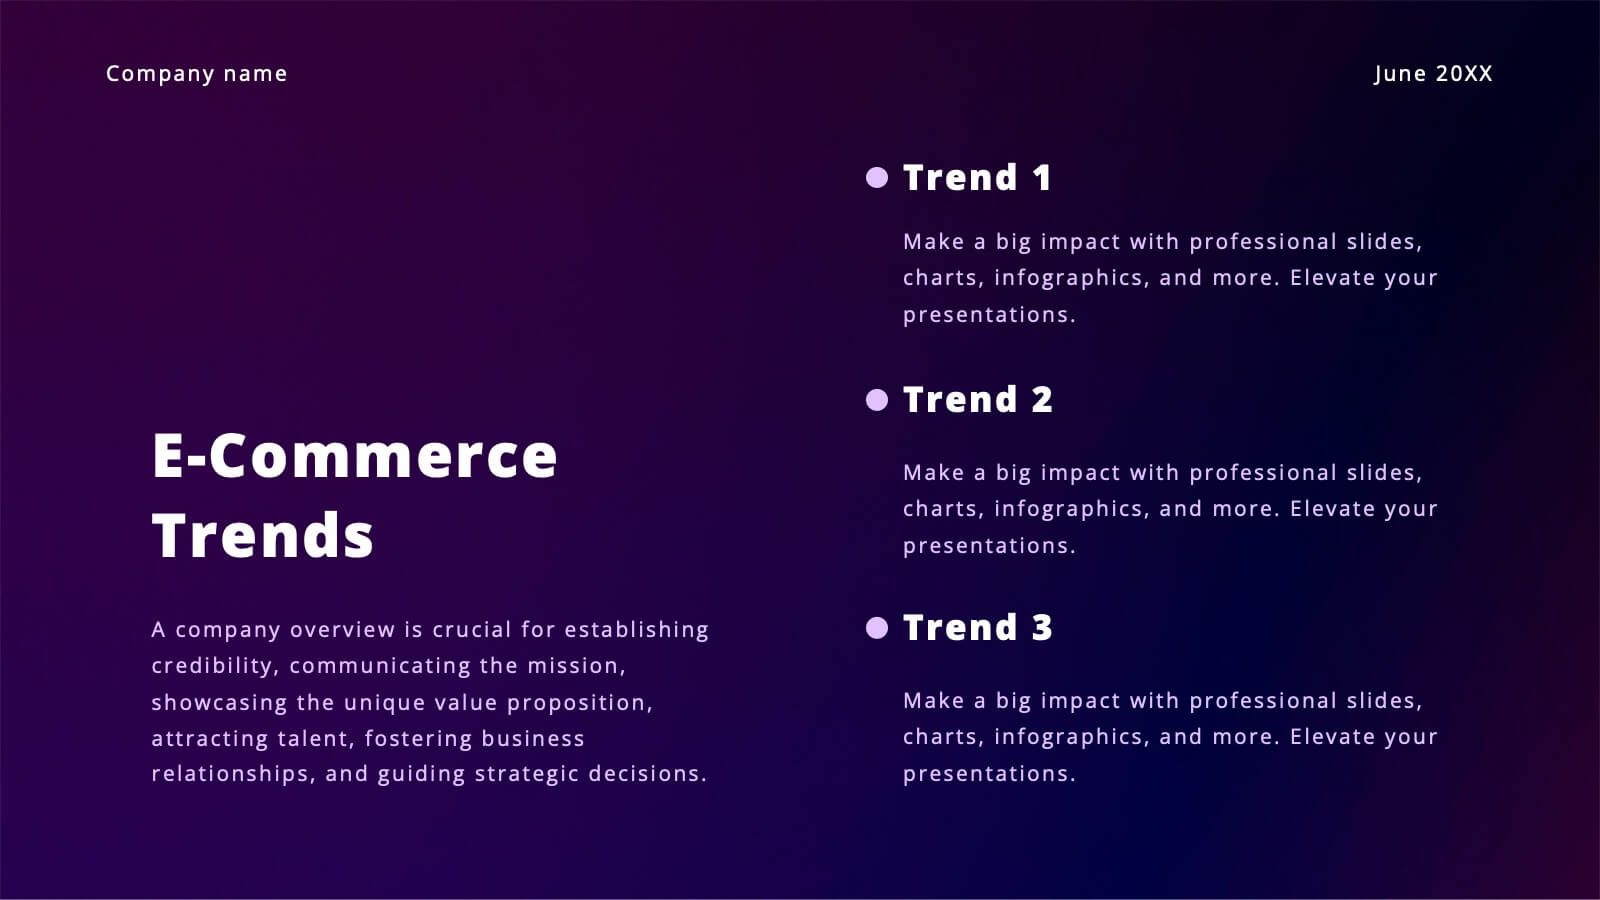
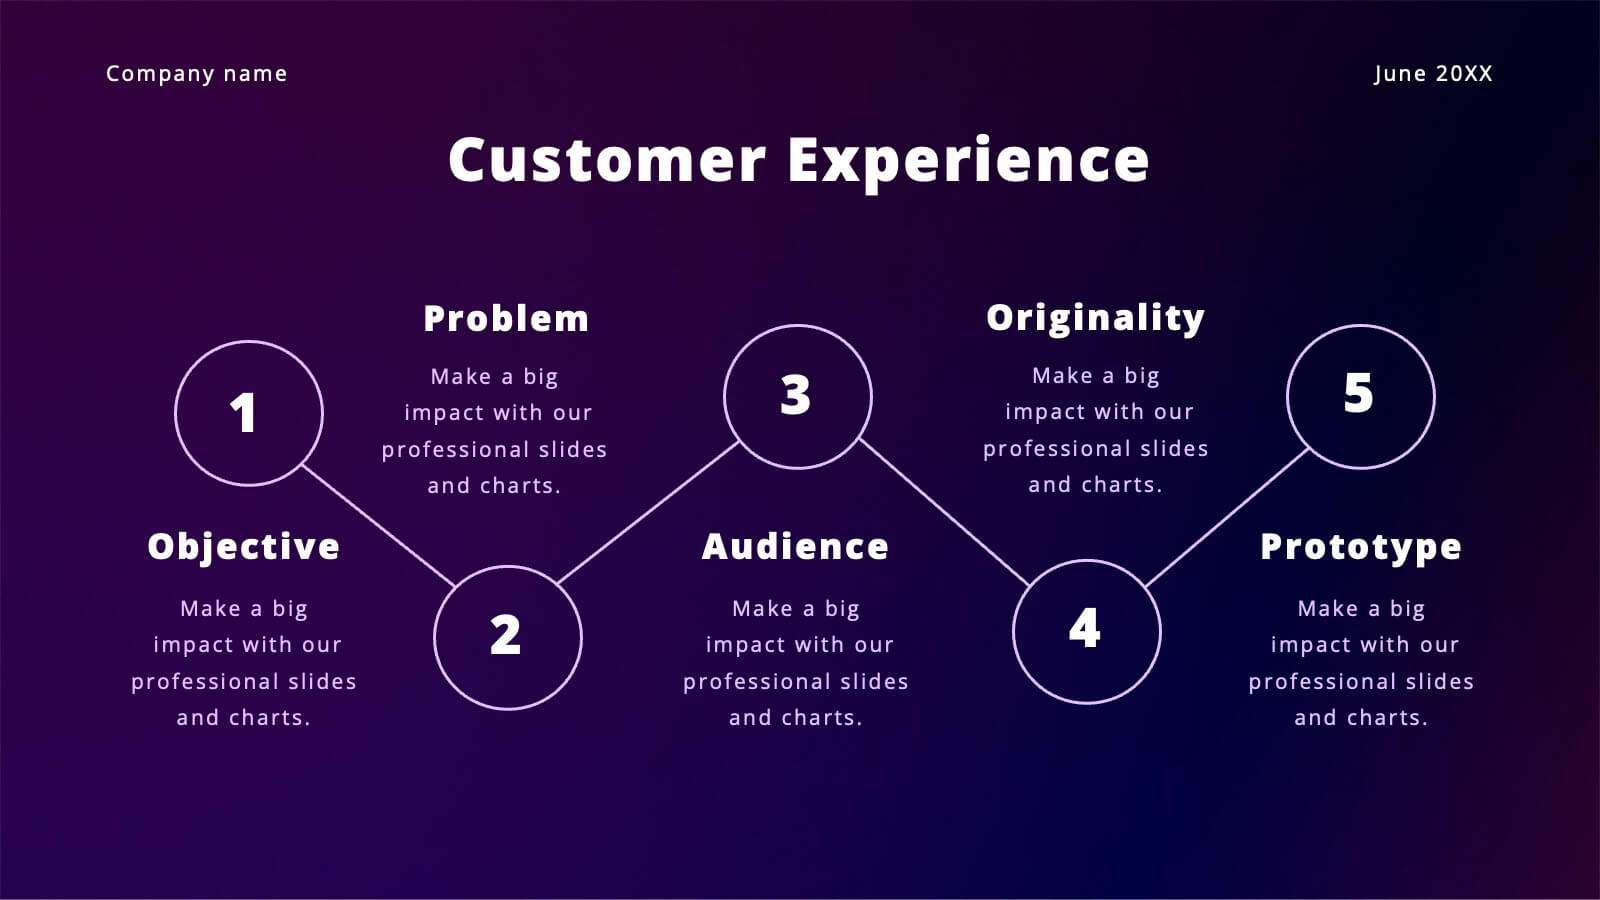
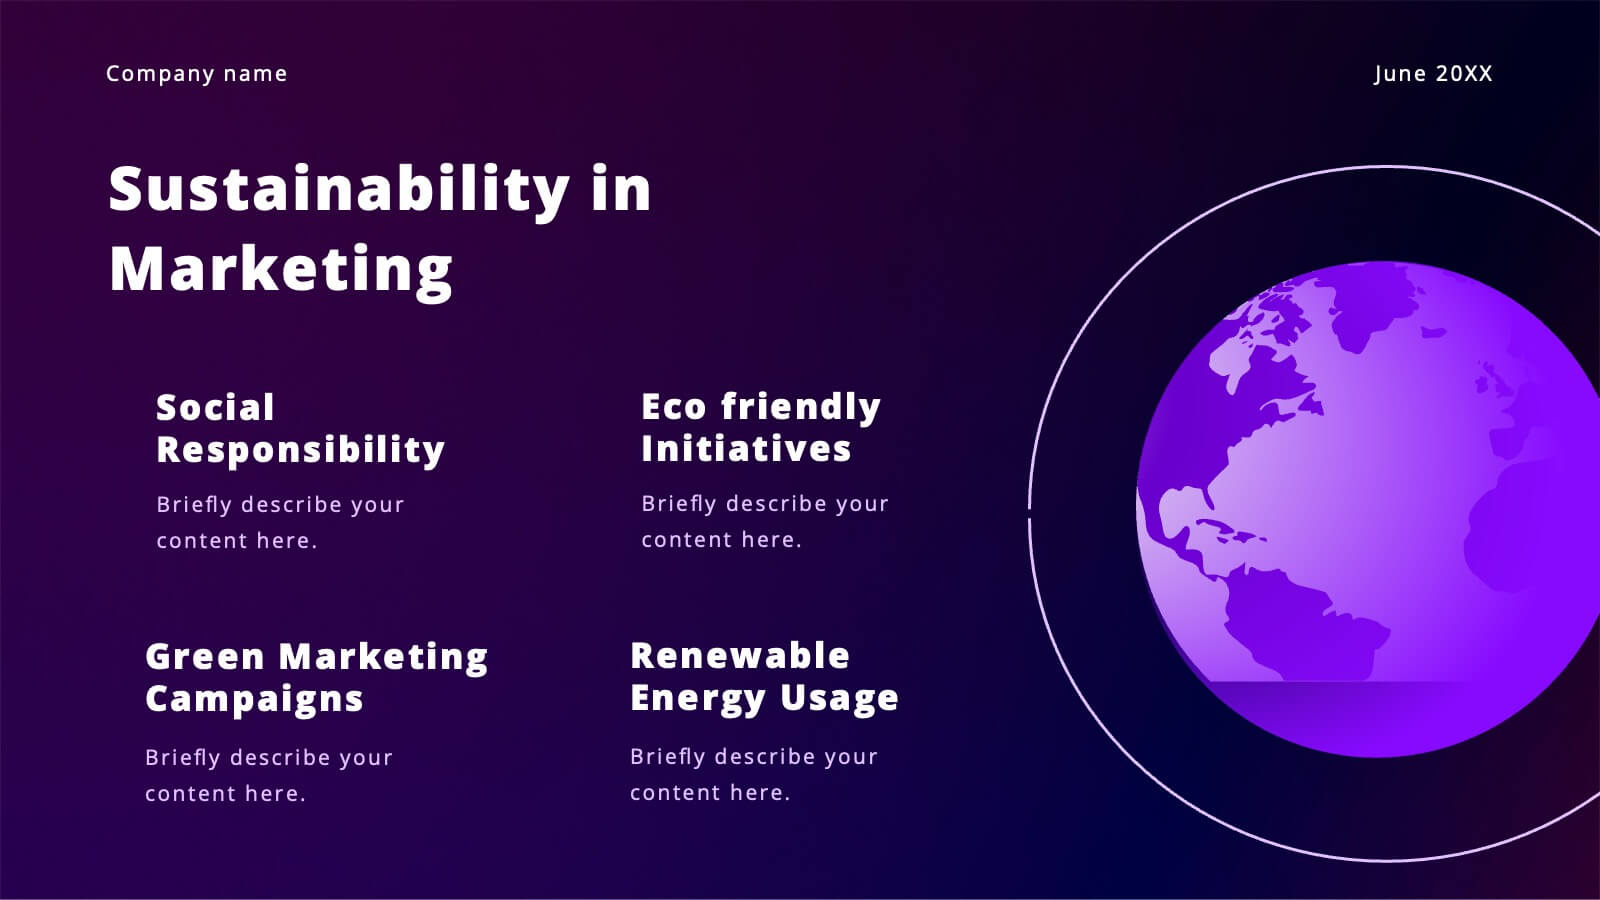
Boost your marketing pitch with this vibrant deck! Covering industry overviews, customer behavior analysis, and emerging technologies, it’s designed to captivate your audience. Highlight social media strategies, data-driven marketing, and e-commerce trends effortlessly. Perfect for presenting a comprehensive marketing plan. Compatible with PowerPoint, Keynote, and Google Slides. Make your next pitch stand out!


2 slides
Creative Brainstorming Infographic Presentation
Spark fresh ideas with a bold, visually rich layout designed to inspire creative thinking and dynamic collaboration. This presentation blends engaging imagery with clear sections that help you organize concepts, map insights, and share innovative solutions effortlessly. Fully compatible with PowerPoint, Keynote, and Google Slides.


6 slides
Agenda on Education Infographic
Our Agenda Slide Templates are thoughtfully designed to facilitate clear and structured presentations for any educational context. Each template features a clean, professional design, making them ideal for delivering complex information in a digestible format. The collection includes various layouts from simple and focused to more detailed and infographic-rich, ensuring that every meeting's purpose is supported visually and functionally. These slides are customizable, allowing users to easily adapt them by changing colors, text, and graphics to suit specific branding needs. They are perfect for enhancing communication in settings that demand clarity and precision, providing all the necessary tools to organize content effectively and engage audiences. They are perfect for enhancing communication in settings that demand clarity and precision, providing all the necessary tools to organize content effectively and engage audiences.


19 slides
Kinetic Sales Forecast Presentation
Forecast your sales with style using this vibrant template! Perfect for detailing company overview, sales process, team, and strategy. Includes sections for case studies, pricing, and future opportunities. Ideal for sales teams to impress stakeholders. Compatible with PowerPoint, Keynote, and Google Slides.


6 slides
Porter's Five Forces Management Infographic
Porter's Five Forces is a framework, that helps businesses understand the attractiveness and profitability of an industry by examining five key forces that shape its competitive landscape. These infographic templates provide a visually appealing and concise overview of Porter's Five Forces framework. They are designed to help businesses and professionals analyze the competitive dynamics of an industry and make informed strategic decisions. By using this to help your audience understand the forces that shape industry competitiveness, they can identify potential threats and opportunities to make informed decisions, and gain a competitive edge.


7 slides
PESTEL Market Analysis Infographic
PESTEL analysis is a crucial framework for comprehending the macro-environmental factors influencing a market. Our PESTEL market analysis infographic, rendered in lively shades of green and orange against a pristine white backdrop, provides a concise yet comprehensive overview of Political, Economic, Social, Technological, Environmental, and Legal aspects. Specifically tailored for business analysts, strategists, and market researchers, this template serves as a vibrant visual guide for dissecting the external market environment. With compatibility spanning PowerPoint, Keynote, and Google Slides, it promises a dynamic addition to your market analysis presentations.


9 slides
Font Alphabet Infographic
Typography plays a pivotal role in conveying mood, tone, and personality. Our font alphabet infographic is a dazzling blend of red, green, yellow, and blue, providing a vibrant showcase of diverse font styles. Each alphabet letter is uniquely stylized, making it an ideal resource for graphic designers, educators, and marketing professionals looking to make a statement. Whether you're teaching the basics of typography or showcasing a brand's versatility, this infographic serves as a visual treat. Seamless integration with PowerPoint, Keynote, and Google Slides ensures you can weave this colorful font journey into any presentation.


3 slides
Workflow Optimization Flow Chart Presentation
Streamline your processes with this Workflow Optimization Flow Chart presentation. Designed to help teams identify inefficiencies, visualize task flows, and improve decision-making. Featuring clearly labeled paths and decision points, it's ideal for process audits, operations planning, or training sessions. Fully editable in PowerPoint, Canva, and Google Slides.


10 slides
Revenue Growth Strategies and Metrics Presentation
Highlight your key success drivers with the Revenue Growth Strategies and Metrics Presentation. This upward arrow-based layout is perfect for showcasing growth phases, financial KPIs, or strategic revenue initiatives. Clean, professional, and fully editable in PowerPoint, Keynote, and Google Slides—ideal for business reviews, sales pitches, and quarterly updates.